Embed Size (px)
Citation preview

An Efficient Portfolio Frontier
of Islamic Banking Financing
Instruments
(Case of Indonesia: 2001-2007)
Paper Presented in
International Workshop in Islamic Economics,
Banking and Finance
Joint Program of Durham University & Kyoto University
July 6th, 2008
Rifki Ismal
School of Government and International Affairs (SGIA)
Durham University
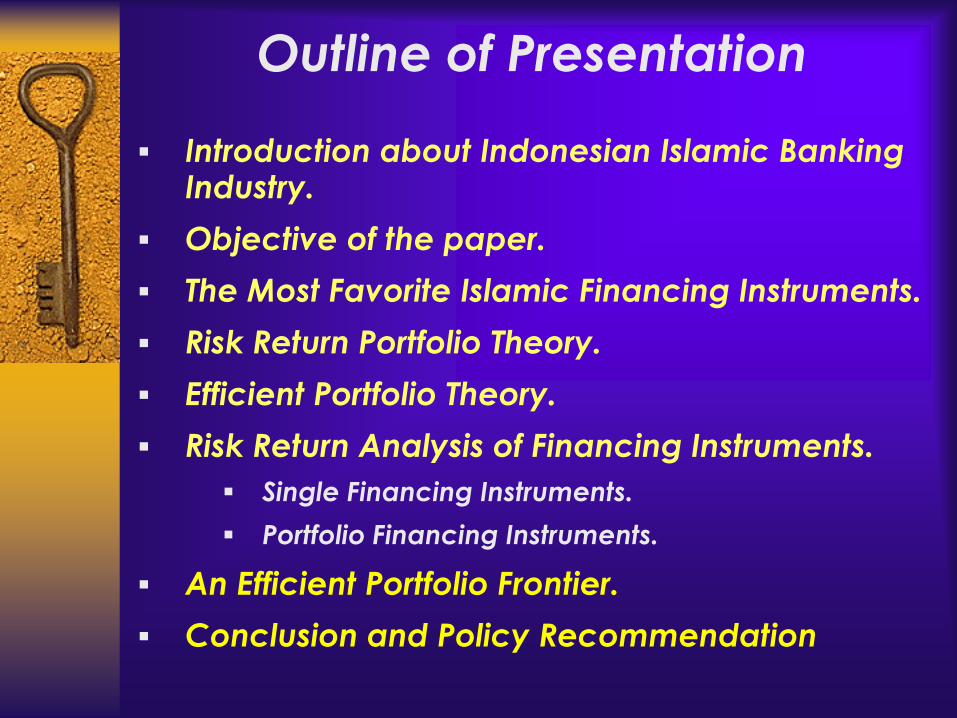
Outline of Presentation
Introduction about Indonesian Islamic Banking Industry.
Objective of the paper.
The Most Favorite Islamic Financing Instruments.
Risk Return Portfolio Theory.
Efficient Portfolio Theory.
Risk Return Analysis of Financing Instruments.
Single Financing Instruments.
Portfolio Financing Instruments.
An Efficient Portfolio Frontier.
Conclusion and Policy Recommendation

Introduction about Indonesian Islamic
Banking Industry
The industry has been growing promisingly since the establishment of the first Islamic bank in 1992.
Up to end of 2007, there are 3 Islamic Banks, 25 Islamic Banking Unit (UUS) and 114 Islamic Rural Banks (BPRS) with total 683 offices.
FDR is between 100%-120% (2001-2007) and NPF is around 2%-4%.
BANKING INDICATORS 2000 2001 2002 2003 2004 2005 2006 2007
Islamic Banks (unit) 2 2 2 2 3 3 3 3
Islamic Banking Units (unit) 3 3 6 8 15 19 20 25
Islamic Rural Banks (unit) 79 81 83 84 88 92 105 114
Total Offices (unit) 146 182 229 337 443 550 567 683
Total Asset (trillion Rp) 1.79 2.72 4.05 7.86 15.33 20.88 26.72 36.53
Total Financing (trillion Rp) 1.27 2.05 3.28 5.53 11.49 15.23 19.53 27.94
Total Deposit (trillion Rp) 1.03 1.81 2.92 5.72 11.86 15.58 20.67 25.65

Objective of The Paper
This paper tries to analyze the risk and return of
the Islamic banking portfolio in order to construct
an efficient portfolio-financing that will give high
return but low financing risk.
The paper firstly finds out expected return of the
financing instruments, variance of instruments
etc under risk and return analysis.
Complemented with the correlation analysis
among instruments, it tries to minimize financing
risk and maximize portfolio’s return by
constructing an efficient portfolio frontier
between 2001-2007 period.

The Most Favorite Islamic Financing
Instruments
3 classical types of financing: (i) Equity financing, (ii) Debt financing; and (iii) Service financing.
Indonesia employs Musharakah and Mudarabah(equity financing); Murabahah, Bay Salam, Bay Istishna, Qard (debt financing); and Wakalah, Hiwalah, Kafalah (services). And Wadiah current account; Wadiah/Mudarabah saving deposit and Mudarabah time deposit.
During 2001-2007 Murabahah counts 68% of total financing, Mudarabah (19%), Musharakah (8%) and Bay Istisna (4%). Others like Bay Salam, Ijarah, Qard, Wakalah, etc are very small.
Therefore, the paper focuses to the four abovewithout ignoring that there are other insignificant instruments existing in the industry.

Risk Return Portfolio Theory
Used to analyse risk and return of an individual or group of
instruments by looking at their actual and expected rate of
return, probability of occurrence and market share.
N
i
iii rpRE1
)(
)(.....)()()()( 332211 nnp REwREwREwREwRE
Expected Return of Single Instrument
Exp (R) of > 1 Instrument
The difference between expected return and its actual one depicts the
variance of the instrument (σ) .
n
i
n
j
jijip wwRVar1 1
,)(
N
i
inni
i j
jijii RErpRErpwwRVar1
22
11
1
1
1
1
)]([(......)]([,)(
General Formula of Variance
Var of 1 instrument

Risk Return Portfolio Theory
It is determined by individual variance, weight & correlation value
Var of 3 insts
The low value of portfolio variance should indicate a low risk of the
combination although, individually, instrument might have a high
risk. Thus, we evaluate the instrument individually and in a group as
well.
Var of 2 insts),(2,)( 21212
2
21
2
1
2
1
2
1
rrCovwwwwwwRVari j
jijip
),(2),(2
),(2,)(
32323131
21213
2
32
2
21
2
1
3
1
3
1
rrCovwwrrCovww
rrCovwwwwwwwRVari j
jijip
),(2
),(2),(2),(2),(2
),(2,)(
4343
4242323241413131
21214
2
43
2
32
2
21
2
1
4
1
4
1
rrCovww
rrCovwwrrCovwwrrCovwwrrCovww
rrCovwwwwwwwwRVari j
jijip
Var of 4 insts
21
212,1
),(
rrCov Coefficient of correlation

Efficient Portfolio Theory
Subject to &
An efficient portfolio frontier is the locus of all convex combination of
any two efficient portfolios. If we decide two prospective financing
instruments: x and y such that x = (x1,…,xn) and y = (y1, …..,yn), and γ
is a constant, then a set of efficient portfolio Z is :
An efficient portfolio is the portfolio of risky assets that gives the lowest
variance of return of all portfolios having the optimal expected return.
Then, we set an efficient portfolio p by solving :
n
i
n
j
pjiji RVarwwMin1 1
, )(
n
i
pii RErw1
)(
n
i
iw1
1
Z = γx + (1- γ)y =
nn yx
yx
y
)1(
...
)1(
)1(x
22
11
If we name the efficient portfolio frontier of x and y as {E(Rx), σ2x} and
{E(Ry), σ2y} and if Z = γx + (1- γ)y then the variance and standard
deviation of the efficient portfolio frontier will be :
E(Rz) = γE(Rx) + (1-γ)E(Ry) σ2
z = γ2 σ2x + (1- γ)2σ2y + 2γ(1- γ)
Cov(x,y)

Risk Return Analysis of Islamic Financing
Instruments (Single Instrument)
Average annual rate of actual return (RoR) of each instrument is
depicted below and later according to the assumption above, it will be
used as a proxy to calculate the expected rate of return
Year I II III IV
2001 0.03 0.19 0.54 0.07
2002 0.01 0.10 0.45 0.05
2003 0.01 0.06 0.31 0.02
2004 0.07 0.11 0.41 0.02
2005 0.08 0.13 0.40 0.01
2006 0.08 0.13 0.43 0.01
2007 0.12 0.16 0.48 0.01
I = Musharakah; II = Mudarabah; III = Murabahah; IV = Istisna
Murabahah is the highest among other instruments. The average annual return of it is 0.43%, greater than Mudarabah (0.13%), Musharakah (0.06%) and Istisna (0.03%)
Rate of Return
Interval I II III IV
=< 0.02 42.35 5.88 1.18 65.88
0.03 - 0.05 17.65 14.12 1.18 18.82
0.06 - 0.08 11.76 21.18 4.71 9.41
0.09 - 0.11 9.41 11.76 1.18 4.71
0.12 =< 18.82 47.06 91.76 1.18
Probability of Occurance
I = Musharakah; II = Mudarabah; III = Murabahah; IV = Istisna
More than 0.12% RoR of
Murabahah has probability of
occurrence 91.7% and
Mudarabah for 47%. But, less
than 0.02% RoR of Musharakah
tends to occur with 42.3% and
Istishna for 65.88%.

Risk Return Analysis of Islamic Financing
Instruments (Single Instrument)
The previous result confirms the tendency of the banks to concentrate
most of their financing on Murabahah and Mudarabah. However,
developing Musharakah and Istishna is important especially Musharakah
could potentially produce higher profit.
Then, we get expected RoR and we can compare it with the actual RoR
of every instrument.
0.000
0.050
0.100
0.150
0.200
0.250
0.300
0.350
0.400
0.450
0.500
Dec-0
0
Jun-0
1
Dec-0
1
Jun-0
2
Dec-0
2
Jun-0
3
Dec-0
3
Jun-0
4
Dec-0
4
Jun-0
5
Dec-0
5
Jun-0
6
Dec-0
6
Jun-0
7
Dec-0
7
Actual RoR
Expected RoR
%
0.000
0.200
0.400
0.600
0.800
1.000
1.200
1.400
1.600
1.800
Dec
-00
Jun-
01
Dec
-01
Jun-
02
Dec
-02
Jun-
03
Dec
-03
Jun-
04
Dec
-04
Jun-
05
Dec
-05
Jun-
06
Dec
-06
Jun-
07
Dec
-07
Actual RoR
Expected RoR
%
Actual & Expected RoR Murabahah
Actual & Expected RoR Mudarabah

Risk Return Analysis of Islamic Financing
Instruments (Single Instrument)
0.000
0.050
0.100
0.150
0.200
0.250
Dec-0
0
Jun-0
1
Dec-0
1
Jun-0
2
Dec-0
2
Jun-0
3
Dec-0
3
Jun-0
4
Dec-0
4
Jun-0
5
Dec-0
5
Jun-0
6
Dec-0
6
Jun-0
7
Dec-0
7
Actual RoR
Expected RoR
%
0.000
0.020
0.040
0.060
0.080
0.100
0.120
0.140
0.160
0.180
0.200
Dec-0
0
Jun-0
1
Dec-0
1
Jun-0
2
Dec-0
2
Jun-0
3
Dec-0
3
Jun-0
4
Dec-0
4
Jun-0
5
Dec-0
5
Jun-0
6
Dec-0
6
Jun-0
7
Dec-0
7
Actual RoR
Expected RoR
%
Actual & Expected RoR Musharakah
Actual & Expected RoR
Istishna
Flow of business and realization of return is pooled and settled in the last month of the year.
With regard to managing liquidity, this pattern depicts cash inflow for banks from their depositors.
Murabahah’s RoR is well predicted compared to others.

Risk Return Analysis of Islamic Financing
Instruments (Single Instrument)
Variance of Individual Instrument
All of instruments have been showing an increasing trend of variance since 2003 especially Mudarabah, except Istishna.
It indicates that financing instrument tends to be more risky year by year unexceptionally Murabahah and Mudarabah. Some internal and external economic problems explain this reality.
Intensive monitoring of the mostly occupied instruments and developing less attractive one (Istishna) should be considered.
Year I II III IV
2001 0.00032 0.00518 0.00285 0.00176
2002 0.00003 0.00123 0.00191 0.00053
2003 0.00004 0.00050 0.00064 0.00013
2004 0.00092 0.00159 0.00182 0.00011
2005 0.00094 0.00208 0.00146 0.00002
2006 0.00099 0.00248 0.00178 0.00001
2007 0.00198 0.00358 0.00170 0.00001
I = Musharakah; II = Mudarabah; III = Murabahah; IV = Istisna

Risk Return Analysis of Islamic Financing
Instruments (2 Instruments)Firstly, we calculate weight from market share of instrument as
requirement to construct expected RoR of a portfolio (table below).
Murabahah and Mudarabah dominates the industry so gaining the bigger weight in the portfolio.
Plotting weight to each
instrument. On average
expected RoR with weight of
Murabahah is 0.26% whilst
Mudarabah is 0.01%.
Year I II III IV
2001 0.03 0.24 0.65 0.08
2002 0.02 0.16 0.74 0.08
2003 0.03 0.15 0.75 0.06
2004 0.10 0.18 0.68 0.04
2005 0.12 0.20 0.65 0.02
2006 0.12 0.21 0.65 0.02
2007 0.15 0.21 0.63 0.01
I = Musharakah; II = Mudarabah; III = Murabahah; IV = Istisna
Year I II III IV Total
2001 0.0002 0.0202 0.3196 0.0004 0.3404
2002 0.0001 0.0058 0.3001 0.0006 0.3067
2003 0.0002 0.0017 0.2129 0.0005 0.2154
2004 0.0010 0.0068 0.2502 0.0003 0.2583
2005 0.0015 0.0097 0.2365 0.0002 0.2478
2006 0.0016 0.0113 0.2548 0.0001 0.2678
2007 0.0031 0.0144 0.2792 0.0001 0.2968
I = Musharakah; II = Mudarabah; III = Murabahah; IV = Istisna

Risk Return Analysis of Islamic Financing
Instruments (2 Instruments)
Finally, we end up with portfolio of 2 instruments (table below).
Year I & II I & III I & IV II & III II & IV III & IV
2001 0.0003 0.0015 0.0000 0.0178 0.0006 0.0034
2002 0.0000 0.0011 0.0000 0.0042 0.0001 0.0017
2003 0.0000 0.0004 0.0000 0.0008 0.0000 0.0004
2004 0.0002 0.0022 0.0000 0.0044 0.0001 0.0010
2005 0.0002 0.0019 0.0000 0.0040 0.0001 0.0007
2006 0.0002 0.0021 0.0000 0.0046 0.0001 0.0008
2007 0.0003 0.0015 0.0000 0.0023 0.0002 0.0007
I = Musharakah; II = Mudarabah; III = Murabahah; IV = Istisna
Mudarabah that has the highest individual variance does not show the high variance if being combined with other instruments (except Murabahah).
Whatever partner of Murabahah, it produces high variance especially if Murabahah is combined with Mudarabah (4th column).
Combination of Istishna and Musharakah does not cause any significant variance (risk of financing).

Risk Return Analysis of Islamic Financing
Instruments (2 Instruments)Following portfolio of 2 instruments, coefficient of correlation
confirms other facts (table below) :
Strong correlation happens between (1) Murabahah and Musharakah; (2) Murabahah and Mudarabah; and (3) Murabahah and Istisna.
If a bank takes for example portfolio financing of only two instruments that one of them is Murabahah, the result or performance of Murabahah will strongly determine the result of the whole portfolio.
If a bank makes a portfolio of financing that includes Mudarabah, the result or performance of the portfolio will be shared between Mudarabah and its partner instrument .
Year I & II I & III I & IV II & III II & IV III & IV
2001 1.6287 6.9426 1.1874 13.4137 2.0912 10.0027
2002 1.6486 6.6210 1.1503 8.4875 1.4594 5.8201
2003 0.6647 2.6941 0.3083 2.9559 0.4260 1.8928
2004 2.0957 7.2740 1.1520 8.5298 1.3460 4.6709
2005 1.8671 6.4105 1.8200 7.2316 2.0500 7.0765
2006 1.6030 6.1101 1.8653 6.6014 2.0216 7.6903
2007 0.5408 2.2729 0.6667 2.1910 0.6446 2.7141
I = Musharakah; II = Mudarabah; III = Murabahah; IV = Istisna

Risk Return Analysis of Islamic Financing
Instruments (3 and 4 Instruments)
Portfolio of 3 instruments is displayed in table below.
The existence of Murabahah in a set of portfolio causes the variance to
go up, except in combination of the 3rd column (I, III, IV).
Even, when the whole instruments are put together in one portfolio,
Murabahah’s domination raises the portfolio’s variance (5th column) .
But, portfolio variance of all instruments tends to go down recently. It
occurs when the banks try to increase the market share of Mudarabah
and Musharakah. Noted Mudarabah has low variance in a portfolio.
Year I, II & III I, II & IV I, III & IV II, III & IV I, II, III & IV
2001 0.0181 0.0006 0.0037 0.0203 0.0206
2002 0.0043 0.0001 0.0018 0.0049 0.0050
2003 0.0008 0.0000 0.0004 0.0008 0.0008
2004 0.0059 0.0002 0.0023 0.0045 0.0060
2005 0.0054 0.0002 0.0019 0.0040 0.0054
2006 0.0060 0.0003 0.0021 0.0046 0.0061
2007 0.0032 0.0003 0.0015 0.0023 0.0032
I = Musharakah; II = Mudarabah; III = Murabahah; IV = Istisna

An Efficient Portfolio Frontier
•As the dominant of Murabahah (x) and Mudarabah (y),
we adopt them to construct the portfolio frontier and find
the efficient one having high-expected RoR and low
financing risk.
•Assuming set of γ ranging from 0 into 1.05 with 0.075
interval, so :
Z = γx + (1-γ)y =
nn yx
yx
y
)05.11(05.1
...
)075.01(075.0
)01(0x
22
11

An Efficient Portfolio Frontier
The portfolio frontier starts from point A into point C with a turning
point in B. The line that indicates the efficient portfolio frontier is
from point B into C (thick line).
For an illustration, point B has an expected RoR of 0.21% and
standard deviation of 0.10% (γ = 0.525). Whilst point C has the value
of expected RoR of 0.39% and standard deviation of 0.04% (γ = 0).
0
0.05
0.1
0.15
0.2
0.25
0.3
0.35
0.4
0.45
0.02 0.04 0.06 0.08 0.1 0.12
Portfolio's Standard Deviation (%)
Portfolio's Mean Return (%)
B
C
A

Conclusion and Policy Recommendation
Most of financing go to Murabahah financing, followed by
Mudarabah, Musharakah and Istisna.
The actual and expected RoR of Murabahah is noted the highest
among others but followed by high financing risk in a portfolio.
Mudarabah, the second favorite financing instrument, has a little
bit lower RoR but if it is combined with other instruments, its
financing risk is lower than Murabahah.
Considering all aspect of individual and portfolio performance, the
efficient portfolio frontier tells that Islamic banks can optimize
their portfolio financing by not only concentrating financing on
Murabahah itself but also Mudarabah with specific range of
allocation.
Nevertheless, as Musharakah and Istishna are not fully employed,
developing much effort to improve the performance of Musharakah
and istishna is also recommended in order to maximize all
financing instruments existed in the industry.