Embed Size (px)
Citation preview

Vincenzo Butticè Federico Caviggioli Chiara Franzoni Giuseppe Scellato Nikolaus Thumm
JRC Digital Economy Working Paper 2018-03
Impact of counterfeiting on the
performance of digital technology
companies
An economic perspective
May 2018

2
This publication is a Working Paper by the Joint Research Centre, the European Commission’s in-house science
service. It aims to provide evidence-based scientific support to the European policy-making process. The
scientific output expressed does not imply a policy position of the European Commission. Neither the European
Commission nor any person acting on behalf of the Commission is responsible for the use which might be made
of this publication.
Contact information
European Commission, Joint Research Centre
Address: Edificio Expo. c/Inca Garcilaso, 3. 41092 Seville (Spain)
E-mail: [email protected]
Tel.: +34 954488214
JRC Science Hub
https://ec.europa.eu/jrc
JRC111550
Seville, Spain: European Commission, 2018
© European Union, 2018
Reproduction is authorised provided the source is acknowledged.
How to cite: Vincenzo Butticè, Federico Caviggioli, Chiara Franzoni, Giuseppe Scellato, Nikolaus Thumm; Impact
of counterfeiting on the performance of digital technology companies; Digital Economy Working Paper 2018-03;
JRC Technical Reports.
All images © European Union 2018

3
Table of Contents
TABLE OF CONTENTS 3
LIST OF ABBREVIATIONS 5
EXECUTIVE SUMMARY 6
1 INTRODUCTION 8
1.1 Background of the study 8
1.2 Goal of the study 9
1.3 Methodological challenges 9
2 REVIEW OF THE LITERATURE 10
2.1 Measuring counterfeit 10
2.2 Impact of counterfeiting 12
2.3 The perspective of infringed firms 13
2.4 The perspective of consumers 15
2.5 The perspective of national governments 16
3 FIRM-LEVEL DATABASE 17
3.1 Information sources 17
3.2 Retrieval and match of companies from OECD-EUIPO 17
3.2.1 17
3.2.2 STEP 1: HS AND CONTENT ANALYSIS 18
3.2.3 STEP 2: FIRST MATCHING WITH ORBIS 19
3.2.4 STEP 3: IDENTIFICATION OF DIGITAL COMPANIES 20
3.3 Data consolidation, control sample and patent data 20
3.4 The structure of the firm-level database 21
3.5 Information coverage 22
3.5.1 OTHER METHODOLOGICAL CAVEATS 23
4 DIGITAL COMPANIES AFFECTED BY GLOBAL TRADE OF COUNTERFEIT GOODS 25
4.1 Counterfeiting affecting the digital technology companies 25
4.2 Characteristics of companies affected by counterfeiting 26
4.2.1 LOCATION 26
4.2.2 COMPANY DIMENSION 27
4.2.3 INDUSTRY 29
4.3 Patenting activities of companies affected by counterfeiting 30
4
5 CHARACTERISTICS OF COMPANIES AFFECTED BY COUNTERFEITING 33
5.1 Methodology: Analysing the likelihood of counterfeit 33
5.2 Results: Factors affecting the likelihood of being targeted by counterfeiting 34
6 IMPACT OF COUNTERFEITING ON THE ECONOMIC PERFORMANCE OF DIGITAL
TECHNOLOGY COMPANIES 36
6.1 Methodology: assessing the firm-level impact of counterfeiting 36
6.1.1 DIFFERENCE IN DIFFERENCE METHOD 37
6.1.2 PROPENSITY SCORE MATCHING METHOD 37
6.1.3 OLS AND INSTRUMENTAL VARIABLES METHOD 38
6.2 Results of diff-in-diff models 38
6.3 Results of propensity score matching models 41
6.4 Results of OLS and Instrumental variables models 42
7 IMPACT OF COUNTERFEITING ON THE INNOVATION PERFORMANCE OF DIGITAL
TECHNOLOGY COMPANIES 44
7.1 Methodology: assessing the impact of counterfeit on innovation performance
45
7.2 Impact on patenting activity 45
7.3 Impact on investment in Intangible Assets 46
8 CONCLUSIONS 48
8.1 Methodological caveats 48
8.2 Summary and discussion 49
8.3 Future research and conclusions 50
9 REFERENCES 51
5
List of abbreviations
BvD-ID Company identification number of Orbis-Bureau van Dijk
DSM Digital Single Market
DG-TAXUD Directorate General Taxation and Customs Union
EBIT Earnings Before Interest and Taxes
EBITDA Earnings Before Interest, Taxes, Depreciation and Amortization
EC European Commission
EFTA European Free Trade Association
EPO European Patent Office
EU European Union
EUIPO European Union Intellectual Property Office
GTRIC General Trade-Related Index of Counterfeiting
ICT Information and Communication Technology
INPADOC International Patent Documentation
IPR Intellectual Property Right
IV Instrumental Variables
JPO Japan Patent Office
JRC Joint Research Centre of the European Commission
NACE Nomenclature of Economic Activities
OECD Organization for Economic Co-operation and Development
OHIM Office for Harmonisation in the Internal Market
OLS Ordinary Least Square
PCT Patent Cooperation Treaty
PSM Propensity Score Matching
ROA Return on Assets
SME Small Medium Enterprise
USPTO United States Patent and Trademark Office
WCO World Custom Organization
WIPO Worldwide International Patent Office

6
Executive summary Counterfeiting activities target companies in various sectors, including digital technology
companies, defined as companies that produce and/or commercialize at least one physical
product that incorporates a digital technology, excluding the merchandising related to the
company brands.
Counterfeiting is a fraudulent activity that potentially damages the economic and innovation
performance of companies and can pose major threats to global competition and economic
growth. However, the actual impact of counterfeiting on the performance of companies has not
been tested empirically, due to methodological problems, including the lack of data on
counterfeiting at the firm-level. Furthermore, prior theoretical studies have speculated that
counterfeiting could have in part a beneficial effect on the performance of companies, due to
indirect advertising, calling for empirical investigations to shed light on the issue.
The goal of the present study is to provide empirical evidence on the impact of counterfeiting on
both the economic and innovative performance of digital technology companies at the firm-level
and on the global scale. To this aim, a new database was created combining data on
counterfeiting activities during 2011-2013 (OECD-EUIPO, 2016) with financial information and
patent data from 2009 to 2015. The result is a firm-level database that enables unprecedented
analyses on the impact of counterfeiting on performance of digital technology companies.
About 9% of the seizures of counterfeits that were illegally traded across borders during 2011-
2013 involved goods commercialized by digital technology companies, equivalent to about the
9.1% of the total value of seizures. Collectively, about 11% of companies affected by illegal
international trade of counterfeits are digital technology companies. The majority of these
(58%) are big corporations with Operating Revenues greater than USD 1 bn. These account for
77% of the number of total seizures, and 84% of the value of seizures related to the digital
technology companies. SMEs, defined as those with Operating Revenues up to USD 50 million,
represent 21% of digital technology companies targeted and account for 5% of total seizures
and 6% of the total value of seizures.
The industries mostly targeted are electronics (both consumers’ electronics and electronics for
industrial use), automotive and digital media. The digital technology products commercialized in
frauds of IPRs include computer hardware and electronic components, batteries, sensors, auto-
parts, optical instruments, videogames, and recording of movies and motion picture.
About 34% of digital technology companies affected by international trade of counterfeits are
located in the EU28 or EFTA, 41% are located in North America, 23% are located in Asia. Within
the EU28, UK, Germany, France and Italy are the countries hosting the largest number of
targeted digital technology companies. Within the EU28, Germany and UK, followed by Belgium
and Ireland, are the most-common country of destination of seized counterfeits.
The overwhelming majority of seized goods related to digital technology companies is imported
from Asia. 51% of these are imported from China, 41% comes from Hong Kong, China, 3%
from Singapore. Other economies of provenance account each for less than 1% of the seizures.
The vast majority (93%) of seizures affecting digital technology companies are due to violations
of trademarks, and only a minority are due to violations of design models (4%), and copyrights
(2%). Less than 1% of the seizures are due to violations of patents. However, seizures enacted
in defence of patents are those that have the highest mean value.
The analysis of infringed companies with respect to a control samples of non-infringed
companies indicates that counterfeiting targets specifically highly profitable companies, with
high propensity to innovate. Indeed, digital technology companies are more likely to become
target of counterfeiting when they have larger Operating Revenues, and when they perform at a
higher level in terms of profitability (return on total assets), prior to the window of observation.
Target companies also have on average larger patent portfolios, prior to the observation of
counterfeiting activities.
Digital technology companies located in EU28 are on average less likely than companies located
outside of EU28 to be the target of counterfeiting activities.

7
Results from impact analyses indicate lower growth rates of operating profits for digital
technology companies targeted by counterfeiting with respect to control samples of firms not
affected by counterfeiting. In particular the econometric models provide evidence of a negative
impact of counterfeiting on both EBITDA (Earnings before interest taxes depreciation and
amortisation) and EBIT (Earnings before interest taxes).
This result is robust across different estimation methods, model specifications and time
windows. The data reveals only a weak negative impact on operating revenues, with limited
statistical confidence. Conversely, there is no significant evidence that counterfeiting affected
the investment in Fixed Assets of targeted firms with respect to the control sample.
The results about the negative impact of counterfeiting activities on operating profits are in line
with reports of greater costs incurred by these companies to enact anti-counterfeiting
strategies, reported in prior descriptive literature. These practices include the broadening of
product ranges, with fewer scale-economies and the enactment of anti-infringement procedures,
such as ‘conspicuous packaging’, more screening and origin certifications, development of
licensing downstream retailers and direct self-enforcement aimed at limiting the circulation of
counterfeits.
Results do not provide support for the existence of indirect positive spillover effects, as
hypothesised by the theoretical literature, according to which infringed companies might benefit
from an advertising effect due to the greater diffusion of brands from the counterfeiting
activities. Indeed, at least for what concerns digital technology companies, there is no evidence
of any positive effect of infringement on sales of original products.
The digital technology companies that were affected by counterfeiting on average increased
their patent portfolios during the observation period, but less than the digital technology
companies that were not affected by counterfeiting. However, the result is not robust to the
inclusion of control variables and to the adoption of alternative measures of innovation
performance (Intangible Assets). It certainly merits further research, once more data on
counterfeiting become available.
Overall, the results indicate that counterfeiting activities harm the economic performance of
targeted digital technology companies, by eroding their operating profits. The effect on
innovative performance is negative, but still inconclusive due to insufficient dataset, and cannot
exclude that counterfeiting may harm the propensity to innovate of digital technology
companies. The analysis rules-out the existence of any positive spillover from counterfeiting.

8
1 Introduction
1.1 Background of the study
Counterfeits are fraudulent tangible goods that infringe trademarks, design rights, patents or
other Intellectual Property Rights (IPRs).1 Trading of counterfeit products is an illegal activity
that poses major threats to global competition and economic growth (Staake et al., 2009; Li
and Yi, 2017; Bosworth, 2006; Peitz and Waelbroeck, 2006). It is an IPR violation that
potentially causes missing revenues and reduced profits to companies that are the legitimate
owners of IPRs and consequently reduces government income taxes. It can also pose potential
threats to the health and wellbeing of citizens and aliments criminal activity. Furthermore, the
presence of significant counterfeit activity of products covered by IPRs has also detrimental
effects on the incentives of companies to innovate (Peitz and Waelbroeck, 2006).
A recent study conducted by the OECD with the EUIPO has provided a global quantitative
account of the phenomenon, indicating that in 2013 counterfeited goods amounted to 2.5% of
world trade. The study showed that several EU economies are heavily affected by the
phenomenon, suggesting that the incidence of counterfeits on the total imports was double in
the EU (2.5%) compared to the total world figures and pointing at a growing trend over a five-
year period (OECD, 2009; OECD-EUIPO, 2016). In a germane study, the OECD has investigated
counterfeit trade in the ICT sector and has found that this accounts for about USD 143 bn in
2013, equivalent to the 6.5% of the total ICT trade (OECD, 2017).
The globalization of trade across markets and economies, with increased levels of
import/export, exposes economies to a greater risk of vulnerability to IPR frauds. The potential
damages of illicit trade for IPR frauds are known to be especially severe for those economies –
like the European Economic Area (EEA)- characterized by a considerable propensity to innovate
and generate creative contents and solutions for at least three reasons. First, the competition in
industries with a strong innovative potential relies more directly on IPR-based strategies,
making these businesses more exposed to suffer direct losses from infringements. Second, the
value of innovative businesses relies especially on Intangible Assets, such as brands, patents,
design rights, hence counterfeits undermine the market valuation of these businesses. Third,
the expectation of IPR infringements potentially discourages companies from making
investments in Intangible Assets, diminishing the overall propensity of the companies to invest
in innovation and ultimately undermining their long-term competitive advantage.
The creation of a Digital Single Market (DSM) within the EU has among its aims that of
designing the ideal environment for companies grounding their strategy and wealth on digital
technologies and innovation to develop, prosper and create jobs now and in the future
(European Commission, 2016). In this respect, the evidence of a high and growing incidence of
counterfeits in the EEA, combined with the evidence of considerable counterfeiting activities in
the ICT sector, raises concerns and demands a careful monitoring not only of counterfeiting
activities, but also of the impact of counterfeiting on the prosperity and innovativeness of digital
technology companies.
1 By following the approach presented in the previous OECD studies (OECD, 2008; OECD-EUIPO, 2016), the term
“counterfeit” to describe tangible goods that infringe trademarks, patents, design rights or copyrights. This does not constitute any sort of definition outside the scope of this study.

9
1.2 Goal of the study
The goal of this study is to produce evidence-based estimates concerning the impact of
counterfeiting activities on the economic and innovative performance of digital technology
companies. Digital technology companies are defined as those companies that produce and/or
commercialize at least one physical product that incorporates a digital technology, excluding the
merchandising related to the company brands.
The study exploits the potential offered by the information on counterfeit goods seized by
customs worldwide, as available from the OECD-EUIPO database, but it expands the analysis by
looking at the implications of counterfeits for digital technology companies. Compared to the
extant studies, the present study involves the adoption of a firm-level unit of analysis, instead
of a country or industry-level and a global scale. The study monitors specifically the
performance of the digital technology companies with a track record for being affected by
counterfeits, with the aim to estimate the impact of counterfeiting on observable firm
performance.
1.3 Methodological challenges
The choice of a firm-level unit of analysis poses significant methodological challenges. A first
problem relates to identifying digital technology companies that suffered infringement. The
OECD-EUIPO database stores information by seizure provided by custom authorities. For a
subset of these seizures for which the violation related clearly to one specific brand or IPR, the
OECD-EUIPO database provides the indication of the legitimate owners of the IPRs being
violating, but this information is available only in the form of a company name and country, in
string format and the only industry-relevant information provided concerns the type of goods
seized (HS class 2-digits). This required a tailored methodology for identifying and extrapolating
digital technology companies from the general sample, which employed a combination of
taxonomy-based screening, content-analysis and manual coding. A second problem relates to
tracking and matching each company in external databases, to retrieve yearly financial
information and patent activity. Specifically, the information was searched by using name-
matching algorithms with three external databases: Orbis-Bureau van Dijk (®Elsevier),
Clarivate (®Thomson Reuters) and EIKON-Datastream (®Thomson Reuters).
The goal of assessing the impact poses further methodological issues. First, the circumstance
that the targets of counterfeiters tend to be among the highest-performers in their business
poses a problem of endogeneity (positive selection into treatment) that may confound the
impact analysis. Second, the potential existence of trends and other unobserved factors poses a
problem of spurious causality in isolating a differential impact. To partly overcome these
challenges, the study adopts a pool of estimation techniques, used in alternative, that include
matching-pairs, difference-in-difference and instrumental variables estimates.
In summary, the present study aims at assessing the impact of counterfeiting activities on the
economic and innovative performance of digital technology companies. The study relies on
creating a new firm-level database, which is unique of its kind and requires the use of a broad
set of statistics and econometric techniques of impact analysis.

10
2 Review of the literature
Previous studies have analysed the phenomenon of counterfeit trade along different
perspectives. In light of the scope of this project, and in accordance with recent scientific works
(Staake et al., 2009; Li and Yi, 2017; Peitz and Waelbroeck, 2006), this literature review is
organized by subject. First, it reviews the studies that have dealt with measuring the
phenomenon of counterfeit trade and provides an overview of the most recent figures. Second,
it reviews the theories and empirical findings on the implication of counterfeiting for the main
stakeholders, with a focus on firm performance.
2.1 Measuring counterfeit
In recent years, international organizations and governmental agencies have been concerned
with providing an estimate of the counterfeit trade on a global scale, with the goal to appreciate
the actual extent of counterfeiting in terms of total amount and value of counterfeit sales,
percentage of counterfeit trade over licit trade, and market shares of counterfeits.
Estimating the actual extent of counterfeiting is nonetheless a challenging task due to the illicit
nature of the phenomenon, which enables only limited and partial observability.
Existing studies have attempted to measure counterfeiting using a range of data sources that
include custom seizures, seizures of production facilities, comparative analyses of total demand
and total supply, and consumers’ surveys (BSA, 2016; OECD, 2008; OECD-EUIPO, 2016).
Unfortunately, many of these methods are unsuitable to be applied on a pervasive and global
scale. Amid data shortage, custom seizures of counterfeited goods have progressively emerged
as the most comprehensive and reliable source of data (Staake et al., 2009), albeit not exempt
from limitations.2 Because data on seizures represent only a fraction of total counterfeit trade,
estimating the overall incidence of counterfeits in the economy requires additional statistical
processing (European Commission 2012). Using statistical inference on a dataset of German
custom data in which each item seized is classified as being either authentic or counterfeit at
the inspection, Cuntz (2016) estimates that the range of counterfeit goods in the German
economy in 2010–11 was ranging between a 9,5 and 22 percent of total import.
An alternative approach consists in computing indexes of the relative propensity to import
counterfeit products, based on the relative incidence of counterfeits among the trade partners
and on the relative incidence of counterfeits among the product categories traded. These
indexes are called GTRIC and are developed and maintained by the OECD (OECD-EUIPO, 2016).
The most recent and comprehensive work that estimated the size of counterfeit trade by
applying this methodology to custom seizures has been carried out in the OECD - EUIPO study
(OECD-EUIPO, 2016). The database used for the study assembled information on seizures of
counterfeit products from three sources: The World Customs Organization (WCO), the European
Commission's Directorate-General for Taxation and Customs Union (DG TAXUD), and the United
States Department of Homeland Security (DHS). The OECD-EUIPO database contains half a
million custom seizure data covering the period of 2011-13 and the last available year is 2013.
According to the OECD-EUIPO estimate, the trade in counterfeit and pirated goods is estimated
to account for as much as 2.5% of world trade, or 5% if restricted to trade related to the EU
countries.
2 First, counterfeit goods that are seized at the custom represent only an unknown share of the total counterfeits that
are illegally traded across the borders, and do not account for trade of counterfeits that does not travel across the borders. Second, custom controls that eventually result in seizures are not necessarily random and may rather reflect priorities of the country and the authorities, such as the need to prevent the spread of products that may potentially pose threats to the health of citizens. Third, collection of seizures data is normally conducted for reasons different from statistical computation and by individuals that have no training in statistics. Forth, products that infringe trademarks are relatively easier to be detected by custom officers compared to products that infringe on other Intellectual Property Rights (IPR), such as patents or copyrights (Berger et al., 2012).

11
The OECD-EUIPO estimate highlights a growing trend in counterfeit trade, considering that the
counterfeit trade was estimated to be 1.9% of world trade in 2008. The growing trend finds
confirmation in other reports. In terms of annual losses, counterfeits were estimated to imply a
loss of around USD 10-30 bn in the early 1980s and the same figure had reached more than
USD 200 bn by the end of the 2000s (Wilson and Sullivan, 2016)3. Furthermore, the number of
applications for action filed and applicable in the member states has tripled in the last
decennium (European Commission, 2016b).
Concerning the geographic dimension of the phenomenon, the study by OECD-EUIPO (2017)
shows that nearly 20% of the seizures in value are for goods whose owners reside in the US.
Other heavily targeted economies are Italy, France, Switzerland, Japan and Germany. Middle-
income and emerging economies play an important role either as transit points in international
trade (e.g. Hong Kong, China, the United Arab Emirates and Singapore), or as producing
economies (e.g. China, India, Thailand, Turkey, Malaysia, Pakistan and Viet Nam). China is the
largest producer of counterfeits, even if Chinese brand owners are also frequently targeted.
According to the recent report of Europol-OHIM (2017), Free Trade Zones are associated with a
high number of IPR crimes. EU-based criminals rely predominantly on manufacturers based
abroad, but the organisations for the import, storage and distribution of the counterfeit goods
are based within the EU. The Europol-OHIM report (2017) also highlights the presence of
potential new threats in the IPR crime landscape deriving from the increasing use of rail
transport as a method of cargo conveyance between China and the EU.
The target of counterfeits are primarily branded products, and more generally those products
with a low-price elasticity generated by the presence of IPRs (Berger et al., 2012). Counterfeits
exist in almost all sectors, from luxury products (e.g. watches, fashion bags), to products of
common consumption (e.g. cigarettes), and include products for business goods (e.g. tyres) and
technology products (e.g. hard disk drives).
The counterfeit goods related to the ICT sector have been estimated to account for USD 143 bn
in 2013, equivalent to the 6.5% of the total ICT trade and significantly more than the general
average (OECD, 2017). Memory sticks, solid state drives, sound apparatus and video games are
among the most frequent type of ICT goods seized at customs. The statistics for the ICT sector
show that companies located in the US, Finland, Japan, Korea, and Germany are those reporting
the highest number of cases of infringement (OECD, 2017).
Looking jointly at geography and product categories, some economies appear as specialized in
the illicit traffic of specific goods: Benin for food, Mexico for alcoholic beverages, Morocco for
other beverages, Malaysia for body care items, Turkey for clothing, Hong Kong, China, for
mobile phones and accessories, memory cards, computer equipment, CD/DVD and lighters,
Montenegro for cigarettes and India for medicines (European Commission, 2016).
Concerning the organization of the counterfeit trade, the studies suggest that the largest share
of counterfeit goods are shipped in containers over long distances and are later distributed in
smaller parcels by post or by courier services. Sometimes fake labels and fake packaging are
shipped separately from the counterfeit item and assembled at destination. This trading system
is fostered by the reduced costs of postal and courier shipments and the increasing importance
of Internet and e-commerce in international trade. Small shipments with fewer than ten items
accounted for about 43% of all shipments, on average (OECD-EUIPO, 2017). The use of small
batches is particularly evident in the counterfeiting of ICT goods, where two thirds of shipments
are done through post or by couriers.
An alternative approach to estimate counterfeit at the economy level is employed in Pacula et
al. (2012). The authors rely on confidential aggregated product-level data to assess industry-
specific counterfeiting activities in various geographic markets. While this type of study can
provide interesting insight about the perceived impact at the firm of counterfeit, the
3 Note that the accuracy of these estimates in some cases have been challenged (US Government Accountability Office,
2010; Wilson et al., 2016).
12
methodological approach is not appropriated for the estimation of the aggregated size of the
counterfeit phenomenon.
Additional methods have included surveys of supply and demand (e.g., Rob and Waldfogel,
2006), economic multipliers to estimate the effects on the U.S. economy (e.g., Siwek, 2007),
statistical modelling (e.g. Oberholzer-Gee and Strumpf, 2009). The report by the European
Commission (2012) provides a comprehensive discussion of the alternative approaches and
technical issues for the generation of aggregate estimates of counterfeit.
2.2 Impact of counterfeiting
One area of direct interest for the present analysis concerns the economic implications of
counterfeiting. In this area, there are several works from industry, institutional, and government
entities (e.g. International Chamber of Commerce, 2006; European Commission, 2016; OECD-
EUIPO, 2016; WIPO, 2010), as well as academic studies (e.g. Staake et al., 2009; Li and Yi,
2017; Peitz and Waelbroeck, 2006). Overall, the works have investigated the potential
consequences of counterfeits from both the theoretical and empirical points of view and have
used both quantitative and qualitative methodologies.
The literature has highlighted that counterfeits produce a number of multifaceted consequences
on the market of genuine goods that have implications for companies, but also for consumers
and for the economic system at large (Staake et al., 2009; WIPO, 2010). The next paragraphs
provides an overview and common ground on the welfare impact on counterfeiting and further
expands the analysis by looking at the different perspectives of infringed firms, consumers, and
government.
The seminal theoretical works by Grossman and Shapiro (1988a and 1988b) studied the
demand-price curves in markets with both counterfeit and authentic products and provided the
starting point for the discussion on the effects of counterfeit trade. The authors describe
counterfeiting as a phenomenon that undermines the functionality of the property right system,
by enabling competitors of the original producers to appropriate part of the value of a
company’s Intangible Asset and by imposing losses of value to those consumers that have
unwittingly purchased copies. They also stress that counterfeit potentially alters the behaviour
of infringed firms, which can adjust both the price and the quality of the genuine goods in
response to counterfeiting. The direction of these changes depends on a number of market
factors. In general, they predict that counterfeiting produces a welfare reduction in markets with
free entry, whereas the predictions are not univocal for markets with a fixed number of
competitors.
It is worth noting that a general welfare reduction is not necessarily true in markets
characterized by strong network externalities or bandwagon effects (Conner and Rumelt, 1991).
In these markets, there is a positive externality for producers and consumers of original
products, because customers’ utility is an increasing function of the users’ base. Conner and
Rumelt, (1991) find that, although software piracy generally harms both software firms
(reducing profits) and customers (increasing prices), firms and customers could gain a positive
network externality effect when the lower prices of counterfeits enables a more widespread
adoption of a product (see also Givon et al., 1995, and Shi et al., 2016). Under these
circumstances it is possible that the externality effect in the long term generates an increase in
the demand, especially in the case of luxury goods and in brand-related business ventures (Nia
and Zaichkowsky, 2000; Bekir et al, 2013; Li and Yi, 2017). One classical example is the market
of the operative systems and the related software, in which it is possible that pirated software
availability have indirectly contributed to consolidate the use of Microsoft windows products
(Qian, 2014). More complex effects were found by Jaisingh (2009) who suggests the social
planner to adapt the policy rules according to the presence of monopoly or competitive market,
since in the former an increase in the severity of the anti-counterfeit laws and procedures could
provide a disincentive for innovation.
13
One important distinction that emerges in the literature relates to “deceptive” versus “non-
deceptive” counterfeits. Deceptive counterfeits are copies that aim at confusing consumers,
making them believe that they are buying the legitimate product. In this case, the counterfeit is
traded in the legitimate market, which is termed in this literature as “primary market” of
counterfeiting (OECD, 2008).
Primary market purchase implies that deceived consumers buy at prices equal or almost equal
to those of the original products. Therefore, purchase of deceptive counterfeits can be
considered as largely replacing the purchase of original products, resulting in a direct damage to
the legitimate producer. As a consequence, with deceptive counterfeiting, the incentives for
producers to invest in high value products are potentially undermined, challenging the very
existence of high-quality and innovative markets. Furthermore, rational consumers aware of the
presence of fake goods on the market, even if unable to distinguish fakes from original
products, would have been unwilling to pay the full price of a high-quality good for the fake.
Therefore, deceived consumers typically receive products with a value well below the price they
would have paid if they knew that the product was fake. As a consequence, with deceptive
counterfeiting, the consumer suffers a loss of product value. Furthermore, they suffer the loss of
after-sales services (e.g. guarantee, customer care).
Non-deceptive counterfeits are instead copies which are commercialized as clear fakes. In this
case the copies are purchased by aware customers in what are called by this literature
“secondary market” of counterfeiting (OECD, 2008). Secondary markets offer counterfeit
products at prices much lower than the original good prices. Therefore, it is legitimate to believe
that purchases of these goods do not or only partly replace purchases of genuine goods.
However, for luxury products, for which part of the value depends on the status associated to
the limited circulation of the products (also called ‘status goods’), the display of the product’s or
the producer’s name may confer prestige to the purchaser, yielding utility independent from the
utility derived from the goods’ physical or functional characteristics and without paying the
related price. As a consequence, consumption of deceptive counterfeits may create an indirect
damage in terms of company brand value. At the same time, circulation of copies may also
create an indirect ‘advertising effect’ that potentially affects brand value positively. At the same
time, consumers of the counterfeit product experience a partial loss of status, and consumers
and producers of counterfeits obtain an unfair benefit.
The overall effect on social welfare depends on the values of the relevant market parameters
and remains an open problem to be answered by empirical investigations (Grossman and
Shapiro, 1988b).
2.3 The perspective of infringed firms
This stream of works has investigated the response of original producers to the challenge posed
by counterfeited products with the aim of understanding the strategies enacted in response to
counterfeits (including innovation) and the overall impact of counterfeits on the economic and
financial activities of the firm. Here, as before, the paucity of data, particularly at the firm and
product level, has traditionally been an obstacle to perform large-scale empirical investigations.
In addition, these analyses are complicated by the endogeneity of the counterfeiting activities
with regard to firm performance, i.e. counterfeiters typically copy successful/ high-performing
products and profitable brands (Berger et al., 2012). As a consequence, only a small number of
studies has assessed the effect of counterfeits empirically.
Among the early work conducted at the firm level, Feinberg and Rousslang (1990) examine the
welfare effects of foreign IPRs (trademark, copyright, or patent) infringements among US
companies. Although they do not specifically focus on counterfeit trade, they find that profit
losses are at least as great as 1% of the total sales and expenditures on counter-measures are
about 4% of the losses. In fact, companies facing the threat of counterfeiters are reported to
enact anti-counterfeiting strategies and practices which increase costs (Staake et al., 2009; Li
and Yi, 2017).

14
In a series of studies, Qian (2008, 2012, 2014) and Qian et al. (2015) focus on the shoe market
in China to investigate the relationship between original product manufacturers and the entry of
counterfeiters in the case of weak government protection. Making use of firm-product-level data
combined with surveys, the author investigates the response of companies to counterfeiting.
She maintains that original producers facing counterfeiting put in action strategies to
differentiate their products from copies and to increase the level of control of the product
circulation in the final market. For example, in the Chinese shoes market, the companies
targeted by counterfeits differentiated their products through innovation, self-enforcement,
vertical integration, and subtle high-price signals in response to counterfeit entry. Collectively,
these strategies are costly to the company and push the prices up. When she instruments the
analysis to eliminate the effects of possible endogeneity, she finds that the entry of
counterfeiting has a twofold effect: increasing market prices of original goods pushed by an
increase of costs and reducing counterfeit sales. The increase in prices of the original product
estimated in the Chinese shoes market two years after the entry of counterfeiters was as much
as +45%. The estimated impact of counterfeiting entry on the profit of original producers is
negative, but not statistically significant (Qian, 2008). Export is also not affected.
Qian and Xie (2010) find that, in some cases the price response to counterfeiting entry can be
more complex and change over time. Specifically, counterfeiters’ entry may push the original
producer to reduce prices at first, and later increase the quality differentiation which
subsequently drives the prices up. This increase happens at different times for different firms.
Larger firms with more human capital and research and development resources respond faster
compared to smaller firms. Furthermore, with different penetration of counterfeits in different
markets, the response time can also be influenced by geographic composition of the sales.
An important aspect of Qian’s finding relates to showing that the competition brought to the
market by the entry of counterfeiters forces the original producers to invest in the differentiation
of the original product. For example, she finds that the material and design, as well as the
technological equipment used by original manufacturers in China improved in response to the
entry of counterfeits, raising the overall quality of the shoes of +15%. As a consequence,
product innovation might increase –instead of decreasing- in response to the entry of a
counterfeiters.
Box 2.3 Anti-counterfeiting strategies
Companies that are under the attack of counterfeiters can react to the threat
in different ways. The range of possible actions that have been reported by
the original producers include:
Investing in product attributes that are difficult to imitate, including
quality and technology (conspicuous products)
Increasing prices to signal quality
Investing in advertising
Improving packaging, including difficult-to-copy labels and certificates
of authenticity (conspicuous packaging)
Investing in vertical integration with downstream retailers (licensed
brand stores)
Enacting self-enforcement policies, including private investigations,
and training of retailers and custom authorities.
Collectively, these strategies are meant to differentiate the original product
from the counterfeits and make the counterfeits more easily identifiable to
the retailers, the customers, and the authorities. The strategies are costly for
the companies and the product differentiation that they produce is not
necessarily welfare-enhancing, as if the costs incurred were invested to innovate.

15
The finding is consistent with the works of Feinberg and Rousslang (1990) and of Liebowitz
(2005), who observed that original producers respond with differentiation through quality
improvements. Further confirmation come from the analysis of piracy, where the increase in
product differentiation and innovation is termed ‘piracy paradox’ (Raustiala and Springman,
2009). Although these investments in innovation are provoked by an unfair competition and
might also not be welfare-enhancing (WIPO, 2010), their existence is important to bear in mind
from a methodological point of view, because they could exert a potential confounding effect
that counterbalances the expected decrease in the incentives to innovate induced by IPR
expropriation.
Berger et al. (2012) investigate which companies potentially face higher risks of suffering IPR
infringement by running and analysing an original survey in various sectors. They show, among
other findings, that companies with higher investments in IPRs and stronger brands are more
exposed to imitation, confirming the preference of counterfeiters for stronger and more popular
brands.
Among the additional costs that original producers might sustain when facing counterfeiters, the
literature has highlighted that companies invest in the implementation of advanced technologies
and techniques, like RFID, watermarking, shipment inspection procedures (Holliman and
Memon, 2000; Siror et al., 2010; Li, 2013). Particular attention has been given in the literature
to the detection of specific pharmaceutical compounds (e.g. Deisingh, 2005) and the impact of
counterfeited integrated chips along the supply chain (Guin et al., 2014). Other costs in cases of
counterfeit occurrence consist in the establishment of enforcement measures and potential
liability claims in cases of health and safety hazards for consumers (Feinberg and Rousslang,
1990; Liebowitz, 2005).
As mentioned earlier, counterfeit goods potentially affect the value of the copied brand and the
overall firm reputation. In this respect, many studies suggest that counterfeits reduce brand
equity, especially for luxury goods (Gabrielli et al., 2012). The reason is that illicit goods are
usually of lower quality, which damages the overall attractiveness of products. Furthermore, the
brand equity of status goods is especially damaged because counterfeits reduce the perception
of exclusivity and uniqueness of the product, by increasing the availability of cheap imitations
(Fournier, 1998; Li and Yi, 2017). Furthermore, the presence of fake products can generate
brand dilution and customer confusion (Feinberg and Rousslang, 1990; Liebowitz, 2005) with
further negative effects on the overall reputation of the original producer (Wilke and
Zaichkowsky, 1999).
Concerning the strategies enacted to detect counterfeiting, the literature has reported that
many companies screen the market actively (Wilson and Sullivan, 2016). Many have started to
do so after facing losses in sales, receiving quality complains and returns from deceived
customers, or when alerted by third party or by large incidents of trademark infringement
(Green and Smith, 2002; Chaudhry and Zimmerman, 2009; Reynolds, 2011).
2.4 The perspective of consumers
Several scholars have investigated consumer behaviour and attitudes in the presence of
counterfeit goods with the aim to improve the understanding of the traits of customers, the
rationale for their choices, ethics, and morality. Most of the studies in this area rely on surveys
administered directly to consumers or to experts in the field (e.g. Nia and Zaichkowsky, 2000;
Ang et al. 2001; Cordell et al., 1996; Wilcox et al., 2009).
The works identified negative implications for the consumers both in the case of deceptive and
non-deceptive counterfeits. In the former case (i.e. “primary market” counterfeiting),
consumers purchase products with a lower than expected value (Grossman and Shapiro, 1988a
and 1988b) and experience a loss of rights such as guarantee, customer assistance, etc. When

16
considering special types of products (e.g. pharmaceutical, batteries, etc.), the purchase of fake
goods may pose health and safety hazards (Feinberg and Rousslang, 1990).
When focusing on the non-deceptive informed sales (i.e. the “secondary market”
counterfeiting), the consumers experience a mixed effect: on the one side, they enjoy the
status without paying the price of the original good, but on the other side, the marginal value
deriving from the exclusivity is reduced due to the greater club size. The overall effect on social
welfare depends on the values of the relevant market parameters (Grossman and Shapiro,
1988b).
Further indirect positive effects for the consumers might be related to a price reduction in
specific cases (Li and Yi, 2017), even if this could be only temporary (Qian and Xie, 2010).
Differently from status goods, in the case of software, a price reduction could increase the
number of users and generate positive network externalities (Conner and Rumelt, 1991; Givon
et al., 1995; Shi et al., 2016).
2.5 The perspective of national governments
Counterfeit trade is an illicit activity that generates losses in tax revenues and employment,
raise IP enforcement expenses, reduces investments in innovation and hinders the
development, growth, and competitiveness of the products (Feinberg and Rousslang, 1990;
Liebowitz, 2005; Li and Yi, 2017).
Furthermore, some counterfeit goods like pharmaceuticals, batteries, or toys, may pose
additional health safety hazards for consumers. Finally, the profits from sales of counterfeit and
pirated goods may very often serve to finance other criminal activities (WIPO, 2010; Europol-
OHIM, 2017).
Previous literature reviewed measures for contrasting counterfeit and piracy in a qualitative
way, for example, educating consumers and raising public awareness about the harmful effects
of counterfeit (Chiu et al., 2008; Li and Yi, 2017); protecting IPRs through patents, copyrights,
and trademarks (Bell and Parchomovsky, 2005); strengthening the enforcement of IPRs (Olsen
and Granzin, 1992); or inspections along supply chains.
The existence of potentially positive spillovers from counterfeiting activities for governments
have not been sufficiently investigated so far and no formal modelling has been developed
concerning the long-term perspective (WIPO, 2010). However, McDonald and Roberts (1994)
proposed that counterfeit trade may increase the transfer of technology to less developed
economies and the general satisfaction of market needs, which on the long-term may reduce
the negative effects of the phenomenon.
In conclusion, a rather limited number of studies has dealt with the impact of counterfeit trade
on infringed firms and only a few studies have performed empirical investigations, due to a lack
of reliable firm-level data. At the theoretical level, both deceptive and non-deceptive
counterfeiting can harm companies by reducing their sales and increasing their costs.
Furthermore, counterfeits can lower the value of brands and the incentives of companies to
invest in innovation. However, these predictions lack substantial empirical evidence. The
companies targeted by counterfeiting have been found to respond to the threat by enacting
anti-counterfeiting strategies and practices that can range from product differentiation, and
increased advertising, to conspicuous packaging, vertical integration with downstream retailers,
and direct self-enforcement. Again, these practices have been documented on specific cases,
but no large-scale study exists.
However, the theoretical literature has also hypothesised the existence of positive spillovers
caused by counterfeiting for companies, potentially due to indirect advertising received from
fake products and/or widespread distribution in markets with strong network externalities.
These hypotheses have never been tested empirically and further restate the need for rigorous
empirical analyses at the firm-level, which are among the goals of this study.

17
3 Firm-level database
The firm-level database used for the analysis is a relational database organized at the company-
level, where each record identifies univocally a digital technology company. Digital technology
companies in this report are defined as those companies that produce and/or commercialize at
least one physical product that incorporates a digital technology, excluding the merchandising
related to the company brands. The strategy for constructing the database is coherent with such
definition.
3.1 Information sources
The database used for the study results from the combined information from multiple data
sources.
OECD-EUIPO database. The database was used as the source of information on IPR owners
and economies, and on numbers and values of custom seizures registered in 2011, 2012 and
2013 in 92 economies around the world (including all the EU countries, US, Japan, and Korea
among others). It also provided information about the categories of goods seized (based on the
Harmonized System and Combined Nomenclature taxonomies).
Orbis-Bureau van Dijk (®Elsevier) and EIKON Datastream (®Thomson Reuters). These
databases served as sources of financial and economic information originated from balance
sheet data. The BvD-ID (from Orbis-Bureau van Dijk) was used as the primary key linking the
information across the relational database.
Clarivate Analytics (®Thomson Reuters). The database was used as the source of data on
patent applications and grants.
Retrieval of information and data consolidation was performed between August and December
2017.
3.2 Retrieval and match of companies from OECD-EUIPO
The OECD-EUIPO database was the source of a number of information used to identify the
companies whose IPRs had been infringed: The name of the IPR owner, the country of the IPR
owner, the country of origin and destination of the seized goods, a short textual description of
the good seized (e.g. “Electronic toys”), the Harmonized System (HS) classification, the brand of the seized good, and whether or not the company was coded as ICT (OECD, 2017).4
3.2.1 Selection of digital technology companies
The first methodological concern that emerged was related to the identification of the subset of
counterfeits related to digital companies, defined, in this study, as companies that produce
and/or commercialize at least one physical product that incorporates a digital technology,
excluding the merchandising related to the company brands.
This definition includes companies that produce and/or commercialize consumers electronics
(e.g. cell phones, computer equipment, smart watches, etc.), electronic components (e.g.
sensors, microchips, displays, remote controlling, etc.), audio-visual content stored on physical
digital support (e.g. producers of music, films, digital animation movies, etc.), and complex
4 To comply with the confidentiality requirements, the OECD-EUIPO was accessed only at
the OECD premises, by the OECD Secretariat.

18
products that incorporate physical digital components (e.g. automotive companies producing
sensors for assisted driving, etc.). Excluded by the definition are companies that produce and/or
commercialize only non-physical products and services (e.g. e-commerce companies) and
companies whose only physical digital product is merchandize (e.g. football clubs that
commercialize a digital watch with the name of the team).
To select digital technology companies, a three steps procedure was followed. The first step
consisted in including all potential digital companies based on the information about the Harmonized System (HS) classification included in the OECD-EUIPO database5. The purpose of
step one was maximum inclusion, i.e. returning a redundant set of companies in which no or
very minimal incidence of false negatives (digital companies not included by mistake) was
expected. At the same time, step one alone allowed for a high presence of false positives (non-
digital companies included by mistake), that called for subsequent screening. Step two was
meant to reduce the incidence of false positives by using a finer-grained coding (4-digit NACE),
extracted from Orbis-Bureau van Dijk, after matching company names. This second filter is
conservative and reduces only partially the incidence of false positives. Step three was meant to
screen all the remaining instances by means of a manual screening and select only the digital
technology companies for final inclusion. The three steps are described in deeper detail in the
following.
3.2.2 Step 1: HS and content analysis
In order to conduct the search of digital technology companies across a very broad set of HS
classes, an iterative approach was adopted. Initially, all companies whose seizures are in HS
classes that are sure to include –albeit not exclusively- digital technology products were
included. These are HS 84 [Nuclear reactors, boilers, machinery and mechanical appliances;
parts thereof] and 85 [Electrical machinery and equipment and parts thereof; sound recorders
and reproducers; television image and sound recorders and reproducers, parts and accessories
of such articles]. These two classes alone would not include other companies that fit the
definition of digital technology companies and are categorized in mixed digital and non-digital
HS classes. In order to broaden the pool of HS classes, a content analysis based on the verbal
good descriptions of the seized good included in the OECD-EUIPO database was performed.
In particular, the content analysis procedure unfolded as follows. As a first step, a dictionary of
digital-technology related terms was created, by means of a computer software developed ad-
hoc. This software initially pre-processed a selected list of reports on digital technologies recently published by the European Commission 6 , by applying a tokenization 7 algorithm
(Mcnamee and Mayfield, 2004), which transformed the texts into a list of words ordered by
frequency. After reducing inflected and derived words to their root forms with a stemming
algorithm (Willett, 2006) and dropping words that do not carry meaning with a ‘stop words’ tool
(e.g. Venkatsubramanyan and Perez-Carballo, 2004; Huang and Ng, 2006; Seroussi et al., 2012; Rathi and Twidale, 2013),8 the software returned a word list. The word list was validated
via manual expert check to ensure coherence and consistency, resulting in a list of 91 terms
(words and words combinations) denoting digital technologies.
5 HS is a multipurpose international product nomenclature developed by the World Customs Organization (WCO) to
classify traded products. This classification is organized into 96 chapters, or 2-digits classes, describing broad categories of goods (e.g. HS 85-Electrical machinery and equipment and parts thereof). The 96 HS chapters are further subdivided into headings (4-digits classes) and subheadings (6-digits classes), for a total of approximately 5.000 fine-grained categories. The OECD-EUIPO database contained information at the 2-digits level. 6 Publications of the EC digital transformation monitor written in English were used to the aim. These included: i)
“Uptake of digital solutions in the healthcare industry”; ii) “The disruptive nature of 3D printing”, and iii) “Autonomous cars – the future of the automotive industry” (Digital Transformation Monitor, 2017a, 2017b, and 2017c), plus publications related to robotics, and Internet of Things (European Commission, 2016a; Friess, 2016). 7 Tokenization is the process of dividing a text into a sequence of words
8 http://www.lextek.com/manuals/onix/stopwords1.html, accessed on September 20, 2017

19
The terms of the words list were searched in the seizure description of the OECD-EUIPO
database with the purpose to minimize exclusion. As an outcome to this procedure, all the HS
classes where at least one term of the word list was present were flagged as potentially digital.
This analysis broadened the pool of potentially-digital HS classes to comprise all classes from 84
to 92 plus the class 37. Associated to these HS classes were 73.651 seizures and 737 IPR
owners, who could be potentially digital technology companies. The choice of including all the
seizures associated to the HS classes identified means that the resulted company list includes at
this stage a high incidence of false positive that will require subsequent selection in steps 2 and
3.
3.2.3 Step 2: First matching with Orbis
To enrich the information concerning the companies selected in step 1, the list of 737
companies was matched with related records in the Orbis-Bureau van Dijk database. The match
was done based on the string of company name and country of the IPR owner and was
organized into two complementary and sequential activities.
i) Automatic -computer based- matching. Given that the list of company names
was harmonized within the OECD-EUIPO database but not harmonized with string
names in Orbis-Bureau van Dijk, the matching often resulted either in an empty set
or in multiple records in Orbis-Bureau van Dijk corresponding to a single entry in the
OECD-EUIPO database. Approximate string matching algorithms (also known as fuzzy
logic algorithms) were used to assess similarity among each potential combination, in
order to select the right company9. For each ambiguous string, the closest string to
the searched one was selected. This automatic matching was assisted by an expert to
ensure the maximum fit of the matching. The result was a list of 577 matched
companies.
ii) Manual matching. After the automatic matching, 160 companies included in the
OECD-EUIPO database resulted not paired with a record in Orbis-Bureau van Dijk. An
additional manual search was performed for these instances. During this activity, the
focus was directed specifically to company names that, for different reasons, eluded
the approximate string matching algorithm. The focus was on alias of names and
acronyms, misspellings, and possible inconsistencies referring to the country of the
IPR owner. Manual matching was performed only when the risk of a wrong
combination was low or very low. Overall, manual matching enabled including 80
additional companies. Thus, in total, 657 companies of those in the initial list of 737
were matched, equivalent to 89.1%.
Matching of OECD-EUIPO with Orbis-Bureau van Dijk enabled associating the potential digital
companies resulted from step 1 with information of Orbis-Bureau van Dijk, including the 4-digit
NACE codes of the firm’s industry. The 4-digit NACE provides a finer-grained classification of
industries compared to the HS classification used in step 1. A list of NACE codes was created
from the companies of the OECD-EUIPO database (OECD, 2017) related to digital products, as
identified from the content analysis. The list was used to identify, by difference, the companies
that did not have digital technology products. The excluded companies were further checked
randomly to reassure that exclusion criteria did not generate false negatives.
The result of step 2 was a list 406 companies that shared at least one 4-digit NACE code either
with companies coded as ICT-related or with companies whose related seizures included
keywords denoting digital content.
9 Approximate string matching algorithms are a group of techniques for searching strings that match a pattern
approximately, rather than exactly.

20
3.2.4 Step 3: Identification of digital companies
The third and final step was meant to filter-off the sample of the 406 companies resulted from
steps 1-2, all the remaining companies that were arguably non-digital, based on the definition
adopted. Specifically, the records were manually checked to exclude all companies not
committed in the making of digital products, by screening the Orbis-Bureau van Dijk record
information and at the information contained in the website of the companies.
Step 3 enabled clearing away from the sample 146 companies that resulted to be non-digital.
The result was a final list of 260 digital companies that were affected by illicit international trade
of counterfeit products during the period 2011-2013.
The database construction process is synthesized in Figure 1.
Figure 1 Database construction process
3.3 Data consolidation, control sample and patent data
Having defined the set of digital technology companies that were affected by counterfeiting, the
analysis continued with the construction of a control sample of digital technology companies
likely not affected by counterfeiting. Methodologically, this sample was selected among the
companies listed in Orbis-Bureau van Dijk and not listed in the OECD-EUIPO database.
Specifically, for each group of companies targeted by counterfeits with a specific combination of
4-digit NACE, geographical area and dimensional category, it was retrieved the corresponding
group of companies in the same 4-digit NACE, geographical area and dimensional category that
were listed in Orbis-Bureau van Dijk and not in the OECD-EUIPO database. Collectively, the
search resulted in a control sample of about 29,000 companies which were included in the firm-
level database.
Financial information was retrieved from Orbis-Bureau van Dijk for the 260 digital technology
companies and the companies in the control sample. For those companies that were the target
of counterfeiting and resulted to have incomplete financial information in Orbis-Bureau van Dijk
in the years of interest, a supplementary search of data was conducted in the EIKON
Datastream-Thomson Reuters database, on the basis of the name, country and NACE code. This
additional datasource enabled completing missing data for 34 companies (13% of the sample of
digital technology firms).
Patent application data were retrieved from Clarivate Analytics, which provides information on
patent filings on a global scale. This information was retrieved for all digital technology
companies that were affected by infringement and for a set of companies that represented the
best one-to-one nearest-neighbour matching with replacement of the counterfeited companies
(more details on the matching procedure are provided in Section 6). For the purpose of the
present study only patents filed at the EPO, the USPTO, or the JPO, or through the PCT
procedure were considered. Given the time frame of the data on seizures (2011-2013), priority
year of target patents was restricted to be between 2009 and 2015.

21
The overall number of firms (either infringed or in the control sample) with at least one patent
application during years 2009-2015 is equal to 249: 72,7% of the infringed firms and 75,5% of
the control sample firms.
The retrieved patent records were consolidated at the level of INPADOC patent families in order
to avoid the duplication of single inventions extended to multiple patent offices. Furthermore,
relying on patent families provides a more accurate proxy of innovation output. It has to be
recalled that new patent filings have an 18 months’ period of secrecy and usually additional 12
months are required to observe them in commercial databases. Hence, more recent patent
applications might be underestimated in the database. However, this data limitation is less
relevant when using control samples in order to compare patent applications in a given year
among subgroups.
3.4 The structure of the firm-level database
The firm-level database has a relational structure, and its primary identification key is the BvD-
ID number. The structure of the database is illustrated in Figure 2. There are three main pools
of data in the database. The first pool is the Counterfeit seizures data, and includes seizures and
values of counterfeits from 2011 to 2013 for the 260 digital technology companies that were
affected. The second pool is the Financial/economic information, and includes: identification
information (legal entity name, country, NACE industry code, dimensional category), and
economic and financial information from 2008 to 2015 (from Income Statements and from
Balance Sheets) for both the digital technology companies subject to counterfeit and the control
sample companies. The BvD-ID identifier enables subsequent matching with additional
information. The third pool is the Patent information, and includes the number of patents filed
with an earliest priority between 2009 and 2015 by the digital technology companies subject to
counterfeit and their one-to-one nearest neighbour pair.
The process of database creation relied on a correspondence table associating the BvD-ID of
digital companies with the seizure case number (primary ID of the OECD-EUIPO database),
based on the harmonized company name of the OECD-EUIPO database.

22
Figure 2. Structure of the firm-level database
3.5 Information coverage
Information concerning the economic and financial activities of the digital technology companies
was collected for the accounting years 2008-2015, as available in the database Orbis-Bureau
van Dijk. Given the relatively-high incidence of missing data found in the series, economic and
financial information were integrated by means of the database EIKON Datastream
(Thomson/Reuters®), which contains data for firms in 400 exchanges and OTC-traded markets.
Table 1 reports a summary of the observations available for a selection of the most important
annual indicators used in the subsequent analysis. As the data evidence, the incidence of
missing instances is considerable for the years of interest. This has implications for the data
analysis. First, the number of usable information varies across models, depending on the
variables and years used in the model. Second, some information, notably R&D expenses,
exhibited a very high incidence of missing values, despite the considerable data integration. This
is due in part to imperfect data coverage in the source databases and in part to the different
accounting regulations concerning R&D expenditures that exist in different economies. As a
consequence, the analysis that follows could not take into account R&D expenditures, despite
their potential relevance to the analysis, because of the limited coverage of this information in
the firm-level database. Concerning the information on patenting activities from the database
Clarivate, no significant lack of data is observed.

23
Table 1. Availability of information for digital technology companies. Affected companies (selected items and years)
Variable Observations Missing % coverage
Net income 2010 133 127 51.2%
Net income 2011 137 123 52.7%
Net income 2012 142 118 54.6%
Net income 2013 145 115 55.8%
Net income 2014 141 119 54.2%
Net income 2015 139 121 53.5%
Operating revenues turnover 2010 134 126 51.5%
Operating revenues turnover 2011 141 119 54.2%
Operating revenues turnover 2012 144 116 55.4%
Operating revenues turnover 2013 146 114 56.2%
Operating revenues turnover 2014 144 116 55.4%
Operating revenues turnover 2015 145 115 55.8%
Intangible Fixed Assets 2010 164 96 63.1%
Intangible Fixed Assets 2011 170 90 65.4%
Intangible Fixed Assets 2012 175 85 67.3%
Intangible Fixed Assets 2013 178 82 68.5%
Intangible Fixed Assets 2014 175 85 67.3%
Intangible Fixed Assets 2015 169 91 65.0%
Total assets 2010 170 90 65.4%
Total assets 2011 173 87 66.5%
Total assets 2012 177 83 68.1%
Total assets 2013 181 79 69.6%
Total assets 2014 177 83 68.1%
Total assets 2015 175 85 67.3%
R&D expenses 2010 91 169 35.0%
R&D expenses 2011 88 172 33.8%
R&D expenses 2012 90 170 34.6%
R&D expenses 2013 89 171 34.2%
R&D expenses 2014 86 174 33.1%
R&D expenses 2015 83 177 31.9%
3.5.1 Other methodological caveats
There are other methodological caveats to be considered before using the firm-level database.
First, the imperfect coverage of information in the data-sources may cause sample selection
issues that cannot be fully controlled-for in the analysis. For example, it is plausible that the
imperfect coverage of information is more severe for SMEs and less severe for larger
companies. Furthermore, the time-lag with which the information is observed may cause over-
representation of older companies and of companies that did not undergo structural re-
organizations post-2011 and instead under-represent young ventures and companies that
underwent structural re-organizations.
Second, the identification strategy of companies that were affected vs. not-affected by
counterfeiting in the firm-level database relies on the coverage and completeness of the OECD-
EUIPO database (OECD, 2009; OECD-EUIPO, 2015). Specifically, firms were coded as
counterfeit-targets by virtue of their being listed in the OECD-EUIPO database. By difference,
the companies not listed in the OECD-EUIPO database were considered not targeted by
counterfeiting and included in the control sample. Measuring counterfeiting is a particularly
challenging task, due to the criminal nature of the activity (see box 3.1). The identification
strategy adopted in this report shares all the strengths and weaknesses of the methodology
employed in the OECD-EUIPO database (OECD, 2015) (Box 3.1). As a consequence, it is
possible that the control sample includes companies that suffered from counterfeiting activities,
which were not reported in the OECD-EUIPO for different reasons: the counterfeiting was not
detected by the authorities; it related to non-physical goods (e.g. piracy of software, music,
video occurred online); it related to goods produced and traded solely within the national
borders; the companies were affected by counterfeiting activities before or after the window of
24
observation; the counterfeiting happened in economies that were not covered by the OECD-
EUIPO database.
Finally, seizures are more likely to be operated on ground of violations of brands and
trademarks, because violations of these types of IPRs are easier to detect by custom authorities
compared to violations of patents and copyrights. As a result, the sample may be biased in
favour of companies that use brands and trademarks more extensively, compared to patents.
These caveats will need to be kept in mind when using the data and interpreting the results of
the analyses. They also suggest the importance of repeating the analysis with more data in the
future for robustness and consolidation.
In conclusion, the firm-level database of digital technology companies affected by counterfeiting
was constructed using a mix of content analysis, automatic matching and manual matching. The
information it contains was sourced from four different databases. The data have limitations,
due to partial coverage of several information. The limitations should be kept into account when
interpreting the data and call for more analyses with enhanced databases in the future.
Despite the limitations, the firm-level database represents a unique and original source of data.
Its strength stands on the firm-level structure and on its unique combination of information of
counterfeits, economic performance and innovation performance. Compared to prior analyses, it
provides unprecedented potential to investigate the characteristics and impact of counterfeiting
activities at the firm level and on a global scale.
Box 3.5 Measuring counterfeiting
Counterfeiting is an illegal activity. As a consequence, measuring counterfeiting is
an inherently difficult task that poses considerable methodological problems. There
are two families of approaches proposed: i) enforcement data (e.g. seizures)
provided by national and international authorities, and ii) surveys of supply and
demand.
Both methods have limitations. The largest limitation of the first method relates to
mapping necessarily a small portion of the real counterfeiting activity. The largest
limitation of the second relate to their self-reported nature. For example,
consumers would likely report lower-than-real values, whereas companies may be
reluctant to answer, due to the sensitive nature of the information.
The OECD-EUIPO is based on records of seizures of counterfeits goods detected by
custom authorities in charge of the monitoring of international trade. As such, the
data represent only the subset of all illegal trading potentially occurring, which was
detected by the authorities. Furthermore, the detection is limited to: i) physical
goods, ii) cross-border trade activities, iii) the time-period 2011-2013 and iv) the
economies that cooperated voluntarily in the supply of data (OECD, 2009).
Despite its limitations, the OECD-EUIPO data is currently the largest, more
comprehensive and reliable dataset for measuring counterfeiting at the global
scale.

25
4 Digital companies affected by global trade of counterfeit goods
4.1 Counterfeiting affecting the digital technology companies
Digital technology companies affected by counterfeiting represent the 10.9% of the OECD-
EUIPO database. In the period 2011-2013, these companies accounted for 38,767 seizures,
corresponding to the 9.1% of the total number of seizures reported in the OECD-EUIPO
database.
The total value of seized goods related to the digital technology companies amounts to USD 786
million, which corresponds to 9.1% of the total value of seized goods in all sectors (Table 2).
Table 2. Comparison between the final sample and OECD-EUIPO database
Companies % companies Seizures % seizures
Tot Value (USD ) % value
Digital 260 10.9% 38,767 9.1% 786m 9.1%
Non-digital 2,132 89.1% 388,612 90.9% 7,850m 90.9%
Total 2,392 100% 427,379 100% 8,636m 100%
Overall, the value of the seizures of counterfeits related to the digital technology companies
increased in the considered time frame: from USD 0.24 bn in 2011, to USD 0.43 bn in 2013
(Table 3). Correspondingly, the unit value of the average seizure case increased from USD
17,063 in 2011 to USD 41,013 in 2013.
Table 3. Yearly value of seizures in bn USD
Year Digital (BUSD )
2011 0.235
2012 0.119
2013 0.432
The distribution of the unit value of seizures is highly dispersed, ranging from seizures of very
small amounts, to seizures of over a USD 1 million (Table 4). About 29.6% of companies in the
period 2011-2013 were affected by seizures of small entity, with seized goods value estimated
to be lower than USD 5,000. By contrast, more than 20% of the companies were affected by
seizures with a total value equal or greater than USD 500,000 and 18.8% were affected by
seizures valued between USD 100,000 and USD 500,000.
The seizures are unevenly distributed across the companies in the sample. Specifically, a
relatively small number of companies account for a very large number of the total seizures. A
rank-ordering of the companies by descending number of total seizures, indicates that the top
four companies accounted for the 54% of total seizures; the top ten companies accounted for
80% and the top twenty companies accounted for 89%. At the same time, there are seventy-
four companies included in the sample by virtue of only one seizure. This large disparity in
concentration may reflect in part the circumstance that some companies are more heavily
targeted by counterfeiters than others. However, it also reflects in part the larger effort placed
by some companies in contrasting counterfeiting activities, compared to other companies. For
this reason, it is important to consider all companies targeted, instead of focusing only on those
with a greater incidence of seizures.

26
Table 4. Distribution of companies by classes of total seized good value in years 2011-2013
4.2 Characteristics of companies affected by counterfeiting
4.2.1 Location
The 41% of digital technology companies affected by counterfeiting in the period 2011-2013
was located in North America (US and Canada), while 34% resided in either of the EU28 or EFTA
countries and 23% in Asia (Figure 3, left panel). United Kingdom, Germany, France, and Italy
were the countries hosting the largest number of European digital technology companies
affected by counterfeiting, with about the 77% of the European digital technology companies
located in these four countries.
The European digital technology companies affected by counterfeiting accounted for 17% of the
total seizures. By contrast, North America accounted for the 49% and Asia accounted for the
33% of the total seizures of digital technology companies, because of few very large companies
located in Japan and Korea (Figure 3, right panel).
In line with prior studies about the counterfeiting of ICT goods (OECD, 2017), the great majority
of seized goods affecting digital technology companies was shipped from China (51%) and from
Hong Kong, China (41%). About 3% of counterfeits seized came from Singapore. Other
economies of provenance account for less than 1% of the seizures (Figure 4). China and Hong
Kong, China were the most common departing points of counterfeit goods for 225 out of the
260 digital technology companies (86%).
By contrast, counterfeit goods coming from the EU28+EFTA countries represented a very limited
share of the total seizures. Switzerland and Greece were the most common departing points of
counterfeit digital goods in the EU28+EFTA area, respectively accounting for 0.2% and 0.1% of
the total number of seizures related to products of digital technology companies.
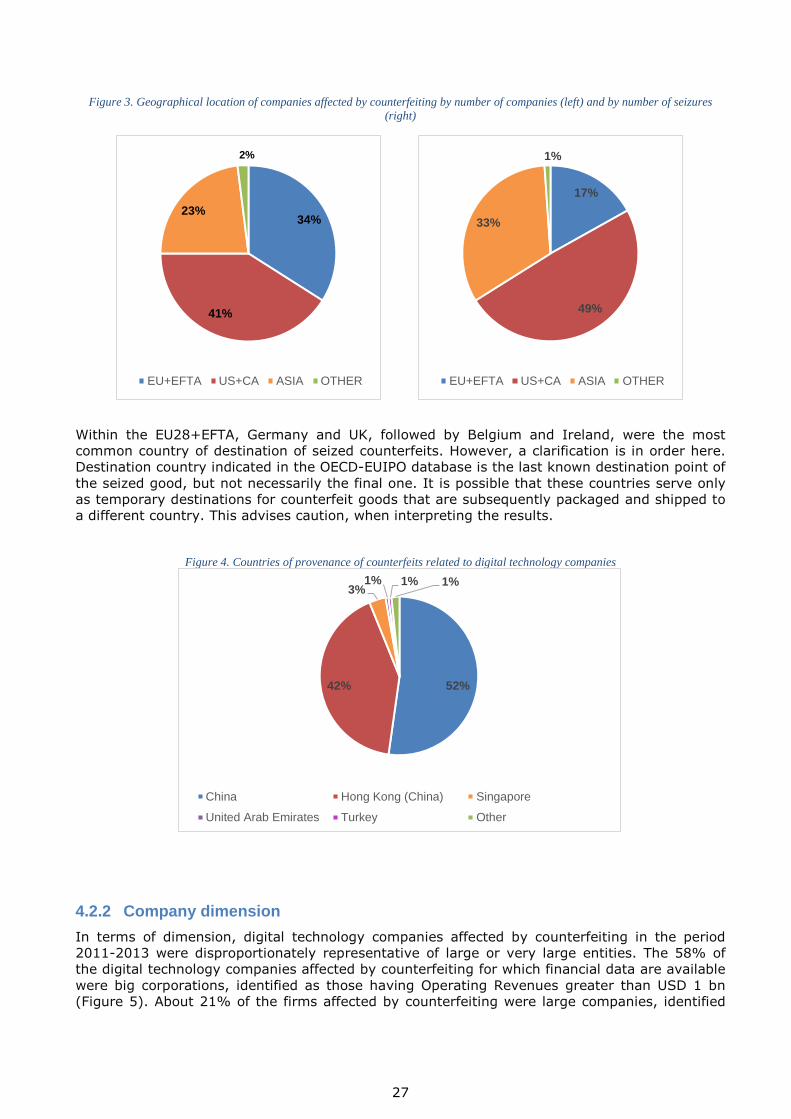
27
Figure 3. Geographical location of companies affected by counterfeiting by number of companies (left) and by number of seizures
(right)
Within the EU28+EFTA, Germany and UK, followed by Belgium and Ireland, were the most
common country of destination of seized counterfeits. However, a clarification is in order here.
Destination country indicated in the OECD-EUIPO database is the last known destination point of
the seized good, but not necessarily the final one. It is possible that these countries serve only
as temporary destinations for counterfeit goods that are subsequently packaged and shipped to
a different country. This advises caution, when interpreting the results.
Figure 4. Countries of provenance of counterfeits related to digital technology companies
4.2.2 Company dimension
In terms of dimension, digital technology companies affected by counterfeiting in the period
2011-2013 were disproportionately representative of large or very large entities. The 58% of
the digital technology companies affected by counterfeiting for which financial data are available
were big corporations, identified as those having Operating Revenues greater than USD 1 bn
(Figure 5). About 21% of the firms affected by counterfeiting were large companies, identified
34%
41%
23%
2%
EU+EFTA US+CA ASIA OTHER
17%
49%
33%
1%
EU+EFTA US+CA ASIA OTHER
52% 42%
3% 1% 1% 1%
China Hong Kong (China) Singapore
United Arab Emirates Turkey Other

28
as those having Operating Revenues smaller or equal to USD 1 bn, but greater than USD 50
million. Similarly, the 21% of digital technology companies affected by counterfeits were SMEs,
identified as those having Operating Revenues smaller or equal to USD 50 million.
Figure 5. Dimension of digital technology companies affected by counterfeiting
Overall, the distribution suggests that, although counterfeiting activities can potentially affect all
digital technology companies, big corporations are disproportionately targeted. This result is in
part expected and depends on the circumstance that counterfeiting targets specifically valuable
brands, which in turn are likely to be owned by large corporations (Berger et al. 2012).
However, recalling the caveats highlighted in section 3.5.1, it is important to stress that the
SMEs could have been under-represented in the sample considered due to imperfect coverage in
the databases of origin of economic and financial information.
Big corporations account for 84% of all the seizures related to digital technology companies
(Figure 6, left panel) and for 77% of the total value of seizures (Figure 6, right panel). By
contrast, SMEs represent only the 5% of the seizures related to digital technology companies
and account for 6% of the total value of seizures. Again, it is important to stress that the SMEs
could have been under-represented in the final sample, due to imperfect coverage.
21%
21% 58%
SMEs Large Companies
Big Corporations

29
Figure 6. Seizures value by company size (left) and seizures count by company size (right)
4.2.3 Industry
NACE codes provide insight on the sectoral distribution of digital technology companies. The
31% of the digital technology companies affected by counterfeiting in the period 2011-2013
were manufacturers of computers, electronics, and optical equipment (Table 5). Collectively, the
counterfeit goods of these companies represent 45% of total digital technology seizures. Among
these, the manufacturers of electronic components are the largest sub-class, defined by 4-digit
NACE, followed by manufacturers of computers and peripheral equipment and consumers’
electronics. Examples of counterfeit goods seized related to these companies include products
aimed at both the business-to-business market (e.g. sensors, LCD screens, mobile phones
components), and to consumers’ market (e.g. computer’s headphones, TV decoders, GPS
navigators, and videogame consoles).
Automotive manufacturers are another large group, representing 7.7% of the digital technology
companies and 9.1% of total digital technology seizures. Automotive manufacturers are also the
group of companies affected by counterfeits that are relatively more sizable in the EU28+EFTA
countries (18% of European digital companies). Counterfeit goods in this sample are primarily
aimed at a business market. Examples of counterfeit goods seized related to automotive
companies include digital commands wheels and digital control units.
A third group of companies affected are media corporations. Collectively, these represent 8.8%
of digital technology companies affected by counterfeiting in the period 2011-2013 and account
for 3.8% of total seizures. Counterfeit goods in this sample are primarily aimed at a consumer’s
market. Examples of counterfeit goods seized related to media corporations include CDs and
DVDs. Other categories of companies represented in the sample are producers of toys with
digital components, and producers of digital music equipment and instruments.
6%
17%
77%
SMEs Large Companies
Big Corporations
5% 11%
84%
SMEs Large Companies
Big Corporations

30
Table 5. Distribution of digital technology companies affected by counterfeiting*
*2-digit NACE code classes with at least 5 companies.
4.3 Patenting activities of companies affected by counterfeiting
The analysis of the type of IPR infringement reveals that the most likely violations of IPRs of
digital technology companies is represented by trademarks, followed by design and model
rights. However, recalling section 3.5.1, this result may be due, at least in part, to the fact that
the infringement of trademarks and brands is easier to detect by custom authorities, compared
to that of patents is more difficult to be detected.
Trademarks represents 92.8% of the total number of seizures and 94.5% of the total seized
value (Table 6). When considering the average value of the seizures, trademark violations are
worth USD 20,655, less than half of the value of seizures associated to patent violations (USD
53,567). This indicates that, on average, seizures due to violations of patents tend to be larger
in magnitude compared to those related to trademarks.

31
Table 6. Type of IPR infringements in the examined dataset
Type of IPR infringement % of seizures Seizures value (M USD)
Mean seizure value (USD)
Trademark 92.8% 743 20,655
Design and Model right 4.5% 22.4 12,771
Copyright 2.1% 9.5 11,554
Patent 0.4% 8.7 53,567
Protected Geog. Ind. 0.1% 2.2 62,238
N/A 0.1% 0.01 675
Total 100.0% 786 20,275
Based on the searches of patent repositories described in section 3.3, the patent portfolios of
the digital technology companies with priority year between 2009 and 2015 were identified. In
total, the search resulted in 843 thousand patent families.10 For 185 of the digital technology
companies affected by counterfeits (71%), at least one patent application in the period of
observation was identified, suggesting considerable R&D intensity. The remaining 75 digital
technology companies (29%) resulted to have filed no patent applications.
The average digital technology company in the sample filed about 3,243 applications in the time
interval, but the distribution is very skewed. Table 7 displays the distribution of the digital
technology companies affected by counterfeits by portfolio size. The median company has a
portfolio of 48.5 patent families (considering only firms with at least one patent, the median
value rises to 443). Such difference results from the presence of several companies that own a
very large number of patents. The companies with the 10 largest patent portfolios account for
about 50% of the patent families in the examined sample, while the companies with the 30
largest portfolios account for 82% of total patent families. Patent holders with less than 1,000
families represent 42% of the sample; 29% of companies have filed applications for more than
1,000 patent families.
Table 7 Distribution of firms in the sample in terms of portfolio size, measured as number of patent families, and median value in each group
Portfolio size (number of patent families) Number of firms Perc. of firms Median portfolio size
Zero 75 29% 0
From 1 to 25 42 16% 8
From 26 to 50 14 5% 39.5
From 51 to 100 11 4% 64
From 101 to 250 18 7% 170
From 251 to 500 11 4% 400
From 501 to 1,000 14 5% 716
From 1,001 to 2,500 25 10% 1,726
From 2,501 to 5,000 14 5% 3,345.5
From 5,001 to 1,0000 12 5% 7,762
From 10,001 to 25,000 16 6% 16,624.5
From 25,001 to 100,000 8 3% 51,820
Total 260 100% 48.5
10
A single patent family represents the bundle of all patent applications stemming from a specific original innovation.
Using patent families allows avoiding double/counting.
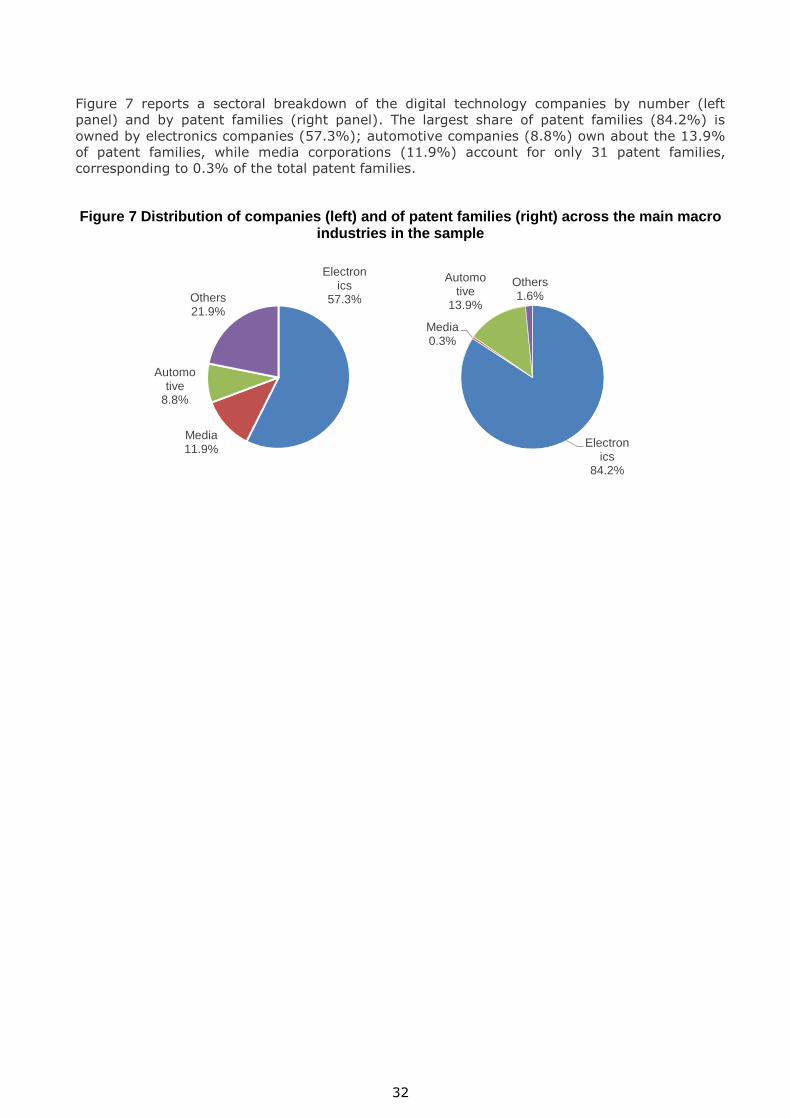
32
Figure 7 reports a sectoral breakdown of the digital technology companies by number (left
panel) and by patent families (right panel). The largest share of patent families (84.2%) is
owned by electronics companies (57.3%); automotive companies (8.8%) own about the 13.9%
of patent families, while media corporations (11.9%) account for only 31 patent families,
corresponding to 0.3% of the total patent families.
Figure 7 Distribution of companies (left) and of patent families (right) across the main macro industries in the sample
Electronics
57.3%
Media 11.9%
Automotive
8.8%
Others 21.9%
Electronics
84.2%
Media 0.3%
Automotive
13.9%
Others 1.6%

33
5 Characteristics of companies affected by counterfeiting
This section aims at identifying the risk factors that make a digital technology company more
likely to be a target of counterfeiting.
Whereas in section 4 we looked separately at the characteristics of digital technology
companies, like size, profitability, sector and country, the methodology used in this section
accounts jointly for all the different characteristics of firms in comparison with those of a control
sample of companies not targeted by counterfeiting.
5.1 Methodology: Analysing the likelihood of counterfeit
In order to investigate the firm-level factors that are associated to the likelihood of being
subject to counterfeit we use an econometric approach based on Logit models. In Logit models
the dependent variable is dichotomous, taking the value of one for the firms affected by at least
one counterfeiting case during years 2011-2013 and zero for those that were not affected. The
not affected firms (control sample) is the one described in the section 3.3.
The general model specification is the following:
Pr(Counterfeited=1)=F(bo+ b1*SIZE + b2*GROWTH + b3*ROA + b4*INTANG +
+ bi *SECTOR DUM + bj*COUNTRY DUM) Eq. (1)
where F is the cumulative logistic function, “b” are coefficients to be estimated, bi is a vector of
coefficients for the sectors, bj is a vector of coefficients for economies. A positive estimated
coefficient for a parameter b in the above equation implies an average positive impact of the
related variable on the likelihood of a company being subject to counterfeit.
The explanatory variables used in the models include:
Company size (variable SIZE), computed as the log of the Operating Revenues. In
some model specifications the single continuous variable SIZE is replaced by a set of
dummy variables identifying the company firm class (BIG: equals one for companies
with a turnover above USD 1 bn; LARGE: equals one for companies with a turnover
between USD 50 million and USD 1 bn; SMEs: equals one for companies with a
turnover equal or below USD 50 million).
Firm profitability, measured by the Return On Assets (ROA), i.e. the ratio of Earning
Before Interest and Taxes (EBIT) to Total Fixed Assets.
The amount of Intangible Assets (INTANG);
The growth rate of the business (GROWTH), measured as the growth rate of sales
over a 2-years time period before the window of observation of counterfeits
Sector dummy variables defined at NACE 2-digit level
Country dummies based on the country of incorporation the company
In order to limit the incidence of potential confounding effects, all dependent variables based on
financial accounting data refer to the fiscal year 2010, i.e. prior to the window of observation of
the counterfeiting event.
Sector dummies are used in order to control for the potential differences in the likelihood of
infringement across different industries. This variable is operationalised using 2-digits NACE
34
codes. All models include a set of country dummies, identified as the country of incorporation of
the company.11
It is important to stress that in this analysis the likelihood to be affected by counterfeit was
modelled, irrespective of the relative intensity of the infringement (i.e. the total number of
seizures or the total value of seized goods). Recalling the caveats discussed in section 3.5.1, the
values of the seizures may in fact under-represented the real entity of the counterfeit value in
place, because it is plausible to presume that not all counterfeited goods are detected at the
custom. Furthermore, it is possible that the intensity of counterfeits is also affected by the anti-
counterfeit activities of companies (Wilson and Sullivan, 2016). By using a single dummy for the
presence or absence of counterfeiting activity, the analysis refrains from making assumptions on
the unknown entity of the counterfeiting in place. Instead, the presence of at least one seizure
in the time interval indicates that a counterfeit activity of any size is in place.
5.2 Results: Factors affecting the likelihood of being targeted by counterfeiting
Table 8 reports the results on the set of Logit model estimates on the likelihood of being
affected by counterfeiting. The model is applied on a dataset that includes both digital firms
subject to counterfeiting and a large control sample of firms not infringed. The control sample
used is the one described in section 3.3.
All models indicate a positive and highly significant correlation between the company size and
the likelihood of being affected by counterfeit. This evidence holds both when using a continuous
indicator of firms’ size (Model I) or when adopting industry size classes (Models II - IV). This
positive correlation is also robust to the inclusion of both sector and country dummies.
Interestingly, in all models a positive and significant correlation between the firm-level
endowment of Intangible Assets (variable INTANG) and the likelihood of being infringed is
observed.
The performance of the firm in year 2010, measured by the return on Fixed Assets (ROA) shows
a weak but positive correlation with the likelihood of being affected by counterfeiting activity
across all the different model specifications, suggesting that companies performing at a higher
level prior to the window of observation were more likely to be targeted by counterfeiting. This
result is consistent with prior studies based on survey data (Berger et al., 2012).
The growth rate of the Operating Revenues (variable GROWTH) in the two years before the
interval of observation of the counterfeiting cases shows a negative correlation with the
likelihood of being a target. This suggests that companies that were targeted by counterfeiting
activities had a lower-than-average growth of sales in the years before the window of
observation. Such result should be interpreted with caution. It could in fact be due to
counterfeiting activities already in place in 2010. Moreover, it could also be due to the natural
circumstance that larger firms, which are more frequently targeted, experience lower growth,
because growth rates tend to be negatively related to size.
11
Note that this may not correspond to the country in which the counterfeit seizure occurred.

35
Table 8. Logit models. Dependent variable: likelihood of being affected by counterfeit during years 2011-2013. Covariates set at year 2010. Sample including non-infringed control firms. Omitted category for the size dummies: SME.
MODEL I II III IV
OUTCOME AFFECTED BY
COUNTERFEITING AFFECTED BY
COUNTERFEITING AFFECTED BY
COUNTERFEITING AFFECTED BY
COUNTERFEITING
SIZE 0.8241*** 0.8763*** (0.086) (0.092)
BIG 4.5706*** 4.2854*** (0.707) (0.581)
LARGE 2.3323*** 2.2541*** (0.695) (0.580)
ROA 0.8137 1.3962* 1.4766** 0.5830 (0.828) (0.789) (0.695) (0.375)
GROWTH -1.2657** -0.8999* -0.7691** (0.542) (0.483) (0.376)
INTANG 0.0541* 0.0521* 0.1625*** 0.1849*** (0.029) (0.028) (0.038) (0.038)
EU Countries -1.2855***
(0.270)
Country dummies YES YES YES
Sector dummies YES YES YES YES
Constant -10.7153*** -10.8587*** -3.0717*** -3.6586*** (1.203) (1.266) (0.820) (0.631)
Observations 5,538 4,919 4,919 4,919
Chi-Sq 452.9*** 449.8*** 362.2*** 431.6***
Log-Likelihood -229.5 -208.3 -224.9 -279.9
pseudoR2 0.497 0.519 0.446 0.435 *p<.1; **p<.05; ***p<.01
Model IV adopts a single dummy variable (EU countries) that takes the value of one for those
companies located in any of the EU 28 countries. In this case, estimates suggest that, after
considering company-specific effects such as size or profitability, firms based in the EU28 have a
relatively lower likelihood of infringement compared to those located in other areas. The effect is
highly significant and robust to alternative model specifications in which other firm-level
covariates are excluded. Based on the available data, it is not possible to know to what extent
the result of a lower incidence of counterfeiting targeting EU28 firms derives from different anti-
counterfeiting policies set in place by EU28 governing authorities or by EU-based firms.
Regardless of the reason, digital technology companies located in EU28 appears to be relatively
less affected by counterfeiting activities than digital technology companies located elsewhere.
This effect is present after controlling for sector and size of the firms, hence net of potential
structural differences between EU and non-EU based firms.
The joint analysis of the different firm-level characteristics indicates that, net of sector specific
effects, firms subject to counterfeit are on average of large size, with larger endowment of
Intangible Assets, a profitability slightly larger than the control sample and lower growth rate of
Operating Revenues in the years before the window of observation of the counterfeiting cases.
Moreover, companies incorporated in EU countries show, net of all previous factors, show a
relatively lower propensity to being subject to counterfeiting compared to companies located
elsewhere.

36
6 Impact of counterfeiting on the economic performance of digital technology companies
This section presents the evidence concerning the impact of counterfeiting activities on the
economic performance of digital technology companies. The assessment of the economic impact
of counterfeiting is a complex task for a number of methodological issues. Section 6.1 discusses
these issues and presents the different methodologies that have been adopted in order to
overcome these issues and estimate the impact of counterfeit on economic performance of the
digital technology companies. Results of the econometric models are presented in section 6.2.
6.1 Methodology: assessing the firm-level impact of counterfeiting
The estimation of the impact of counterfeiting on the subsequent performance of firms is a
challenging task for two main sets of factors: the need to disentangle the trends in performance
that can be attributed to the counterfeiting activity; the partial observability of the
counterfeiting phenomenon. The use of appropriate data modelling techniques that are
commonly used in impact analysis (e.g. for the estimation of the effects of public policy or for
the validation of medical treatments) can address the former factor. In particular the use of
well-defined control samples can allow to control for the fact that during the observed years
there might be sector-level factors that influence the economic performance of the firms and are
indeed unrelated to the counterfeiting.
However, the peculiar nature of the counterfeiting poses specific issues that can be only partly
addressed.
In particular, the actual magnitude of the counterfeiting is unknown, due to the nature of the
data, which likely represent only a subset of the actual products illegally traded. The presence of
repeated seizures along the observed years for a specific company makes it difficult to identify a
time period before and after the counterfeiting in the estimation of an impact. Moreover, there
might be a time lag between the moment of the seizure and the moment when the
counterfeiting actually started.
Furthermore, it is important to stress that firm performance is potentially endogenous to
counterfeiting, because of the circumstance that counterfeiters target high-performing products
and profitable brands (Berger et al., 2012). This in turn might lead to the estimation of a biased
positive correlations between counterfeiting and performance, especially when dealing with
datasets that are necessarily limited in time.
In addition to the above methodological caveats, it has to be recalled that the firms included in
the sample belong to different industries. This introduces a significant source of heterogeneity in
all the econometric models, which necessarily estimate an average impact.12
Taking into consideration all the above important caveats, and the nature and coverage of
available data, different analyses were conducted with the purpose to mitigate at least in part
the problems highlighted. Specifically, the analysis employs control samples, matching pairs
methods, treatment effects, difference-in-difference and instrumental variables estimates for
different groups and years of observation.
Multiple outcome variables were used to capture different dimensions of performance.
Specifically, the outcome variables used to measure the economic performance are: Operating
revenues (sales), two different measures of Operating Profits, i.e. the Earning Before Interest,
Taxes, Depreciation and Amortization (EBIT), the Earning Before Interest and Taxes (EBIT), the
Return on total assets (ROA) and the investments in Fixed Assets.
12
The number of firms subject to counterfeiting is relatively too small to conduct econometric analyses within industry
groups.

37
6.1.1 Difference in difference method
Difference-in-difference is a statistical technique meant to compare a specific outcome variable
across a treated sample (companies affected by counterfeiting activities) and a control sample
(companies not affected by counterfeiting activities), before and after the treatment. In
particular, it estimates the effect of a treatment on an outcome variable by comparing the
average change over time in the outcome variable for the treatment group, compared to the
average change over time for the control group.
The comparison with the control sample over time enables to discount the change in the
outcome variable that has occurred because of reasons other than the counterfeiting (e.g. the
average industry trends) during the relevant years. The comparison of a treated company over
time enables to discount the difference in the magnitude of the outcome variable that is specific
to the treatment group. Hence, the estimation technique is intended to mitigate the effects of
both extraneous factors (e.g. trends) and selection biases (e.g. the affected companies are
among the best-performing).
The general specification for a difference in difference model is the following:
Yi,t = a + b*Ti,t + c*ti,t + d* Ti,t * ti,t + ei,t Eq (2)
The specific definition of the parameters to be estimated (a, b, c, d) and variables in the
previous equation is the following:
Yi,t is the outcome variable of firm i in period t
ei,t is an error term.
T: treatment variable (1 for treated; 0 for non treated)
t: period variable (1 for the period after treatment; 0 for the period before treatment)
a = constant term
b = treatment group specific effect (to account for average permanent differences between
treatment and control groups)
c = time effect common to treatment and control groups
d = true effect of treatment
In particular, the parameter (d) captures the difference among the sub-groups before and after
the treatment, hence depurating it from the effects of common trends.
In the specific setting of this study the model specification entails that:
Ti,t = 1 for firms with at least one counterfeiting event during years 2011-2013
Ti,t = 0 for firms with no counterfeiting events during years 2011-2013
ti,t = 0 in pre-treatment period. Note that the year 2010 or the time window (2008-2010) were
used in alternative model specifications.
ti,t = 1 in post treatment period. Note that the year 2014 or the time window (2011-2014) were
used in alternative model specifications.
6.1.2 Propensity score matching method
A second methodology that can be adopted to investigate the impact of counterfeit is the
Propensity Score Matching (PSM) (Caliendo and Kopeinig, 2008). This method implies that each
company affected by counterfeiting is paired with one or more companies that are similar in
terms of risk to be infringed, but have not been affected by counterfeiting. The objective is to

38
improve the capability to isolate the specific impact of counterfeiting by discounting the changes
in the variables that have occurred to the paired companies and are therefore presumably
unrelated to counterfeiting.
In terms of operations, the methodology entails three steps. First, it computes a company-
specific risk factor to be affected by counterfeit (propensity score) for each company in the
treated and control group. This is based by running a selection equation that replicates the Logit
model of Eq. 1 on pre-treatment data, i.e. for the year 2010. Second, each affected company is
paired with the 5 companies that have the greatest similarity in the risk to be affected. The 5
are selected with the nearest-neighbour method from the broadest control sample, with
replacement, i.e. each company in the control sample can be paired to more than one treated
firm. The large size of the control sample enabled applying a rather conservative tolerance
threshold for the similarity in the risk factor, equivalent to a maximum caliper of 0.05 (Cochran
and Rubin, 1973). Third, the analysis is based on comparing the paired differences across the
two samples in the ex-post growth rates of various outcome variables.13 In particular, the
models report the Average Treatment Effect, i.e. the difference in the outcome variable between
the paired samples of treated and control firms.
6.1.3 OLS and Instrumental Variables method
The diff-in-diff and PSM methodologies adopted to analyse the impact of counterfeit and
illustrated in the previous sections are based on an on/off measure of counterfeiting, which
indicates whether or not the company experienced at least one counterfeit event during the
years 2011-2013. They do not take into account the differences that may exist across
companies concerning the number of seizures experienced during the time window. To consider
this additional information, a set of additional panel models is performed, in which an yearly
outcome variable for both the treated firms and the broad control sample is predicted by an
indicator of the intensity of the counterfeiting activity (number of seizures in a given year) a set
of firm-level controls.
These models comprise the simple Ordinary Least Square (OLS), as well as Instrumental
Variables regressions (IV-reg). It is important to note that the Ordinary Least Square models
are potentially affected by endogeneity, due to positive selection into treatment discussed in
section 4.2, i.e. the circumstance that firms affected by counterfeiting are among those having
larger turnovers. The Instrumental Variable regression was adopted in order to partly mitigate
this problem. In the IV-reg the endogenous annual number of seizures is instrumented by
means of the two-years lagged level of sales and profitability. The IV-reg model that results
estimates whether - net of the firm size effect - the intensity of the counterfeiting phenomenon
(measured by the number of seizures), explains differences in the economic performance of the
companies.
6.2 Results of diff-in-diff models
This section reports the results for a set of diff-in-diff models that estimates the impact of
counterfeiting activity on different measures of economic performance: Operating Revenues,
Operating Profits, expressed by Earning Before Interest Depreciation Amortisation and Taxes
(EBITDA), and Earnings Before Interests and Taxes (EBIT), and investments in Tangible Assets.
Table 9 reports the results for Operating Revenues and different time intervals for the pre and
post treatment periods. The results indicate that the treated group (firms affected by
counterfeits) shows on average a larger volume of Operating Revenues compared to the control
group (firms not affected by counterfeits), both before and after the treatment [Diff t(0) and
Diff t(1)]. This is consistent with the evidence that larger firms are more likely to be targeted.
However, the difference of such differences [Diff-in-diff] takes a negative sign, implying that the
13
All PSM models have been performed with the routine teffects-psm of the econometric software STATA 14.

39
superior performance (higher Operating Revenues) of the treated group compared to the non-
treated group before the counterfeiting was still existing after the treatment, but had shrunken.
In other words, affected companies experienced a relative lower positive trend of sales with
respect to the control sample of non-affected companies. However, this evidence is subject to
high standard errors. It is not statistically significant in Model I, whose specification is reported
in Eq.2, and Model II, whose specification includes sector and country dummies. It is statistically
significant at 95% confidence interval in Model III, when a longer window of observations is
adopted.
In conclusion, the overall evidence points at a negative, but only weakly significant average
impact of counterfeiting on Operating Revenues.
Table 9. Difference in difference models. Dependent variable: sales. Treatment variable: infringement during years 2011-2013. Multiple time interval.
MODEL I II III
OUTCOME OPER. REVENUES OPER. REVENUES OPER. REVENUES
Time T0: 2010
T1: 2014
T0: 2010
T1: 2014
T0: 2009-2010
T1: 2011-2014
Diff-in-diff -126.94 -51.78 -94.85**
Std err (79.187) (75.161) (45.792)
Sector and country dummies NO Yes No
Observations 35,585 35,585 109,609
R-squared 0.1230 0.2194 0.1240
Diff t(0) 2856 2622 2856
Diff t(1) 2729 2570 2761 **p<.05
Table 10 reports the results for a similar model, where the outcome variable is an Operating
Profit, i.e. the EBITDA. This is a performance measure that takes into account not only the
differentials in sales, but also the differentials in operating costs between the treated and the
control firms. In this case, it is observed a clear and robust indication of a negative association
between the treatment (i.e. being infringed) and the dynamics in time of the EBITDA of the
treated firms compared to the control sample.
Table 10. Difference in difference models. Dependent variable: EBITDA. Treatment variable: infringement during years 2011-2013. Multiple time interval.
MODEL I II III
OUTCOME EBITDA EBITDA EBITDA
Time T0: 2010
T1: 2014
T0: 2010
T1: 2014
T0: 2009-2010
T1: 2011-2014
Diff-in-diff -49.981*** -48.846*** -12.520*
Std err (13.897) (13.011) (7.580)

40
Sector and country dummies NO Yes No
Observations 28,327 28,327 93,493
R-squared 0.1940 0.2966 0.191
Diff t(0) 598 545.7 563.2
Diff t(1) 548 496.9 550.7 *p<.1; ***p<.01
Table 11 replicates the analysis, for robustness purposes, by taking an alternative measure of
Operating Profit, the EBIT (i.e. the EBITDA, net of depreciation and amortization), as the
performance indicator. The results are robust and consistent with the estimates of Table 10,
irrespective of the model specifications adopted.
Table 11. Difference in difference models. Dependent variable: EBIT. Treatment variable: infringement during years 2011-2013. Multiple time interval.
MODEL I II III
OUTCOME EBIT EBIT EBIT
Time T0: 2010
T1: 2014
T0: 2010
T1: 2014
T0: 2009-2010
T1: 2011-2014
Diff-in-diff -39.517*** -34.525*** -11.129***
Std err (6.032) (5.784) (3.273)
Sector and country dummies NO Yes No
Observations 36,007 36,007 117,381
R-squared 0.0933 0.1766 0.0816
Diff t(0) 202.5 187.5 170.9
Diff t(1) 163 153 159.7 ***p<.01
Table 12 employs total Fixed Assets as the outcome variables. In this case, a clear impact
(either positive or negative) is not observable. The treated and the control firms do not show a
statistically significant difference in their investment in Fixed Assets and it is therefore
impossible to derive a conclusive evidence on the impact of the infringement on the investment
in Fixed Assets.
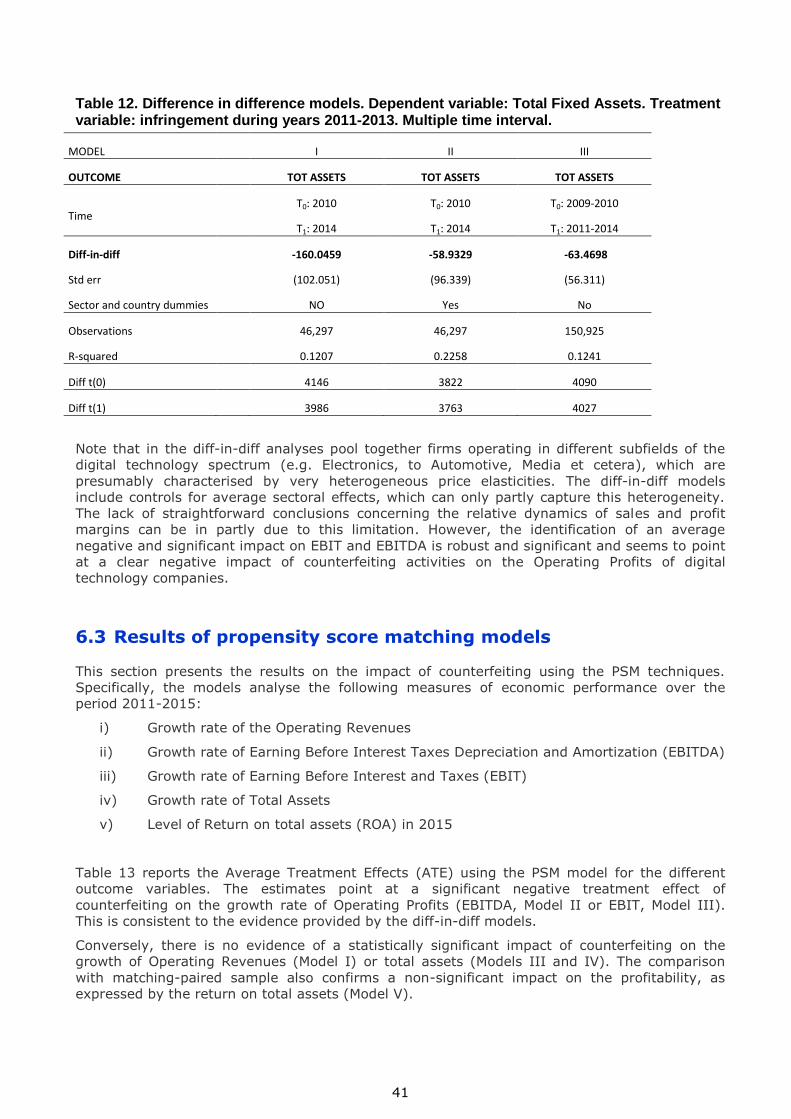
41
Table 12. Difference in difference models. Dependent variable: Total Fixed Assets. Treatment variable: infringement during years 2011-2013. Multiple time interval.
MODEL I II III
OUTCOME TOT ASSETS TOT ASSETS TOT ASSETS
Time T0: 2010
T1: 2014
T0: 2010
T1: 2014
T0: 2009-2010
T1: 2011-2014
Diff-in-diff -160.0459 -58.9329 -63.4698
Std err (102.051) (96.339) (56.311)
Sector and country dummies NO Yes No
Observations 46,297 46,297 150,925
R-squared 0.1207 0.2258 0.1241
Diff t(0) 4146 3822 4090
Diff t(1) 3986 3763 4027
Note that in the diff-in-diff analyses pool together firms operating in different subfields of the
digital technology spectrum (e.g. Electronics, to Automotive, Media et cetera), which are
presumably characterised by very heterogeneous price elasticities. The diff-in-diff models
include controls for average sectoral effects, which can only partly capture this heterogeneity.
The lack of straightforward conclusions concerning the relative dynamics of sales and profit
margins can be in partly due to this limitation. However, the identification of an average
negative and significant impact on EBIT and EBITDA is robust and significant and seems to point
at a clear negative impact of counterfeiting activities on the Operating Profits of digital
technology companies.
6.3 Results of propensity score matching models
This section presents the results on the impact of counterfeiting using the PSM techniques.
Specifically, the models analyse the following measures of economic performance over the
period 2011-2015:
i) Growth rate of the Operating Revenues
ii) Growth rate of Earning Before Interest Taxes Depreciation and Amortization (EBITDA)
iii) Growth rate of Earning Before Interest and Taxes (EBIT)
iv) Growth rate of Total Assets
v) Level of Return on total assets (ROA) in 2015
Table 13 reports the Average Treatment Effects (ATE) using the PSM model for the different
outcome variables. The estimates point at a significant negative treatment effect of
counterfeiting on the growth rate of Operating Profits (EBITDA, Model II or EBIT, Model III).
This is consistent to the evidence provided by the diff-in-diff models.
Conversely, there is no evidence of a statistically significant impact of counterfeiting on the
growth of Operating Revenues (Model I) or total assets (Models III and IV). The comparison
with matching-paired sample also confirms a non-significant impact on the profitability, as
expressed by the return on total assets (Model V).

42
Table 13. Propensity Score Matching Average Treatment Effects. Models based on 5 nearest matches. Different outcomes variables.
Models I II III IV V
Outcome Variable Growth rate of
Oper. Rev.
(2011-2015)
Growth rate of
EBITDA
(2011-2015)
Growth rate of
EBIT
(2011-2015)
Growth rate of
Total Assets
(2011-2015)
Profitability in
year 2015
(ROA)
Average Treatment
Effect:
(Infringed vs. Non
Infringed)
0.1755 -0.2043** - 0.575* 0.1580 0.0779
Std. Err (0.166) (0.103) (0.339) (0.119) (0.105)
P-value 0.289 0.048 0.089 0.184 0.456
Observations 5,348 4,122 3,783 5,429 5,184 **p<.05; *p<.1
6.4 Results of OLS and Instrumental variables models
This section presents the results of analyses based on panel data, covering the years 2011-2013
for the full sample of companies that were affected and not affected by counterfeiting. In line
with the results of the models presented in section 6.2 and 6.3, the dependent outcome
variables are the annual Operating Profits, expressed by EBITDA and EBIT. The explanatory
variable is the count of seizures in a given year and the control variables include the yearly
financial data and the time-invariant dummies for country and sector.
Model I of Table 14 reports the results of an OLS random effects estimate. The result confirm
that the EBITDA is negatively correlated to the number of seizures experienced by companies.
The result is statistically significant at a 95% confidence interval.
The latter evidence might be affected by endogeneity, due to positive selection into treatment,
i.e. the circumstance that firms with larger turnovers have greater likelihood of being affected
by counterfeiting. In order to partly mitigate this problem, an Instrumental Variable regression
(IV-reg) model was adopted, in which the annual number of seizures is instrumented by means
of the two-years lagged level of sales and profitability. The results of the IV-reg are reported in
Model II of Table 14. The results corroborate the evidence of a negative correlation between the
number of seizures experienced and the EBITDA of the companies during the years of
observation at a 95% confidence interval. Note that all effects are robust to the inclusion of
country, sector and year dummies. Overall, the results of OLS and IV models are in line with the
those of the PSM and diff-in-diff models presented in previous sections.
The models II and IV of Table 14 report the estimates of the OLS model and the IV-reg models
using as the outcome variable the EBIT, instead of the EBITDA. All results are confirmed.

43
Table 14. Panel models on number of seizure and economic performance. Dependent variable EBITDA. OLS (I, III) and IV-reg models (II, IV)
MODEL I II III IV
OUTCOME EBITDA EBITDA EBIT EBIT
SEIZURES -0.0253** -3.4873** -0.0688*** -6.1235*** (0.010) (1.472) (0.007) (2.014)
SALES 0.0560*** 0.0413*** 0.0259*** 0.0253*** (0.001) (0.002) (0.000) (0.003)
TOT ASSETS 0.0572*** 0.0813*** 0.0189*** 0.0442*** (0.001) (0.006) (0.000) (0.008)
INTANG ASSETS 0.1750*** 0.2013*** 0.0598*** 0.0298 (0.005) (0.019) (0.003) (0.026)
Country dummies Yes Yes Yes Yes
Sector dummies Yes Yes Yes Yes
Year dummies Yes Yes Yes Yes
Constant 10.8098*** -27.3916** 10.6179*** -36.9913* (4.058) (13.822) (2.263) (19.350)
Observations 35,476 25,142 42,792 25,566
Number of id 15,170 11,833 18,229 12,014
R-Sq overall 0.829 0.580 0.643 0.119 **p<.05; ***p<.01
In conclusion, the results of both the diff in diff models and the propensity score matching
suggest the presence of a negative but weakly significant impact of counterfeiting on the
volume of sales, indicating that companies affected by counterfeiting may have experienced a
slower growth in sales compared to those not affected by counterfeiting. However, this evidence
is not always robust to the choice of model specification and is subject to a potentially large
statistical error, calling for more analyses on new data in the future.
Instead, the results of the diff in diff, the propensity score matching, the OLS and the
instrumental variables models are all coherently suggesting the presence of a robust and
statistically significant negative impact of counterfeiting on the Operating Margins, both
expressed in terms of EBITDA and EBIT. This indicates that companies affected by
counterfeiting have experienced lower Operating Profits compared to companies not affected by
counterfeiting. There is no evidence of an effect of counterfeiting on investment in Fixed Assets.

44
7 Impact of counterfeiting on the innovation performance of digital technology companies
This section addresses the impact of counterfeiting activities on the innovation performance of
digital technology companies. Measuring innovative performance is an inherently difficult task
which poses a series of methodological problems (Box 7.1). The analyses presented in this
report are based on two measures of innovative performance: i) number new patents fillings
and ii) investment in Intangible Assets. This methodological choice is partly motivated by the
lack of consistent data on firm-level expenditures in R&D.
Box 7.1 Measuring innovation
There are two families of indicators commonly employed to measure
innovation activities: amount of resources associated to R&D and patent data.
A comprehensive analysis of the measures of innovation is available in two
OECD publications (OECD, 1997 and 2009).
R&D data can be collected through surveys or from accounting information.
The latter include R&D expenditures from the Income statement and
intangible assets from the Financial Statement. The accounting procedures
may differ across countries. However, the former is usually a measure of
annual costs incurred for R&D, training, software, and other similar items and
the latter relates to capitalized expenditures on IPRs (eg. patents,
trademarks, etc.). This type of data has three main limitations: i) it is an
input measure, not necessarily associated to a corresponding output; ii) R&D
measures do not typically include learning-by-doing or other means that lead
to technological advances; iii) they are difficult to collect and measures may
vary across economies and over time.
Patent data filed or assigned to a company are a second measure of the
output of innovation activities (Griliches, 1990). Patents are assigned by
national patent offices and are recorded in open-access electronic databases,
which can be accessed to elaborate statistics along several dimensions (time,
technological classification, geographical scope, technical merit of the
inventions, etc.). Patent-based measure of innovation also have limitations: i)
innovations are not always patented, and may instead be kept secret, may be
covered by other IP protection rights or not be protected; ii) the distribution
of the economic value of patents is highly skewed, with a small fraction of
patent having high commercial value and the majority of patents having a
small value; iii) patents may be filed by firms for strategic reasons, e.g. to
block competitors or create “patent fences”; iv) there are different industry-
propensities to patent and patent law changed over time.
Other measures of innovation have been used by scholars to complement the
previous two families include: number of R&D personnel, number of
trademarks deposited, number of publications in scientific literature, the
technology balance of payments, the level of activity in high-tech sectors
(e.g. investments, employment, external trade), and the generation and/or
adoption of information technology.

45
7.1 Methodology: assessing the impact of counterfeit on
innovation performance
The study uses two outcome variables of innovation performance of companies: the annual
number of new patent family filings and the Intangible Assets.
Concerning patenting activity, the study compares the innovation performance of companies
(number of new patent family filings) that were affected by counterfeiting against the
performance of a paired sample of companies that were not affected by counterfeiting. The
paired sample was constructed by applying a PSM strategy, using a one-to-one nearest-
neighbour matching with replacement, with a maximum caliper of 0.05. The selection model for
the PSM was run on pre-treatment data (year=2010). In addition to the PSM method the study
also included a paired one-to-one comparison between the digital companies and the
corresponding matched firms, by looking only at the patent portfolios before (2009-2010) and
after (2014-2015) the window of observation. For normally distributed paired differences, the T-
test was performed under the null hypothesis of zero mean difference of the variable. When the
distribution of paired differences was non-normal, the test was based on comparing if the
variables in the two samples have a similar distribution by means of a Kolmogorov–Smirnov
test.14
Concerning the investment in Intangible Assets the study adopts both the diff in diff and the
PSM methods illustrated in Section 6.1.1 and Section 6.1.2.
7.2 Impact on patenting activity
Table 15 reports the comparison in patent filings between the digital companies and the
corresponding matched companies (Columns I and II of Table 15) as well as the difference
within each subsample before and after the period in which counterfeiting is observed (Columns
III and IV of Table 15).
The analysis shows that, before the window of observation (years 2009-2010), the companies
affected by counterfeiting have filed a significantly higher number of patents than the
companies not affected by counterfeiting (Column I of Table 15). The same test, performed
after the window of observation (Column II of Table 15), i.e. in years 2014-2015 indicates that
the samples still have a significant difference in means. However, Columns III of Table 15
indicates that, on average, the number of patents filed by companies targeted by counterfeits
decreased after the counterfeiting period, whereas the number of patents filed by companies
not targeted by counterfeits remained overall unchanged over time (Column IV of Table 15).
The implications of counterfeiting activities on the invention performance of digital technology
companies was further investigated, using a difference-in-difference model that includes sector
and country controls. Table 16 reports the results of the estimates of the diff-in-diff models
performed for different time windows.
The average effect is negative, suggesting a relative reduction in the difference between patent
applications of the treated and control groups after the treatment. However, the standard errors
associated to the diff-in-diff parameters is very high and the result is not statistically significant.
14
Normality is evaluated with the Shapiro–Wilk test.

46
Table 15. Average patenting performance of companies that were affected V. not affected by counterfeiting. Between and within estimates
Between groups (Diff: affected - not-affected)
Within groups (Diff: 2014-2015 – 2009-2010)
I Before
(2009-2010)
II After
(2014-2015)
III Affected by
counterfeiting
IV Not affected by counterfeiting
Average difference 1,097.1 849.5 -247.5 12.5
(St. error) (222.5)*** (188.5)*** (109.4)** 25.3 **p<.05; ***p<.01
The results, although suggesting a negative effect, do not provide a statistically robust evidence
about the existence of a negative impact of counterfeiting on the investments of digital
technology companies in innovation, as captured by patent filings. However, it is important to
stress that this might be due in part by the relatively small sample and by considerable
heterogeneity of the companies in the treated sample concerning the use and intensity of
patents for protecting innovations.
Table 16. Difference in difference model. Treatment variable: at least one infringement. Multiple time interval. Sample based on PSM one-to-one nearest-neighbour match.
MODEL I II
OUTCOME PATENT PATENT
Time T0: 2009-2010
T1: 2011-2014
T0: 2010
T1: 2014
Diff-in-diff -46.6584 -62.732
Std err (125.092) (208.1)
Observations 1926 642
R-squared 0.261 0.260
Diff t(0) 575.6 563.5
Diff t(1) 528.9 500.8
7.3 Impact on investment in Intangible Assets
Intangible Assets are a second outcome variable to measure innovation (Box 7.1). This section
presents the results of diff-in-diff and PSM models performed to investigate the potential impact
of counterfeiting on the innovation performance of digital technology companies expressed by
Intangible Assets.
Table 17 reports the results of alternative diff in diff models, which make use of different time
intervals for the pre- and post- treatment periods. Regardless of the model specifications, the
results indicate that the treated group (counterfeited firms) has an average larger volume of
Intangible Assets compared to the control group, both before and after the treatment [Diff t(0)
and Diff t(1)]. However, the difference of such differences [Diff-in-diff] is not statistically
significant. Hence, the diff in diff model does not point at an effect, either positive or negative,
of counterfeiting on the investment in Intangible Assets.

47
Table 17. Difference in difference models. Dependent variable: Intangible Assets. Treatment variable: infringement during years 2011-2013. Multiple time interval.
MODEL II III I
OUTCOME INT ASSETS INT ASSETS INT ASSETS
Time T0: 2010
T1: 2014
T0: 2010
T1: 2014
T0: 2009-2010
T1: 2011-2014
Diff-in-diff -1.8992 7.6297 4.8579
Std err (10.177) (9.567) (5.610)
Sector and country dummies No Yes No
Observations 42,338 42,338 138,306
R-squared 0.1088 0.2221 0.1129
Diff t(0) 366.7 329.9 363.2
Diff t(1) 364.8 337.6 368.1
Table 18 reports the Average Treatment Effects (ATE) estimated by the PSM model, where the
growth rate of Intangible Assets over the period 2011-2015 was used as an outcome variable.
This model compares the dynamics or the treated group against a selected subset of peer
companies. The results suggest a small negative impact of counterfeiting on the investment in
Intangible Assets, but this effect is not statistically significant at the conventional confidence
levels.
Table 18. Propensity score matching and Average Treatment Effects. Model based on 5 nearest matches on ex-ante data. Outcomes variable Intangible Assets.
Models I
Outcome Variable Growth rate of Intangible
Assets (2011-2015)
Average Treatment Effect:
(Infringed vs. Non Infringed) -0.5820
Std. Err (0.368)
P-value 0.114
Observations 5,301
The joint analyses of the different the models on the innovation variables does not indicate a
clear average impact of counterfeiting. The digital technology companies that were affected by
counterfeiting on average increased their patent portfolios during the observation period, but
less than the digital technology companies that were not affected by counterfeiting. However,
the result is not robust to the inclusion of control variables and to the adoption of alternative
measures of innovation performance (Intangible Assets).

48
8 Conclusions
8.1 Methodological caveats
Before moving to a comprehensive discussion of the evidence derived from the statistic and
econometric analyses, it is important to highlight a set of methodological caveats. Such caveats
are related to both the characteristics of the data and the nature of the analysed phenomenon
and call for the importance of future extension of the analyses on different and possibly larger
sets of data.
First, as evidenced in section 3.5.1, counterfeiting is only a partially-observable phenomenon,
because seizures likely represent a potentially small fraction of true instances of counterfeiting.
It is not possible to exclude that some of the companies included in the control sample (both the
paired and unpaired sample) were affected by counterfeiting not recorded in the data. However,
in this regard, it has to be noted that this potentially confounding effect would go against the
evidence provided of the negative growth rate of Operative Margins.
Second, the detection of counterfeits and the number of seizures performed might be due at
least in part by an active role played by firms in enforcing IPRs and enacting anti-counterfeiting
action (Wilson and Sullivan, 2016). For example, it is possible that some companies spend
considerable money to perform independent investigations that result in more seizure cases of
the prosecution authorities. If this is the case, the inclusion of companies in the treatment
sample may be endogenous to the costs that the companies incurred.
Third, for this study the data on seizures are available only for the years 2011-2013. This might
generate clear issues in the identification of pre/post treatment periods for all the econometric
models, because it is not known if and to what extent counterfeits existed before 2011 and after
2013.
Fourth, digital technology goods span a wide range of sectors. This implies the presence of
significant heterogeneity among infringed companies and in the functioning of the respective
markets (e.g. price elasticities; incidence of deceiving vs non-deceptive counterfeited goods;
approaches to enforcement). Moreover, most of the companies analysed have a broad product
range, for which it is impossible to disentangle economic performance (e.g. Operating
Revenues, Operating Profits, assets). It is possible that the analysis did not observe effects that
would instead be visible with product-level data. This calls for repeating the analysis with
measures the product-level databases.
Fifth, counterfeiting likely targets incumbents and market leaders, which could lead to a
spurious association of the intensity of counterfeiting activities and company performance both
before and after the window of observation. This problem was partly mitigated with the use of
diff-in-diff and PSM methods. However, the digital industry, particularly in the electronic
consumer segment, is characterised by a significant market concentration with few large
corporations accounting for the majority of the market. For such companies the identification of
an appropriate comparable company is difficult, thus lowering the efficacy of the mitigation
strategy.
Despite the limitations, the report offers the first assessment of a largely unexplored
phenomenon, i.e. the impact of counterfeiting activities on the economic and innovation
performance of companies, investigated at the firm level and on a global scale.
The econometric analyses presented herein and the limitations just discussed invite additional
studies to repeat and expand the current analysis, possibly with the use of different and
enhanced data and with mixed qualitative/ quantitative empirical strategies.

49
8.2 Summary and discussion
The theoretical literature, as well as the common wisdom, suggest that counterfeiting harms the
economic and innovation performance of companies. However, a lack of reliable firm-level data
has until now prevented the accomplishment of large-scale empirical investigations on the effect
of counterfeiting. Furthermore, the theoretical literature has also hypothesized that
counterfeiting might, in some conditions, generate positive spillovers for companies, potentially
due to indirect advertising and/or widespread distribution that creates advantage positions in
markets with network economies.
The goal of the present study was to provide the first comprehensive investigation of the impact
of counterfeiting activities on both the economic and innovation performance of companies
active in the area of digital technologies. To achieve this goal, a new firm-level database was
built. The sample included only digital technology companies, defined as companies that
produce and/or commercialize at least one physical product that incorporates a digital
technology, excluding the merchandising related to the company brands. The window of
observation includes years from 2009 to 2015. The data have limitations, but they are at
present a unique source of information that combines counterfeiting activities with financial and
innovation data at the firm-level and on a global scale.
The analyses indicate that counterfeiting targets specifically highly profitable companies, with
high propensity to innovate. Indeed, digital technology companies are more likely to become
target of counterfeiting when they have larger Operating Revenues, and when they perform at a
higher level in terms of profitability (return on total assets), prior to the window of observation.
Target companies also have on average larger patent portfolios, prior to the observation of
counterfeiting activities.
European digital technology companies are overall less likely than companies located elsewhere
to be targeted by counterfeiting. This effect is present after controlling for sector and size of the
firms, hence net of potential structural differences between EU and non-EU based firms.
The analysis of the impact of counterfeiting is complex and affected by a number of
methodological problems caused by the endogeneity of counterfeiting with respect to company
performance. The methodological problems were mitigated in part by the use of appropriate
estimation strategies, including difference-in-difference, propensity score matching, and
instrumental variables estimates.
Results from impact analyses indicate lower growth rates of operating profits for digital
technology companies targeted by counterfeiting with respect to control samples of firms not
affected by counterfeiting. In particular the econometric models provide evidence of a negative
impact of counterfeiting on both EBITDA (Earnings before interest taxes depreciation and
amortisation) and EBIT (Earnings before interest taxes).
The data reveals only a weak negative impact on operating revenues, with limited statistical
confidence. Conversely, the impact on the Operative Margins is statistically significant and very
robust, regardless of the outcome variable used (EBITDA or EBIT), the estimation techniques,
and the model specifications. There is no robust evidence that counterfeiting is associated to
statistically significant differences in the investment in fixed assets.
Concerning the innovative performance, the study finds that the companies affected by
counterfeiting had larger patent portfolios compared to those not affected by counterfeiting prior
to the observation of counterfeiting events and that this difference reduces over time. However,
the relative decrease is not statistically significant, when we control for potential confounding
factors. Hence it is not possible to derive the presence of a significant impact of counterfeiting
on the patenting rates. Furthermore, there is no observable effect on the investment in
intangible assets between companies affected and not affected by counterfeiting.
In conclusion, the study shows with considerable certainty that counterfeiting is associated to a
worsening of the economic performance of the digital technology companies. The digital
technology companies affected by counterfeiting had on average a worse dynamic of operating

50
margins in comparison to the digital technology companies not affected by counterfeiting in the
same years.
Conversely, the study shows no evidence clear of counterfeiting on innovation performance. The
dynamic of innovation performance of companies targeted by counterfeiting, as measured by
the number of new patent families filed and by the level of Intangible Assets, were overall
comparable to those of digital technology companies not affected by counterfeiting.
The results of lower Operating Profits can be explained with some of the evidence reported by
prior studies, which indicated that the companies targeted by counterfeiting react by investing
in the differentiation of the product range and by enacting anti-counterfeiting practices, such as
investing in conspicuous packaging, and in certifications of origin, or in other procedures aimed
at limiting the circulation of counterfeits (Staake et al., 2009; Holliman and Memon, 2000; Siror
et al., 2010; Li, 2013). The present study expands prior studies by showing that, collectively,
these strategies may contribute to lower the profitability of targeted companies, as expressed
by their Operating Profits, and are consequently harming companies targeted by counterfeiting.
The analyses performed exclude with considerable certainty the existence of any positive
spillover effects of counterfeiting on the performance of the affected digital technology
companies, which were hypothesised by the theoretical literature (Grossman and Shapiro,
1988b).
8.3 Future research and conclusions
The study has limitations, which invite further investigations.
First, the study considered only a limited time window. Future studies should replicate the
analysis with extended time-window in order to capture medium-to-long term effects of
counterfeiting. Second, this study showed a negative effect of counterfeiting on economic
performance but could not estimate the magnitude of this effects. Future analyses could
advance the understanding of the effects of counterfeiting by using product-level data, which
can provide insights on magnitudes. Third, the study considered only digital technology
companies. Caution is required in generalizing the findings beyond this industry. More analyses
on different industries and different sets of data are needed to assess the degree to which these
findings could be generalized. Forth, due to data limitations, this study did not investigate the
impact of counterfeiting on R&D expenditures, calling for future analyses to close this gap.
Finally, data limitations highlighted in section 3.5.1 suggest that more analyses based on
different measures of counterfeiting and different sources of economic and innovation
performance would be important to assess the robustness of the estimates.
Despite its limitation, this study is the first that provides a clear and rigorous evidence about the
effect of counterfeiting. It shows that counterfeiting harmed the economic performance of
targeted digital technology companies, by reducing their Operating Profits. There is no
statistically-significant evidence that counterfeiting harms also the innovation activities of
companies, but this result is not robust, thus the study cannot exclude that counterfeiting may
induce a negative effect on innovation. Finally, the study rules-out with considerable certainty
the presence of positive spillover associated to counterfeiting. Indeed, at least for what concerns
digital technology companies, there is no evidence of any positive effect of infringement on
sales of original products.

51
9 References
Ang, S.H., Cheng, P.S., Lim, E.A.C., Tambyah, S.K. (2001). Spot the difference: Consumer
responses towards counterfeits: Journal of Consumer Marketing. 18 (3), pp. 219-233.
Bekir, I., El Harbi, S., Grolleau, G. (2013). How a luxury monopolist might benefit from the
aspirational utility effect of counterfeiting? European Journal of Law and Economics, 36:169–
182.
Bell, A. and Parchomovsky, G. (2005). A theory of property, Cornell Law Review, Vol. 90, pp.
531
Berger, F., K. Blind, Cuntz, A. (2012). Risk Factors and Mechanisms of Technology and Insignia
Copying – A First Empirical Approach, Research Policy, 41, 2, 376–90.
Bosworth, D. (2006). Counterfeiting and piracy. The state of the Art. Oxford Intellectual
Property Research Centre St. Peter's College, Oxford (UK).
BSA Global Software Survey (2016). Avalible at: http://globalstudy.bsa.org/
2016/downloads/studies/BSA_GSS_US.pdf (last access in June 2017).
Caliendo M., Kopeinig S. (2008). Some practical guidance for the implementation of propensity
score matching, Journal of Economic Surveys, 22/1: 3172.
Chaudhry, P., Zimmerman, A. (2009) The Economics of Counterfeit Trade: Governments,
Consumers, Pirates and Intellectual Property Right. Heidelberg, Germany: Springer-Verlag.
Chiu, H.C., Hsieh, Y.C., Wang, M.C. (2008). How to encourage customers to use legal software,
Journal of Business Ethics, Vol. 80 No. 3, pp. 583-595.
Conner, RK. Rumelt, RP., (1991). Software Piracy: An Analysis of Protection Strategies.
Management Science, pp 125 - 139.
Cochran W., Rubin D.B. (1973). Controlling Bias in Observational Studies, Sankyha, 35:417-
446.
Cordell, V.V., Wongtada, N., Kieschnick Jr., R.L. (1996). Counterfeit purchase intentions: Role of
lawfulness attitudes and product traits as determinants. Journal of Business Research, 35 (1),
pp. 41-53
Cuntz, A. (2016). The Quest for Robust Counterfeit and Piracy Figures: Custom Agencies as
Statistical Decision-makers and Recent Evidence Based on German Imports. World Economy,
39(6), 873–887.
Deisingh, AK, (2005). Pharmaceutical counterfeiting. Analyst, Volume: 130, Issue: 3 Pages:
271-279
Digital Transformation Monitor (2017a). Autonomous cars – the future of the automotive
industry.
Digital Transformation Monitor (2017b). The disruptive nature of 3D printing: Offering new
opportunities for verticals.
Digital Transformation Monitor (2017c). Uptake of digital solutions in the healthcare industry.
European Commission (2012). Measuring IPR infringements in the internal market:
Development of a new approach to estimating the impact of infringements on sales. Available
at: http://ec.europa.eu/internal_market/iprenforcement/docs/ipr_infri
ngment-report_en.pdf (last access in June 2017).
European Commission (2016a). Analysis of the impact of robotic systems on employment in the
European Union – 2012 data update. Luxembourg, Publications Office of the European Union.
DOI: 10.2759/176994
European Commission (2016b). Report on EU Customs Enforcement of Intellectual Property
Rights. Results at the European Border-2016. Available at:

52
https://ec.europa.eu/taxation_customs/sites/taxation/files/report_on_eu_customs_enforcement
_of_ipr_at_the_border_2017.pdf (last access in December 2017)
Europol-OHIM (2017). 2017 Situation Report on Counterfeiting in the European Union. Available
at: https://www.europol.europa.eu/sites/default/files/documents/
counterfeiting_and_piracy_in_the_european_union.pdf (last access in June 2017)
Feinberg, D., Rousslang, D. (1990). The Economic Effects of Intellectual Property Rights. Journal
of Business, 63(1), 75–90.
Fournier, S. (1998) Consumers and their brands: Developing relationship theory in consumer
research. Journal of Consumer Research 24 (March): 343 – 373.
Friess, P. (2016). Digitising the industry-internet of things connecting the physical, digital and
virtual worlds. River Publishers.
Gabrielli, V., Grappi, S., Baghi, I. (2012). Does counterfeiting affect luxury customer-based
brand equity? Journal of Brand Management, 19(7), 567-580.
Givon, M., Mahajan, V., Muller, E. (1995). Software piracy: estimation of lost sales and the
impact on software diffusion, The Journal of Marketing, Vol. 59 No. 1, pp. 29-37.
Green, R.T., Smith, T. (2002) Executive insights: Countering brand counterfeiters. Journal of
International Marketing 10(4): 89–106.
Griliches, Z. (1990). Patent Statistics as Economic Indicators: A Survey. Journal of Economic
Literature, 28(4), 1661-1707.
Grossman, G.M. and Shapiro, C. (1988a), Counterfeit-product trade, American Economic
Review, Vol. 78 No. 1, pp. 59-75.
Grossman, G.M. and Shapiro, C. (1988b), Foreign counterfeiting of status goods, Quarterly
Journal of Economics, Vol. 103 No. 1, pp. 79-100.
Guin, U., Huang, K., Dimase, D., Carulli, J.M., Tehranipoor, M., Makris, Y. (2014). Counterfeit
integrated circuits: A rising threat in the global semiconductor supply chain. Proceedings of the
IEEE, 102 (8), art. no. 6856206, pp. 1207-1228.
Holliman, M., Memon, N. (2000) Counterfeiting attacks on oblivious block-wise independent
invisible watermarking schemes. IEEE Transactions on Image Processing, 9 (3), pp. 432-441.
Huang, J. Z., Ng, M. (2006). Text clustering: algorithms, semantics and systems. history, 8, 3.
International Chamber of Commerce (2006) Current and Emerging Intellectual Property Issues
for Business – A Roadmap for Business and Policy Makers. Document 450/911 Rev. 7,
International Chamber of Commerce, Paris.
Jaisingh, J, (2009). Impact of piracy on innovation at software firms and implications for piracy
policy. Decision Support Systems, Volume: 46 Issue: 4 Pages: 763-773.
Li, F., Yi, Z. (2017). Counterfeiting and piracy in supply chain management: theoretical studies,
Journal of Business & Industrial Marketing, Vol. 32 Issue 1 pp. 98 – 108.
Li, L. (2013) Technology designed to combat fakes in the global supply chain Business Horizons,
56 (2), pp. 167-177.
Liebowitz, S.J. (2005). Economists’ topsy-turvy view of piracy, Review of Economic Research on
Copyright Issues, Vol. 2 No. 1, pp. 5-17.
McDonald, G. and Roberts, C. (1994). Product piracy – the problem that will not go away,
Journal of Product & Brand Management, Vol. 3 No. 4, pp. 55-65.
Mcnamee, P., Mayfield, J. (2004). Character n-gram tokenization for European language text
retrieval. Information retrieval, 7(1), 73-97.
Nia, A., Zaichkowsky, J.L. (2000). Do counterfeits devalue the ownership of luxury brands?
Journal of Product & Brand Management, Vol. 9 No. 7, pp. 485-97.

53
Oberholzer-Gee, F., Strumpf, K. (2009). File sharing and copyright. In Lerner J, Stern S, (Eds.).
Innovation Policy and the Economy, Vol. 10, University of Chicago Press, Chicago, 19–55.
OECD (1997). The measurement of scientific and technological activities: proposed guidelines
for collecting and interpreting technological innovation data: Oslo manual.
OECD (2008). The Economic Impact of Counterfeiting and Piracy. Available at
http://www.oecd.org/sti/ind/theeconomicimpactofcounterfeitingandpiracy.htm (last access in
June 2017).
OECD (2009). Patent statistics manual. Paris: OECD. ISBN 978-92-64-05412-7.
OECD (2017). Trade in Counterfeit ICT Goods, OECD Publishing, Paris. DOI:
http://dx.doi.org/10.1787/9789264270848-en.
OECD-EUIPO (2016). Trade in Counterfeit and Pirated Goods: Mapping the Economic Impact,
OECD. Publishing, Paris. http://dx.doi.org/10.1787/9789264252653-en
OECD-EUIPO (2017). Mapping the Real Routes of Trade in Fake Goods, OECD Publishing, Paris.
DOI: http://dx.doi.org/10.1787/9789264278349-en.
Olsen, J.E., Granzin, K.L. (1992). Gaining retailers’ assistance in fighting counterfeiting:
conceptualization and empirical test of a helping model, Journal of Retailing, Vol. 68 No. 1, pp.
90-109.
Pacula, R. L., Kadiyala, S., Hunt, P., Malchiodi, A. (2012). An Alternative Framework for
Empirically Measuring the Size of Counterfeit Markets (No. w18171). National Bureau of
Economic Research.
Peitz, M., and Waelbroeck, P. (2006). Piracy of digital products: A critical review of the
theoretical literature. Information Economics and Policy 18 (2006) 449–476.
Qian, Y. (2008). Impacts of entry by counterfeiters. Quarterly Journal of Economics, 123(4):
1577-1609.
Qian, Y. (2012). Brand Management and Strategies Against Counterfeits. NBER Working Paper
No. 17849. Available at: http://www.nber.org/papers/w17849 (last access in June 2017).
Qian, Y. (2014). Counterfeiters: foes or friends? How counterfeits affect sales by product quality
tier. Management Science, 60(10), 2381-2400.
Qian, Y. (2016). Impacts of Entry by Counterfeiters. The Quarterly Journal of Economics,
123(4), 1577–1609.
Qian, Y., Gong, Q., Chen, Y. (2015). Untangling searchable and experiential quality responses to
counterfeits. Marketing Science, 34(4), 522-538.
Qian, Y., Xie, H. (2010). Bayesian SEM with Random Change points in Analyzing the Timing of
Responses to Counterfeits. Northwestern University Working Paper.
Rathi, D., Twidale, M. B. (2013). Ditch the Smileys: Customizing a Stopword List for Email-
based Data. In Proceedings of the Annual Conference of CAIS/Actes du congrès annuel de
l'ACSI.
Raustiala, K., Sprigman, C. (2009). The piracy paradox revisited. Stanford Law Review 61 (5),
1201–1225.
Reynolds, D. (2011) Manipulating perceived risk to deter and disrupt counterfeiters. Journal of
Financial Crime 18(1): 105–118.
Rob, R., and Waldfogel, J. (2006). Piracy on the high C’s: Music downloading, sales
displacement, and social welfare in a sample of college students. Journal of Law and Economics,
49, 29–62
Seroussi, Y., Bohnert, F., Zukerman, I. (2012, July). Authorship attribution with author-aware
topic models. In Proceedings of the 50th Annual Meeting of the Association for Computational
Linguistics: Short Papers-Volume 2 (pp. 264-269). Association for Computational Linguistics.

54
Shi, W., Tang, L., Zhang, X., Gao, Y. and Zhu, Y. (2016). How does word of mouth affect
customer satisfaction? Journal of Business and Industrial Marketing, Vol. 31 No. 3, pp. 393-403.
Siror, J.K., Guanqun, L., Pang, K., Huanye, S., Dong, W. (2010) Use of RFID for intelligent pre-
shipment inspection International Journal of Digital Content Technology and its Applications, 4
(8).
Siwek, S. E. (2007). The true cost of copyright industry piracy to the U.S. Economy, Policy
Report 189. Lewisville, TX: Institute for Policy Innovation, IPI Center for Technology Freedom.
Available at: http://www.ipi.org/docLib/
20120515_CopyrightPiracy.pdf (last access in June 2017).
Staake, T., Thiesse, F., Fleisch, E., (2009). The emergence of counterfeit trade: A literature
review. European Journal of Marketing, 43 (3-4), pp. 320-349.
US Government Accountability Office (2010). Intellectual property: Observations on efforts to
quantify the economic effects of counterfeit and pirated goods. Washington DC. Available at
http://www.gao.gov/products/GAO-10-423 (last access December 2017).
Venkatsubramanyan, S., Perez-Carballo, J. (2004, July). Multiword expression filtering for
building knowledge maps. In Proceedings of the Workshop on Multiword Expressions:
Integrating Processing (pp. 40-47). Association for Computational Linguistics.
Wilcox, K; Kim, HM; Sen, S, (2009). Why Do Consumers Buy Counterfeit Luxury Brands?
Journal of Marketing Research, Volume: 46, Issue: 2 Pages: 247-259.
Wilke, R., Zaichkowsky, J.L. (1999). Brand imitation and its effects on innovation, competition,
and brand equity, Business Horizons, Vol. 42 No. 6, pp. 9-18.
Willett, P. (2006). The Porter stemming algorithm: then and now. Program, 40(3), 219-223.
Wilson, J. M., Sullivan, B. A. (2016). Brand owner approaches to assessing the risk of product
counterfeiting. The Journal of Brand Management, 23(3), 327-344.
Wilson, J. M., Sullivan, B. A., Hollis, M. E. (2016). Measuring the Unmeasurable Approaches to
Assessing the Nature and Extent of Product Counterfeiting. International Criminal Justice
Review, 26(3), 259-276.
WIPO (2010). The economic effects of counterfeiting and piracy. Advisory Committee on
Enforcement – World Intellectual Property Organization, 9(3), September 3, 2010.

55

56