Embed Size (px)
Citation preview

An economic evaluation of
speech and language therapy
Final Report
December 2010
Kevin Marsh
Evelina Bertranou
Heini Suominen
Meena Venkatachalam

The economic case for speech and language therapy
Matrix Evidence | December 2010 2
Disclaimer In keeping with our values of integrity and excellence, Matrix has taken reasonable professional care in the preparation of this report. Although Matrix has made reasonable efforts to obtain information from a broad spectrum of sources, we cannot guarantee absolute accuracy or completeness of information/data submitted, nor do we accept responsibility for recommendations that may have been omitted due to particular or exceptional conditions and circumstances.
Confidentiality This report has been prepared for the use of the RCSLT within the terms of our contract. Any enquiries about this report should be directed to [email protected]

The economic case for speech and language therapy
Matrix Evidence | December 2010 3
Acknowledgements
Matrix Evidence would like to thank Professor Pam Enderby (University of Sheffield), Professor
James Law (University of Newcastle), and Michelle Morris (Salford Community Health) for their
specialist advice.

The economic case for speech and language therapy
Matrix Evidence | December 2010 4
List of abbreviations
BI Barthel Index
CBA Cost-benefit analysis
DfE Department for Education
DfES Department for Education and Skills
GCSE General Certificate of Secondary Education
KS2/3 Key Stage 2/3
KTEA Kaufman Test of Education Achievement
NHS National Health Service
PSSRU Personal Social Services Research Unit
QALY Quality Adjusted Life Year
RCSLT Royal College of Speech and Language Therapists
RCT Randomised controlled trial
SEN Special educational needs
SLI Speech and language impairment
SLT Speech and language therapy
SLTA Speech and language therapy assistant
UK United Kingdom
WAB Western Aphasia Battery

The economic case for speech and language therapy
Matrix Evidence | December 2010 5
Contents
1.0 Executive summary 6
2.0 Introduction 10
3.0 Methodological approach 12
3.1 Conceptual model 12
3.2 Data collection 12
3.3 Models and presentation of results 13
4.0 Dysphagia post-stroke 15
5.0 Aphasia post stroke 22
6.0 Children with speech and language impairment 29
7.0 Children with autism 38
8.0 Discussion 47
9.0 References 49
10.0 Appendix 1: effectiveness studies selected for CBAs 52
11.0 Appendix 2: decision models and data tables 54
11.1 Dysphagia post-stroke 54
11.2 Aphasia post-stroke 57
11.3 Children with speech and language impairment 61
11.4 Children with autism 68
12.0 Appendix 3: findings at local level 74
12.1 Dysphagia post stroke 74
12.2 Aphasia post stroke 74
12.3 Children with speech and language impairment 74
12.4 Children with autism 74

The economic case for speech and language therapy
Matrix Evidence | December 2010 6
1.0 Executive summary
Introduction
It is estimated that nearly 20 per cent of the population may experience communication
difficulties at some point in their lives. Communication difficulties are strongly prevalent in
children and the elderly and can be related to, for example, head and neck cancer, brain injury,
learning difficulties and hearing impairment. 10 per cent of children have a speech and
language difficulty and it is the most common disability in childhood. Nearly 30 to 40 per cent of
post stroke patients suffer from communication or swallowing complications requiring speech
and language therapy.1
In the context of increased budgetary pressures, evidence of return on investment is critical to
help guide effective spending decisions. To this end, the RCSLT commissioned Matrix Evidence
to review the evidence and undertake an economic evaluation of providing SLT to three specific
groups – children with SLI, children with autism and stroke survivors – in order to pinpoint the
benefits generated by SLT for these cohorts in relation to the costs of provision.
Previous work has demonstrated the value of economic analysis to decision making.
Consideration of costs and the value of benefits may produce a different assessment of policies
than just considering the effect of a policy. For instance, a policy that was considered effective
may not have a positive net benefit.
In summary, the net benefits of SLT – which can be defined in terms of cost savings for health
and social care services, improved quality of life, and productivity gains – exceed the costs of its
provision.
Aim of the research
The aim of this research was to determine the economic value generated by SLT. Specifically,
the costs and benefits of SLT for the following four cohorts and conditions were assessed:
Adults with experience of dysphagia post-stroke
Adults with experience of aphasia post-stroke
Children with speech and language impairment (SLI)
Children with autism
Results
The results of the analysis indicate that SLT for all four cohorts and conditions represent an
efficient use of public resources. The net benefits of the interventions are positive and the
benefit-cost ratios are higher than 1. In other words, the benefits generated by the interventions
1 Royal College of Speech and Language Therapists (2010) Giving voice, viewed 23 November 2010.

The economic case for speech and language therapy
Matrix Evidence | December 2010 7
exceed their costs. Benefits considered in the analysis include health and social care cost
savings, quality of life, and productivity gains. The total annual net benefit across three
conditions (aphasia, SLI, and autism) is £765 million; dysphagia was excluded from this
calculation since the two post-stroke conditions are not mutually exclusive.
It is important to note that the analysis is necessarily based on a subset of the benefits
generated by SLT. For instance, the estimate of the benefit of SLT for stroke survivors with
communication problems does not include the effect on return to work. As a result, it is possible
that the analysis underestimate the benefit generated by SLT. Furthermore, this analysis only
includes SLT for four cohorts. Further analysis is required to estimate the value SLT generates
across all populations who benefit from it.
Dysphagia (swallowing problems following stroke)
Every £1 invested in low intensity SLT is estimated to generate £2.3 in health care cost
savings through avoided cases of chest infections.
In comparison to usual care by a non-specialised nurse, speech and language therapy
is estimated to prevent 4,300 cases of chest infections requiring hospital care, and
9,200 cases of chest infections requiring community care. This reduction in chest
infections results in health cost savings that exceed the cost of the SLT by £13.3 million.
Dysphagia is a swallowing disorder caused by neurological damage; symptoms include
difficulty swallowing food and liquids which can lead to health consequences.
It is estimated that approximately 63,000 adults per year in the UK suffer post stroke
dysphagia requiring SLT.
Further breakdown of the net benefits shows that the estimated annual net benefit is
£11.2m in England, £0.7m in Wales, £0.4m in Northern Ireland, and £1.1m in Scotland.
The economic analysis is likely to underestimate the benefits of speech and language
therapy. The benefits of SLT go beyond reduction in chest infections –e.g. improved
quality of life, avoidance of malnutrition, and death. Inclusion of these benefits is likely
to increase the net benefit.
Aphasia (communication problems following stroke)
Every £1 invested in enhanced SLT is estimated to generate £1.3 due to the monetary
benefit associated with a quality of life gain.
In comparison to routine SLT, enhanced SLT results in an estimated 0.057 Quality
Adjusted Life Years (QALY) gain per patient. The associated annual benefits are
estimated to exceed the cost of the enhanced SLT by £15.4 million.
Aphasia is a language disorder caused by neurological damage; symptoms include
difficulty with one or several forms of communication including speech, comprehension,
reading and writing.
It is estimated that around 53,000 adults per year in the UK suffer post stroke aphasia
requiring SLT.
The benefits of SLT are derived from reduced symptoms of aphasia leading to improved
ability to perform daily living activity and health related quality of life gains.

The economic case for speech and language therapy
Matrix Evidence | December 2010 8
Further breakdown of the net benefits shows that estimated annual net benefit is
£13.0m in England, £0.7m in Wales, £0.4m in Northern Ireland, and £1.3m in Scotland.
Speech and language impairment (SLI)
Every £1 invested in enhanced SLT generates £6.43 through increased lifetime
earnings.
In comparison to routine SLT, enhanced SLT is estimated to result in an additional
5,500 students achieving 5 or more GCSEs A*-C (or equivalent). The resulting benefit
of providing enhanced SLT for all children aged 6 to 10 who currently have SLI exceeds
the cost of the SLT by £741.8 million.
Continued implementation of SLT for those children entering this cohort – children with
SLI turning 6 years old – would generate a net benefit of £148.4 million per year in
subsequent years.
SLI is a condition involving disruption in one or several parameters of language: sound
system, signalling word endings, grammar, meaning and/or intended meanings.
It is estimated that approximately 203,000 children 6 to 10 years in the UK have SLI
requiring SLT.
The benefits of SLT are derived from improved communication leading to improved
educational achievement and in turn increased adult earnings.
Further breakdown of the net benefits shows that estimated annual net benefit is
£623.4m in England, £36.1m in Wales, £24.2m in Northern Ireland, and £58m in
Scotland.
Autism
Every £1 invested in enhanced SLT generates £1.46 through lifetime cost savings and
productivity gains.
In comparison to routine SLT, an enhanced SLT program targeting parent-child
interaction results in improved communication which increases future independence.
Increased independence results in a greater number of individuals living in private and
supported accommodation in adulthood, relative to residential and hospital settings. The
resulting benefit of providing enhanced SLT for children aged 2 to 4 who currently have
autism exceed the cost of the SLT by £9.8 million.
Continued implementation of SLT for those children entering this cohort – children with
autism turning 2 years old – would generate a net benefit of £3.3 million per year in
subsequent years.
Autism is a neurodevelopmental condition identified by the presence of behavioural
impairments: impaired social interaction, communication and social imagination. The
impairments are characterised by abnormalities in reciprocal social interactions and in
patterns of communication.
It is estimated that every year around 8,800 children aged 2 to 4 years in the UK have
core autism requiring SLT.
Further breakdown of the net benefits shows that the estimated annual net benefit is
£8.3m in England, £0.4m in Wales, £0.3m in Northern Ireland, and £0.8m in Scotland.

The economic case for speech and language therapy
Matrix Evidence | December 2010 9
Methods of the research
The research adopted the following stages:
A review of evidence available to estimate the benefits of SLT interventions within each
condition specified above.
The construction of decision models to perform cost-benefit analysis, a method for
comparing the costs and effects of an intervention in monetary terms.
Consultation with experts and members of the RCSLT throughout the research to
validate the evidence found and the economic models constructed.
The models were estimated assuming that the interventions are run once per annum –thus
estimated costs are per year. The benefits of the interventions for conditions experienced by
adults (i.e. dysphagia and aphasia) occur over one year, whilst the benefits of the interventions
for conditions experienced by children (i.e. SLI and autism) span over a much extended period
as the models convert short term outcomes into lifetime benefits. In accordance with H.M.
Treasury’s Green Book, a 3.5 per cent discount rate was applied to calculate the present value
of costs and benefits. Unless stated otherwise, all monetary figures are in 2009 prices.
As with any analysis of the costs and benefits of public policy, the results of the analysis are
subject to uncertainty. The models constructed to estimate costs and benefits drew on the
existing literature. Care was taken to draw on the best available evidence from the literature.
Inevitably, however, there remains uncertainty in the estimates generated by the analysis. The
results summarised above represent the best estimates that emerge from the analysis. Each of
these best estimates was subject to sensitivity analysis to determine the effect of the uncertainty
in the existing data on the results of the analysis. The sensitivity analysis provides some comfort
that the results of the analysis – that SLT represents a good use of public resources – is unlikely
to be impacted by this uncertainty.
Conclusion
The results of the economic analysis suggest that SLT for treating dysphagia, aphasia, SLI and
autism generates positive net benefits. Even though the estimated net benefits are subject to
uncertainty, the sensitivity analysis suggested that the conclusion that the interventions
represent an efficient use of public resources is unlikely to change.
Further, it is important to reiterate that the analysis is necessarily based on a subset of the
populations that benefit from SLT and the value generated by SLT. As a result, it is possible
that the analysis underestimates the benefit generated by SLT.

The economic case for speech and language therapy
Matrix Evidence | December 2010 10
2.0 Introduction
Communication is an essential life skill that enables independence, participation and individual
responsibility. Research commissioned by the Royal College of Speech and Language
Therapists (RCSLT) suggests that overcoming speech and language difficulties can contribute
to the generation of a number of important social outcomes, including: independence, health,
community participation, educational attainment, employment, and well-being (RCSLT, 2009a).
Despite the evidence for its beneficial outcomes, in the current economic climate the reductions
in the size of public sector budgets in the short- and medium-term mean that speech and
language therapy (SLT) is at risk of marginalisation and funding cuts. In this context, Matrix
Evidence was commissioned by the RCSLT to undertake research into the economic case for
SLT.
The value of economic analysis to decision making has been demonstrated elsewhere (Chalfin
et al, 2008). For instance, a policy or intervention that generates a positive effect may still not
represent an efficient use of resources if it does so at a high cost. It is, thus, important to
consider both the cost of an intervention and the value of the effect it generates.
Speech and language interventions may address a variety of problems and adopt multiple types
of therapies. A case study approach was therefore adopted, where the analysis focused on the
special case of a set of conditions. The conditions were chosen based on the following criteria:
Services that were perceived to be under threat from the current austerity measures,
and for which evaluation of cost-effectiveness and value of money would be most
useful.
Conditions which are less understood in terms of the value of SLT intervention and may
be considered as high cost.
Conditions that fulfilled the criteria above, and where the necessary data was available
to carry out the analysis.
Based on the above criteria, the following conditions were selected:
Adults with experience of dysphagia post-stroke
Adults with experience of aphasia post-stroke
Children with speech and language impairment (SLI)
Children with autism
For each condition, an evaluation of the costs and benefits of a SLT intervention was
undertaken. The interventions evaluated compare either: (a) the effects of SLT with the effects
of alternative forms of treatment; or (b) the effects of more intensive SLT with the effects of less
intensive SLT.

The economic case for speech and language therapy
Matrix Evidence | December 2010 11
More specifically: the following interventions were evaluated:
SLT for dysphagia post-stroke patients compared with usual care.
Enhanced National Health Service (NHS) SLT for aphasia post-stroke patients
compared with usual NHS SLT.
Enhanced SLT for children with SLI compared with existing SLT provision.
Enhanced SLT for children with autism compared with usual SLT treatment.
Costs and benefits are presented for different geographical areas, including: (a) the United
Kingdom (UK); (b) the four constituent countries (England, Wales, Scotland and Northern
Ireland); and (c) local areas within each of the countries. In consultation with key stakeholders,
the following local areas were selected for each country: strategic health authorities for England
(10), unitary local authorities for Wales (22), local authorities for Scotland (32), local
commissioning boards for Northern Ireland (5),
The effects of the interventions were expressed in monetary terms and compared against the
cost of delivery to obtain a measure of the net benefits derived from the interventions.
Depending on the nature of the outcomes achieved, the effects of the interventions were
expressed in monetary terms by estimating the resulting health and social care cost savings or
quality of life gains.
This report presents the methodology and findings of the research. The report is structured as
follows. The next section presents the overall methodological approach used. Each of the
interventions is then addressed in a separate section providing: a description of the intervention
for each condition, the nature of the expected benefits generated by the interventions, and the
findings from the economic analysis. Section 8 discusses the implications of the findings.

The economic case for speech and language therapy
Matrix Evidence | December 2010 12
3.0 Methodological approach
3.1 Conceptual model
Each of the four SLT interventions was assessed using a cost-benefit analysis (CBA). A CBA
compares the costs and effects of an intervention, all expressed in monetary terms. Therefore,
a CBA is built upon the following three elements:
The effects of the intervention, expressed in natural units (e.g. number of cases).
The costs associated with the intervention.
The benefits of the intervention –i.e. the monetary value of the effects generated by the
intervention.
Following best practice, decision models were built to assess the costs and benefits of the
interventions. Building these models required understanding the interventions, the targeted
populations, and the nature of the expected benefits – i.e. the effect of the interventions and the
logic of how these generate benefits. The structures of the decision models built for each
intervention are presented in Appendix 2.
The following costs and benefits were included in the models:
Direct costs: running cost of delivering the interventions.
Benefits: these vary depending on the nature of the intervention but generally refer to
health and social care cost savings and quality of life gains.
3.2 Data collection
Given the multiplicity of effects and benefits considered, data used to populate the models was
collected from a wide range of sources. The following sources were used:
Effect data was obtained from a literature review for each condition provided by the
RCSLT and through consultation with SLT experts. The literature reviews are part of a
range of tools produced by the RCSLT to support leaders with the planning,
commissioning and delivery of services in line with government and local priorities.2
Based on the literature identified, the best available evidence was selected for
modelling each intervention. The criteria for selecting the best available effectiveness
studies included:
o methodological quality: randomised controlled trial (RCT) studies were
preferred to less rigorous methods;
o country of study: where available UK studies were preferred;
o year of publication: where possible recent studies were selected.
2 For further details visit:
http://www.rcslt.org/speech_and_language_therapy/commissioning/resource_manual_for_commissioning_and_planning_services

The economic case for speech and language therapy
Matrix Evidence | December 2010 13
The selection of the effect studies was validated by key stakeholders through a workshop
ran by Matrix. The studies used in the analysis are outlined in Table 1.
Table 1. Effectiveness study selected for each condition
Condition Study Intervention Counterfactual
Dysphagia Carnaby et al
(2006)
Low intensity SLT:
0.80 hours per week for one
month
Usual care by clinical staff:
0.30 hours per week for one month
Aphasia Bakheit et al
(2007)
Enhanced NHS SLT:
1.6 hours per week for 12 weeks
Usual NHS SLT:
0.57 hours per week for 12 weeks
SLI Boyle et al
(2007)
Enhanced SLT:
3 sessions per week for 15 weeks
(mean number of attended
session 38)
Existing provision:
8 sessions (mean) of SLT in 15
weeks
Autism Green et al
(2010)
Enhanced SLT:
2 hours of parent and child
sessions per 2 weeks for 6
months
2 hours of booster sessions per
month for 6 months
9.8 hours (mean) of SLT
treatment as usual in one year
Treatment as usual:
9.5 hours (mean) of SLT in one
year
A more detailed summary of the main characteristics of each study is presented in
Appendix 1.
Cost estimates were calculated based on data on: the resources required for delivering
the interventions, as specified in the effectiveness studies, and unit cost data produced
by the Personal Social Services Research Unit (PSSRU). Salary bands correspond to
the level of the professionals delivering the interventions, as per current practice.
Benefit estimates were calculated by translating the effect data from the above studies
into monetary benefits using literature provided by SLT experts and identified through
Google Scholar searches. Details on the sources of data used and the calculations
made are provided in the data tables for each intervention, included in Appendix 2.
3.3 Models and presentation of results
The models were run for all potential beneficiaries –that is, the population experiencing the
conditions– in England, Wales, Scotland, and Northern Ireland. All monetary figures are in 2009
prices. Where the benefits of the interventions extend over more than one year, in accordance
with Green Book guidance, a 3.5 per cent discount rate was applied to calculate the present
value of the benefits.

The economic case for speech and language therapy
Matrix Evidence | December 2010 14
Inevitably, the parameters required to populate the models are subject to uncertainty. The
models were put through a series of iterations to examine the effect of variations in key
parameters on the results.
The next four sections are devoted to each of the interventions. They provide the following
information:
Key messages from the CBA.
A description of the intervention in terms of targeted population and services provided.
The nature of the expected benefits – i.e. the effect of the interventions and the logic of
how these generate benefits.
The findings from the economic analysis, including:
o findings;
o sensitivity analysis; and
o assumptions.
Key messages are presented using two indicators that synthesise the results of the CBAs:
The net benefit, which is calculated as the total benefits attributed to the intervention
minus the total costs of implementing the interventions to all potential beneficiaries. The
net benefit value shows the overall magnitude of the interventions. Values higher than
zero indicate that the benefits exceed the costs, and thus the intervention represents an
efficient use of public resources. The net benefit is an aggregate measure and, as such,
its magnitude changes with the size of the population receiving the intervention. For
each intervention, an aggregate figure for the UK population is presented. Figures for
each of the four countries and by local area are included in Appendix 3.
The benefit-cost ratio, which is calculated as the ratio of benefits to costs. The benefit-
cost ratios show the potential return for every £1 investment. Values higher than one
indicate that the benefits exceed the costs, and thus the intervention represents an
efficient use of public resources. The benefit-cost ratio is a unit measure and does not
change with the size of the population receiving the intervention.
The net benefit at the local level is estimated by applying the unit cost and benefits of the
intervention to the populations eligible to receive the intervention at different geographical
levels. The estimates, therefore, assume that types of care and prevalence rates are constant
across different areas. The estimate of population eligible is based on local level population
estimates broken down by age. Thus the demographic differences across areas are taken into
account. The country level benefits are estimated by aggregating the local level figures.

The economic case for speech and language therapy
Matrix Evidence | December 2010 15
4.0 Dysphagia post-stroke
Key messages
The intervention
Dysphagia is a swallowing disorder caused by neurological damage affecting many patients
post-stroke. Patients suffering from dysphagia have difficulty swallowing food and liquids, which
can result in serious consequences –e.g. choking, malnutrition, aspiration pneumonia and
death.
For patients who do not recover from dysphagia spontaneously, speech and language
therapists provide them with tailored patient specific therapy. SLT involves assessment and
diagnosis of dysphagia, teaching the patient how to manage the condition, and working with
other clinical staff to achieve optimal levels of nutrition and hydration. The importance of SLT
has been recognised in national and international practice guidelines (RCSLT, 2009a).
The CBA focused on SLT for treatment (as opposed to diagnosis) of dysphagia in post-stroke
patients. The aim of the CBA was to estimate the cost and benefit of dysphagia treatment
delivered by a speech and language therapist compared to alternative treatment. The relative
benefit of treatment delivered by a speech and language therapist was estimated based on
evidence provided by Carnaby et al (2006).
Carnaby et al (2006) analysed a sample of 306 patients in Australia admitted to a hospital for
stroke within the previous seven days and diagnosed with dysphagia using the Paramatta
Hospital assessment of dysphagia. Patients were randomly assigned to routine care, low
intensity SLT, and high intensity SLT. Routine care was defined as management of dysphagia
In the UK the annual benefits generated by SLT compared to usual NHS care for post
acute stroke dysphagia (swallowing problems) patients exceed the annual cost of the
therapy by £13.3 million.
Every £1 invested in SLT generates £2.3 in health care cost savings through avoided
cases of chest infection.
These estimates refer to SLT delivered to around 63,000 people experiencing the
condition post stroke and in need of treatment in England, Wales, Scotland and
Northern Ireland.
The potential benefits of SLT are underestimated. The benefits of SLT are multiple in
nature and go beyond avoidance of chest infections. Additional benefits may include
improved quality of life, more specifically the ability to return to normal diet, functional
swallowing, and avoidance of malnutrition, and death. The implications of this limited
scope are that the benefits are likely to be underestimated and therefore the net
benefits generated by the interventions could be greater.

The economic case for speech and language therapy
Matrix Evidence | December 2010 16
by clinical (non-specialised) staff as per usual practice for one month. At the workshop held by
Matrix to validate selected studies, experts recognised SLT practice in Australia as a relatively
valid comparator in a UK setting. Although SLT assistants in Australia and UK are different in
terms of their qualifications, it is assumed that the effect size they generate in patients’
outcomes is the same. For the purpose of the decision model clinical (non-specialised) staff was
assumed to be an NHS day ward nurse. Low intensity SLT involved “swallowing compensation
strategies, mainly environmental modifications, safe swallowing advice, and appropriate dietary
modification” with a SLT three times a week for one month. High intensity SLT was the same as
low intensity, but every day for one month.
The effect of the alternative forms of treatment was measured in terms of dysphagic-related
complications –specifically chest infections. High intensity SLT had no statistically significant
effect over and above low intensity SLT. Therefore low intensity SLT was selected for the
purpose of the decision model. Carnaby et al (2006) estimated that the probability of developing
a chest infection with SLT is 25 percent, compared to 47 per cent with routine care. That is,
treatment delivered by a speech and language therapist, compared to routine care, reduces
likelihood of a chest infection by 22 percentage points. It is estimated that the cost per patient of
SLT is £219, compared to a cost £58 in routine care (calculations are available in Table A2.1 in
Appendix 2).
A reduction in the number of chest infections leads to health care and community care cost
savings associated with the treatment of the infection. A chest infection requires hospital
treatment in 32 per cent of cases and community care is required in the remaining 68 per cent
of cases (Guest and Morris, 1997). It is estimated that a chest infection requiring hospital
treatment costs £5,084, while a chest infection requiring community care costs £150. Hospital
treatment is significantly higher due to increased in-patient days (Matrix based on Guest and
Morris, 1997).
Summary of findings
Table 2 summarises the findings from the CBA of SLT in approximately 63,000 dysphagia post-
stroke patients in need of treatment across England, Wales, Scotland and Northern Ireland.
Annual costs and monetary benefits in both scenarios, routine care and SLT, are presented
separately. The differences represent the incremental costs and monetary benefits attributable
to SLT.

The economic case for speech and language therapy
Matrix Evidence | December 2010 17
Table 2. Annual costs and benefits of SLT for dysphagia patients in England, Wales,
Scotland and Northern Ireland (£m in 2009 prices)
£ in 2009 prices Routine care SLT Difference
Costs
Cost of SLT £0m £13.8m -£13.8m
Cost of routine care £3.7m £0m £3.7m
Total -£10.1m
Monetary benefits
Cost of chest infection requiring
hospital admission £48.2m £26.1m £22.1m
Cost of chest infection requiring
community care £3.0m £1.6m £1.4m
Total £23.5m
Net benefit £13.3m
Benefit-cost ratio 2.32
Throughput
Incidence of stroke is 0.26 per cent across all age groups (Carroll et al, 2001).
78 per cent of stroke patients suffer from some form of dysphagia (RCSLT, 2009a).
51 per cent of patients suffering from dysphagia require SLT (Mann et al, 1999).
Therefore, the incidence of dysphagia requiring treatment is 0.10 per cent.
Local level population estimates from England3, Wales
4, Scotland
5, and Northern
Ireland6 were aggregated resulting in a total population of 61 million. Applying the
incidence of dysphagia to the total population, the estimated population suffering from
dysphagia post-stroke is over 63,000.
It is estimated that SLT results in approximately 4,300 avoided cases of chest infection
requiring hospital care and 9,200 avoided cases of chest infection requiring community
care.
Costs
It is estimated that the cost per patient of SLT is £219. The total amount of SLT was 7.8
sessions; each session was 24.8 minutes, which is equivalent to 3.22 hours. (Carnaby
et al, 2006). A cost of £67 per hour client contact with a hospital speech and language
therapist Band 7 was used to arrive at this estimate (Matrix based on PSSRU, 2009).
It is estimated that the cost per patient of routine care is £58. The total amount of time
with NHS staff was 4.8 sessions; each session was 16 minutes, which is equivalent to
3 NHS Information Centre (2008) Attribution Dataset GP Registered Populations. 4 Ibid.
5 Office for National Statistics (2001) Area and population by local authority (Scotland): Regional Trends 37.
6 Department of Health Social Services and Public Safety (2009)

The economic case for speech and language therapy
Matrix Evidence | December 2010 18
1.28 hours. (Carnaby et al, 2006). A cost of £45 per hour client contact with a NHS
hospital day ward nurse was used to arrive at this estimate (Matrix based on PSSRU,
2009).
The incremental cost of SLT compared to routine care for all patients with dysphagia
post-stroke is estimated to be £10.1 million.
Monetary benefits
A chest infection requiring hospital treatment costs £5,084 (Guest and Morris, 1997).
A chest infection requiring community care costs £150 (Guest and Morris, 1997).
It is estimated that health and community care cost savings generated by SLT due to
reduced cases of chest infection amount to £23.5 million.
Country level analysis
Table 3 presents the result for the CBA of SLT for dysphagia post-stroke patients in need of
treatment disaggregated by country.
Table 3. Annual cost and annual benefits of SLT for dysphagia post-stroke patients
disaggregated by country (£m in 2009 prices)
Country Dysphagia
patients
Total cost Total benefit Total net benefit
England 52,700 £8.5m £19.7m £11.2m
Wales 3,100 £0.5m £1.1m £0.7m
Scotland 5,300 £0.9m £2.0m £1.1 m
Northern Ireland 1,800 £0.3m £0.7m £0.4m
Total 62,900 £10.1m £23.5m £13.3m
The results from the local level analysis indicate that:
Annual net benefits in England range from £561k in the North East strategic health
authority to £1.7m in London.
Annual net benefits in Wales range from £12k in the Merthyr Tydfil unitary health
authority to £71k in Cardiff.
Annual net benefits in Scotland range from £4k in the Orkney Islands local authority to
£128k in Glasgow City.
Annual net benefits in Northern Ireland range from £65k in the Western local
commissioning board to £99k in the Northern commissioning board.
More detail on local level analysis can be found in Table A3.1 in Appendix 3.

The economic case for speech and language therapy
Matrix Evidence | December 2010 19
Sensitivity analysis
A few parameters used in the model are subject to varying degrees of uncertainty. Therefore,
additional analysis was undertaken to observe the sensitivity of the net benefit to a change in
the model parameters. The sensitivity analysis suggests that the results of the model are robust
–i.e. the conclusion that investing in SLT represents an efficient use of public resources does
not change.
Table 4 summarises the parameters that were tested along with the ranges used for the
sensitivity analysis. Figures 1 and 2 show the impact on net benefit.
Table 4. Sensitivity analysis
Parameter Value in model Sensitivity analysis range
Low High
Probability of chest infection with SLT 25% 25% 40%
Cost of chest infection requiring
hospital admission £5,084 £1,800 £5,100
Figure 1 demonstrates that, holding all other parameters constant, the net benefit remains
positive as long as the probability of developing a chest infection with SLT is below 38 per cent,
compared with a probability of 47 per cent following routine care.
Figure 1. Sensitivity of net benefit to probability of chest infection for patients with
dysphagia receiving SLT

The economic case for speech and language therapy
Matrix Evidence | December 2010 20
Figure 2 demonstrates that, holding all other parameters constant, the net benefit remains
positive as long as the major health care cost avoided by the intervention –i.e. the cost per
chest infection requiring hospital admission– is above £2,000. This figure is considerably below
the value used in the model (£5,084 per patient).
Figure 2. Sensitivity of net benefit to cost per case of chest infection requiring hospital
admission
Key assumptions
The effect of SLT was measured in terms of avoided cases of chest infection due to
dysphagia. The term chest infection can be used to describe a number of different
conditions. To calculate the health care costs associated with a chest infection it was
assumed that a chest infection due to dysphagia is similar in treatment to community
acquired pneumonia.
The probability that a chest infection requires either hospital or community care was
based on descriptive data not specific to dysphagia patients. It was assumed that for
patients with a chest infection due to dysphagia the same probabilities of requiring
either hospital or community care as for the general population apply.
Treatment costs associated with community acquired pneumonia were obtained from
Guest and Morris (1997). After consultation with a medical expert it was assumed that
the management of community acquired pneumonia has not changed since 1997 and
that cost data could be used after being adjusted to 2009 prices.
It was assumed that routine care was provided by a nurse in a day ward. If a more
specialised nurse provided care the unit cost would be higher, and the incremental cost
of the intervention would be lower. In that scenario, the net benefit would be higher –i.e.
these figures potentially underestimate the net benefit.
The benefit is evaluated for an average of 48 minutes of SLT per week over 4 weeks.
Dysphagia SLT treatment often occupies more time than this; the intervention evaluated
£(2)
£0
£2
£4
£6
£8
£10
£12
£14
£16
£1,800 £2,100 £2,400 £2,700 £3,000 £3,300 £3,600 £3,900 £4,200 £4,500 £4,800 £5,100
Ne
t B
en
efi
t (£
m)
Cost per case of chest infection requiring hospital admission

The economic case for speech and language therapy
Matrix Evidence | December 2010 21
here represents the lower end of the range. This implies that both the cost and benefit
of the intervention may be underestimated.

The economic case for speech and language therapy
Matrix Evidence | December 2010 22
5.0 Aphasia post stroke
Key messages
The intervention
Aphasia is a language disorder caused by neurological damage affecting almost one third of
patients post-stroke. The severity of the condition is dependent on the location and size of the
area of the brain damaged. Patients suffering from aphasia can have difficulty with one or
several forms of communication including speech, comprehension, reading and writing.
Speech and language therapists provide persons with aphasia with tailored patient specific
therapy. SLT attempts to help patients better manage the condition by: teaching strategies that
are accessing language, strengthening remaining language abilities, restoring lost abilities,
teaching other methods of communication, and teaching others (e.g. family, health staff) ways
to improve communication with the patient (RCSLT, 2009b).
The CBA focused on SLT for treatment of aphasia in post acute stroke patients. The aim of the
CBA was to estimate the cost and benefit of SLT compared with no SLT. Due to limited
evidence, the CBA estimates the cost and benefit of enhanced NHS SLT compared to usual
NHS SLT. The relative benefit of additional treatment delivered by a speech and language
therapist was estimated based on evidence provided by Bakheit et al (2007).
Bakheit et al (2007) analysed a sample of 116 patients in England admitted to a hospital for first
ever stroke and diagnosed with aphasia using the Frenchay Aphasia Screening test and the
In the UK the annual benefits generated by an extra hour of SLT per week for 12 weeks
for post acute stroke aphasia (communication problems) patients exceed the annual
cost of the therapy by £15.4 million.
Every £1 invested in SLT generates £1.3 –the equivalent in monetary terms to the
benefit generated in terms of quality adjusted life years.
These estimates refer to SLT delivered to over 53,000 people experiencing the
condition post stroke in England, Wales, Scotland and Northern Ireland.
These results should be treated with caution given uncertainty in the estimated
benefits. Improved communication certainly has benefits in terms of quality of life –
e.g. improved communication, reduced stress, and less dependence on others.
However, quantifying this benefit required several assumptions to be made. Sensitivity
analysis indicates that the conclusion of the analysis –that the intervention is cost-
effective and an efficient use of resource– is not impacted by this uncertainty.

The economic case for speech and language therapy
Matrix Evidence | December 2010 23
Western Aphasia Battery (WAB) test. The WAB is an instrument used to diagnose the severity
of aphasia by testing language function through sub tests in areas such as fluency,
comprehension, reading, and writing. Scores on each subset are weighted to calculate an
Aphasia Quotient which ranges between 0 and 100 (Wertz et al, 1984). Patients were randomly
assigned to usual NHS SLT, enhanced NHS SLT, and intensive NHS SLT. Usual NHS SLT
care was defined as management of aphasia by a NHS SLT as per usual practice for 2 hours a
week for 12 weeks. In practice, however, usual NHS SLT was 0.57 hours of SLT per week.
Enhanced NHS SLT was defined as SLT for 2 hours a week for 12 weeks. In practice enhanced
NHS SLT was 1.6 hours of SLT per week. Intensive NHS SLT was defined as five hours a week
for 12 weeks. In practice intensive NHS SLT was 3 hours per week.
The effect of increased amount of treatment was measured in terms of improved performance in
the WAB test. Intensive NHS SLT had no significant effect over and above enhanced NHS SLT.
Therefore enhanced NHS SLT was selected for the purpose of the decision model. Bakheit et al
(2007) estimated that in patients receiving usual NHS SLT the WAB test score improved by 43
per cent while in patients receiving enhanced NHS SLT the WAB test score improved by 79 per
cent. That is, enhanced NHS SLT, compared to usual NHS SLT, increases performance in WAB
test by 36 percentage points. It is estimated that the cost per patient of enhanced NHS SLT is
£1,313 while the cost per patient of usual NHS SLT therapy is £469 (calculations are available
in Table A2.2 in Appendix 2).
Higher performance on the WAB test has implications in terms of quality of life and
independence. For the purpose of estimating the benefit of enhanced NHS SLT compared to
usual NHS SLT, improvement in the WAB test was translated into increased Quality Adjusted
Life Years (QALY)7. A number of steps were required to convert the improvement in the WAB
test into a QALY gain. First, the mean WAB score in Bakheit (2007) was converted into a
different aphasia scale, developed by Wade et al (1985). This conversion relied on the
assumption that both scales have a similar distribution. Second, based on data provided by
Wade et al (1985), a correlation between the aphasia scale and the Barthel Index (BI) was
derived. The BI is a tool used to measure the ability of patients to perform daily living activity.
Third, a paper by Exel et al (2004) was used to determine the relationship between the BI and
QALY values. In sum, the QALY gain was obtained by converting aphasia scores into ability to
perform daily living, and then into QALY values. More details on the steps applied can be found
in Table A2.2 in Appendix 2.
The QALY gain was expressed in monetary terms by using the value associated with a QALY –
£20,000. This corresponds to the lower end of the range of QALY values implicit in the decision
making process followed by the National Institute of Health and Clinical Excellence (NICE) and
commonly used in economic evaluations valuing health outcomes.
7 A QALY is a standardised measure of health gain widely used in health economics. It comprises two dimensions: time
and quality of life. The latter is measured on a scale between 0 (death) and 1 (perfect health). For instance, 1 year if perfect health is measured as 1 QALY. The advantage of this scale is twofold: not only does it allow different health effects to be expressed on a single scale; but there are also accepted monetary values for QALYs that allow these effects to be expressed in monetary values (£).

The economic case for speech and language therapy
Matrix Evidence | December 2010 24
Summary of findings
Table 5 summarises the findings from the CBA of SLT for about 53,000 aphasia patients across
England, Wales, Scotland and Northern Ireland. Annual costs and monetary benefits in both
scenarios, usual NHS SLT and enhanced NHS SLT, are presented separately. The differences
represent the incremental costs and monetary benefits attributable to SLT.
Table 5. Annual costs and benefits of SLT for aphasia post-stroke patients (£m in 2009
prices)
£ in 2009 prices Usual
NHS SLT
Enhanced
NHS SLT Difference
Costs
Cost of enhanced NHS SLT £0m £69.2m -£69.2m
Cost of usual NHS SLT £24.8m £0m £24.8m
Total -£44.5m
Monetary benefits
QALY gain in £’s £126.6m £186.5m £59.9m
Total £59.9m
Net benefit £15.4m
Benefit-cost ratio 1.35
Throughput
Incidence of stroke is 0.26 per cent across all age groups (Carroll et al, 2001).
One third of stroke patients suffer from some form of aphasia (RCSLT, 2009b).
Therefore, the incidence of aphasia is 0.09 per cent.
Local level population estimates from England8, Wales
9, Scotland
10, and Northern
Ireland11
were aggregated resulting in a total population of 61 million. Applying the
incidence of aphasia to the total population, the estimated population suffering from
aphasia post-stroke is about 53,000.
Costs
It is estimated that the cost per patient of enhanced NHS SLT is £1,313. The total
amount of SLT was 19.3 hours over 12 weeks. (Bakheit et al, 2007). A cost of £67 per
hour client contact with a community speech and language therapist Band 7 was used
to arrive at this estimate (Matrix based on PSSRU, 2009).
8 NHS Information Centre (2008) Attribution Dataset GP Registered Populations. 9 Ibid.
10 Office for National Statistics (2001) Area and population by local authority (Scotland): Regional Trends 37.
11 Department of Health Social Services and Public Safety (2009)

The economic case for speech and language therapy
Matrix Evidence | December 2010 25
It is estimated that the cost per patient of usual NHS SLT is £469. The total amount of
SLT was 6.9 hours over 12 weeks. (Bakheit et al, 2007). A cost of £67 per hour client
contact with a community speech and language therapist Band 7 was used to calculate
this estimate (Matrix based on PSSRU, 2009).
The incremental cost of enhanced NHS SLT compared to usual NHS SLT for all
patients with aphasia post-stroke is estimated to be £44.5 million.
Monetary benefits
Enhanced NHS SLT results in an incremental QALY gain per patient of 0.057.
It is estimated that the value of the QALY gain generated by enhanced NHS SLT
compared to usual NHS SLT associated with improved communication in post-stroke
aphasia patients amounts to £59.9 million.
Country level analysis
Table 6 presents the result for the CBA of SLT for aphasia post-stroke patients disaggregated
by country.
Table 6. Annual cost and annual benefits of SLT for aphasia post-stroke patients
disaggregated by country (£m in 2009 prices)
Country Dysphagia
patients
Total cost Total benefit Total net benefit
England 44,200 £37.2m £50.2m £13.0m
Wales 2,600 £2.2m £2.9m £0.7m
Scotland 4,400 £3.7m £5.0m £1.3m
Northern Ireland 1,500 £1.3m £1.7m £0.4m
Total 53,000 £44.4m £59.8m £15.4m
The results from the local level analysis indicate that:
Annual net benefits in England range from £650k in the North East strategic health
authority to £1.9m in London.
Annual net benefits in Wales range from £14k in the Merthyr Tydfil unitary health
authority to £82k in Cardiff.
Annual net benefits in Scotland range from £5k in the Orkney Islands local authority to
£146k in Glasgow City.
Annual net benefits in Northern Ireland range from £75k in the Western local
commissioning board to £114k in the Northern commissioning board.
More detail on local level analysis can be found in Table A3.2 in Appendix 3.

The economic case for speech and language therapy
Matrix Evidence | December 2010 26
Sensitivity analysis
A few parameters used in the model are subject to varying degrees of uncertainty. In particular,
additional analysis was undertaken to observe the sensitivity of the net benefit to a change in
the percentage improvement in the WAB test following standard SLT and a change in the
incremental QALY gain. The sensitivity analysis suggests that the results of the model are
robust –i.e. the conclusion that investing in SLT represents an efficient use of public resources
does not change.
Table 7 summarises the parameters that were tested along with the ranges used for the
sensitivity analysis. Figures 3 and 4 show the impact on the net benefit.
Table 7. Sensitivity analysis
Parameter Value in model Sensitivity analysis range
Low High
Incremental QALY gain 0.057 0.040 0.058
Percentage improvement in WAB test
following standard SLT 79% 70% 80%
Figure 3 demonstrates that, holding all other parameters constant, the net benefit remains
positive as long as the percentage improvement in the WAB test following enhanced NHS SLT
is above 72 per cent, compared to 79 per cent used in the model. The percentage improvement
following usual NHS SLT was 43 per cent; therefore, the net benefit remains positive as long as
those under enhanced NHS SLT perform 29 percentage points above the usual NHS SLT
group.
Figure 4 demonstrates that, holding all other parameters constant, the net benefit remains
positive as long as the incremental QALY gain is above 0.042, compared with a value of 0.057
used in the model.

The economic case for speech and language therapy
Matrix Evidence | December 2010 27
Figure 3. Sensitivity of net benefit to percentage improvement in WAB test in patients
with aphasia post-stroke receiving standard SLT
Figure 4. Sensitivity of net benefit to QALY gain in patients with aphasia post-stroke
receiving SLT

The economic case for speech and language therapy
Matrix Evidence | December 2010 28
Key assumptions
A number of steps were required to translate the improvement in the WAB test into a
QALY gain. These steps required the assumptions outlined below. More details can be
found in Table A2.2 in Appendix 2.
The aphasia test used in Wade et al (1985) was different from the aphasia test used to
measure the effect of the intervention –i.e. the WAB test. However, both exams have
similar methods of measuring language impairment; therefore it was assumed both
tests are comparable and that they have a similar distribution.
The aphasia test in Wade et al (1985) is rated on a scale of 0-20. The paper states that
a score of 14 and below is associated with a BI score of 8.6, and a score of 15 and
above is associated with a BI score of 12.8. Using this data, a linear relationship was
assumed between the aphasia test and the BI.
Exel et al (2004) provide data on bands of BI scores and equivalent QALY values.
Based on this data, a linear relationship was assumed between BI and QALYs.
Our research has not examined the costs and benefits of longer term speech and
language therapy or interventions at a later stage, which may both add to the costs and
benefits. It also does not include the wider benefits of aphasia, such as return to
employment after stroke in working age individuals.

The economic case for speech and language therapy
Matrix Evidence | December 2010 29
6.0 Children with speech and language impairment
Key messages
The intervention
Speech and language impairment (SLI) is a varied condition affecting as many as 15 per cent of
children, depending on the exact definition of the condition and the age group considered. A
median prevalence estimate is 5.9 per cent from birth to 7 years (Law et al, 1998). The
condition involves a disruption in one or several parameters of language: sound system,
signalling word endings, grammar, meaning and/or intended meanings. Depending on the area
of language affected, an individual can be classified as having a speech or a language
impairment, or both. SLI can present as a delay or a disorder, the former being characterised by
development that is behind but following normal developmental pattern, and the latter by a
pattern of development that differs from the norm. In practise the two conditions can be difficult
to distinguish, particularly in early childhood. The condition is also often present with secondary
conditions such as autistic, cognitive or learning impairments. SLI can impact the life of the
individual in many ways. The restricted ability to understand and be understood in the
communicative environment can cause concern and upset, behavioural problems, and impact
the individual’s ability to access education and employment (if needs continue into adulthood),
and prevent them from fully participating in society (RCSLT, 2009c).
Speech and language therapy for SLI aims to prevent the development of the condition and to
work on developing language skills appropriate to the age of the individual (RCSLT, 2009c).
In the UK the benefits in terms of increased lifetime earnings generated by around 15
additional hours of SLT over a period of 15 weeks for children 6 to 10 years with
speech and language impairment exceed the cost of the therapy by £741.8 million.
Every £1 invested in the SLT intervention generates £6.4 in lifetime earnings.
These estimates refer to SLT delivered to over 203,000 children experiencing the
condition in England, Wales, Scotland and Northern Ireland.
These results should be treated with caution given uncertainty in the estimated
benefits. Improved communication skills have multiple benefits for individuals with
SLI, including increased access to curriculum. However, the nature of the existing
evidence base means that any quantification of this benefit is subject to uncertainty.
Sensitivity analysis indicates that it is likely that the conclusion of the analysis – that
the intervention is cost-effective and an efficient use of resource – is not impacted by
this uncertainty. It is also important to note that the analysis covers only the benefits
generated by education. It does not capture additional benefits such as improved
quality of life, social inclusion or mental health gains.

The economic case for speech and language therapy
Matrix Evidence | December 2010 30
The SLT package is tailored to the specific needs of the patient and the areas of speech or
language that require most support. For children of school age, the package aims to support
access to curriculum and provide advice on social interaction in different settings in and out of
school. The intervention can be delivered by a qualified speech and language therapist (direct
intervention) or by those most in contact with the individual (indirect intervention), and can be
provided individually or to a group of individuals with similar needs.
The CBA focused on the treatment of SLI for primary school aged children. While speech and
language difficulties are more common in younger children, the spontaneous remission rate of
around 50-60 per cent makes it more problematic to reliably analyse cost-effectiveness of
speech and language therapy (Boyle et al 2007). If speech and language difficulties persist to
the age of 5 years, then it is highly probable that, if not treated, problems continue through
school, having long term consequences on the educational experience of the individual. The
focus of the CBA is therefore on a group with potentially more severe impairment than if the
analysis was carried out using a younger population. This can have an overestimating effect on
the net benefit. The intervention evaluated in the CBA is based on evidence provided by Boyle
et al (2007) on treatment of language impairment. This introduces uncertainty into the analysis,
as the impact of enhanced SLT on children with a primary speech impairment may be different.
Boyle et al (2007) undertook an RCT of provision of SLT for children aged 6 to 11 years with
primary language impairment. The trial examined direct/indirect versus individual/group therapy
modes together with a control group which received existing levels of community based SLT.
The intervention consisted of 45 SLT sessions of 30 minutes, scheduled three times per week
for 15 weeks. Due to compliance rate of less than 100 per cent, the mean number of sessions
attended was 38. For the control group, the mean number of contacts was 8. Due to the nature
of SLT, the content of the sessions varied by participant. However, the intervention received
was based on a therapy manual produced at the beginning of the study. Therefore, while the
exact activities children engaged with varied across individuals and groups, they were all
consistent with a unified approach. The main outcome measure was standardised scores on
tests of expressive and receptive language.
The study found no significant difference between the direct and indirect modes of therapy and
between the individual and group modes. There was however evidence of a significant
difference in the post-intervention expressive language scores between groups receiving
therapy and the control group, suggesting a benefit in the increase in provision of therapy. The
effect size chosen for the CBA was for direct therapy relative to control group, in order to
capture more accurately the effect of a qualified speech and language therapist. The indirect
therapy modes were also less desirable for the model as the assistants used in the trial were all
psychology graduates. This is not representative of typical practise and the effect of the therapy
might be overestimated if the background of the assistants makes them more qualified for the
role. To cost the intervention, it was assumed that the therapists were Band 7. This introduces a
potential inconsistency, as the speech and language therapists used in the RCT are described
as Band 2. Because of the harmonisation of the banding introduced in 2004 by the Agenda for
Change reform, it is not clear how the banding referred to in Boyle et al (2007), using a pre-
2004 scale, translates to current bands. After discussions with the RCSLT, it was concluded

The economic case for speech and language therapy
Matrix Evidence | December 2010 31
that Band 2 corresponds to both current Band 6 and the lower end of Band 7. Evaluating costs
using Band 7 therefore potentially overestimates the cost of the intervention and thus
underestimates its net benefit. As the effect size is for direct therapy (i.e. all therapists were
qualified), the cost of the intervention is not adjusted for the use of assistants.
Improved language facilitates access to curriculum and creates opportunity for greater
academic attainment. Descriptive data on pupil progress (DFES, 2003) suggests that students
who perform at a higher level at Key Stage 2 (KS2) assessments at 11 years tend to perform
better at Key Stage 3 (KS3) at the age of 14. Good performance at KS3 tends to be associated
with a better average performance at the General Certificate of Secondary Education (GCSE)
exams, which in turn is associated with higher expected earnings (Cummings et al, 2007).
Therefore one of the long run benefits of SLT is the increased lifetime earning potential for the
individual. Academic attainment was chosen as the outcome variable for the CBA.
The initial level of KS2 attainment (baseline) was estimated based on Beitchman et al (1996).
The authors examined the academic outcomes at 12.5 years for children identified at 5 years as
speech and/or language impaired, compared to a control group. The authors found that children
who perform poorly in a battery of speech and language tests also score worse on the
Kauffman Test of Educational Achievement (including measures of spelling, reading and maths)
than children in the control group, whose scores fall within the normal range in the speech and
language tests. The relative performance of the two groups was used to calculate the baseline
KS2 attainment for SLI children, compared to the general population average. DfE (former
DCSF) has published statistics on the proportion of students with speech, language and
communication difficulty achieving level 2 or less and level 4 or more at KS2. This source was
not used for the baseline, as it was not detailed enough to use on its own. However, the data
was used to indicatively validate the estimates used in the model. The baseline probability of
students achieving level 3 or less used in the model is 56 per cent, compared to the actual of 51
per cent (DCSF, 2007). Therefore it is possible that the academic achievement of children with
SLI at KS2 is underestimated.
The effect of the intervention is applied to the baseline by assuming all students experience an
improvement in their scores equivalent to the improvement in expressive language. As a
consequence students close to threshold marks will reach the level above their level at
baseline, resulting in a change in the distribution of students at KS2. The benefit of the
intervention is represented by the increase from the baseline in the probability of achieving
higher grades at KS2. Assuming that the effect of the intervention in terms of expressive
language leads to a proportional increase in scores is likely to overestimate the net benefit. This
assumption is tested using sensitivity analysis.
It is assumed that performance at KS3 and GCSEs is solely dependent on performance at the
previous Key Stage. The improved KS2 performance therefore translates into improved grades
through to GCSEs. It is likely that children with SLI encounter challenges throughout academic
life. To capture these challenges, the progression statistics from KS2 through to GCSE level

The economic case for speech and language therapy
Matrix Evidence | December 2010 32
used are for the special educational needs (SEN) population.12
This potentially underestimates
the academic attainment of SLI children, as the SEN figures include a wide range of conditions,
beyond SLI, which can have a dramatic effect on educational achievement, e.g. serious
behavioural problems. The lifetime benefit of the intervention is defined as the present value of
the incremental lifetime earnings for an individual with 5 GCSE A*-C (or equivalent) compared
with 5 GCSE A*-G.
The progression of students from KS2 to GCSEs is based on descriptive data. Therefore it does
not suggest causality, but simply that students who perform at a high level at early stages of
education are likely to show similar achievement through academic life. This can be caused by
a variety of factors other than high scores at the previous educational level, and should hence
be treated with caution. This is particularly the case as the intervention takes place in the
primary school years, with a considerable delay before the outcome considered is realised.
Again, to validate the estimates of the model, the distribution of GCSE outcomes in the control
group was compared against actual educational achievement by students with speech,
language and communication difficulty. The percentages are 21 and 23 per cent respectively,
suggesting the benefit might be in fact underestimated in the model.
Summary of findings
Table 8 summarises the findings from the CBA of SLT for approximately 203,000 children with
SLI across England, Wales, Scotland and Northern Ireland. Annual costs and monetary benefits
in both scenarios, usual care and enhanced SLT treatment (as described by the intervention),
are presented separately. The differences represent the incremental costs and monetary
benefits attributable to SLT.
Table 8. Annual costs and benefits of SLT for children with SLI (£m in 2009 prices)
£ in 2009 prices Usual SLT Enhanced SLT Difference
Costs
Incremental cost of enhanced SLT provision £0.0m £136.6m -£136.6m
Monetary benefits
Gain in lifetime earnings, 5+ GCSEs A*-C £6,907.0m £7,785.4m £878.4m
Net benefit £741.8m
Benefit-cost ratio 6.43
Throughput
The prevalence of SLI is 5.9 per cent (Law et al, 1998).
In 2009, the UK population aged 6 to 10 years was around 3.4 million. With a
prevalence rate of 5.9 per cent, this implies approximately 203,000 children with SLI. In
12
Includes students with and without SEN statement (i.e. on School Action or School Action Plus). Not all children with
SLI will be identified as having SEN, but the statistics are taken to represent their potential academic progression.
The economic case for speech and language therapy
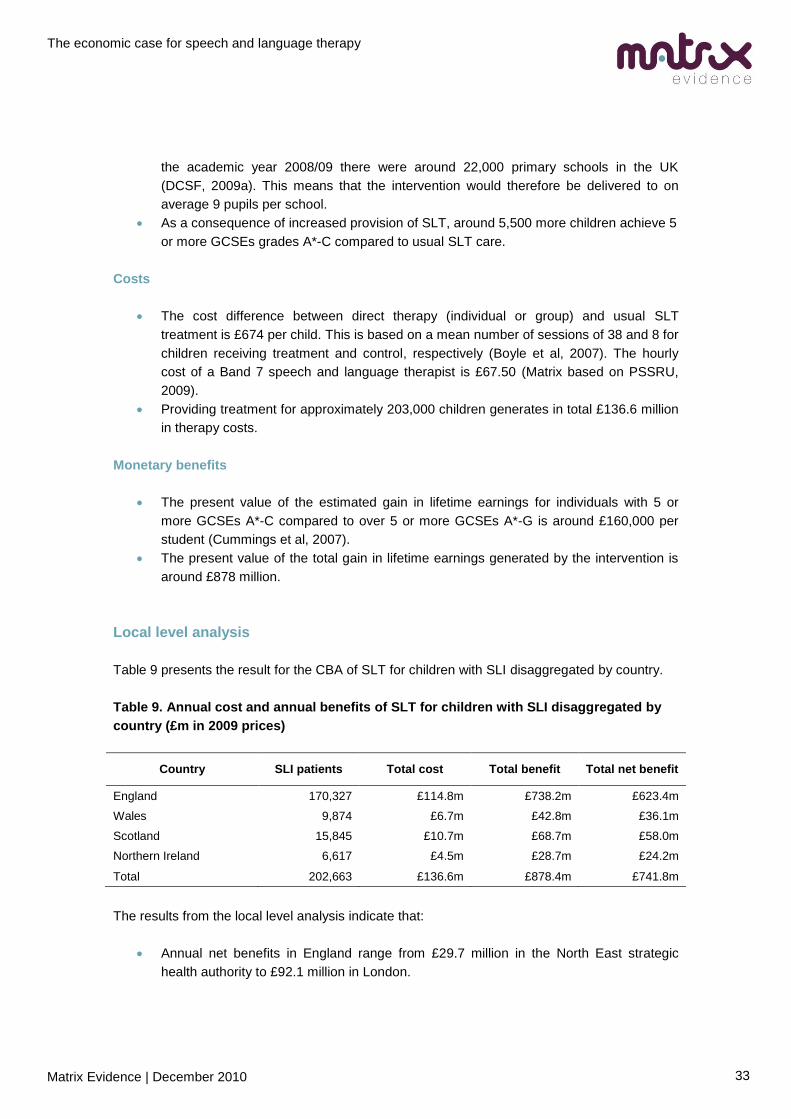
Matrix Evidence | December 2010 33
the academic year 2008/09 there were around 22,000 primary schools in the UK
(DCSF, 2009a). This means that the intervention would therefore be delivered to on
average 9 pupils per school.
As a consequence of increased provision of SLT, around 5,500 more children achieve 5
or more GCSEs grades A*-C compared to usual SLT care.
Costs
The cost difference between direct therapy (individual or group) and usual SLT
treatment is £674 per child. This is based on a mean number of sessions of 38 and 8 for
children receiving treatment and control, respectively (Boyle et al, 2007). The hourly
cost of a Band 7 speech and language therapist is £67.50 (Matrix based on PSSRU,
2009).
Providing treatment for approximately 203,000 children generates in total £136.6 million
in therapy costs.
Monetary benefits
The present value of the estimated gain in lifetime earnings for individuals with 5 or
more GCSEs A*-C compared to over 5 or more GCSEs A*-G is around £160,000 per
student (Cummings et al, 2007).
The present value of the total gain in lifetime earnings generated by the intervention is
around £878 million.
Local level analysis
Table 9 presents the result for the CBA of SLT for children with SLI disaggregated by country.
Table 9. Annual cost and annual benefits of SLT for children with SLI disaggregated by
country (£m in 2009 prices)
Country SLI patients Total cost Total benefit Total net benefit
England 170,327 £114.8m £738.2m £623.4m
Wales 9,874 £6.7m £42.8m £36.1m
Scotland 15,845 £10.7m £68.7m £58.0m
Northern Ireland 6,617 £4.5m £28.7m £24.2m
Total 202,663 £136.6m £878.4m £741.8m
The results from the local level analysis indicate that:
Annual net benefits in England range from £29.7 million in the North East strategic
health authority to £92.1 million in London.

The economic case for speech and language therapy
Matrix Evidence | December 2010 34
Annual net benefits in Wales range from £665,000 in the Merthyr Tydfil unitary health
authority to £3.8 million in Cardiff.
Annual net benefits in Scotland range from £222,000 in the Orkney Islands local
authority to £6.1 million in Glasgow City.
Annual net benefits in Northern Ireland range from £4.2 million in the Belfast local
commissioning board to £6.1 million in the Northern commissioning board.
More detail on local level analysis can be found in Table A3.3 in Appendix 3.
Sensitivity analysis
The results of the CBA are necessarily subject to uncertainty. Additional analysis is therefore
undertaken to observe the sensitivity of the net benefit to a change in the model parameters.
The sensitivity analysis suggests that the results of the model –i.e. the conclusion that investing
in SLT represents an efficient use of public resources– are unlikely to change as a result of this
uncertainty.
Table 10 summarises the parameters that were tested along with the ranges used for the
sensitivity analysis. Figures 5 to 7 show the impact on the net benefit.
Table 10. Sensitivity analysis
Parameter Value in model Sensitivity analysis range
Low High
Unit benefit of higher GCSE level
attainment £160,053 £0 £180,000
Improvement in academic performance
as a consequence of the intervention 5.2% 0% 6%
The benefit of the intervention is derived from increased lifetime earnings for individuals with
higher GCSE grades. The value used in the model is based on estimations by Cummings et al
(2007), using the standard approach used by DfE (former DfES) to obtain the economic value of
an academic qualification. It is assumed that SLI in childhood does not impact on earnings in
the future in its own right, but that future earning potential is only dependent on academic
success. This can lead to an overestimation of the benefits for the population considered, as
individuals with a history of SLI might face additional challenges not accounted for by the model.
The unit benefit is therefore varied to see the effect on the net benefit of the intervention. Figure
5 demonstrates that the net benefit generated by increased earnings is positive as long as the
incremental lifetime earnings for individuals with 5 or more GCSEs of A*-C compared to
individuals with 5 or more GCSEs of A*-G are around £40,000. This is about 19 per cent of the
value used in the CBA.

The economic case for speech and language therapy
Matrix Evidence | December 2010 35
Figure 5. Sensitivity of net benefit to the value of the unit benefit of better GCSE results
The net benefit also depends on the impact of the intervention on the academic performance of
students with SLI. It is assumed that the improvement in expressive language observed in effect
studies is translated into an equal improvement in academic performance. This can be an
overestimate of the benefit, as improvement in language might only partially transfer into
improved grades. This is particularly the case as the effect of the intervention is on expressive
language with limited evidence of improvement in receptive scores. The effect size of the
intervention on academic performance is therefore varied to examine the impact on the net
benefit. The results in Figure 6 show that the net benefit is positive as long as the effect of the
intervention is over 1 per cent, compared to 5 per cent used in the model. This means that as
long as one fifth of the effect of the intervention on expressive language is translated into an
effect in academic success, the net benefit is positive.
£(200)
£0
£200
£400
£600
£800
£1,000
£0 £50,000 £100,000 £150,000 £200,000
Ne
t b
en
efi
t (£
m)
Unit benefit of higher GCSE level attainment

The economic case for speech and language therapy
Matrix Evidence | December 2010 36
Figure 6: Sensitivity of net benefit to the improvement in academic performance as a
consequence of the intervention
Key assumptions
Evidence from Boyle et al (2007) is for SLT undertaken in a community setting in
Scotland. An assumption was made that existing resource use of SLT is similar in other
parts of the UK.
The incremental unit cost of the intervention assumes the intervention is delivered by a
qualified speech and language therapist. This is a conservative assumption, potentially
overestimating the cost of the SLT, as it is likely that the intervention would be at least
partly delivered by speech and language therapy assistants, with lower unit cost. Boyle
et al (2007) found no significant difference in the effect of the intervention relating to the
status of the person delivering it. In the RCT the assistants were however all
psychology graduates, which is not typical. For this reason the effect of the indirect
therapy modes is also more uncertain, supporting the choice of direct therapy in the
selection of cost and effect.
The cost of SLT was estimated using the harmonised Band 7 wage. The intervention
was delivered by Band 2 therapists, but because of inconsistencies in banding at the
time, it is not entirely translatable to the harmonised bands.
The SLI prevalence rate used in the CBA is the median prevalence from birth to 7 years
found by a review by Law et al (1998). While the prevalence for older children is likely to
be lower, the range of estimates in the literature is 1-15 per cent, depending on the
criteria used to identifying SLI. Therefore 5.9 per cent is taken as a conservative
estimate. It is also important to note that while the prevalence rate changes the size of
the net benefit, the benefit-cost ratio of 6.43 is unaffected due to a proportional
reduction in costs.
£(200)
£0
£200
£400
£600
£800
£1,000
0% 1% 2% 3% 4% 5% 6%
Ne
t b
en
efi
t (£
m)
Improvement in academic performance as a consequence of the intervention

The economic case for speech and language therapy
Matrix Evidence | December 2010 37
It is assumed that the effect of enhanced SLT is the same for children with speech
impairment as it is for children with language impairment. This may overestimate the net
benefit as students with speech impairment are likely to be less distinguishable from
general population once they start to read.
The model does not include spontaneous recovery. This is because of the age group
considered. Evidence suggests that children whose pre-school language problems are
not resolved by school entry have ongoing and significant problems in both written and
spoken language through compulsory education (Boyle et al, 2007).
It is assumed that improvement in expressive language results in a proportional
improvement in academic achievement. This is likely to overestimate the benefit, but
the sensitivity analysis shows that the net benefit remains positive even when the
impact of the intervention is reduced.
Benefits gained during the intervention are assumed to be maintained until KS2
assessment, i.e. the academic performance of the children does not regress when the
intervention is over. This may overestimate the benefit.
The progression probabilities used in the model are for the SEN population. This implies
the assumption that SLI patients face more challenges than the general population
throughout school, regardless of their previous achievement. This might underestimate
the benefit, as the SEN statistics include individuals with conditions with serious impacts
on educational achievement, such as behavioural problems.
It is assumed that performance at KS3 and GSCEs are solely dependent on
performance at the previous Key Stage, i.e. children with SLI are as likely to achieve a
KS3 level given KS2 performance as SEN children. This means that any additional
educational challenge caused by childhood SLI is not captured by the model.

The economic case for speech and language therapy
Matrix Evidence | December 2010 38
7.0 Children with autism
Key messages
The intervention
The term Autistic Spectrum Disorder (ASD) is generally used to cover the conditions Autism,
Atypical Autism and Asperger’s Syndrome. The disorder is a neurodevelopmental condition
identified by the presence of behavioural impairments: impaired social interaction,
communication and social imagination. The impairments are characterised by abnormalities in
reciprocal social interactions and in patterns of communication. The individual’s interests and
activities are also restricted, stereotyped and of repetitive repertoire. Defining ASD is generally
problematic, as autism is a continuum with individuals having a range of abilities and
characteristics. The separation of the three identified groups is difficult, and conditions in the
autistic spectrum are therefore usually not treated as discrete conditions. (RCSLT, 2009d) The
heterogeneity of the condition also results in difficulty in estimating the prevalence rate. The
Autism Society estimates that 1 in 100 children in the UK are affected by the condition. Around
40 per cent of them have the core condition (Green et al, 2010).
The consequences of autism are varied, and highly dependent on the cognitive and intellectual
abilities of the individual with ASD. As many as a third of individuals with the condition do not
In the UK the lifetime benefits generated by 36 additional hours of SLT to increase
parental synchronisation for children 2 to 4 years with autism exceeds the cost of the
therapy by £9.8 million. The benefits are derived from reduced service use and
productivity gains for the family as a consequence of improved communication and
independence.
Every £1 invested in the SLT intervention generates £1.5 in lifetime cost savings.
These estimates refer to SLT delivered to around 8,800 children experiencing the core
condition in England, Wales, Scotland and Northern Ireland.
These results should be treated with caution given uncertainty in the data available to
estimate benefits. Improved communication skills have multiple benefits for
individuals with autism, including increased independence. However, quantifying this
benefit required several assumptions to be made. Sensitivity analysis gives some
comfort that the conclusion of the analysis – that the intervention is cost-effective and
an efficient use of resource – is unlikely to be impacted by this uncertainty. It is also
important to note that the analysis covers only a part of the benefits. For example the
effects of improved communication on mental health, education and employability of
the individual are not included.

The economic case for speech and language therapy
Matrix Evidence | December 2010 39
develop useful language, and those who do face difficulties in social communication. For
example, the inability of autistic individuals to interpret subtle emotional concepts (such as
empathy) and understand unspoken rules of interaction can lead to misunderstandings and
upset for both the individual and those around him. Also heightened sensitivity to sounds,
textures, foods and lights affect the ability of the individual to cope in certain environments. This
can cause serious barriers to participation in society, and prevent access to education and
employment, in addition to forming meaningful relationships. Individuals generally require
support through life, and have limited independence.
Most patients are diagnosed by 3-4 years of age, apart from some high level functioning forms
of the condition which can remain undetected for longer. Autism is a lifelong condition, and the
work of SLT focuses management of the condition rather than prevention. The therapy provided
depends on the age, ability and specific areas of difficulty for the patient, but generally focuses
on developing communication, social interaction and life skills. In addition to language, SLT also
aims to provide skills and strategies for coping with change and understanding appropriate
behaviour. The therapist will most often work in a multidisciplinary and multi-agency team.
(RCSLT, 2009d)
Early intervention has been advocated to treat delays in language development for autistic
children, improving the probability of developing useful language. The CBA therefore focuses on
children between 2 and 4 years (inclusive) and is based on a RCT study by Green et al (2010).
The intervention described focused on increasing parental sensitivity and responsiveness to
child communication. In addition, it aimed to further aid the child’s communication development
through a promotion of a range of strategies such as action routines. The families attended a 2-
hour clinic session every other week for 6 months, followed by monthly booster sessions for 6
months. In total the families received 36 hours of therapy, delivered in addition to the treatment
as usual provided by their local SLT services. A control group received usual SLT care only. On
average, the control group received 9.8 hours of SLT over the course of the study.
The primary outcome was the ADOS-G social communication algorithm scale, which is a
measurement of the severity of the symptoms of autism. There were also three secondary
outcomes.
1. Parent-child interaction during naturalistic play, measured by proportion of parental
communications with the child that were synchronous, child initiations as a proportion of
communication with the parent and proportion of time spent in mutual shared attention.
2. Child language and social communication, measured by the researcher using pre-
school language scales. Also reported by parent using the McArthur Communicative
Development Inventory, and the Communication and Symbolic Behaviour Scales
Developmental Profile social composite raw scores.
3. Adaptive functioning in school beyond the family, using the Vineland Adaptive
Behaviour Scales, Teacher rating form.
The study found no significant decrease in autistic symptoms as a consequence of the
intervention, and the effects on directly observed language and adaptive functioning in school

The economic case for speech and language therapy
Matrix Evidence | December 2010 40
were small. However, there was a significant positive effect on parent-child interaction,
particularly parental synchronisation. This is not surprising as it is an outcome targeted by the
intervention.
The ability to coordinate interest in external objects or events with other people supports the
child in reaching important language milestones. It is characteristic of autistic children to have a
deficit in joint attention, and they also develop language late and at slower rates than the
general population. The literature suggests that responsive parental behaviours reliably predict
children’s rate of language acquisition, even in the autistic population. Siller and Sigman (2008)
find a positive and significant relationship between a measure of maternal synchronisation and
rate of change in language age in a sample of autistic children. This relationship is used in the
CBA to translate the impact of the intervention described in Green et al (2010) into an improved
level of language in childhood.
Improved communication skills can have a wide range of positive consequences on the lives of
autistic individuals and their families. Communication reduces stress within the family and
facilitates the management of the condition through life. Howlin et al (2004) find in a study of 68
individuals with ASD that verbal ability in childhood (expressed as verbal IQ over or below 30) is
significantly associated with a more independent residential status, more demanding level of
work and a better overall social outcome in adulthood. In the CBA, the estimated level of
language as a consequence of the intervention was transformed into an increased probability of
reaching the threshold verbal IQ score of 30 compared to usual SLT care.
The outcome considered in the CBA was residential status, which is assumed to be a proxy for
the level of independence achieved by the individual. Improved autonomy is a key aim of the
treatment of autism, and an important determinant of quality of life for most individuals with the
condition (Rosenblatt, 2008). The categories considered are private accommodation (either own
or with family), supported accommodation (i.e. residential accommodation with some
autonomy), residential accommodation (with little or no autonomy) and hospital accommodation.
The valuation of the benefit is based on Knapp et al (2009), which measures cost of service use
and productivity associated with each of the above accommodation categories, taking into
account intellectual disability and residential status. The decision was made to use the
estimates for individuals with intellectual disability to capture the greater expense of managing
core condition relative to individuals with a higher level functioning condition. The estimate does
not include productivity loss for the individual, but does take into account the lost productivity for
the family members caring for the autistic individual.
Employment outcomes were not included in the CBA. Howlin et al (2004) have analysed the
relationship between verbal IQ and the level of work. However the population considered in the
study is different than the core autistic population considered in the CBA, and discussion with
the National Autistic Society suggested that in the case of employment the two groups were too
different for this data to be used in a reliable way. Residential status was therefore preferred,
particularly as the severity of the condition could be factored in when using the segmentation by
Knapp et al (2009) by intellectual disability. Uncertainty remains over how applicable the level of
independence results of Howlin et al (2004) are in the core autistic population. Therefore

The economic case for speech and language therapy
Matrix Evidence | December 2010 41
sensitivity analysis was carried out to test the impact of this assumption. It is also important to
bear in mind that autism is a developmental condition and the level of independence of the
individual in adulthood is influenced by a range of factors. Caution is therefore required in the
interpretation of the results.
Summary of findings
Table 11 summarises the findings from the CBA of SLT for around 8,800 children with autism
across England, Wales, Scotland and Northern Ireland. Annual costs and monetary benefits in
both scenarios, usual SLT care and enhanced SLT treatment (as described by the intervention),
are presented separately. The differences represent the incremental costs and monetary
benefits attributable to SLT.
Table 11. Annual costs and benefits of SLT for children with autism (£m in 2009 prices)
£ in 2009 prices Usual SLT Enhanced SLT Difference
Costs
Incremental cost of enhanced SLT provision
£0.0 £21.3m -£21.3m
Monetary benefits
Cost of supported accommodation £1,689.4m £1,693.0m -£3.6m
Cost of residential accommodation £1,215.9m £1,208.7m £7.2m
Cost of hospital accommodation £1,337.7m £1,310.3m £27.5m
Total £4,243.0m £4,211.9m £31.1m
Net benefit £9.8m
Benefit-cost ratio 1.46
Throughput
The prevalence of core autism is 0.4 per cent. (Green et al, 2010)
Aggregated from country level data, there are around 2.2 million children aged 2 to 4 in
the UK.
This implies around 8,800 core autistic children aged 2 to 4.
Costs
The unit cost of the intervention is £2,430. This includes 36 hours of SLT for a year, at
the cost of £67.50 per hour (Matrix based on PSSRU, 2009)
Providing the intervention for around 8,800 children generates a cost of £21.3 million.

The economic case for speech and language therapy
Matrix Evidence | December 2010 42
Monetary benefits
The annual incremental cost of an individual with autism in supported accommodation
over private accommodation is around £51,400. The present value of the lifetime cost
is around £876,000 per individual (Matrix based on Knapp et al, 2009)
As a consequence of the intervention, 4 more people annually achieve the level of
independence required to be able to live in supported accommodation. This generates a
lifetime cost of £3.6 million.
The annual incremental cost of an individual with autism in residential accommodation
compared to private accommodation is around £52,400. The present value of the
lifetime cost is around £893,000 per individual (Matrix based on Knapp et al, 2009).
As a consequence of the intervention, 8 less people annually are accommodated in
residential accommodation. This generates a lifetime cost saving of £7.2 million.
The annual incremental cost of an individual with autism in hospital accommodation
compared to private accommodation is around £61,300. The present value of the
lifetime cost is around £1.0 million per individual.
As a consequence of the intervention, 26 less people annually are accommodated in
hospital settings. This generates a lifetime cost saving of £27.5 million.
Local level analysis
Table 12 presents the result for the CBA of SLT for children with autism disaggregated by
country.
Table 12. Annual cost and annual benefits of SLT for children with autism disaggregated
by country (£m in 2009 prices)
Country Autistic patients Total cost Total
benefit Total net benefit
England 7,376 £17.9m £26.2m £8.3m
Wales 399 £1.0m £1.4m £0.4m
Scotland 697 £1.7m £2.5m £0.8m
Northern Ireland 291 £0.7m £1.0m £0.3m
Total 8,763 £21.3m £31.1m £9.8m
The results from the local level analysis indicate that:
Annual net benefits in England range from around £384,000 in the North East strategic
health authority to £1.4 million in London.
Annual net benefits in Wales range from around £9,000 in the Merthyr Tydfil unitary
health authority to around £52,000 in Cardiff.
Annual net benefits in Scotland range from around £3,000 in the Orkney Islands local
authority to around £83,000 in Glasgow City.

The economic case for speech and language therapy
Matrix Evidence | December 2010 43
Annual net benefits in Northern Ireland range from £56,000 in the Belfast local
commissioning board to around £83,000 in the Northern commissioning board.
More detail on local level analysis can be found in Table A3.4 in Appendix 3.
Sensitivity analysis
The results of the CBA are necessarily subject to uncertainty. Additional analysis is therefore
undertaken to observe the sensitivity of the net benefit to a change in the model parameters.
The sensitivity analysis gives some comfort that the results of the model–i.e. the conclusion that
investing in SLT represents an efficient use of public resources – are unlikely to change as a
result of this uncertainty.
Table 12 summarises the parameters which were tested along with the ranges used for the
sensitivity analysis. Figures 8 and 9 show the impact on net benefit.
Table 12. Sensitivity analysis
Parameter Value in model Sensitivity analysis range
Low High
Probability of verbal IQ over 30 if
intervention 55.9% 54.0% 56.5%
Probability of private accommodation if
verbal IQ over 30 58.6% 35.0% 60.0%
The net benefit is dependent on the relationship between the increased parental
synchronisation and gains in language. The effect size is 1.5, resulting in an increase in the
probability of developing a verbal IQ of over 30 from 54 to 55.9 per cent. The exact relationship
is complex and difficult to evaluate. Hence the estimate used in the model is varied between 54
per cent (the probability of developing verbal IQ of over 30 before the intervention, i.e. no effect)
and 56.5 per cent to observe the impact on net benefit. The results below show that as long as
the probability of verbal IQ over 30 is above 55.4 per cent after intervention, the net benefit is
positive. That is, the effect size used in the model, 1.5, would have to reduce by 26 per cent for
the benefits of the intervention not to exceed the costs.

The economic case for speech and language therapy
Matrix Evidence | December 2010 44
Figure 8. Sensitivity of net benefit to the probability of verbal IQ over 30 if receive
intervention
The net benefit also depends on the increased independence of the individual as a
consequence of improved verbal IQ. The probability of different accommodation outcomes is
based on a follow-up study by Howlin et al (2004), and costed using Knapp et al (2009). Both
papers look at general autistic population, and do not focus on individuals with the core
condition like Green et al (2010). In the CBA model, overall 48 per cent of the individuals
receiving the intervention end up in private accommodation. For individuals with verbal IQ over
30 the probability is 59 per cent compared to 35 per cent for individuals with verbal IQ less than
30. The assumption made by Knapp et al (2009) is that 35 per cent of individuals with ASD with
intellectual disability live in private accommodation, compared to 79 per cent of those with no
intellectual disability. Therefore there is a possibility that the net benefit is overestimated in the
CBA.
Knapp et al (2009) estimate costs separately for individuals with and without intellectual
disability. To capture the more limited capabilities of individuals with the core condition, the
costs for intellectual disability are used in this analysis. As similar differentiation is not provided
in Howlin et al (2004), sensitivity analysis is undertaken to ensure that the results are not a
consequence of overestimated levels of independence. Keeping the relative shares of non-
private accommodation options constant, the probability of living in private accommodation
given verbal IQ of over 30 is varied to observe the effect on net benefit. The results in Figure 9
show that the net benefit is positive as long as the probability of living in private accommodation
is over 50 per cent for individuals with a verbal IQ of over 30, compared to 59 per cent used in
the model. This is equivalent to a 38 per cent decrease in the effect of verbal IQ on living in
private accommodation.
£(40)
£(30)
£(20)
£(10)
£0
£10
£20
£30
54.0% 54.5% 55.0% 55.5% 56.0% 56.5%
Ne
t b
en
efi
t (£
m)
Probability of verbal IQ over 30 if intervention

The economic case for speech and language therapy
Matrix Evidence | December 2010 45
Figure 9: Sensitivity of net benefit to the impact of verbal IQ on the probability of living in
private accommodation in adulthood
Key assumptions
The intervention effect is applied to the synchronisation between the parent and the
child. The increased synchronisation is then translated into greater language gains over
a period of around 44 months, i.e. 3 years and 8 months. The intervention effect is
hence assumed to be sustained over this period, i.e. the synchronisation level once
achieved is maintained.
The analysis does not incorporate any possible benefits associated with continued and
ongoing SLT treatment. Individuals with autism are likely to receive tailored support
from therapists throughout their life.
The distribution of verbal IQ is assumed to be the same for the core autistic population
as for the general autistic population. This may result in an overestimate of the
proportion of population with a verbal IQ of over 30. The exact distribution determines
whether the net benefit is overestimated or underestimated. If the proportion of
individuals with a verbal IQ of less than 30 is greater for the core autistic population
than the ASD population, but a sufficient proportion of individuals are close enough to
the threshold, the net benefit may be underestimated. This is because receiving the
intervention will result in a greater number of people achieving the threshold, and a
larger number of people will experience the benefit. .
The probability of adulthood outcomes is estimated using the mean and standard
deviation provided in Howlin et al (2004) and assuming a normal distribution. This is
unlikely to hold in the autistic population and the true distribution is unknown. It is likely
that the distribution is skewed to the right, and the probability of more independent
outcomes overestimated.
£(20)
£(15)
£(10)
£(5)
£0
£5
£10
£15
35.0% 40.0% 45.0% 50.0% 55.0% 60.0%
Ne
t b
en
efi
t (£
m)
Probability of private accommodation if verbal IQ over 30

The economic case for speech and language therapy
Matrix Evidence | December 2010 46
The relationship between level of independence in adulthood and verbal IQ at 7 years is
similar for all individuals with ASD. I.e. given an individual with ASD has a verbal IQ of
over 30, his likelihood of living in private accommodation is not impacted by whether he
has the core condition or not. This is likely to overestimate the benefit as a person with
a more severe condition is likely to be restricted in independence because of a wide
range of factors. The sensitivity analysis on this assumption shows that the net benefit
is positive even if this assumption is relaxed.
The model assumes that living in private accommodation is associated with greater
independence and preferred by the autistic individual and his family. This assumption is
based on the rating system used in Howlin et al (2004) which uses “independence” and
“residential status” interchangeably, and evidence in the literature that independence in
everyday life is a determinant of quality of life. In reality, some individuals might feel
more independent e.g. in supported accommodation than living home with their parents.
This is not reflected in the rating creating by Howlin et al (2004) and hence not captured
by the model.

The economic case for speech and language therapy
Matrix Evidence | December 2010 47
8.0 Discussion
The results of the CBAs are summarised in Table 12. This indicates that providing SLT in
England, Wales, Scotland and Northern Ireland generates large annual net benefits, and
benefit-cost ratios that are higher than 1. In other words, the benefits generated by the
interventions exceed the costs, and the interventions represent an efficient use of public
resources.
Table 12. Annual net benefits and benefit-cost ratios of SLT (£m in 2009 prices)
Intervention Patients Net benefit Benefit-cost ratio
Dysphagia 63,000 £13.3m 2.32
Aphasia 53,000 £15.4m 1.35
SLI 203,000 £741.8m 6.43
Autism 8,800 £9.8m 1.46
In interpreting these results it is important to keep in mind the following considerations:
1. Given the nature of the interventions, it is difficult to follow-up recipients and measure
the full effects on patients. In this evaluation, the analysis of the interventions was
limited to a one-off implementation. Continued treatment may lead to additional costs
and benefits.
2. The analysis adopted a relatively limited scope in terms of benefits captured. The
potential benefits generated by the interventions evaluated are multiple in nature and
go beyond avoidance of chest infections, improvement in WAB and improved access to
curriculum. For instance in regards to dysphagia, additional benefits of SLT are ability
to return to normal diet, functional swallowing, and avoidance of malnutrition, and
death. The implications of this limited scope are that the benefits are likely to be
underestimated and therefore the net benefits generated by the interventions could be
much greater.
3. The models are limited to evaluating the cost and benefit of precisely defined
interventions. Caution is required when interpreting the results, as the trial setting
makes it possible to deliver a relatively optimal intervention. In routine practise,
resource constraints could make it difficult to provide the level of care described in the
source papers to all patients.
4. SLT is generally not the only treatment provided to patients, but a part of a
multidisciplinary approach to the condition. While the results show a net benefit for
increased provision of SLT, the level of other care is assumed constant. Therefore the
analysis does not imply that SLT replaces other forms of care.
5. In the dysphagia model, the benefits captured refer to health care cost savings. The
benefits for the recipients in terms for example of their well-being are not included. For
example, patients with access to SLT are better able to manage their conditions and

The economic case for speech and language therapy
Matrix Evidence | December 2010 48
would suffer less adverse socio-emotional effects. Thus, the benefits are likely to be
underestimated.
6. In the aphasia model, the purpose of the research was to measure the effect of SLT
compared to no SLT. However, the CBA relied on evidence designed to measure the
effect of enhanced NHS SLT versus usual NHS SLT. The CBA is only capturing a
portion of the potential total costs and benefits of SLT.
7. The SLI model focuses on primary school children. In practice, a majority of the work
by speech and language therapists focuses on pre-school children and the prevention
of the development of the condition. Many of the children with the condition in early
childhood will experience a spontaneous recovery in absence of treatment. Therefore
the population considered is more vulnerable than the average SLI patient.
8. While communication skills are an essential requirement for increased independence
for individuals with autism, it is a life-long condition and patients are likely to need
assistance throughout their life to cope with everyday tasks. SLT is therefore only a
part of a support package necessary to support individuals with the condition.
9. The autism model only considers the cost saving benefits of increased level of
independence. It does not consider the value of the improved quality of life for the
individual and his family, e.g. the reduced stress caused by lack of understanding
between the individual and people around him. It also excludes benefits on education,
employment and mental health.
10. The local level estimates are generated by applying the unit cost and benefit of the
intervention to the populations eligible for the intervention, using local level population
estimates broken down by age. The estimates therefore take into account demographic
differences but assume that treatment cost, level of care and prevalence rate are fixed
across areas.
Even though the estimated net benefits are subject to uncertainty, the sensitivity analysis
suggested that the conclusion that the interventions represent an efficient use of public
resources is unlikely to change. While further research is required to evaluate the net impact of
SLT on other conditions, the results suggest that investment in SLT provision has potential to
deliver benefits that greatly exceed the cost.

The economic case for speech and language therapy
Matrix Evidence | December 2010 49
9.0 References
1. Bakheit et al (2007) A Prospective, randomized, parallel group, controlled study of the
effect of intensity of speech and language therapy on early recovery from post stroke
aphasia. Clinical Rehabilitation, 21. pp.885-894.
2. Beitchman, J.H., Wilson, B., Brownlie, E. B., Walters, H., Inglis, A., and Lancee, W. (1996)
Long-term consistency in speech/language profiles: I. Developmental and academic
outcomes. Journal of the American Academy of Child and Adolescent Psychiatry. 1996
Jun;35(6):804-14.
3. Boyle, J., McCartney, E., Forbes, J., and O’Hare, A. (2007) A randomised controlled trial
and economic evaluation of direct versus indirect and individual versus group modes of
speech and language therapy for children with primary language impairment. Health
Technology Assessment 2007;11(25).
4. Carnaby, G., Hankey, G. J. and Pizzi, J. (2006) “Behavioural interventions for dysphagia in
acute stroke: a randomised controlled trial”, Lancet Neurology, (5). Pp. 31-37.
5. Carroll, K et al (2001) Stroke Incidence and Risk Factors in a Population – Based
Prospective Cohort Study. Office of National Statistics, Health Statistics Quarterly 12
Winter 2001, 1-9.
6. Chalfin, A. , Marsh, K., and Roman, J. (2008) What does economic analysis add to
decision making? Evidence from the criminal justice literature. Journal of Experimental
Criminology, volume 4, 2, 117 - 135.
7. Cummings, C., Dyson, A., Muijs, D., Papps, I., Pearson, D., Raffo, C., Tiplady, L., Todd, L.,
and Crowther, D. (2007). Evaluation of the Full Service Extended Schools Initiative: Final
Report. Department of Education and Skills, Research Report RR852.
8. Curtis, L. (2009) Unit Costs of Health and Social Care 2007.PSSRU: University of Kent,
Canterbury.
9. Department for Children, Schools and Families (2009a).Education and training statistics for
the United Kingdom. Office of National Statistics.
[http://www.education.gov.uk/rsgateway/DB/VOL/v000891/]
10. Department for Children, Schools and Families (2009b). National Curriculum Assessments
at Key Stage 2 in England 2008/09. Office of National Statistics.
[http://www.education.gov.uk/rsgateway/DB/SFR/s000893/index.shtml]
11. Department for Children, Schools and Families (2007). National Curriculum Assessment,
GCSE and Equivalent Attainment and Post-16 Attainment by Pupil Characteristics, in
England 2006/07. Office of National Statistics.
[http://www.education.gov.uk/rsgateway/DB/SFR/s000759/]
12. Department for Education and Skills (2003) Pupil Progress by Pupil Characteristics: 2002.
Office of National Statistics.
[http://www.education.gov.uk/rsgateway/DB/SBU/b000402/index.shtml ]
13. Department of Health Social Services and Public Safety (2009) Strategic Resources
Framework: Health and Social Care Expenditure Plans for Northern Ireland by Programme
of Care and Key Service, incorporating Selected Planned Activity.
[http://www.dhsspsni.gov.uk/strategic_resources_framework_2008_09_publication.pdf]

The economic case for speech and language therapy
Matrix Evidence | December 2010 50
14. Exel et al (2004) Assessment of Post-Stroke Quality of Life in Cost-Effectiveness Studies:
The Usefulness of the Barthel Index and the EuroQol-5D. Quality of Life Research, (13) 2.
pp. 427-433.
15. Green, J., Charman, T., McConachie, H., Aldred, C., Slonims, V., Howlin, P., Le Couteur,
A., Leadbitter, K., Hudry, K., Byford, S., Barrett, B., Temple, K., Macdonald, W., Pickles, A.,
and the PACT Consortium (2010). Parent-mediated communication-focused treatment in
children with autism (PACT): a randomised controlled trial. Lancet, 2010, 375, pp 2152–60.
16. Guest JF, and Morris A. (1997) Community-acquired pneumonia: the annual cost to the
National Health Service in the UK. European Respiratory Journal; (10). Pp. 1530-1534.
17. Howlin, P., Goode, S., Hutton, J. and Rutter, M. (2004). Adult outcome for children with
autism. Journal of Child Psychology and Psychiatry, 2004, 45:2, pp 212–229.
18. Knapp, M., Romeo, R. and Beecham, J. (2009). Economic cost of autism in the UK.
Autism, 2009, 13:3, pp 317–336.
19. Law, J., Boyle, J., Harris, F., Harkness, A., Nye, C. (1998). Screening for speech and
language delay: a systematic review of the literature. Health Technology Assessment
1998;2(9).
20. Mann, G., Hankey G., Cameron, D. (1999) Swallowing Function after Stroke: Prognosis
and Prognostic Factors at 6 months. Stroke. 30. pp.774-748.
21. NHS Information Centre (2008) Attribution Dataset GP Registered Populations.
[http://www.ic.nhs.uk/statistics-and-data-collections/population-and-
geography/population/attribution-dataset-gp-registered-populations-2008]
22. Office for National Statistics (2001) Area and population by local authority (Scotland):
Regional Trends 37.
[http://www.statistics.gov.uk/StatBase/ssdataset.asp?vlnk=5966&Pos=&ColRank=2&Rank
=272]
23. Office of National Statistics (2008). Period and cohort expectations of life.
[http://www.statistics.gov.uk/downloads/theme_population/Interim_Life/period_cohort_table
s_index08.pdf]
24. Office for National Statistics (2010) Mid-year population estimates 2009.
[http://www.statistics.gov.uk/statbase/product.asp?vlnk=15106]
25. Rosenblatt, M. (2008). I Exist: The message from adults with autism in England. National
Autistic Society.
26. Royal College of Speech and Language Therapists (2010) Giving voice, viewed 23
November 2010. [Available at:
http://www.rcslt.org/about/campaigns/giving_voice_key_messages]
27. Royal College of Speech and Language Therapists (2009a) RCSLT Resource Manual for
Commissioning and Planning Services for SLCD: Dysphagia.
[http://www.rcslt.org/speech_and_language_therapy/commissioning/dysphagia]
28. Royal College of Speech and Language Therapists (2009b) RCSLT Resource Manual for
Commissioning and Planning Services for SLCD: Aphasia.
[http://www.rcslt.org/speech_and_language_therapy/commissioning/aphasia]
29. Royal College of Speech and Language Therapists (2009c) RCSLT Resource Manual for
Commissioning and Planning Services for SLCD: Speech and language impairment.
[http://www.rcslt.org/speech_and_language_therapy/commissioning/sli]
The economic case for speech and language therapy
Matrix Evidence | December 2010 51
30. Royal College of Speech and Language Therapists (2009d). RCSLT Resource Manual for
Commissioning and Planning Services for SLCD: Autistic Spectrum Disorders.
[http://www.rcslt.org/speech_and_language_therapy/commissioning/asd]
31. Siller, M. and Sigman, M. (2008). Modeling Longitudinal Change in the Language Abilities
of Children With Autism: Parent Behaviors and Child Characteristics as Predictors of
Change. Developmental Psychology. 2008, Vol. 44, No. 6, pp 1691–1704.
32. Wade, D., Hewer, L. R. (1985) Hospital admission for acute stroke: who, for how long, and
to what effect? Journal of Epidemiology and Community Health, 39. pp.347-352.
33. Wertz et al (1984). Classifying the Aphasias: A Comparison of the Boston Diagnostic
Aphasia Examination and the Western Aphasia Battery. pp.1-8.

The economic case for speech and language therapy
Matrix Evidence | December 2010 52
10.0 Appendix 1: effectiveness studies selected for CBAs
Table A1.1. Effectiveness study for modelling dysphagia post-stroke among adults
Reference Carnaby et al (2006)
Country Australia (speech pathologist)
Method RCT; high intensity behavioural therapy (n=102); low
intensity NHS SLT (n=102); usual NHS care (n=102)
Setting Hospital
Age range (time after stroke) 69 – 72 years old (3 days)
Intervention Low intensity SLT: 0.80 hrs per week for one month
High intensity SLT: 1.17 hrs per week for one month
Counterfactual Usual care by day ward nurse: 0.30 hrs per week for one
month
Outcome Proportion of patients with chest infection
Table A1.2. Effectiveness study for modelling aphasia post-stroke among adults
Reference Bakheit et al (2006)
Country UK
Method RCT; intensive NHS SLT (n= 51); enhanced NHS SLT
(n=19); usual NHS SLT (n=19)
Setting Hospital
Age range (time after stroke) 70 – 73 years old (28-34 days)
Intervention Intensive NHS SLT: 5hr per week SLT (12 wks)
Enhanced NHS SLT: 1.6 hrs per week SLT (12 wks)
Counterfactual Usual NHS SLT: 0.57 hrs per week (12 wks)
Outcome Western Aphasia Battery test (WAB) – measures verbal
fluency, language, information content, comprehension,
repetition, and naming.
Quality Adjusted Life Year (QALY) associated with improved
communication, self confidence, independence.
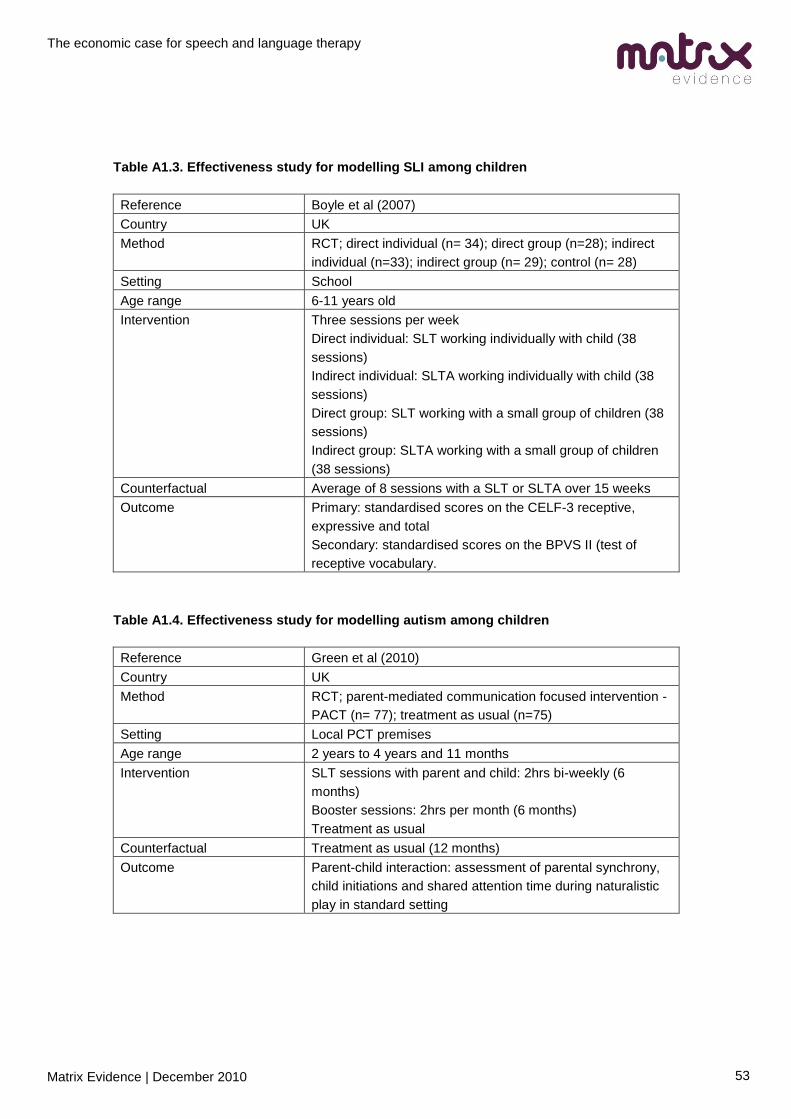
The economic case for speech and language therapy
Matrix Evidence | December 2010 53
Table A1.3. Effectiveness study for modelling SLI among children
Reference Boyle et al (2007)
Country UK
Method RCT; direct individual (n= 34); direct group (n=28); indirect
individual (n=33); indirect group (n= 29); control (n= 28)
Setting School
Age range 6-11 years old
Intervention Three sessions per week
Direct individual: SLT working individually with child (38
sessions)
Indirect individual: SLTA working individually with child (38
sessions)
Direct group: SLT working with a small group of children (38
sessions)
Indirect group: SLTA working with a small group of children
(38 sessions)
Counterfactual Average of 8 sessions with a SLT or SLTA over 15 weeks
Outcome Primary: standardised scores on the CELF-3 receptive,
expressive and total
Secondary: standardised scores on the BPVS II (test of
receptive vocabulary.
Table A1.4. Effectiveness study for modelling autism among children
Reference Green et al (2010)
Country UK
Method RCT; parent-mediated communication focused intervention -
PACT (n= 77); treatment as usual (n=75)
Setting Local PCT premises
Age range 2 years to 4 years and 11 months
Intervention SLT sessions with parent and child: 2hrs bi-weekly (6
months)
Booster sessions: 2hrs per month (6 months)
Treatment as usual
Counterfactual Treatment as usual (12 months)
Outcome Parent-child interaction: assessment of parental synchrony,
child initiations and shared attention time during naturalistic
play in standard setting

The economic case for speech and language therapy
Matrix Evidence | December 2010 54
11.0 Appendix 2: decision models and data tables
11.1 Dysphagia post-stroke
Figure A2.1 presents a decision model for the impact of the SLT on chest infections in post
stroke dysphagia patients. Table A2.1 summarises the data used to populate the model.
Figure A2.1. A decision model for the impact of SLT on likelihood of chest infection in
dysphagia post-stroke patients

The economic case for speech and language therapy
Matrix Evidence | December 2010 55
Table A2.1. Parameters used to populate decision model for the impact of SLT on
likelihood of chest infection in dysphagia post-stroke patients (monetary values in £2009)
Ref Description Value Calculation and sources
X Population of dysphagia
patients 62,960
Incidence of stroke across all age groups is 0.26
per cent (ONS Health Quarterly Statistics Winter
2001).
Probability of dysphagia in post stroke patients =
78 per cent (RCSLT Resource manual for
commissioning and planning services for SLCN:
Dysphagia).
Probability that dysphagia patients require SLT
= 51 per cent (Mann et al, xxxx).
Incidence of dysphagia = 0.26 per cent * 78 per
cent * 51 percent = 0.10 per cent
Total UK population = 61, 049,168 (ONS mid
2008 estimates for local authorities, Office for
National Statistics; General Registrar Office for
Scotland, Department of Health, Social
Services, and Public Safety (2008): Strategic
Resources Framework.)
Dysphagia patients = 61,049,168 * 0.10 per cent
= 62,960.
Unit cost NHS day ward
nurse £58
Carnaby et al (2005) estimated total NHS care =
4.8 session, 16.0 min per session = 76.8 min =
1.28 hours. Unit cost of a Band 5 NHS day ward
nurse estimated by Curtis (2009) = £45 per hour
with patient. The 2008/2009 cost of a nurse was
adjusted to 2009 prices using the GDP deflator
= £45.7. Cost per dysphagia patient receiving
NHS care = £45.70 * 1.28 = £58
Unit cost of hospital SLT £219
Carnaby et al (2005) estimated total treatment
with SLT = 7.8 session, 24.8 min per session =
193.44 min = 3.224 hours. Unit cost of a Band 5
hospital SLT estimated by Curtis (2009) = £44
per hour with patient. The cost of a Band 5 SLT
was uplifted to Band 7 based on the ratio of the
annual salaries = (Band 7 = £35,900 per year/
Band 5 = £23,400 per year) = 1.53. £44 * 1.53 =
£67. The 2008/2009 cost of a SLT was adjusted
to 2009 prices using the GDP deflator = £68.
Cost per dysphagia patient receiving SLT = £68
* 3.224 = £219
a
b

The economic case for speech and language therapy
Matrix Evidence | December 2010 56
Ref Description Value Calculation and sources
A Probability dysphagia
patient will develop a chest
infection with NHS care
0.471
Carnaby et al (2005) - out of 102 patients
receiving NHS care, 48 developed a chest
infection = 48/102 = 0.471
B Probability dysphagia
patient will not develop a
chest infection with NHS
care
0.529 1 – ProbA
C Probability dysphagia
patient will develop a chest
infection with SLT care
0.255
Carnaby et al (2005) - out of 102 patients
receiving SLT (low intensity), 26 developed a
chest infection = 26/102 = 0.255
D Probability dysphagia
patient will not develop a
chest infection with SLT
care
0.745 1 - ProbC
E Probability if patient
develops chest infection
that it requires hospital
admission
0.32 Guest and Morris (1997)
F Probability if patient
develops chest infection
that it requires community
care
0.68 Guest and Morris (1997)
Unit cost chest infection
requiring hospital care £5,084
Guest and Morris (1997) - in 1992/93 prices a
cost of chest infection treated in hospital =
£1700 - £5100 per case. Average updated to
2009 prices using GDP deflator.
Unit cost chest infection
requiring community care £150
Guest and Morris (1997) - in 1992/93 prices a
cost of chest infection treated in the community
= £100 per case. Updated to 2009 prices using
GDP deflator.
c
d

The economic case for speech and language therapy
Matrix Evidence | December 2010 57
11.2 Aphasia post-stroke
Figure A2.2 presents a decision model for the impact of the SLT on QALY gain in post stroke
aphasia patients. Table A2.2 summarises the data used to populate the model.
Figure A2.2. A decision model for the impact of SLT on QALYs in aphasia post-stroke
patients

The economic case for speech and language therapy
Matrix Evidence | December 2010 58
Table A2.2. Parameters used to populate decision model for the impact of SLT on QALYs
in aphasia post-stroke patients (monetary values in £2009)
Ref Description Value Calculation and sources
X Population of aphasia
patients 52,645
Incidence of stroke across all age groups is 0.26
per cent (ONS Health Quarterly Statistics Winter
2001).
Probability of dysphagia in post stroke patients =
33.33 per cent (RCSLT Resource manual for
commissioning and planning services for SLCN:
Aphasia).
Incidence of aphasia = 0.26 per cent * 33.33 per
cent = 0.09 per cent
Total UK population = 61, 049,168 (ONS,
General Registrar Office for Scotland,
Department of Health, Social Services, and
Public Safety (2008).
Aphasia patients = 61,049,168 * 0.09 per cent =
52,645.
Unit cost usual NHS SLT £469
Bakheit et al (2007) estimated total usual NHS
SLT = 6.9 hours per patient. Unit cost of Band 5
community NHS SLT estimated by Curtis (2009)
= £44 per hour with patient. The cost of a Band 5
SLT was uplifted to Band 7 based on the ratio of
the annual salaries = (Band 7 = £35,900 per
year/ Band 5 = £23,400 per year) = 1.53. £44 *
1.53 = £67. The 2008/2009 cost of a SLT was
adjusted to 2009 prices using the GDP deflator =
£68. Cost per aphasia patient receiving NHS
therapy = £68 * 6.9 = £469
Unit cost of enhanced NHS
SLT £1313
Bakheit et al (2007) estimated total enhanced
NHSSLT = 19.3 hours per patient. Unit cost of
Band 5 community NHS SLT estimated by Curtis
(2009) = £44 per hour with patient. The cost of a
Band 5 SLT was uplifted to Band 7 based on the
ratio of the annual salaries = (Band 7 = £35,900
per year/ Band 5 = £23,400 per year) = 1.53.
£44 * 1.53 = £67. The 2008/2009 cost of a SLT
was adjusted to 2009 prices using the GDP
deflator = £68. Cost per aphasia patient
receiving standard SLT therapy = £68 * 19.3 =
£1313
a
b

The economic case for speech and language therapy
Matrix Evidence | December 2010 59
Ref Description Value Calculation and sources
a Effect of NHS therapy on
WAB test 42.58%
Bakheit et al (2007) state those receiving NHS
care improved their WAB score from a baseline
of 45.8 to 65.3. Percentage improvement =
(65.3-45.8)/45.8 = 42.58 per cent
b Effect of SLT on WAB test 79.42%
Bakheit et al (2007) state those receiving the
standard SLT improved their WAB score from a
baseline of 37.9 to 68. Percentage improvement
= (68 -37.9)/37.9 = 79.42 per cent
c
Conversion of improvement
in WAB test from NHS
therapy to aphasia test
provided in Wade et al
(1985)
Baseline: 9.2
24 wks: 13.1
The WAB test is out of 1 to100. The aphasia test
used in Wade et al is out of 0 to 20. Assuming
both tests have a similar distribution the mean
score at baseline on the aphasia test used in
Wade et al (1985) = (45.8/100) * 20 = 9.2.
The score on the aphasia test post SLT = 9.2 *
42.58 per cent = 13.1
d
Conversion of improvement
in WAB test from standard
SLT to aphasia test
provided in Wade et al
(1985)
Baseline: 7.6
24 wks: 13.6
The WAB test is out of 1 to100. The aphasia test
used in Wade et al is out of 0 to 20. Assuming
the two tests have a similar distribution the mean
score at baseline on the aphasia test used in
Wade et al (1985) = (37.9/100) * 20 = 7.6. The
score on the aphasia test post SLT = 7.6 * 79.42
per cent = 13.6
e
Conversion of aphasia test
score from NHS therapy to
Barthel Index.
Baseline: 5.32
24 wks: 7.82
The Barthel index (BI) measures the ability of
patients to perform daily living activity ranging
from 0 to 20, with 20 being independent and
functional. Wade et al (1985) state that an
aphasia score of 14 and below is equivalent to a
BI score of 8.4, and an aphasia score greater
than 14 is equivalent to a BI score of 12.8. A
linear relationship is assumed between the
aphasia test and BI. An aphasia score of 9.2 =
BI score of 5.32. An aphasia score of 13.1 = BI
score of 7.82.
f
Conversion of aphasia test
score from standard SLT to
Barthel Index.
Baseline: 4.30
24 wks: 8.14
The Barthel index (BI) measures the ability of
patients to perform daily living activity ranging
from 0 to 20, with 20 being independent and
functional. Wade et al (1985) state that an
aphasia score of 14 and below is equivalent to a
BI score of 8.4, and an aphasia score greater
than 14 is equivalent to a BI score of 12.8. A

The economic case for speech and language therapy
Matrix Evidence | December 2010 60
Ref Description Value Calculation and sources
linear relationship is assumed between the
aphasia test and BI. An aphasia score of 7.6 =
BI score of 4.30. An aphasia score of 13.6 = BI
score of 8.14.
Conversion of BI score from
NHS therapy to QALY gain 0.120
Exel at el (2004) provide a linear regression
analysis to show the relationship between BI and
QALY values. A BI score of 5.32 = 0.104
QALYs, a BI score of 7.82 = 0.224 QALYs.
Incremental QALY gain = 0.224 – 0.104 = 0.120
Conversion of BI score from
standard SLT to QALY gain 0.177
Exel at el (2004) provide a linear regression
analysis to show the relationship between BI and
QALY values. A BI score of 4.30 = 0.062
QALYs, a BI score of 8.14 = 0.239 QALYs.
Incremental QALY gain = 0.239 – 0.062 = 0.177
c
d

The economic case for speech and language therapy
Matrix Evidence | December 2010 61
11.3 Children with speech and language impairment
Figure A2.3 presents a decision model for the impact of the SLT on SLI patients. Table A2.3
summarises the data used to populate the model.
Figure A2.3. A decision model for the impact of SLT on educational achievement in
children with SLI

The economic case for speech and language therapy
Matrix Evidence | December 2010 62
Table A2.3. Parameters used to populate decision model for the impact of SLT on
educational achievement in children with SLI (monetary values in £2009)
Ref Description Value Calculation and sources
X Number of children affected 202,663
Median prevalence estimate (birth to 7 years) is
5.9 per cent. UK population 2009, aggregated
from country level data for persons 6-10 years
(inc), is 3,434,972.
a = 0.059*3,434,972 = 202,663.
Source: Law et al (1998), ONS (2010), General
Registrar Office for Scotland, Department of
Health, Social Services, and Public Safety
(2008).
A Student achieves KS2 L5<=
if intervention 14% A = 1 - (B+C)
B Student achieves KS2 L4 if
intervention 34%
The mean CELF expressive score was 67.82
and 68.23 at T1 for direct individual and direct
group respectively (average 68.03). At T2 the
mean scores were 72.59 and 71.87 respectively
(average 72.23). For the control group, the mean
score was 70.16 at T1 and 70.84 at T2.
Source: Boyle et al (2007)
Effect size = (68.03*(70.84/70.16)-
72.23)/(68.03*(70.84/70.16)) = 0.052
The threshold mark for L4 is 46.
The threshold mark for L5 is 71.
Source: DCSF "National Curriculum
Assessments at Key Stage 2 in England
2008/09"
The proportion of students achieving L3 or below
at baseline is 56% (F).
The proportion of students achieving L4 at
baseline is 36% (E).
Proportion of L3 students moving up to L4 = (46
- 46/(1+0.052))/(46-0) = 5%

The economic case for speech and language therapy
Matrix Evidence | December 2010 63
Ref Description Value Calculation and sources
Proportion of L4 students moving up to L5 = (71
- 71/(1+0.052))/(71-46) = 14%
Proportion of L4 students in SLI distribution =
36% + 0.05*56% - 0.14*36% = 34%%
C Student achieves KS2 L4>
if intervention 53%
See B for calculation of effect size.
The threshold mark for L4 is 46.
Source: DCSF "National Curriculum
Assessments at Key Stage 2 in England
2008/09"
The proportion of students achieving L3 or below
at baseline is 56% (F).
Proportion of L3 students moving up to L4 = (46
- 46/(1+0.052))/(46-0) = 5%
Proportion of L3 students in SLI distribution = (1-
0.05)*56% = 53%
D Student achieves KS2 L5<=
if no intervention 9% D = 1 - (E+F)
E Student achieves KS2 L4 if
no intervention 36%
The mean KTEA score for the individuals who
score low overall in a battery of speech and
language tests is 84.03, 72 per cent of the mean
score of 116.23 for the group scoring within
normal range.
Source: Beitchman et al (1996)
The average KS2 score in 2004 was 27.5. Using
the prevalence rate of 5.9 per cent and the ratio
above, the average score for students with SLI is
calculated.
(27.5/(0.059*0.72+0.941*1))*0.72 = 20.2
20.2/27.5 = 73.5%
Source: DCSF "National Curriculum
Assessments at Key Stage 2 in England
2008/09", Law et al (1998)
The threshold mark for L4 and L5 is 46 and 71

The economic case for speech and language therapy
Matrix Evidence | December 2010 64
Ref Description Value Calculation and sources
respectively. The extrapolated top mark (for L5)
is 108.
The proportion of students achieving L4 and L5
are 46 and 29 per cent respectively.
Source: DCSF "National Curriculum
Assessments at Key Stage 2 in England
2008/09"
Proportion of L4 students moving down to L3 =
(46/0.735 - 46)/(71-46) = 66%
Proportion of L5 students moving down to L4 =
(71/0.735 - 71)/(108-71) = 70%
Proportion of L4 students in SLI distribution =
46% - 66%*46% + 70%*29% = 36%
F Student achieves KS2 L4>
if no intervention 56%
See E for the estimation of the relative
performance of students with SLI compared to
national average (73.5%).
The threshold mark for L4 and L5 is 46 and 71
respectively.
The proportion of students achieving L3 or below
and L4 are 25 per cent and 46 per cent
respectively.
Source: DCSF "National Curriculum
Assessments at Key Stage 2 in England
2008/09"
Proportion of L4 students moving down to L3 =
(46/0.735 - 46)/(71-46) = 66%
Proportion of L3 students in SLI distribution =
25% + 66%*46% = 56%
G Student achieves KS3 L6<=
if KS2 L5<= 71%
Out of SEN students who performed on average
at L5 in KS2 assessments, 51, 88 and 74 per
cent achieved L6 or more at KS3 in 2002 in
English, Math and Science respectively.
(51%+88%+74%)/3 = 71%
Source: DfES "Pupils Progress 2002"

The economic case for speech and language therapy
Matrix Evidence | December 2010 65
Ref Description Value Calculation and sources
H Student achieves KS3 L5 if
KS2 L5<= 22%
Out of SEN students who performed on average
at L5 in KS2 assessments, 86, 97 and 95 per
cent achieved L5 or more at KS3 in 2002 in
English, Math and Science respectively. When
the proportion of students who achieved L6 or
more (51, 88 and 74 per cent) are removed, the
percentages receiving L5 are 35, 9 and 21 per
cent respectively.
(35%+9%+21%)/3 = 22%
Source: DfES "Pupils Progress 2002"
I Student achieves KS3 L5> if
KS2 L5<= 7% I = 1 - (G+H)
J Student achieves KS3 L6<=
if KS2 L4 20%
Out of SEN students who performed on average
at L4 in KS2 assessments, 11, 29 and 19 per
cent achieved L6 or more at KS3 in 2002 in
English, Math and Science respectively.
(11%+29%+19%)/3 = 20%
Source: DfES "Pupils Progress 2002"
K Student achieves KS3 L5 if
KS2 L4 41%
Out of SEN students who performed on average
at L4 in KS2 assessments, 50, 67 and 66 per
cent achieved L5 or more at KS3 in 2002 in
English, Math and Science respectively. When
the proportion of students who achieved L6 or
more (11, 29 and 19 per cent) are removed, the
percentages receiving L5 are 39, 38 and 47 per
cent respectively.
(39%+38%+47%)/3 = 41%
Source: DfES "Pupils Progress 2002"
L Student achieves KS3 L5> if
KS2 L4 39% L = 1 - (J+K)
M Student achieves KS3 L6<=
if KS2 L4> 1%
Out of SEN students who performed on average
at L3 in KS2 assessments, 1, 2 and 2 per cent
achieved L6 or more at KS3 in 2002 in English,
Math and Science respectively. Out of students
who performed on average at LB3 in KS2

The economic case for speech and language therapy
Matrix Evidence | December 2010 66
Ref Description Value Calculation and sources
assessments, 0, 0 and 0 per cent achieved L6 or
more at KS3 in 2002 in English, Math and
Science respectively. In 2002, 15 per cent of
students achieved on average L3 and 6 per cent
less than L3 (LB3).
((1%+2%+2%)/3)*(0.15/(0.15+0.06))+((0%+0%+
0%)/3)*(0.06/(0.15+0.06)) = 1%
Source: DfES "Pupils Progress 2002", DCSF
"National Curriculum Assessments at Key Stage
2 in England 2008/09"
N Student achieves KS3 L5 if
KS2 L4> 12%
Out of SEN students who performed on average
at L3 in KS2 assessments, 17, 13 and 19 per
cent achieved L5 or more at KS3 in 2002 in
English, Math and Science respectively.
Removing the proportion of students who
achieved L6 or more (1, 2 and 2 per cent), the
percentage of students achieving L5 is 16, 12
and 17 per cent respectively. Out of students
who performed on average at LB3 in KS2
assessments, 3, 1 and 2 per cent achieved L5 or
more at KS3 in 2002 in English, Math and
Science respectively. Removing the proportion of
students who achieved L6 or more (0, 0 and 0
per cent), the percentage of students achieving
L5 is 3, 1 and 2 per cent respectively. In 2002,
15 per cent of students achieved on average L3
and 6 per cent less than L3 (LB3).
((16%+12%+17%)/3)*(0.15/(0.15+0.06))+((3%+1
%+2%)/3)*(0.06/(0.15+0.06)) = 12%
Source: DfES "Pupils Progress 2002", DCFS
"National Curriculum Assessments at Key Stage
2 in England 2008/09"
O Student achieves KS3 L5> if
KS2 L4> 87% O = 1 - (M+N)
P Student achieves 5+
GCSEs at A*-C if KS3 L6<= 92%
Out of SEN students who performed on average
at L6, L7 and L8 in KS3 assessments, 81, 96
and 99 per cent gained 5+ GCSEs at A*-C
respectively in 2002.

The economic case for speech and language therapy
Matrix Evidence | December 2010 67
Ref Description Value Calculation and sources
(81%+96%+99%)/3 = 92%
Source: DfES "Pupils Progress 2002"
Q Student achieves 5+
GCSEs at A*-C if KS3 L5 33%
Out of SEN students who performed on average
at L5 in KS3 assessments, 33 per cent gained
5+ GCSEs at A*-C in 2002.
Source: DfES "Pupils Progress 2002"
R Student achieves 5+
GCSEs at A*-C if KS3 L5> 2%
Out of SEN students who performed on average
at LB3, L3 and L4 in KS3 assessments, 1, 0 and
4 per cent gained 5+ GCSEs at A*-C
respectively in 2002.
(1%+0%+4%)/3 = 2%
Source: DfES "Pupils Progress 2002"
Incremental cost of the
intervention £674
The unit cost of one hour of client contact for a
community speech and language therapist (Band
5) is £44. The ratio between annual salary for
Band 5 and Band 7 is used to uplift the cost.
(35,900/23,400)*£44 = £67.50
The mean number of sessions is 38 and 8 for
intervention and control respectively. One
session lasts 30 minutes. Out of the 62 children
receiving direct intervention, 34 receive
individual and 28 group therapy. The number of
children in a group is assumed to be 4.
(34/62)*((38-8)/2)*67.50+(28/62)*(((38-
8)/2*67.50)/4) = 674
Source: Boyle et al (2007)
Gain in adult earnings from
achieving 5 GCSE's A*-C £160,053
Gain in adult earnings from achieving 5 GCSE's
A*-C compared to 5 GCSE's A*-G. Uplifted to
2009 prices.
Source: Cummings et al (2007)
a
b

The economic case for speech and language therapy
Matrix Evidence | December 2010 68
11.4 Children with autism
Figure A2.4 presents a decision model for the impact of the SLT on autistic patients. Table A2.4
summarises the data used to populate the model.
Figure A2.4. A decision model for the impact of SLT on living outcomes in children with
autism

The economic case for speech and language therapy
Matrix Evidence | December 2010 69
Table A2.4. Parameters used to populate decision model for the impact of SLT on living
outcomes in children with autism (monetary values in £2009)
Ref Description Value Calculation and sources
x Autistic population
considered 8,826
Estimated prevalence of core disorder is 0.4 per cent. UK
population 2009, persons 2-4 years (inc), aggregated from
country level data is 2,190,717.
x = 0.004*2,190,717 = 8,763.
Source: Green et al (2010), ONS (2010), General
Registrar Office for Scotland, Department of Health,
Social Services, and Public Safety (2008).
A
Verbal IQ greater or
equal to 30 at 7 years
if SLT intervention
55.9%
Parental synchronisation for participants receiving the
intervention was 0.318 at baseline and 0.513 at the end of
the intervention. For the participants in the control group
the baseline synchronisation was 0.313 and 0.326 at the
end of the intervention.
Effect size = (0.513-
(0.318*(0.326/0.313)))/(0.318*(0.326/0.313)) = 0.55
Source: Green et al (2010)
Mean synchronisation score is 1.01. The coefficient of
synchronisation on the logarithm of rate of change in
language age is 0.407. Language growth is reported 12,
24 and 44 months after intervention. The growth rates
(from previous period) are 30, 27 and 38 per cent
respectively. The intervention effect is applied to each
growth rate.
30%*(1+1.01*0.55*0.407) = 36%
27%*(1+1.01*0.55*0.407) = 34%
38%*(1+1.01*0.55*0.407) = 47%
The language age after the intervention is therefore
16.6*1.36*1.34*1.47 = 44.4
Language age by the age of 89 months is 37.9 months
before intervention. The incremental difference is 6.5
months.

The economic case for speech and language therapy
Matrix Evidence | December 2010 70
Ref Description Value Calculation and sources
Source: Siller and Sigman (2008)
In a follow up study by Howlin et al (2004), a distribution of
verbal IQ at 7 is described for the sample. This is used as
a baseline. 31 (46 per cent) of participants had a verbal IQ
of 30 or less: 29 of them did not achieve a score, and the
lowest achieved score was 21. The remaining participant
in this category is assumed to score the mid-point
between 21 and 30, 25.5. 37 participants had a verbal IQ
score greater than 30.
Verbal IQ = Language age/Chronological age * 100
Language age for verbal IQ 30 at the mean age of final
assessment in Siller and Sigman (2008) = (30/100)*89 =
26.7
Cut-off language age at 89 for the intervention to make a
difference = 26.7 - 6.5 = 20.2
Cut-off verbal IQ at 89 months for the intervention to make
a difference = (20.2/89)*100 = 22.7
As a consequence of the intervention, 38 participants
would score over 30 in a verbal IQ test. 38/68 = 55.9%.
B
Verbal IQ greater or
equal to 30 at 7 years
if TAU
54.4%
In a follow up study by Howlin et al (2004), a distribution of
verbal IQ at 7 is described for the sample. This is used as
a baseline. 31 (46 per cent) of participants had a verbal IQ
of 30 or less and 37 participants had a verbal IQ score
greater than 30.
37/68 = 54.4%
J
In private
accommodation if
verbal IQ greater or
equal to 30 at 7 years
58.6%
Mean residential status score for individuals with a
childhood verbal IQ score of more than 30 is 2.69, with
standard deviation 1.43.
Assuming normal distribution, probability of scoring 0
(living independently), 1 (in semi-sheltered
accommodation or still home) or 2 (living with parents,
some limited autonomy) = 59%
Source: Howlin et al (2004)

The economic case for speech and language therapy
Matrix Evidence | December 2010 71
Ref Description Value Calculation and sources
K
In supported
accommodation if
verbal IQ greater or
equal to 30 at 7 years
23.4%
Mean residential status score for individuals with a
childhood verbal IQ score of more than 30 is 2.69, with
standard deviation 1.43.
Assuming normal distribution, probability of scoring 3 (in
residential accommodation with some limited autonomy) =
23%
Source: Howlin et al (2004)
L
In residential
accommodation if
verbal IQ greater or
equal to 30 at 7 years
12.7%
Mean residential status score for individuals with a
childhood verbal IQ score of more than 30 is 2.69, with
standard deviation 1.43.
Assuming normal distribution, probability of scoring 4
(special autistic or other residential accommodation with
little or no autonomy) = 13%
Source: Howlin et al (2004)
M
In hospital
accommodation if
verbal IQ greater or
equal to 30 at 7 years
5.3% M = 1 - J - K - L
N
In private
accommodation if
verbal IQ less than 30
at 7 years
35.1%
Mean residential status score for individuals with a
childhood verbal IQ score of 30 or less is 3.74, with
standard deviation 1.93.
Assuming normal distribution, probability of scoring 0
(living independently), 1 (in semi-sheltered
accommodation or still home) or 2 (living with parents,
some limited autonomy) = 35%
Source: Howlin et al (2004)
O
In supported
accommodation if
verbal IQ less than 30
at 7 years
20.3%
Mean residential status score for individuals with a
childhood verbal IQ score of 30 or less is 3.74, with
standard deviation 1.93.
Assuming normal distribution, probability of scoring 3 (in
residential accommodation with some limited autonomy) =
20%
Source: Howlin et al (2004)

The economic case for speech and language therapy
Matrix Evidence | December 2010 72
Ref Description Value Calculation and sources
P
In residential
accommodation if
verbal IQ less than 30
at 7 years
18.9%
Mean residential status score for individuals with a
childhood verbal IQ score of 30 or less is 3.74, with
standard deviation 1.93.
Assuming normal distribution, probability of scoring 4
(special autistic or other residential accommodation with
little or no autonomy) = 19%
Source: Howlin et al (2004)
Q
In hospital
accommodation if
verbal IQ less than 30
at 7 years
25.7% Q = 1 - N - O - P
Unit cost of
intervention £2,430
The intervention consists of 12 sessions and 6 booster
sessions, each 2 hours. The unit cost of one hour of client
contact for a community speech and language therapist
(Band 5) is £44. The ratio between annual salary for Band
5 and Band 7 is used to uplift the cost.
(35,900/23,400)*£44 = £67.50
(12+6)*2*£67.50 = £2,430
Source: Green et al (2010), Curtis et al (2010)
Lifetime incremental
cost of supported
accommodation
£876,277
The annual cost of autism for an individual in private
accommodation is £36,507. The annual cost for an
individual in a residential accommodation with limited
autonomy is £87,937.
Annual incremental cost = £87,937 - £36,507 = 51,430
Updated to 2009 prices. The annual cost is applied from
the age of 18 for 63 years, the expectation of life at 18.
The costs are discounted using a discount rate of 3.5 per
cent.
Source: Knapp et al (2009), Period and cohort expectation
of life tables (ONS, 2009)
a
b

The economic case for speech and language therapy
Matrix Evidence | December 2010 73
Ref Description Value Calculation and sources
Lifetime incremental
cost of residential
accommodation
£893,315
The annual cost of autism for an individual in private
accommodation is £36,507. The annual cost for an
individual in a residential accommodation with limited
autonomy is £88,937.
Annual incremental cost = £88,937 - £36,507 = £52,430
Updated to 2009 prices. The annual cost is applied from
the age of 18 for 63 years, the expectation of life at 18.
The costs are discounted using a discount rate of 3.5 per
cent.
Source: Knapp et al (2009), Period and cohort expectation
of life tables (ONS, 2009)
Lifetime incremental
cost of hospital
accommodation
£1,045,398
The annual cost of autism for an individual in private
accommodation is £36,507. The annual cost for an
individual in a residential accommodation with limited
autonomy is £88,937.
Annual incremental cost = £97,863 - £36,507 = £61,356
Updated to 2009 prices. The annual cost is applied from
the age of 18 for 63 years, the expectation of life at 18.
The costs are discounted using a discount rate of 3.5 per
cent.
Source: Knapp et al (2009), Period and cohort expectation
of life tables (ONS, 2009)
c
d

The economic case for speech and language therapy
Matrix Evidence | December 2010 74
12.0 Appendix 3: findings at local level
12.1 Dysphagia post stroke
Table A3.1 provides the local level analysis of the impact of SLT in dysphagia post-stroke
patients.
12.2 Aphasia post stroke
Table A3.2 provides the local level analysis of the impact of SLT in aphasia post-stroke patients.
12.3 Children with speech and language impairment
Table A3.3 provides the local level analysis of the impact of SLT in children with SLI
12.4 Children with autism
Table A3.4 provides the local level analysis of the impact of SLT in children with autism

The economic case for speech and language therapy
Matrix Evidence | December 2010 75
Table A3.1. Local level analysis of the impact of SLT in dysphagia post-stroke patients (£ in 2009 prices based on: unit benefit, £373; unit cost,
£161; unit net benefit, £212)
Country/Local subgroup Total number of dysphagia
patients Total cost Total benefit
Total net benefit
Total Population: England, Wales, NI, Scotland 62,960 £10,123,484 £23,471,544 £13,348,060
England (by Strategic Health Authority) 52,711 £8,475,566 £19,650,806 £11,175,240
North East 2,644 £425,109 £985,626 £560,517
North West 7,105 £1,142,435 £2,648,764 £1,506,329
Yorkshire and the Humber 5,354 £860,830 £1,995,855 £1,135,025
East Midlands 4,488 £721,610 £1,673,071 £951,461
West Midlands 5,561 £894,092 £2,072,975 £1,178,883
East of England 5,842 £939,428 £2,178,087 £1,238,659
London 7,847 £1,261,791 £2,925,493 £1,663,702
South East Coast 4,405 £708,303 £1,642,218 £933,915
South Central 4,155 £668,049 £1,548,889 £880,839
South West 5,311 £853,917 £1,979,828 £1,125,911

The economic case for speech and language therapy
Matrix Evidence | December 2010 76
Country/Local subgroup Total number of dysphagia
patients Total cost Total benefit
Total net benefit
Wales (by Unitary Local Authority) 3,081 £495,433 £1,148,674 £653,241
Monmouthshire 95 £15,244 £35,344 £20,100
Gwynedd 125 £20,111 £46,629 £26,517
Pembrokeshire 116 £18,648 £43,237 £24,588
Ceredigion 98 £15,725 £36,459 £20,734
Neath Port Talbot 136 £21,899 £50,774 £28,875
Swansea 237 £38,103 £88,342 £50,240
Conwy 113 £18,215 £42,232 £24,017
Cardiff 336 £54,035 £125,281 £71,246
Rhondda Cynon Taff 240 £38,650 £89,610 £50,961
Anglesey 66 £10,570 £24,506 £13,936
Caerphilly 179 £28,800 £66,774 £37,974
Bridgend 149 £23,893 £55,396 £31,503
Wrexham 143 £23,033 £53,402 £30,369
Flintshire 147 £23,671 £54,882 £31,211
Vale of Glamorgan 121 £19,480 £45,165 £25,685
Carmarthenshire 175 £28,167 £65,305 £37,138
Merthyr Tydfil 56 £8,949 £20,747 £11,799
Newport 140 £22,497 £52,161 £29,663
Denbighshire 102 £16,455 £38,151 £21,696
Blaenau Gwent 75 £12,005 £27,833 £15,828
Torfaen 93 £15,014 £34,810 £19,796
Powys 139 £22,270 £51,633 £29,363

The economic case for speech and language therapy
Matrix Evidence | December 2010 77
Country/Local subgroup Total number of dysphagia
patients Total cost Total benefit
Total net benefit
Scotland (by Local Authority) 5,345 £859,450 £1,992,656 £1,133,206
Aberdeen City 220 £35,395 £82,063 £46,669
Aberdeenshire 251 £40,293 £93,420 £53,127
Angus 113 £18,235 £42,279 £24,043
Argyll & Bute 93 £14,909 £34,567 £19,658
Clackmannanshire 52 £8,356 £19,374 £11,018
Dumfries & Galloway 153 £24,573 £56,972 £32,400
Dundee City 148 £23,745 £55,054 £31,309
East Ayrshire 124 £19,890 £46,115 £26,225
East Dunbartonshire 108 £17,325 £40,168 £22,843
East Lothian 100 £16,018 £37,138 £21,120
East Renfrewshire 92 £14,777 £34,260 £19,483
Edinburgh, City of 492 £79,030 £183,233 £104,203
Eilean Siar 27 £4,319 £10,013 £5,695
Falkirk 157 £25,251 £58,545 £33,294
Fife 374 £60,133 £139,420 £79,287
Glasgow City 606 £97,381 £225,780 £128,399
Highland 227 £36,487 £84,596 £48,109
Inverclyde 83 £13,271 £30,769 £17,498
Midlothian 83 £13,370 £30,999 £17,629
Moray 90 £14,512 £33,646 £19,134
North Ayrshire 139 £22,422 £51,985 £29,563
North Lanarkshire 336 £53,994 £125,186 £71,192
Orkney Islands 21 £3,309 £7,673 £4,364
Perth & Kinross 150 £24,143 £55,975 £31,832

The economic case for speech and language therapy
Matrix Evidence | December 2010 78
Country/Local subgroup Total number of dysphagia
patients Total cost Total benefit
Total net benefit
Renfrewshire 175 £28,130 £65,221 £37,091
Scottish Borders 116 £18,632 £43,199 £24,567
Shetland Islands 23 £3,690 £8,555 £4,865
South Ayrshire 115 £18,434 £42,739 £24,305
South Lanarkshire 320 £51,446 £119,278 £67,832
Stirling 91 £14,694 £34,068 £19,374
West Dunbartonshire 93 £15,025 £34,836 £19,811
West Lothian 176 £28,312 £65,643 £37,331
Country/Local subgroup Total number of dysphagia
patients Total cost Total benefit
Total net benefit
Northern Ireland (by Local Commissioning Boards)
1,822 £293,034 £679,407 £386,373
Belfast LCG 344 £55,331 £128,286 £72,955
Northern LCG 466 £74,855 £173,552 £98,698
South Eastern LCG 349 £56,061 £129,978 £73,917
Southern LCG 359 £57,691 £133,758 £76,067
Western LCG 305 £49,097 £113,833 £64,736

The economic case for speech and language therapy
Matrix Evidence | December 2010 79
Table A3.2. Local level analysis of the impact of SLT in aphasia post-stroke patients (£ in 2009 prices based on: unit benefit, £1,136; unit cost, £843;
unit net benefit, £293)
Country/Local subgroup Aphasia patients
Total cost Total benefit Total net benefit
Total Population: England, Wales, NI, Scotland 52,757 £44,395,631 £59,804,417 £15,408,785
England (by Strategic Health Authority) 44,169 £37,247,923 £50,175,890 £12,927,967
North East 2,215 £1,868,245 £2,516,673 £648,428
North West 5,954 £5,020,708 £6,763,290 £1,742,582
Yorkshire and the Humber 4,486 £3,783,125 £5,096,167 £1,313,043
East Midlands 3,761 £3,171,290 £4,271,978 £1,100,688
West Midlands 4,659 £3,929,305 £5,293,084 £1,363,779
East of England 4,896 £4,128,544 £5,561,475 £1,432,930
London 6,576 £5,545,246 £7,469,884 £1,924,638
South East Coast 3,691 £3,112,810 £4,193,200 £1,080,390
South Central 3,481 £2,935,905 £3,954,895 £1,018,991
South West 4,450 £3,752,746 £5,055,244 £1,302,499

The economic case for speech and language therapy
Matrix Evidence | December 2010 80
Country/Local subgroup Aphasia patients
Total cost Total benefit Total net benefit
Wales (by Unitary Local Authority) 2,582 £2,177,302 £2,932,997 £755,695
Monmouthshire 79 £66,995 £90,248 £23,253
Gwynedd 105 £88,385 £119,061 £30,676
Pembrokeshire 97 £81,955 £110,400 £28,445
Ceredigion 82 £69,108 £93,095 £23,986
Neath Port Talbot 114 £96,242 £129,646 £33,404
Swansea 199 £167,452 £225,571 £58,119
Conwy 95 £80,049 £107,833 £27,783
Cardiff 282 £237,469 £319,890 £82,421
Rhondda Cynon Taff 201 £169,856 £228,809 £58,953
Anglesey 55 £46,451 £62,573 £16,122
Caerphilly 150 £126,569 £170,499 £43,930
Bridgend 125 £105,002 £141,446 £36,444
Wrexham 120 £101,223 £136,355 £35,132
Flintshire 123 £104,028 £140,134 £36,106
Vale of Glamorgan 102 £85,610 £115,323 £29,713
Carmarthenshire 147 £123,785 £166,748 £42,963
Merthyr Tydfil 47 £39,326 £52,976 £13,649
Newport 117 £98,871 £133,186 £34,316
Denbighshire 86 £72,314 £97,413 £25,099
Blaenau Gwent 63 £52,757 £71,068 £18,311
Torfaen 78 £65,983 £88,884 £22,901
Powys 116 £97,871 £131,839 £33,969

The economic case for speech and language therapy
Matrix Evidence | December 2010 81
Country/Local subgroup Total number
of aphasia patients
Total cost Total benefit Total net benefit
Scotland (by Local Authority) 4,367 £3,682,597 £4,960,748 £1,278,152
Aberdeen City 184 £154,169 £207,677 £53,509
Aberdeenshire 210 £165,077 £222,372 £57,295
Angus 95 £78,539 £105,798 £27,259
Argyll & Bute 78 £66,176 £89,145 £22,968
Clackmannanshire 44 £34,906 £47,021 £12,115
Dumfries & Galloway 128 £107,627 £144,982 £37,355
Dundee City 124 £105,446 £142,044 £36,598
East Ayrshire 104 £87,265 £117,553 £30,288
East Dunbartonshire 90 £78,539 £105,798 £27,259
East Lothian 83 £65,449 £88,165 £22,716
East Renfrewshire 77 £64,722 £87,185 £22,464
Edinburgh, City of 412 £326,518 £439,845 £113,327
Eilean Siar 23 £18,907 £25,470 £6,562
Falkirk 132 £105,446 £142,044 £36,598
Fife 313 £254,524 £342,864 £88,340
Glasgow City 507 £421,055 £567,195 £146,139
Highland 190 £151,987 £204,739 £52,752
Inverclyde 69 £61,086 £82,287 £21,202
Midlothian 70 £58,904 £79,348 £20,444
Moray 76 £63,267 £85,226 £21,959
North Ayrshire 117 £98,901 £133,227 £34,326
North Lanarkshire 281 £233,435 £314,455 £81,020
Orkney Islands 17 £13,817 £18,613 £4,796
Perth & Kinross 126 £98,173 £132,247 £34,074

The economic case for speech and language therapy
Matrix Evidence | December 2010 82
Country/Local subgroup Total number
of aphasia patients
Total cost Total benefit Total net benefit
Renfrewshire 147 £125,808 £169,473 £43,665
Scottish Borders 97 £77,812 £104,818 £27,007
Shetland Islands 19 £15,999 £21,551 £5,553
South Ayrshire 96 £81,448 £109,716 £28,269
South Lanarkshire 268 £219,618 £295,842 £76,225
Stirling 77 £62,540 £84,247 £21,706
West Dunbartonshire 78 £67,631 £91,104 £23,473
West Lothian 148 £115,627 £155,758 £40,132
Country/Local subgroup Total number
of aphasia patients
Total cost Total benefit Total net benefit
Northern Ireland (by Local Commissioning Boards) 1,527 £1,287,809 £1,734,781 £446,971
Belfast LCG 288 £243,166 £327,563 £84,398
Northern LCG 390 £328,966 £443,144 £114,177
South Eastern LCG 292 £246,373 £331,883 £85,511
Southern LCG 301 £253,536 £341,533 £87,997
Western LCG 256 £215,769 £290,657 £74,889

The economic case for speech and language therapy
Matrix Evidence | December 2010 83
Table A3.3. Local level analysis of the impact of SLT in children with SLI (£ in 2009 prices based on: unit benefit, £4,334; unit cost, £674; unit net
benefit, £3,660)
Country/Local subgroup Total number
of children with SLI
Total Cost Total Benefit Total Net Benefit
Total Population: England, Wales, NI, Scotland 202,663 £136,607,821 £878,395,193 £741,787,371
England (by Strategic Health Authority) 170,327 £114,811,012 £738,240,607 £623,429,595
North East 8,119 £5,472,432 £35,188,015 £29,715,583
North West 22,996 £15,500,639 £99,669,890 £84,169,251
Yorkshire and the Humber 17,073 £11,508,393 £73,999,548 £62,491,155
East Midlands 14,276 £9,623,223 £61,877,809 £52,254,586
West Midlands 18,605 £12,540,926 £80,638,788 £68,097,862
East of England 19,263 £12,984,456 £83,490,707 £70,506,251
London 25,151 £16,953,273 £109,010,400 £92,057,127
South East Coast 14,510 £9,780,334 £62,888,040 £53,107,706
South Central 13,850 £9,336,049 £60,031,269 £50,695,220
South West 16,484 £11,111,288 £71,446,140 £60,334,853

The economic case for speech and language therapy
Matrix Evidence | December 2010 84
Country/Local subgroup Total number
of children with SLI
Total Cost Total Benefit Total Net Benefit
Wales (by Unitary Local Authority) 9,874 £6,655,999 £42,798,412 £36,142,413
Monmouthshire 308 £207,623 £1,335,024 £1,127,401
Gwynedd 400 £269,602 £1,733,553 £1,463,951
Pembrokeshire 385 £259,439 £1,668,204 £1,408,765
Ceredigion 267 £179,807 £1,156,169 £976,362
Neath Port Talbot 417 £280,833 £1,805,772 £1,524,939
Swansea 720 £485,179 £3,119,726 £2,634,547
Conwy 338 £227,627 £1,463,652 £1,236,025
Cardiff 1,029 £693,391 £4,458,540 £3,765,149
Rhondda Cynon Taff 789 £531,754 £3,419,205 £2,887,451
Anglesey 206 £138,870 £892,941 £754,071
Caerphilly 623 £420,277 £2,702,401 £2,282,124
Bridgend 498 £335,465 £2,157,055 £1,821,590
Wrexham 458 £308,873 £1,986,071 £1,677,198
Flintshire 488 £328,677 £2,113,411 £1,784,734
Vale of Glamorgan 424 £285,652 £1,836,754 £1,551,103
Carmarthenshire 562 £379,157 £2,437,999 £2,058,842
Merthyr Tydfil 182 £122,479 £787,545 £665,066
Newport 488 £329,136 £2,116,362 £1,787,226
Denbighshire 327 £220,174 £1,415,729 £1,195,555
Blaenau Gwent 234 £157,928 £1,015,482 £857,555
Torfaen 301 £202,971 £1,305,112 £1,102,141
Powys 432 £291,087 £1,871,706 £1,580,619

The economic case for speech and language therapy
Matrix Evidence | December 2010 85
Country/Local subgroup Total number
of children with SLI
Total Cost Total Benefit Total Net Benefit
Scotland (by Local Authority) 15,845 £10,680,511 £68,676,228 £57,995,717
Aberdeen City 582 £392,106 £2,521,264 £2,129,158
Aberdeenshire 807 £544,267 £3,499,665 £2,955,398
Angus 340 £229,412 £1,475,128 £1,245,716
Argyll & Bute 254 £170,888 £1,098,820 £927,931
Clackmannanshire 165 £111,194 £714,985 £603,791
Dumfries & Galloway 432 £291,446 £1,874,014 £1,582,568
Dundee City 413 £278,571 £1,791,227 £1,512,655
East Ayrshire 370 £249,309 £1,603,073 £1,353,763
East Dunbartonshire 328 £221,218 £1,422,445 £1,201,226
East Lothian 326 £220,048 £1,414,918 £1,194,871
East Renfrewshire 309 £208,343 £1,339,657 £1,131,314
Edinburgh, City of 1,238 £834,543 £5,366,154 £4,531,611
Eilean Siar 78 £52,671 £338,677 £286,006
Falkirk 490 £330,072 £2,122,378 £1,792,306
Fife 1,127 £759,633 £4,884,479 £4,124,846
Glasgow City 1,679 £1,131,842 £7,277,799 £6,145,957
Highland 679 £457,653 £2,942,729 £2,485,077
Inverclyde 243 £163,865 £1,053,663 £889,797
Midlothian 269 £181,422 £1,166,555 £985,133
Moray 271 £182,593 £1,174,081 £991,488
North Ayrshire 427 £287,935 £1,851,436 £1,563,501
North Lanarkshire 1,101 £742,076 £4,771,587 £4,029,511
Orkney Islands 61 £40,966 £263,416 £222,449
Perth & Kinross 432 £291,446 £1,874,014 £1,582,568
Renfrewshire 528 £355,822 £2,287,953 £1,932,131

The economic case for speech and language therapy
Matrix Evidence | December 2010 86
Country/Local subgroup Total number
of children with SLI
Total Cost Total Benefit Total Net Benefit
Scottish Borders 346 £232,923 £1,497,706 £1,264,783
Shetland Islands 75 £50,330 £323,625 £273,295
South Ayrshire 316 £213,025 £1,369,761 £1,156,736
South Lanarkshire 988 £665,996 £4,282,386 £3,616,390
Stirling 281 £189,616 £1,219,238 £1,029,623
West Dunbartonshire 283 £190,786 £1,226,764 £1,035,978
West Lothian 606 £408,493 £2,626,631 £2,218,138
Country/Local subgroup Total number
of children with SLI
Total Cost Total Benefit Total Net Benefit
Northern Ireland (by Local Commissioning Boards)
6,617 £4,460,299 £28,679,946 £24,219,647
Belfast LCG 1,136 £765,497 £4,922,185 £4,156,688
Northern LCG 1,673 £1,128,038 £7,253,339 £6,125,301
South Eastern LCG 1,238 £834,637 £5,366,756 £4,532,119
Southern LCG 1,392 £938,434 £6,034,176 £5,095,742
Western LCG 1,177 £793,694 £5,103,490 £4,309,797

The economic case for speech and language therapy
Matrix Evidence | December 2010 87
Table A3.3. Local level analysis of the impact of SLT in children with autism (£ in 2009 prices based on: unit benefit, £3,552; unit cost, £2,430; unit
net benefit, £1,122)
Country/Local subgroup Total number
of children with autism
Total cost Total benefit Total net benefit
Total Population: England, Wales, NI, Scotland 8,763 £21,295,114 £31,128,520 £9,833,406
England (by Strategic Health Authority) 7,376 £17,924,119 £26,200,907 £8,276,788
North East 342 £831,392 £1,215,302 £383,910
North West 983 £2,389,319 £3,492,630 £1,103,311
Yorkshire and the Humber 733 £1,781,824 £2,604,614 £822,790
East Midlands 597 £1,450,966 £2,120,976 £670,010
West Midlands 797 £1,936,069 £2,830,084 £894,015
East of England 806 £1,958,674 £2,863,127 £904,453
London 1,276 £3,101,541 £4,533,734 £1,432,193
South East Coast 594 £1,443,543 £2,110,125 £666,582
South Central 585 £1,422,523 £2,079,398 £656,876
South West 662 £1,608,269 £2,350,917 £742,648

The economic case for speech and language therapy
Matrix Evidence | December 2010 88
Country/Local subgroup Total number
of children with autism
Total cost Total benefit Total net benefit
Wales (by Unitary Local Authority) 399 £968,607 £1,415,879 £447,272
Monmouthshire 12 £28,786 £42,078 £13,292
Gwynedd 15 £37,019 £54,114 £17,094
Pembrokeshire 14 £35,175 £51,418 £16,243
Ceredigion 10 £23,330 £34,103 £10,773
Neath Port Talbot 18 £42,728 £62,458 £19,730
Swansea 30 £73,368 £107,248 £33,879
Conwy 13 £31,595 £46,185 £14,590
Cardiff 46 £112,753 £164,818 £52,066
Rhondda Cynon Taff 33 £79,856 £116,731 £36,875
Anglesey 8 £19,729 £28,839 £9,110
Caerphilly 25 £60,944 £89,086 £28,142
Bridgend 20 £49,037 £71,680 £22,644
Wrexham 20 £47,568 £69,534 £21,965
Flintshire 19 £46,712 £68,282 £21,570
Vale of Glamorgan 16 £39,015 £57,031 £18,016
Carmarthenshire 22 £52,902 £77,331 £24,429
Merthyr Tydfil 8 £19,078 £27,888 £8,810
Newport 19 £46,968 £68,657 £21,689
Denbighshire 12 £29,969 £43,808 £13,839
Blaenau Gwent 9 £22,333 £32,646 £10,313
Torfaen 13 £31,083 £45,435 £14,353
Powys 16 £38,657 £56,508 £17,851
Scotland (by Local Authority) 697 £1,694,674 £2,477,221 £782,547

The economic case for speech and language therapy
Matrix Evidence | December 2010 89
Country/Local subgroup Total number
of children with autism
Total cost Total benefit Total net benefit
Aberdeen City 26 £62,215 £90,945 £28,729
Aberdeenshire 36 £86,359 £126,236 £39,878
Angus 15 £36,401 £53,209 £16,809
Argyll & Bute 11 £27,115 £39,636 £12,521
Clackmannanshire 7 £17,643 £25,790 £8,147
Dumfries & Galloway 19 £46,244 £67,598 £21,354
Dundee City 18 £44,201 £64,611 £20,411
East Ayrshire 16 £39,558 £57,824 £18,267
East Dunbartonshire 14 £35,101 £51,309 £16,208
East Lothian 14 £34,915 £51,038 £16,123
East Renfrewshire 14 £33,058 £48,323 £15,265
Edinburgh, City of 54 £132,417 £193,563 £61,146
Eilean Siar 3 £8,357 £12,216 £3,859
Falkirk 22 £52,372 £76,556 £24,184
Fife 50 £120,531 £176,188 £55,657
Glasgow City 74 £179,589 £262,518 £82,928
Highland 30 £72,616 £106,147 £33,532
Inverclyde 11 £26,000 £38,007 £12,006
Midlothian 12 £28,786 £42,079 £13,293
Moray 12 £28,972 £42,350 £13,378
North Ayrshire 19 £45,687 £66,783 £21,097
North Lanarkshire 48 £117,745 £172,116 £54,371
Orkney Islands 3 £6,500 £9,502 £3,002
Perth & Kinross 19 £46,244 £67,598 £21,354

The economic case for speech and language therapy
Matrix Evidence | December 2010 90
Country/Local subgroup Total number
of children with autism
Total cost Total benefit Total net benefit
Renfrewshire 23 £56,458 £82,529 £26,071
Scottish Borders 15 £36,958 £54,024 £17,066
Shetland Islands 3 £7,986 £11,673 £3,688
South Ayrshire 14 £33,801 £49,409 £15,608
South Lanarkshire 43 £105,673 £154,470 £48,797
Stirling 12 £30,086 £43,979 £13,893
West Dunbartonshire 12 £30,272 £44,251 £13,979
West Lothian 27 £64,815 £94,745 £29,930
Country/Local subgroup Total number
of children with autism
Total cost Total benefit Total net benefit
Northern Ireland (by Local Commissioning Boards) 291 £707,714 £1,034,514 £326,800
Belfast LCG 50 £121,461 £177,548 £56,087
Northern LCG 74 £178,985 £261,635 £82,650
South Eastern LCG 54 £132,432 £193,584 £61,153
Southern LCG 61 £148,901 £217,659 £68,758
Western LCG 52 £125,935 £184,088 £58,153

![Comparison of speech and language therapy techniques for ...€¦ · [Intervention Review] Comparison of speech and language therapy techniques for speech problems in Parkinson’s](https://img.dokumen.tips/doc/110x75/5f3cd008f32a407b616e050d/comparison-of-speech-and-language-therapy-techniques-for-intervention-review.jpg)