Embed Size (px)
Citation preview

Strojarstvo 50 (3) 161-168 (2008) S. MARIČIĆ et. al., An Economic and Visual System for Position Check 161An Economic and Visual System for Position Check 161 161
CODEN STJSAO ISSN 0562-1887 ZX470/1341 UDK 65.012.14:658.56:004.93
Preliminary noteFast and efficient position check is extremely important in the production cycle. It is hard for us to check every particular detail in series because of the short time period. So far, the mode of operation has been associated with statistical laws. Depending on the size of series, a random sample is taken in certain percentage, and afterwards the position and geometry are manually controlled. This paper attempts to analyze photogrammetrical approach which allows simple automatically controlled positions set in advance as well as undemanding documentation of all analyzed parts. This kind of approach came into being in a vast industrial environment with a great tendency for further development. For the purpose of the research, the program solution has been developed. This kind of approach recognizes the type and sort of parts automatically and then loads relevant control positions from the database. The proposed approach reduces time needed for position control and therefore enables greater control of higher amount of parts which in turn directly contributes to earlier failure detection. On the other side, program solution can easily be adapted to specific situations in the production plant. As a result of the increase of automatization level, the need for employment is lower and as a result also the cost of control.
Ekonomični vizualni sustav za provjeru pozicijaPrethodno priopćenje
Brza i efikasna kontrola pozicija izuzetno je važna u proizvodnom ciklusu. Međutim, zbog kratkog vremenskog ciklusa teško je izvršiti provjeru svakog pojedinog komada u seriji. Dosadašnji način rada veže se uz statističke zakone. Uzima se nasumični uzorak u određenom postotku od veličine serije i zatim se ručno kontroliraju pozicije i geometrija. U ovom članku se analizira fotogrametrijski pristup kod kojega je omogućena jednostavna automatska kontrola unaprijed zadanih pozicija kao i jednostavna izrada prateće dokumentacije svih analiziranih komada. Ova vrsta pristupa zaživjela je u široj industrijskoj praksi s velikom tendencijom daljnjeg razvoja. Za potrebe istraživanja napisano je programsko rješenje koje automatski prepoznaje tip i vrstu komada te iz baze podataka učitava potrebne kontrolne pozicije. Predloženim pristupom smanjuje se vrijeme potrebno za kontrolu pozicija te se omogućuje kontrola većeg broja komada, što direktno doprinosi ranom otkrivanju pogrješaka. S druge strane programsko rješenje može se jednostavno prilagoditi specifičnim situacijama unutar pogona. Kao posljedica povećanja stupnja automatizacije smanjena je potreba za angažmanom radnika što doprinosi smanjenju troškova kontrole.
Sven MARIČIĆ, Mladen PERINIĆ and Albert ZAMARIN
Tehnički fakultet Sveučilišta u Rijeci (Faculty of Engineering University of Rijeka) Vukovarska 58, HR-51000 Rijeka, Republic of Croatia
KeywordsApplied photogrammetry Fast position control Visual cntrol
Ključne riječiBrza kontrola pozicije Primjena fotogrametrije Vizualna kontrola
Received (primljeno): 2007-06-25 Accepted (prihvaćeno): 2008-04-30
An Economic and Visual System for Position Check
1. Introduction
At present, 2D and 3D reconstruction from existing images is one of the most active areas of photogrammetric and computer graphics [1, 2]. In this particular area, much thought is given to problems related to reconstruction, reverse engineering, shipbuilding industry [3, 4] and quality assurance. Two-dimensional automatic control is widely acknowledged both on main board control and in managing integrated circuits. It is used within the
shipbuilding production process which inevitably requires a quick and reliable dimension control method in each part of the process, in the subassembly phase, assembly at the slipway and equipment phase, all of which impact on a shortening of the production process and production cost cutting. [5]. An advantage compared with the current dimension control approach is, first of all, the possibility of obtaining a large number of measuring points through which form analysis and section dimensions can be created more rapidly and of a high-quality, and the possibility
162 S. MARIČIĆ et. al., An Economic and Visual System for Position Check Strojarstvo 50 (3) 161-168 (2008)
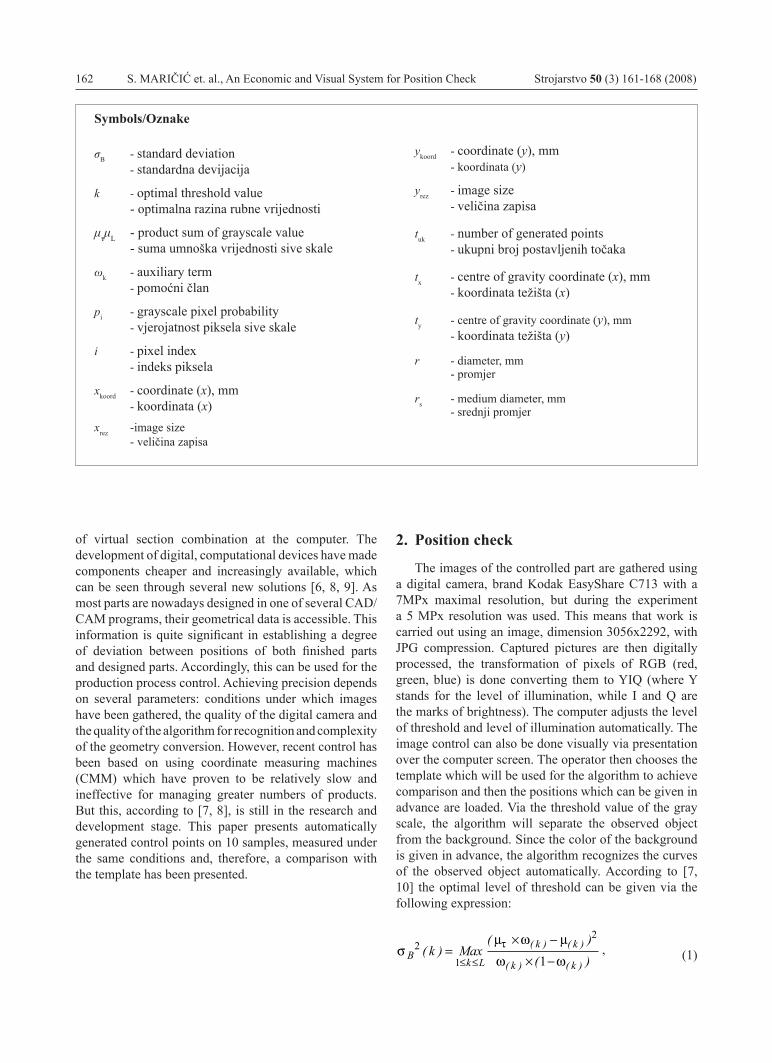
Symbols/Oznake
σB - standard deviation
- standardna devijacija
k - optimal threshold value - optimalna razina rubne vrijednosti
μτμL - product sum of grayscale value - suma umnoška vrijednosti sive skale
ωk - auxiliary term - pomoćni član
pi - grayscale pixel probability
- vjerojatnost piksela sive skale
i - pixel index - indeks piksela
xkoord - coordinate (x), mm - koordinata (x)xrez -image size - veličina zapisa
ykoord - coordinate (y), mm - koordinata (y)
yrez - image size - veličina zapisa
tuk - number of generated points - ukupni broj postavljenih točaka
tx - centre of gravity coordinate (x), mm - koordinata težišta (x)
ty - centre of gravity coordinate (y), mm - koordinata težišta (y)
r - diameter, mm - promjer
rs - medium diameter, mm - srednji promjer
of virtual section combination at the computer. The development of digital, computational devices have made components cheaper and increasingly available, which can be seen through several new solutions [6, 8, 9]. As most parts are nowadays designed in one of several CAD/CAM programs, their geometrical data is accessible. This information is quite significant in establishing a degree of deviation between positions of both finished parts and designed parts. Accordingly, this can be used for the production process control. Achieving precision depends on several parameters: conditions under which images have been gathered, the quality of the digital camera and the quality of the algorithm for recognition and complexity of the geometry conversion. However, recent control has been based on using coordinate measuring machines (CMM) which have proven to be relatively slow and ineffective for managing greater numbers of products. But this, according to [7, 8], is still in the research and development stage. This paper presents automatically generated control points on 10 samples, measured under the same conditions and, therefore, a comparison with the template has been presented.
2. Position check
The images of the controlled part are gathered using a digital camera, brand Kodak EasyShare C713 with a 7MPx maximal resolution, but during the experiment a 5 MPx resolution was used. This means that work is carried out using an image, dimension 3056x2292, with JPG compression. Captured pictures are then digitally processed, the transformation of pixels of RGB (red, green, blue) is done converting them to YIQ (where Y stands for the level of illumination, while I and Q are the marks of brightness). The computer adjusts the level of threshold and level of illumination automatically. The image control can also be done visually via presentation over the computer screen. The operator then chooses the template which will be used for the algorithm to achieve comparison and then the positions which can be given in advance are loaded. Via the threshold value of the gray scale, the algorithm will separate the observed object from the background. Since the color of the background is given in advance, the algorithm recognizes the curves of the observed object automatically. According to [7, 10] the optimal level of threshold can be given via the following expression:
σµ ω µω ωτ
Bk L
k k
k kk Max2
1
2
1( )
( )( )
( ) ( )
( ) ( )=
× −× −≤ ≤
, (1)

Strojarstvo 50 (3) 161-168 (2008) S. MARIČIĆ et. al., An Economic and Visual System for Position Check 163An Economic and Visual System for Position Check 163 163
ω µ µ
µ
τ( ) ( )
( )
, ,
, ,...,
k ii
kk i
i
k
L ii
k
p i p
i p i L
= = × =
= = × =
= =
=
∑ ∑
∑
1 1
11
(2)
2.1. Digital editing
To secure optimal checking of the controlled part on loading of the template, the algorithm creates a distinctive area of image in every position. In Figure 2, the diagram of the whole process of the proposed program solution can be seen. Also, the division into three parts of the structure is seen:
loading,• processing and comparison of products,• failure detection. •
During research, Canny’s algorithm was used for border part detection. Precise border part detection later
provides quality check given positions. According to [11] edges characterize border areas where a significant intensity change occurs. Edge detection provides a significant reduction in the total data amount; irrelevant data is filtered from border area which is not required for further research. Canny’s algorithm consists of several procedures for edge detection. Those procedures are divided into four main steps: noise reduction, size valuation and gradient orientation, seeking local maximum suppression to the gradient magnitude and finding the hysteresis threshold.
After loading the template digital record, which can be done via a relation database, the CAD/CAM system
or the digital camera, the image is treated in the buffer as explained previously. Determining the controlled positions as the next step can be done by using the control monitor or by previous loading from the template if the constructor had planned that. The counter is put at zero position (i=0) and the algorithm is now ready for loading and processing the other parts which are controlled. In a case where the algorithm detects a variation in the given specified positions, the alarm procedure is activated and then failure can be classified as large, medium or small-scale. Depending on the defined mistake level, the control process does not have to be stopped. In that particular case, the specified part is marked. This way provides for a continuation of the algorithm process if the deviations are in the area of allowed tolerance on less important positions. The output for every controlled position is written as text files for the purpose of further easier handling. The data can be imported in the different programs for statistical processing such as MS Excell or OpenOffice Calculator and the additional analyses can be done and presented as a graph.
Figure 1. Sequential images of control and random sample in the circle area error is presentedSlika 1. Usporedni prikaz kontrolnog i nasumičnog predloška, u površini unutar kružnice prikazana je pogrješka
3. Position control
Control of parts is done as the next step. The dimensions of a part are 150 mm x 190 mm. Taking into consideration the previously-mentioned working resolution, the given deviation depends on the following expression:
∆xkoord
rez
xx
mm= =max
,0 062 (3)
∆ykoord
rez
yy
mm= =max
,0 065 (4)
mm,
mm.
.

164 S. MARIČIĆ et. al., An Economic and Visual System for Position Check Strojarstvo 50 (3) 161-168 (2008)
Previously mentioned parts are placed on the control table with a green background for easier definition of the curves. This paper presents control of the whole area of geometry. The camera is fixed on the frame – 1500 mm high and 500 mm distance. There are automatically generated points on the model (Figure 3) divided in relation to several zones. The algorithm automatically defines zones via the distance from the centre of gravity. The acquired results of position deviations from the template position are shown in Table 1.
Figure 3. CAD model - position presentation, geometry controlSlika 3. CAD model - prikaz pozicija, kontrola geometrije
4. Experiments
As mentioned in the introduction, the data acquired from the CAD/CAM system is taken as a referent. The reason lies in the fact that the whole cycle, from projection to development of the product, is made and checked on the computer. That is why the dimensions mentioned are considered as referential. During the process, the conditions in which production takes place change, so different deviations in the quality of parts and the geometry can also take place. It is of great importance to detect the size of those deviations, so that the real cause of failure can be defined. The process of capturing the specimen and its treatment is shown (Figures 4, 5). Capturing the specimen is the first step. The recorded image is transferred to the computer.
In the second and third step shown in Figure 5, the specimen is treated via computer in the way previously described in chapter 2. Then the registered deviations are classified into “allowed” and “non-allowed”. In the case of “non-allowed” deviations, the alarm procedure switches on. A warning relating to failure is also shown.
Figure 2. Diagram presentation of algorithmSlika 2. Prikaz dijagrama toka funkcije

Strojarstvo 50 (3) 161-168 (2008) S. MARIČIĆ et. al., An Economic and Visual System for Position Check 165An Economic and Visual System for Position Check 165 165
Figure 4. Step 1 – transferring data to computerSlika 4. Prikaz koraka 1 – prijenos podataka u računalo
Figure 5. Step 2 – classificationSlika 5. Prikaz koraka 2 – klasifikacija
4.1. Overview of the system
The system described is shown in Figure no. 5. It consists of a standard equipped industrial PC computer which is connected to the digital camera. The configuration of the computer is: Pentium IV 64-bit on 2.8 GHz with 1GB of RAM. Connection between the camera and computer is achieved through USB 2.0. link. In position data or relation database, the CAD/CAM information is preserved. The control algorithm loads the referential
part and then control starts. During data acquisition, it is necessary to secure the same conditions so the given information will be rendered reliable. Throughout the experiment, the major influence of internal conditions was detected. The level of illumination and humidity is of great importance for normal functioning of the proposed algorithm.
The program solution is shown in Figure 7. The main window consists of three frames which are divided into:
Figure 6. Control system – detailsSlika 6. Shematski prikaz sistema kontrole
Pohrana naračunalu

166 S. MARIČIĆ et. al., An Economic and Visual System for Position Check Strojarstvo 50 (3) 161-168 (2008)
digital image of product,• edited digital image of product,• statistical information.•
In the first frame, the currently edited product is shown. During the process, several products can be marked for the purpose of easier identification in the documentation. In the frame of an edited digital image of the product, Canny’s algorithm is applied. In the statistical information frame, the following parameters are shown:
current product: number of generated points,• coordinates of centre of gravity,• characteristic medium diameter from centre of • gravity,number of points inside specific area.•
The given data are exported in a textual file for further statistical analysis. With this operation, a cycle analysis per product is completed. This process is repeated for all products in particular.
4.2. Measured data
Following all measurement implementation, according to the previously described procedure, the data obtained are shown in Table 1. From the given data, it can be concluded that measured values at particular products have a significant deviation. After repeated measurement, it is noted that the algorithm has some tolerance on the axle and rotation, but data deviate when emerging from the tolerance field because the algorithm does not follow border areas taken from the CAD model.
For each product, the algorithm automatically fixes an arbitrary number of control points which are mentioned in column tuk; this primarily depends on geometry complexity, illumination and working resolution. During the experiment, a standard deviation of number showing points was 128.07. Also it is noted that with a smaller level of illumination the number of dots increases. A consequence of this is an increased processor workload because of the larger data amount for analysis with already given deviation. The highest quality data are accomplished with medium diameter evaluation rs where standard deviation was 0.27. With a coordinate evaluation of the centre of gravity, standard deviation moved between 2.78 for tx, i.e. 2.64 for ty. The number of included points at a distance of 0.5r–2r is also shown in Table 1.
Figure 7. Review of programmed solution of main window during sample analyseSlika 7. Prikaz glavnog prozora programskog rješenja prilikom analize predložaka

Strojarstvo 50 (3) 161-168 (2008) S. MARIČIĆ et. al., An Economic and Visual System for Position Check 167An Economic and Visual System for Position Check 167 167
Number of generated points tuk / Generirane točke tuk
Centre of gravity tx / Centar gravitacije tx [mm]
Centre of gravity ty / Centar gravitacije ty [mm]
Medium diameter rs / Srednji promjer rs [mm]
0 - 0,5r 0,5 - 1,5r 1,5 - 2r >2r
Product 1/ Proizvod 1 8376 140,48 113,63 74,30 1142 6030 921 283
Product 2 /Proizvod 2 8495 143,47 113,73 74,84 1144 6103 969 279
Product 3 /Proizvod 3 8476 143,61 114,03 74,86 1146 6083 969 278
Product 4 /Proizvod 4 8240 142,68 116,33 74,51 1143 5833 986 278
Product 5 /Proizvod 5 8265 143,08 116,15 74,72 1150 5834 1012 269
Product 6 /Proizvod 6 8494 143,56 113,83 74,90 1145 6103 967 279
Product 7 /Proizvod 7 8221 136,48 119,00 74,19 1110 5918 889 304
Product 8 /Proizvod 8 8221 136,49 119,00 74,19 1110 5918 889 304
Product 9 /Proizvod 9 8500 142,49 119,74 74,61 1131 6144 920 305
Product 10 /Proizvod 10 8500 142,48 119,74 74,61 1131 6144 920 305
Standard deviation σ /Standardna devijacija σ
128,07 2,78 2,64 0,27 14,61 123,90 42,03 14,28
Table 1. Measured values Tablica 1. Prikaz izmjerenih vrijednosti
5. Conclusion
This paper presents a system for position control which can be easily applied in most industrial areas. This idea is based on a simple program solution which can be modified to particular conditions. To establish a deviation within the product group is not simple, considering the fact that it is a relatively large system with numerous influential variables. A comparative advantage of the proposed system is simple implementation within production plants; a low cost price does not belong in an area of capital investment and adjustment potential to specific qualities within various production plants.
The proposed system is suitable for use because of the compatibility assurance to already existing equipment and record format is standardized for easier analysis to other programs for statistical analysis. The data obtained during the experiment mostly corresponded with anticipated values. During the medium diameter evaluation rs, the standard deviation σ was 0.27 mm. This shows how the
proposed approach has a huge potential in the automatic product control area with the simplest geometric forms. Restrictions which are placed in production plants have to be taken into consideration: each controlled product has to be recorded under the same angle, with the same distance and same illumination level. Attention should be given to a greater flexibility level, which implies managing through on-line control. In the case of a complex technological process such as shipbuilding, a further goal is photogrammetry control dimension and form to combine with the production process so that it can be fast and reliable; it can reveal in time any anomaly and help in elimination while ensuring that during that production process it will not be disrupted or interrupted. In further research, attention will be directed to link identification between illumination level influence into algorithm accuracy and geometry recognition. Also the possibility for reducing error caused by feed-rate as well as the impact on the precision of fixed additional cameras will be investigated.

168 S. MARIČIĆ et. al., An Economic and Visual System for Position Check Strojarstvo 50 (3) 161-168 (2008)
REFERENCES
[1] ZHANG, Y.; ZHANG, Z.; ZHANG, J.: Automatic measurement of industrial sheet metal parts with CAD data and non-metric sequence, Computer Vision and Image Understanding 102, 52–59, 2006.
[2] LEE, S.; CHANG, L. M.; SKIBNIEWSKI, M.: Automated recognition of surface defects using digital color image processing, Automation in Construction 15, 540–549, 2006.
[3] JOHNSON, G. W.; LASKEY, S. E.; ROBSON, S.; SHORTIS, M. R.: Dimensional and Accuracy Control Automation in Shipbuilding Fabrication: An integration of Advanced Image Interpretation, Analysis and Visualization Techniques, XX Congress ISPRS, Istanbul, Turkey, 2004.
[4] THIYAGARAJAN, R.: Use of 3D Laser Scanning and Close Range Photogrammetry for Shipbuilding, Ship Production Track of the World Maritime Conference, San Francisco, USA, 2003.
[5] GOMERČIĆ, M.; KODVANJ, J.; LJUBENKOV, B.; BAKIĆ, A.; MARINOV, A.; DRVAR, N.; HERCIGONJA, T.: Dimensional and Form Control by Photogrammetry, The 16th Symposium on Theory and Practice of Shipbuilding SORTA 2004, Plitvice, Hrvatska, 2004.
[6] ANGELO, P.; WÖHLER, C.: Image-based 3D surface reconstruction by combination of photometric, geometric, and real-aperture methods, ISPRS Journal of Photogrammetry & Remote Sensing 63, 297–321, 2008.
[7] LYU, J.; CHEN, M.: Automated Visual Inspection Expert System for Multivariate Statistical Process Control Chart, Expert Systems with Applications, 2008.
[8] STEVEN, S.: Dimensional Inspection Planning for Coordinate Measuring Machines, PhD Thesis, University of Southern California, USA, 1999.
[9] VUJOVIĆ, I.; PETROVIĆ, I.; KEZIĆ, I.: Wavelet-Based Edge Detection for Robot Vision Applications, Proceedings of the 16th International Workshop on Robotics in Alpe-Adria-Danube Region RAAD 2007, Ljubljana, Slovenia, 318–324, 2007.
[10] NIXON, M. S.; AGUADO, A. S.: Feature Extraction and Image Processing, Butterworth-Heinemann, First edition, 2002.
[11] HERMOSILA, T.; BERMEJO, E.; BALAGUER A.; RUIZ, L. A.: Non-linear fourth-order image interpolation for subpixel edge detection, Image and Vision Computing 26, 1240–1248, 2008.
[12] JÄHNE, B.: Computer Vision and Applications, Academic press, A Harcourt Science and Technology Company, London, UK, 2000.
[13] MING-CHIN, L.: Computer Modelling and Simulation Techniques for Computer Vision Problems, PhD Thesis, State University of New York, USA, 1993.