Embed Size (px)
Citation preview

An Autonomous Telescope Implementation
at the
USQ Mount Kent Observatory
A Dissertation submitted by
Scott Sinclair, BSc
For the award of
Master of Science
University of Southern Queensland
Faculty of Sciences
February, 2010.

ii
Abstract
Over the past decade, the quality and sophistication of optical telescopes commercially
available has dramatically increased, with instruments in a class previously only within
the reach of professional facilities now commonly possessed by advanced amateurs. A
corresponding reduction in cost not only for these optical assemblies, but also for
ancillary equipment such as high quality mounts, CCD cameras and computer hardware
and software has meant that many areas of research, and in particular those appropriate
for high school and university students, are now far more accessible than before, vastly
increasing interest in the study of astronomy and astrophysics. At the same time, there
has occurred a rapid expansion of the Internet, measurable in terms of its pervasiveness,
richness of end-user experience and quality of infrastructure. The combination of these
phenomena has meant that most of the issues that have stymied the development of
remote and robotic observation have now been largely overcome.
Since early 2004, the author and co-contributors from the University of Southern
Queensland’s Faculty of Sciences have been developing a system for remote and robotic
observation at the Mt Kent Observatory site near Toowoomba in South East
Queensland, Australia. Reliable, online access to an observatory is provided, with
students being able to conduct scientific-grade photometric and astrometric research
using a system built primarily of commercial, off-the-shelf components. Further, fully
automated observation is possible, meaning the user is no longer required to interact
with the observatory directly, instead being only required to submit imaging requests
and wait for their electronic delivery.
The various observatory components are described, example results presented and future
directions and possible applications discussed.

iii
Certification of Dissertation
I certify that the ideas, experimental work, results, analyses, software and conclusions
reported in this dissertation are entirely my own effort, except where otherwise
acknowledged. I also certify that the work is original and has not been previously
submitted for any other award, except where otherwise acknowledged.
Signature of Candidate ...…………………………………………………..
Dated this …………… day of ………………2010.
ENDORSEMENT
Signature of Supervisor(s) ...………………………………………………….. ...…………………………………………………..
Dated this …………… day of ………………2010.

iv
Acknowledgements
Firstly, I am grateful to my supervisor Dr. Brad Carter, not only for his professional
guidance and candor, but also for his unshakable faith in my ability to successfully
complete this project in spite of my own uncertainty.
In addition, without the considerable contributions and dedicated commitment of my
peers, the O’Mara Telescope at the USQ Mt Kent Observatory would not be the
professional installation that it is today. In particular, I wish to thank Dr. Roy Duncan,
Dr. Rhodes Hart and Bender Rodriguez whose combined enthusiasm and application of
skills, often in the face of apparently insurmountable challenges, ensured our success.
Finally, to my wife Kirralee and daughters Sophie and Emily, I am eternally indebted
for their understanding and on-going support, unselfishly relinquishing precious time
that could otherwise have been spent together in order for me to complete this
adventure.
Without all of these people, along with those simply too numerous to mention, none of
this would have been possible.
Scott Sinclair.

Table of Contents
Chapter 1 Introduction 1
1.1 A brief history of robotic observation 1
1.2 The USQ Mt Kent Observatory 4
1.3 Aims and Objectives 8
Chapter 2 Method 10
2.1 The Mt Kent O’Mara Telescope System 12
2.2 The Mount 15
2.3 The Telescope Optics 15
2.4 The CCD Camera 19
2.5 The Focuser 22
2.6 Dew Control 23
2.7 Computers 23
2.8 The Job Submission Process 26
Chapter 3 Results 35
3.1 General performance 35
3.2 Astrometric measurement using the O’Mara Telescope 36
3.3 Photometry using the O’Mara Telescope 38
Chapter 4 Discussion of Results 45
4.1 The O’Mara Telescope as a working robotic system 45
4.2 Future teaching and research activities 47

Chapter 5 Conclusions 50
References 51
Bibliography 53
List of Figures 54
List of Tables 55
Glossary of Terms 56
Equations 57

1
Chapter 1
Introduction
1.1 A brief history of robotic observation
The concept of remote and robotic telescopes has its genesis in the late 1970’s during
the period of initial adoption of microcomputers in the field of astronomy and
astrophysics. Projects such as those initiated by Honeycutt et al. (1978) at the Indiana
University to explore the application of computer controlled telescopes laid the
foundation for landmark works such as Microcomputer Control of Telescopes by
Truebold and Genet (1985). Limited by inadequate telecommunications infrastructure,
most ‘robotic’ telescopes could only make use of emerging technologies on site, mainly
for the purposes of target acquisition and tracking. Nevertheless, this was a vast
improvement on traditional techniques, as electronic star atlases could be accessed in
real-time when searching for objects of interest to the observer.
As discussed by Hayes and Genet (1989), the physical separation of astronomers from
their observatories introduced a number of practical difficulties, but by abstracting
observatory operations, astronomers could concentrate on more important research
activities such as data reduction and analysis. It was soon apparent that the observatory
would be required to have a high level of programmability along with a certain degree
of ‘awareness’ in order to react to problems and make simple decisions in the event of
abnormal conditions.
2
With these considerations in mind, the first protocol for robotic telescopic observation
was developed by Hayes, Genet and Boyd and released in 1988. ATIS or the Automatic
Telescope Instruction Set was a set of commands to be used for the control of
unattended telescopes, accessory instruments and observatory infrastructure. For
automated photometry for example, it could be used to open an observatory under
suitable conditions, target the object of interest, make photometric measurements and
return the system to its original state. It also provided mechanisms to detect and
respond to error conditions and log all activity to a local computer. Because ATIS
commands were constructed as a simple ASCII text file with a published extensible
instruction set, it was also possible to share observing ‘plans’ between researchers
regardless of the underlying physical implementations of their equipment. Moreover,
perhaps the most powerful ability of ATIS was that over time, its continued
development finally yielded at least a partial solution to the problem of efficient job
scheduling (Henry 1996).
As technology improved and became more available to the amateur astronomer, so too
did the demand for automation and remote control of their equipment. Computers in the
home environment were becoming commonplace and astronomy was an obvious
application of this newly accessible technology, providing the ability to acquire and
analyze large amounts of useful scientific data.
While large research facilities could allocate significant resources to the task of
automating CCD-equipped telescopes of the day, the amateur (and indeed less well
funded professional observatory) often possessed capable equipment, but no cost-
effective method of implementing automation. Economies of scale quickly provided a
solution, and a market rapidly developed for those willing to devote time and effort in
the hope of a return more than the personal satisfaction of achieving robotic operation of
their own equipment.

3
Commercial applications useful to astronomers were widely available by the mid-
1990’s, and the telescopes available at the time were becoming more and more
advanced, not only being electronically controlled but also having the ability to interface
with personal computers and the software which ran on them.
With the expansion of the Internet, remote operation of high-quality, low-cost
astronomical equipment was now possible, astronomers being able to use a telescope
anywhere in the world in real-time, limited only by their ability to access some interface
to it.
By this time, ATIS had failed to keep up with increasingly feature-rich commercial
offerings, perhaps due to the apparent disappearance of its creators from the
development scene. Few other options were immediately available and while there was
little doubt that open source approaches had merit, a lack of ongoing dedicated support
and a common direction limited adoption on a large scale.
In late 1998, Bob Denny of DC-3 Dreams released Astronomer’s Control Panel (ACP1),
software that ran under the popular Microsoft Windows operating system and provided
full functionality via a personal computer interface to the Meade LX200 Classic. Not
only could it be used to remotely (and therefore possibly robotically) control the LX200,
but it also allowed other applications to utilize this capability as well by employing the
open Windows Scripting interface at its core.
In mid-2001 the first ASCOM (AStronomy Common Object Model) platform was
released simultaneously with an updated version of ACP, whereby the functionality of
individual components could be abstracted in client-hardware interaction. ASCOM was
open source, allowing anyone to write driver software for any device, the only limitation
being that it required the software to run in a Win32 environment. Over time, not only
has ASCOM provided drivers for telescope control, but also for the majority of

4
accessory devices (such as CCD imagers, focusers, etc.) that are a prerequisite for the
successful implementation of an automated observatory such as the one described here.
ASCOM can be regarded as the glue that enables the components of the observatory to
operate together seamlessly. It promotes the construction of complex relationships
between software and hardware without the need to design APIs specific to individual
elements, which too often has been the limiting factor in the development of a working
implementation.
1.2 The USQ Mount Kent Observatory
The Mt Kent Observatory (MKO) has been operated by the University of Southern
Queensland since July 1996 for the purposes of teaching and learning along with
community outreach. It is located approximately 30km from the regional city of
Toowoomba, population approximately 100,000 (ABS 2008), in South-East
Queensland, Australia. At an altitude of 673m and latitude of 27°47’S, the local area
experiences an average of 114 clear days per year (BoM 2007) based on data recorded at
the nearby Oakey station (ICAO code YBOK) from 1957 to 1998.

5
The monthly distribution of clear days is favorable to observation during the cooler
winter months.
Figure 1.1 Mean clear day distribution for Oakey station. (BoM 2007)
A combination of an average yearly rainfall of approximately 950mm which is primarily
concentrated on the summer months (BoM 2007) and generally stable atmospheric
conditions result in seeing at the site being typically observed at around two arc-
seconds, improving to arc-second quality under ideal circumstances. Figure 1.2 shows
the mean rainfall distribution for the years 1869-2007:
Figure 1.2 Mean annual rainfall distribution at Oakey station. (BoM 2007)

6
Measurements collected by the on-site weather station over the period 2005-2009 reflect
this historical data, both in relation to the number of seasonal clear days and average
rainfall.
The impact of human activity on the night sky is evident, with the urban development of
Toowoomba being the primary source of light pollution and atmospheric aerosols, but
since the construction of the observatory, this has not increased to an extent that has
significantly reduced or otherwise limited on-going activities.
There have been several studies carried out in the past to determine the suitability of
Mount Kent for observations by small and medium class optical telescopes. Moller
(1996) determined a mean seeing value of 1.22 arc-seconds for the site, based on a
limited observation period of only three nights during the Autumn/Winter period.
This value is similar to that experienced at other observatories located in Australia such
as Siding Spring (MPC Observatory Code 260) with Wood, Rodgers and Russell (1995)
arriving at a value of 1.2 arc-seconds for that location.
Access to the MKO is by sealed road, with modern facilities providing necessary
support infrastructure for the university’s teaching and research activities.
There are three dome structures at the site, along with the Educational Development
Group (EDG) building which acts as the central focus for accommodation and network
infrastructure, as well as a local control room for the operation of any of the telescopes
at the facility. Network connectivity is provided by microwave link to the main
university campus in Toowoomba and is capable of 22Mbit/sec connection speeds, with
gigabit fiber available from there to the Internet.

7
Figure 1.3 The Mount Kent Observatory site looking West (Carter 2008).
Local weather data is collected at the EDG building by an automatic weather station,
and details of the current conditions are made available in real-time via publicly
accessible web pages or for autonomous agents such as monitoring equipment.
The site supports visual observation, using small manually operated telescopes as well
as hosting two robotic systems. Since 2004, two projects have been underway to
develop fully automated observatories, one in partnership with the University of
Kentucky in the United States (http://orion.mko.usq.edu.au/telescopes/UofL/index.html)
and the second (the O’Mara Telescope) which is described in detail here.

8
1.3 Aims and Objectives
This project aims to develop a small, automated CCD-equipped observatory suitable for,
but not limited to, the study of young rapidly rotating stars, extra-solar planet candidates
and potentially hazardous near-earth objects by research students of the University of
Southern Queensland. Specifically the projects goals are:
1. Design and implement an automated optical observatory that can capture images
of user-selected targets and deliver them with sufficient photometric and
astrometric quality and in such a timely manner to allow effective research.
2. Maximize the efficiency of the system by employing a suitable user interface and
scheduling methodology.
3. Minimize system downtime, by way of careful evaluation, selection and
installation of the various hardware and software components.
Additionally, the capabilities of the system shall meet the following technical
requirements:
1. Be able to image objects between a minimum altitude of 30° and maximum
altitude of 80° regardless of azimuth.
2. Have a limit of resolution that exceeds the average seeing value at the
installation site, and an effective limiting magnitude of at least 18.
This project tests the hypothesis that an automated (robotic), remotely operable
observatory capable of supporting scientific research can be cost effectively
implemented using commercial, ‘off-the-shelf’ components. Further, by limiting the
requirements of the observatory to a few specialized functions that can be applied to a
variety of research activities, the chances of long-term success should be greatly
improved. Validation of this approach offers educational institutions
(especially those engaged in distance education) an effective way to
incorporate research projects in astronomy and astrophysics into undergraduate and
postgraduate education, and expands the range of institutions, groups

9
and individuals who can incorporate observational research in their
activities.
Further to this, if a proven and repeatable recipe is developed according to these
principles, collaboration with other educational institutions becomes much easier, and
the issues of design, implementation and future support are greatly simplified. This
result can only encourage the wider adoption of such technology to enhance teaching
and learning at all levels, but especially so in the secondary and tertiary education
sectors.

10
Chapter 2
Method
In essence, this project is one of integration, by way of testing, evaluating and
implementing off-the-shelf components where possible in order to meet a set of defined
objectives. In order to achieve this, the goals outlined were first converted to a set of
high-level tasks that would satisfy each of them. When looked at in this light, the
completed project consists of following activities:
1. Audit the current hardware and software components of the O’Mara telescope.
2. Design a new system or modify the one in place.
3. Implement the proposed solution.
4. Test the actual system that is installed.
5. Evaluate objectively how well the system performs.
6. Improve if required.
At the commencement of the project, the O’Mara Telescope comprised of a Celestron
C-14 Schmidt-Cassegrain optical tube assembly attached to a Software Bisque
Paramount ME German Equatorial mount. This combination was housed in the 2.3m
central dome enclosure and had been assembled by previous students and USQ staff
with the intention of developing an automated system. A series of on-going problems
had meant progress had stalled in achieving the intended goals, with the most important
obstacles encountered being summarized as:
Poor pointing accuracy and repeatability of the Paramount ME mount
Apparent inaccurate tracking performance of the Paramount ME mount
Development of a suitable Internet-accessible control interface

11
No way of efficiently scheduling observations
Based on a detailed analysis of the pointing and tracking issues encountered which were
similar to experiences of the author at another installation (MPC E25 – APTA
Rochedale), it was proposed that the 14” Celestron was the most likely source of the
errors displayed as the focusing mechanism had been heavily modified in an attempt to
reduce ‘mirror-flop’.
In order to determine if the Celestron was indeed the problem, it was removed, a small
refractor attached to the mount in its place and a series of pointing tests performed using
a webcam attached directly to the eyepiece. As a result of these tests, it was established
beyond doubt that the majority of problems with the original configuration could be
attributed to the C-14, presumably related to the modifications to the mirror mounts and
focuser as mentioned earlier.
At this point the decision was made to replace it with a smaller known-good 12” Meade
of similar Schmidt-Cassegrain design. This would be a significant reduction in aperture,
but being able to perform the task of robotic observation, even with a reduced set of
available targets, was the over-riding consideration.
Figure 2.1 The O’Mara Telescope.
12
2.1 The Mt Kent O’Mara Telescope System
The O’Mara Telescope at the Mount Kent Observatory is made up of a number of sub-
components linked together to make up the system. Each element has been chosen
based on a variety of factors, including previous experiences, existing performance,
budget limitations and future capability. They can each be regarded as part of the
overall process in the construction of the working observatory and as such shall be
described in detail separately.
Numerous attempts have been made to implement automated observatories in the past,
and in most cases where success has not be achieved, the problems have often been
traced back to trying to reinvent the wheel and solve a myriad of complex tasks in-
house.
In this project, the task was not to construct new components to meet the aims and
objectives outlined, but rather to reach a solution through the careful selection,
evaluation and integration of existing hardware and software available that were able to
perform tasks individually.

13
Figure 2.2 An overview of the O’Mara Telescope System.

14
Figure 2.3 Block diagram of the relationships between the components.
The majority of hardware and software used are physically located within the dome
structure housing the O’Mara telescope itself, with the exception of the weather station
and associated sensors (located atop the EDG building) and the Internet-accessible web
server (currently housed at the University of Queensland in Brisbane, Australia).

15
2.2 The Mount
The primary purpose of any telescope mount is to accurately point the optics and imager
at a desired target with repeatable accuracy. In the case of extended imaging (be it
photographic or by CCD), it must also track this target for the exposure duration,
countering the effects of the Earth’s rotation and introducing as few inaccuracies as
possible, thereby maximizing the quality of the data acquired.
The Paramount ME is a commercial computer-controlled German Equatorial mount
manufactured by Software Bisque of Golden, Colorado in the United States. It is
marketed as a research-grade, high quality mount and is widely used at numerous
observatories around the world. With a claimed maximum 7 arc-second peak-to-peak
periodic error, it was purchased by USQ in 1998 to provide a solid foundation to robotic
observation projects. After periodic error correction the mount allows for unguided
exposures of up to 300 seconds in its current configuration, and combined with the CCD
imager employed, enables the system to reach a limiting magnitude of around 19 under
ideal conditions.
The mount does have some important limitations, most notably an inherent inability to
be controlled by any software other than that which it is packaged with, “The Sky
Version 6.0”, at present only being implemented on the Microsoft Windows operating
system.
2.3 The Telescope Optics
As mentioned, when initially evaluated it was evident that the existing system was
unable to accurately point with any degree of repeatability. Many hours of trouble-
shooting were carried out by staff and students of the university with little progress, on
the assumption that the Paramount ME was the cause of the problems, due to either
software issues or the mechanical characteristics of the mount itself.

16
Pointing errors that were not only of varying magnitude (up to 3 degrees), but also not
predictable based on the area of the sky being observed (i.e. being dependent upon the
orientation of the mount) were observed, and these would become apparent with no
obvious pattern.
The designs of the majority of modern, commercially available Schmidt-Cassegrain
telescopes typically employ a primary mirror that is mounted on a suspended cell (see
Figure 2.4), moved in relation to the secondary mirror to achieve focus. Under normal
circumstances such as during visual observation, this does not generally cause a
problem, as any image shift is compensated for by the observer. For automated
observations, which have far greater accuracy requirements along with extended
exposure times, the mirror must remain suitably fixed at all times and in an attempt
achieve this, the existing 14” Celestron SCT had been retro-fitted by the USQ
mechanical workshops with a locking mechanism to prevent movement of the mirror
cell at all orientations.
Since the modifications that had been carried on the optical tube assembly were
undocumented, it was impossible to determine the extent to which they may have
contributed to the errors observed. It was decided that instead of continuing with the
current investigation, it would be better to replace the Celestron with a small refractor,
thereby removing the complicated light paths and mechanical properties of the Schmidt-
Cassegrain design. Once this telescope was installed, practically all of the errors
previously encountered immediately disappeared, with performance of the system being
observed at or very near to what was expected.

17
Figure 2.4 The schematic layout of a typical commercial
SCT, with the arrow indicating the focuser mechanism.
With the knowledge that the Paramount ME was performing to specification, and that
the Celestron 14” was no longer usable for the project, a smaller replacement Meade 12”
SCT was sourced and attached for testing. This telescope is equipped with a locking
mechanism as part of its design and when used in conjunction with the mount and
associated hardware, appeared to resolve all of the issues previously encountered.
This action meant a re-evaluation of the original goals of the project, with the reduction
in telescope aperture from 14” to 12” having the potential to affect the number of targets
that would be available to the observatory for research. The first critical attribute of the
observatory affected by this change was Light Gathering Power, which is proportional
the total surface area of the primary mirror. Since telescope objectives are typically
circular, the area can be specified in terms of aperture (d) being the diameter of the
objective:
(1)

18
It follows then, that the L.G.P. increases as the square of the aperture. The comparison in light gathering power between the two telescopes available for the project can be expressed as:
This meant that by installing the Meade 12”, the observatory would see approximately a
25% reduction in light gathering power. This obviously would affect overall
performance for the purpose of research and therefore needed to be considered carefully
before a final decision was made. To replace the 14” with another optical tube of
similar specifications would also impose an additional capital expense in the order of
A$7,500 which was beyond the budget of the project.
The next issue to be addressed was to what extent the Resolving Power of the system
would be changed. It is derived from the Dawes limit:
where α is the resolving power in arcseconds and D is the aperture, in inches. Provided
this value remained below the effective seeing limitations of the site, there would be no
impact on the performance of the system. When considering the two available
telescopes with values of 0.32 arcsec for the C14 and 0.38 arcsec for the Meade, there
would be little effect as seeing would likely never approach these values.
In the end, it was concluded that there was not enough of an impact in any of these areas
to justify the expenditure when the 12” was immediately available at no cost and so was
installed.
(2)
(3)

19
2.4 The CCD camera
Imaging is accomplished by way of a SBIG STL-1301E CCD camera with array of 1280
x 1024 pixels. Operating at f/10, this configuration provides an effective field of view
of 23.084 x 18.467 arc seconds with an imaging resolution of 1.082 arc seconds per
pixel. Integral to this camera is a five position filter wheel housing research-grade 2”
Johnson/Bessell UBVRI glass filters. The high quantum efficiency of the device (see
Figure 2.5) in this camera allows for an effective limiting magnitude for CCD
observations (up to 300 seconds) of approximately 19.5 before image quality is reduced
due to electronic noise etc. The technical specifications of the STL-1301E when
attached to the optical tube assembly are presented below:
CCD Format 1280 x 1024 pixels
Pixel size 16 microns
Telescope Aperture 304mm
Operating Focal Ratio 10
Focal Length 3040mm
Image Scale 1.082 arc seconds per pixel
Field of view 1385” x 1108”
23.08’ x 18.46’
.385 x .308 degrees
Notes : Formula for radian measure in terms of radius (r)and arc length (s)
Pixel scale = 206,265 arc seconds x pixel size/focal length
Table 2.1 Optical specifications of the O’Mara Telescope.

20
Figure 2.5 Quantum Efficiency of the KAF-1301E CCD (Source: Kodak).
The most reliable method to measure a CCD camera’s performance is to evaluate the
total signal to noise ratio of the system, which is given by the well known “CCD
equation”
The individual terms are N*, the total (sky subtracted) number of photons from the
source; npix, the number of pixels contained within the aperture; Ns, the total number of
sky photons per pixel; Nd, the total number of dark current electrons per pixel and Nr,
the read noise in electrons per pixel. As noted by
Howell (1989), for the majority of modern CCD devices, the dark current is negligible
to the extent that it may be safely ignored.
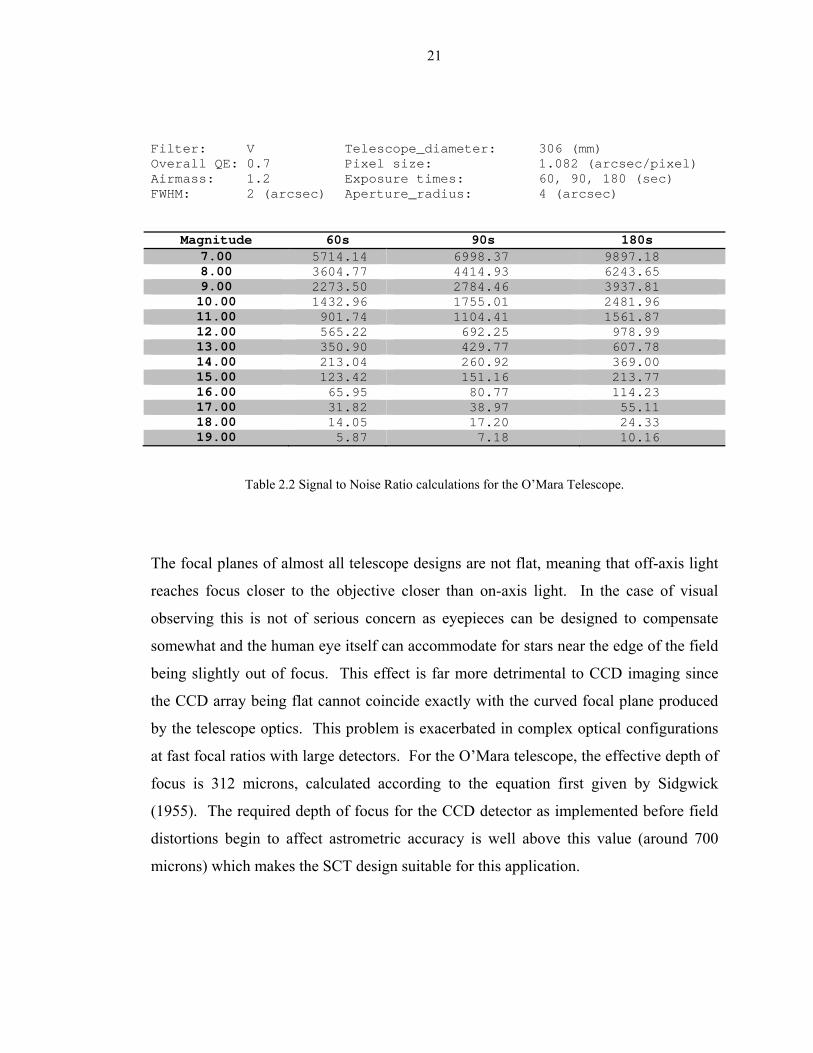
Evaluation of equation above, with parameters taken from the aims and objectives of the
project mentioned previously, result in the following values for the O’Mara telescope
for exposure times of 60, 90 and 180 seconds:
(4)
21
Filter: V Telescope_diameter: 306 (mm) Overall QE: 0.7 Pixel size: 1.082 (arcsec/pixel) Airmass: 1.2 Exposure times: 60, 90, 180 (sec) FWHM: 2 (arcsec) Aperture_radius: 4 (arcsec)
Magnitude 60s 90s 180s 7.00 5714.14 6998.37 9897.18 8.00 3604.77 4414.93 6243.65 9.00 2273.50 2784.46 3937.81 10.00 1432.96 1755.01 2481.96 11.00 901.74 1104.41 1561.87 12.00 565.22 692.25 978.99 13.00 350.90 429.77 607.78 14.00 213.04 260.92 369.00 15.00 123.42 151.16 213.77 16.00 65.95 80.77 114.23 17.00 31.82 38.97 55.11 18.00 14.05 17.20 24.33 19.00 5.87 7.18 10.16
Table 2.2 Signal to Noise Ratio calculations for the O’Mara Telescope.
The focal planes of almost all telescope designs are not flat, meaning that off-axis light
reaches focus closer to the objective closer than on-axis light. In the case of visual
observing this is not of serious concern as eyepieces can be designed to compensate
somewhat and the human eye itself can accommodate for stars near the edge of the field
being slightly out of focus. This effect is far more detrimental to CCD imaging since
the CCD array being flat cannot coincide exactly with the curved focal plane produced
by the telescope optics. This problem is exacerbated in complex optical configurations
at fast focal ratios with large detectors. For the O’Mara telescope, the effective depth of
focus is 312 microns, calculated according to the equation first given by Sidgwick
(1955). The required depth of focus for the CCD detector as implemented before field
distortions begin to affect astrometric accuracy is well above this value (around 700
microns) which makes the SCT design suitable for this application.

22
2.5 The Focuser
Most commercially available SCTs do not perform well for CCD imaging due to the
primary mirror being required to change position in the optical path to allow for
focusing. By locking the mirror and suppressing this movement, image shift is
prevented, but therefore requires that another method of focusing the image must be
employed.
In this case, an Optec TCF-S Crayford focuser is attached to the rear cell which results
in zero image shift during focusing regardless of telescope orientation.
The Crayford focuser works by applying pressure on a drive shaft which in turn presses
against a flat machined surface on the focuser tube. This tube is held in place by sets of
bearings on the opposing side and the opposing forces eliminate the play inherent in
rack and pinion designs. A diagrammatic representation of this design appears below:
Figure 2.6 The Crayford Focuser design.
Focusing is achieved automatically using the Half Flux Diameter strategy described in
Weber and Brady (2001), using the software developed by them and typically within 90
seconds, before each integration. This is necessary in order to allow for changes of the

23
optical properties of the system which vary throughout an observing session due to
temperature variations.
The relationship between the various components of the assembly appears in Figure 2.5
Figure 2.7 The three major components of the optical train of the O’Mara Telescope.
2.6 Dew Control
All catadioptric telescopes suffer from dew forming on the front corrector in high-
humidity, low-temperature conditions. To prevent this, a low wattage 12 Volt DC
electrical heater strip that wraps around the front of the Meade has been fitted. This
warms the optics above the dew point to prevent the formation of dew. Whenever the
dome is open for observing, it is in operation.
2.7 Computers
As would be expected, there is a significant amount of computer hardware required in
order to implement this type of system. The individual PCs that form part of the system,
along with the purpose they each serve follows.
Windows Server PC (“Fry”)
This computer performs the majority of the roles related to the operation of the MKO
observatory hardware itself. Not only is it physically connected to the actual

24
components of the observing platform, but it also serves as the hub for inter-
communication between most of the software components, primarily using the ASCOM
interface standard.
On it is installed The Sky Version 6.0 (for control of the Paramount ME),
MaximDL/CCD (operation of the CCD camera) and Automodome (for the control of
dome rotation and shutter opening and closing. There are also ancillary support
applications such as Atomic Time for synchronization of the computers clock (using the
NTP protocol) along with MPO Canopus, should there be a need for data analysis of
captured images on-site. The entire observatory could, in theory be controlled from this
PC either locally, or by remote terminal emulation across the USQ network or the
Internet.
A number of software components are required to interact in order for the system to
function. From the outset, a series of possible combinations were considered, but due to
the Paramount ME being able to be controlled via The Sky Version 6.0 exclusively, the
only option for an operating system environment was a Microsoft Windows based
solution. In order to maximize system stability, Microsoft Windows Server 2000 was
chosen and this further restricted the choice of other elements. The final list of
application software implemented and a brief description their individual role is listed
below:
The list of relevant software installed on this machine is as follows:
The Sky Version v6.0: controls the Paramount ME for pointing at and tracking of
target objects. (Software Bisque, 2005).
Maxim DL v3.00: controls the CCD camera and filter wheel for CCD imaging.
Also performs some level of image processing on the raw images acquired.
(Diffraction Limited, 2004).
Automadome: controls the dome enclosure to keep the dome's slit synchronized
with the telescope's pointing (Software Bisque, 2005).

25
Astronomer’s Control Program (ACP): provides interface for software above via
ASCOM, and also provides FTP (remote) access for the images that have been
requested. (Denny 2005).
FocusMax: Automates focusing of the selected object before each integration
using the Half Flux Diameter algorithm. (Weber and Brady, 2001).
Linux Server PC (“Bender”)
The Linux server PC inside the dome monitors conditions at the site, and is responsible
for environmental monitoring, error detection and mitigation and other system failsafe
operations. Should error conditions be detected, it has the ability to override all other
on-site systems in order to prevent damage to the observatory.
The principal data collected by this machine is via the Davis Weather Station and
Boltwood Cloud detector at the EDG building, with the following readings monitored:
Ambient External Temperature
EDG Building Internal Temperature
Dome Internal Temperature
Wind Speed and Direction
Sky Clarity (Cloud)
Relative Humidity
Communication is provided across the local TCP/IP network and the relevant
information presented via standard HTTP web pages. There are also other sensors
attached to this machine inside the dome for the detection of dew and rain which serve
to prevent damage to any of the equipment due to the ingress of water.

26
UQ-Based Web Server
The main interface presented to the user is hosted on a publicly accessible web server
located at the St Lucia campus of the University of Queensland. Developed in co-
operation with other USQ faculty members, it is a critical component of the final
implementation because the process of job submission and simplicity of user interaction
is a key factor in the success or otherwise of the project.
This machine accepts user requests for observations, hosts the scheduling engine
described in Duncan (2007) and also acts a repository for the images taken by the
system. In addition, some post-processing of images is performed automatically should
it be requested by the user, the details of which are beyond the scope of this work.
2.8 The Job Submission Process
There are a number of alternatives available to a user when they wish to submit job
requests to the O’Mara telescope. These are presented via form style web pages at the
observatory website (http://www.apta.net.au), and are controlled by user authentication
requiring only a modern web browser.
When a visitor arrives at the website, they have a number of options available to them,
some of which (such as browsing images made publically available) require no user
credentials. A brief example of a simple observation request using an installed filter is
outlined below:

27
Figure 2.8 The initial login page of the O’Mara Telescope web site.

28
For a job to be submitted the user must have an account on the system provided to them
previously and once logged in, they are presented with a menu of options.
Figure 2.9 Top level options available to authenticated users.
By selecting “Submit new imaging requests” a sub menu becomes available allowing for
a variety of options related to the type of observation required.
Figure 2.10 Criteria-based observation options available for imaging requests.

29
As an example, selecting “Simple Robotic with a Filter” presents the following screen
which allows for searching of the install catalogues for the desired object.
Figure 2.11 Catalog search input page.
The search results of the object(s) entered are displayed and the user may select from
those returned based on the displayed extended information provided.
Figure 2.12 Catalog search results page.

30
When confirmed, the system requests a level of priority based on simple quality and
efficiency metrics which are briefly explained.
Figure 2.13 Image priority and quality confirmation page.
The desired filter is then selected from a pull-down menu of those available
Figure 2.14 Filter selection page.

31
Finally, the system provides an overview of the request for final submission.
Figure 2.15 Final job submission confirmation page.
Upon successful submission, the user is provided with details of the request and receives
an email confirmation to their nominated email account.
Figure 2.16 Submission receipt page.

32
Figure 2.17 Job submission email receipt sent to the user.
Once the submission process has been completed, the scheduling engine processes the
job and inserts it in the telescope schedule according the availability of telescopes on the
network. At present, only the O’Mara telescope is available for job requests, although
future expansion of the network is envisaged.

33
The results of the subsequent scheduling for this example are shown below:
Figure 2.18 Job submission scheduling results.

34
Figure 2.19 Example daily planner detail for the submitted request.

35
Chapter 3
Results
3.1 General performance
The USQ Mt Kent O’Mara telescope has operated successfully for the majority of clear
nights since final implementation in late 2008. Given favorable conditions, over 200
images are routinely captured per observing session, resulting in an efficiency (the
proportion of actual integration time during minutes of astronomical darkness) that
approaches 60%. This value is based on average exposures over the course of a night of
180 seconds. When exposures are shorter, the efficiency of the system drops due to a
increase in the proportion of time being spent acquiring target objects.
Focusing performance is highly efficient, with ambient temperature variations during an
imaging session being the primary cause for refocusing to be needed, however a stable
observatory environment keeps this requirement to a minimum. On average, the system
may re-focus three or four times per night, each operation taking as little as two minutes
to complete.
Less than one percent of requested target fields are not able to be automatically plate
solved by the system software, displaying a high level of initial pointing performance.
The recorded whole sky pointing model displays a RMS error of less than 30 arc-
seconds, equivalent to the apparent angular diameter of the planet Jupiter.
Finally, the observatory has demonstrated an ability to function autonomously, to be
able to detect the onset of inclement weather and react to appropriately without human
intervention.

36
3.2 Astrometric measurement using the O’Mara Telescope
As stated in the aims and objectives, accurate astrometry is one of the goals of the
project. One method by which this can be objectively assessed by is if an observatory is
allocated an official IAU observatory code, required by such bodies as the Minor Planet
Center before they will accept data relating to the positional measurement of existing
(numbered) or newly discovered asteroids and comets.
A documented formal procedure exists to achieve such a designation, and can be
accessed via the Guide to Minor Planet Astrometry on the IAU Minor Planet Center
website located at:
http://www.cfa.harvard.edu/iau/info/Astrometry.html
On the evening of the 27th of July 2009, image requests were submitted of two
moderately bright main belt asteroids, 3850 ‘Peltier’ and 13166 ‘1995 WU’. Both of
these targets were selected due to their favorable position in the southern sky during the
coolest part of the night and visible magnitudes (15 and 16 respectively) which were
expected to be within the capabilities of the system.
Once images were successfully captured, data-reduced and stored by the observatory,
they were downloaded to the author’s personal computer and processed manually using
“Astrometrica” (Raab 2010), a commercial application specifically made for the purpose
of identifying and reporting minor planets.
After processing, Astrometrica compiled an email submission automatically, and in the
correct format for submission to the MPC. As no observatory code had yet been
allocated to Mt Kent, ‘XXX’ appears in the submission below, which effectively
requested that a new one be assigned should the observations be of sufficient scientific
quality.

37
COD XXX
COM Long. 151 51 18.0 E, Lat. 27 47 51.7 N, Alt. 670m
CON Scott Sinclair, University of Southern Queensland [[email protected]]
OBS Scott Sinclair
MEA Scott Sinclair
TEL 0.30-m Schmidt-Cassegrain + CCD
ACK MPCReport file updated 2009.07.28 16:42:08
NET UCAC-2
03850 C2009 07 27.44069 19 02 37.07 -20 54 22.3 15.2 V XXX
03850 C2009 07 27.45890 19 02 36.15 -20 54 28.9 15.3 V XXX
03850 C2009 07 27.60355 19 02 28.65 -20 55 19.2 15.9 V XXX
03850 C2009 07 29.36765 19 01 08.63 -21 05 40.8 15.6 V XXX
03850 C2009 07 29.38705 19 01 07.85 -21 05 47.9 15.3 V XXX
03850 C2009 07 29.40520 19 01 06.98 -21 05 54.2 15.5 V XXX
13166 C2009 07 27.44315 18 57 57.46 -39 56 59.1 16.1 V XXX
13166 C2009 07 27.46146 18 57 56.38 -39 56 58.3 15.8 V XXX
13166 C2009 07 27.56684 18 57 49.80 -39 56 57.2 16.1 V XXX
13166 C2009 07 29.37041 18 56 05.99 -39 56 12.7 16.1 V XXX
13166 C2009 07 29.38962 18 56 04.88 -39 56 12.3 16.0 V XXX
13166 C2009 07 29.40782 18 56 03.83 -39 56 11.8 15.8 V XXX
Figure 3.1 MPC formal astrometric submission.
The columns of the submission format are self-evident, but briefly each observation is
presented as the object designation, date (accurate to within one second), right ascension
and declination along with visual magnitude. This data, along with the latitude and
longitude of the observatory is used to determine the ability of a system to accurately
record to positions of objects against the stellar background.
Observations are required to be made over a number of nights, and as such follow up
observations were made of the same targets on the 29th of July 2009 and submitted in
the same manner.

38
The following day, correspondence was received from the MPC advising the MKO Mt
Kent had been allocated the IAU code of E22.
Your site is now code E22. ----------------------------------------------------------------------- Gareth V. Williams, MS 18, 60 Garden Street, Cambridge, MA 02138, U.S.A. Associate Director, Minor Planet Center [email protected] http://www.cfa.harvard.edu/iau/mpc.html OpenVMS and RISC OS: Refined Choices in Operating Systems
For this code to be allocated on the first attempt indicated that the system was able to
achieve positional accuracy to within 1 arc second of moving targets, approaching the
limits of its imaging capabilities.
Subsequent observations of minor planets have continued to demonstrate similar results
and are discussed in the following chapter.
3.3 Photometry using the O’Mara Telescope
Images obtained with CCD detectors are affected by numerous properties of the
observing system, and before they can be used for scientific research must be corrected
to take these effects into account. Unlike the task of astrometry, precise photometric
measurement requires calibration of the system against known reference stars and
subsequent application of so called ‘master calibration frames’ to the raw images before
accurate analysis can be performed. This activity must be carried out on a regular basis
as subtle changes in the properties of any optical system will cause the reduced scientific
data to be erroneous.

39
There are many examples in the literature (such as Parimucha1 & Vanko 2005)
outlining methods by which this is achieved and the process is well known to the author
and shall not be described here.
Once calibrated frames are produced, the generation of light curve graphs can be
accomplished by a variety of methods, both manual and more recently by automated
software. This software exists as open source applications (such as IRAF, available
from http://iraf.noao.edu/) and in commercial variants, under a variety of operating
system environments.
One such software package is MPO Canopus, developed by The Minor Planet Observer
and Palmer Divide Observatory (http://www.minorplanetobserver.com). It is primarily
used to measure positions of asteroids and determine their rotational periods based on
photometric measurement. This is achieved by automatically processing a series of
calibrated images, comparing the computed magnitudes of the target object (whether it
be a minor plant or star) against known references within the field, and generating a
light curve graph for each. Since the software uses multiple reference stars within an
imaged field, it is ideal for determining the photometric accuracy of an imaging system
across a wide range of magnitude values.
After calibration frames were created for the MKO Mt Kent system, a suitable Landolt
(Landolt 1992) field was selected based on air mass for the observation period chosen;

40
Field Center: RA = 08:53:17 Dec = -00:42:00 (J2000)
Star RA (J2000) Dec (J2000) B‐V U‐B V‐R R‐I
100 162 08:53:15 ‐00:43:29 9.150 1.276 1.497 0.649
Figure 3.2 Landolt Field surrounding SAO 136365.
Fifty frames were acquired during an imaging session on the nights of 13/14th February,
2010 and processed using MPO Canopus to determine the accuracy of the system.
A simplified table of the reduced data is presented below which shows the Julian Date
of each observation, the airmass at the time along with the recorded magnitudes of the
calibrated frames.
Julian Date V Magnitude Air Mass
2455240.71470 9.130 1.156
2455240.71595 9.061 1.158
2455240.71726 9.143 1.16
2455240.71858 9.167 1.163
2455240.71979 9.116 1.165
2455240.72096 9.117 1.167

41
Julian Date V Magnitude Air Mass
2455240.72213 9.119 1.169
2455240.72330 9.082 1.172
2455240.72443 9.158 1.174
2455240.72579 9.135 1.177
2455240.72709 9.093 1.18
2455240.72840 9.118 1.183
2455240.72961 9.126 1.185
2455240.73080 9.142 1.188
2455240.73199 9.180 1.191
2455240.73328 9.161 1.195
2455240.73476 9.121 1.198
2455240.73612 9.106 1.202
2455240.73737 9.140 1.206
2455240.73858 9.131 1.209
2455240.73977 9.128 1.213
2455240.74097 9.134 1.216
2455240.74580 9.200 1.232
2455240.74714 9.180 1.236
2455240.74836 9.197 1.24
2455240.74956 9.199 1.245
2455240.75102 9.153 1.25
2455240.75236 9.127 1.255
2455240.75355 9.165 1.26
2455240.75481 9.210 1.265
2455240.75734 9.160 1.275
2455240.75877 9.182 1.281
2455240.76010 9.179 1.287
2455240.76139 9.197 1.293
2455240.76898 9.364 1.33
2455240.77027 9.357 1.336
2455240.77146 9.246 1.343
2455240.77285 9.196 1.351
2455240.77427 9.199 1.359
2455240.77483 9.264 1.362
2455240.77628 9.216 1.37
2455240.77764 9.164 1.378
2455240.77896 9.178 1.386
2455240.78019 9.253 1.394

42
Julian Date V Magnitude Air Mass
2455240.78142 9.185 1.402
2455240.78270 9.341 1.41
2455240.78755 9.284 1.444
2455240.78896 9.314 1.454
2455240.79024 9.342 1.464
Table 3.1 V Magnitude and Air mass measurements of SAO 136365.
When these results are presented in a graphical format, is becomes apparent that the
system achieves a relatively high level of photometric accuracy, within 0.015 and 0.05
of a magnitude of the expected data of the target star in the V band.
Figure 3.3 Airmass of SAO 136365 during photometric measurement.

43
Figure 3.4 V Mag of SAO 136365 during photometric measurement.
Figure 3.5 Computed photometric variance of SAO 136365.

44
After these initial results were collected from a star with stable photometric properties, it
was decided to test the ability of the system to detect the light curve produced by a
variable target.
RZ Pyx (SAO 176601) is a magnitude 9.12(V) early type binary star first identified as
variable by Hoffmeister (1936). It is further described by Kinman (1960) and more
recently by Malcolm and Bell (1986). It exhibits a regular period of 0.65627 days with
a 0.9 magnitude variation in the V band (Kinman 1960), and is well placed for
observation from Mt Kent from December to March.
Ephemerides were retrieved online from http://www.as.up.krakow.pl/o-c/index.php3
and used to construct an observing plan for the nights of 21 and 22 of February 2010.
35 observations were subsequently made, but due to poor weather were not evenly
distributed across the two sessions.
The observations were again reduced using MPO Canopus and differential magnitudes
formed with respect to comparison stars in the same field. These data were then plotted
against existing published data (Breger 1968).
Figure 3.6 Light curve (measured points versus Breger) of RZ Pyx.

45
Chapter 4
Discussion of Results
4.1 The O’Mara Telescope as a working robotic system
The results presented here demonstrate that the MKO O’Mara telescope system is a
fully operational robotic observatory. The facility has in fact been in continual
operation over the past two years, with students, USQ staff and the general public
capturing images of selected targets on most clear nights at the site.
Further, the observatory has successfully measured the positions of minor planets to
sub-arc second accuracy, sufficient to be allocated a permanent IAU observatory code.
With a limiting magnitude of approximately 19, the observatory is capable of searching
for and detecting faint asteroids.
Another outcome has been the precision measurement of a Landolt standard star (within
0.015 magnitudes) and a periodic variable star, suggesting that the telescope should be
capable of determining the rotational periods of active stars using star spot photometry.
Present results also act as an encouraging starting point for future work in exo-planet
transit photometry.
Overall, the observatory has demonstrated its capacity to monitor moving targets along
with objects of varying brightness such as stars. Future improvements to the optics and
imaging equipment should enhance the telescope’s ability in the area of scientific
research.
The value of an observatory such as this when implemented successfully cannot be
underestimated. The O’Mara telescope’s role in supporting distance education at the
University of Southern Queensland provides students the ability to be directly involved

46
in practical research activities. It is a tool that has the simultaneous properties of
accessibility, flexibility and a high level of scientific quality.
As a teaching resource, it is a practical tool for the collection of useful scientific data,
which can either be used to confirm or otherwise supplement that gained from other
sources, or stand-alone as the basis for the design of observing plans to test new
theories.
On the other hand, merely providing access to high-quality imaging equipment to those
that may not be otherwise able to access it offers the opportunity to appreciate the
wonders of the night sky, so often now degraded to such a degree to be disappointing to
all but the most enthusiastic of observers.
Possible uses of this ‘ad-hoc’ ability to request images also include transit phenomena
such as asteroid flybys and occultations (Sinclair 2004), unexpected impact events
(Wesley 2009) and the appearance of long period comets. Not only are the data
adequate from the point of view of speed of acquisition, but it is also of a quality such
that it would have the potential to contribute to a larger scale research effort should it be
required.
For astrometric tasks, the performance of the system is very high, with residuals being in
the order of 0.5 to 1 arc second across the entire sky. This is an important property for
such an installation as it provides the opportunity for interesting work to be carried out
on a variety of relevant undergraduate research topics such as celestial mechanics,
asteroid light curve determination and general astrometry of solar system bodies.
When used as a research instrument in this manner, the system has far greater
functionality and therefore potential usefulness to the end user. The astrometry example
herein demonstrates that the system is capable of automating a complex and extended
set of requests, and greatly improves the degree to which the observatory can be utilized
by single researcher or indeed a larger group.

47
By employing efficient and flexible scheduling, observatory output is maximized,
resulting in a higher output of usable data than would otherwise be possible using
traditional approaches.
4.2 Future teaching and research activities
It is recommended that the O”Mara telescope be utilized primarily for undergraduate
activities as follows:
A program that tasks students with the acquisition, interpretation and
presentation of data collected with the telescope as part of their coursework.
The outcome would be a student report equivalent to that prepared as if they
were in a laboratory environment.
The program would be targeted at undergraduate students, however would also
be of value and could be offered to high school level students and their teachers
as part of wider outreach activities.
The science component would comprise of a choice between asteroid detection
and variable star photometry. Suitable software for these activities already
exists, notably ImageJ which has been extensively used for astronomy.
The program could be implemented and be assessed as part of existing courses
offered by the University of Southern Queensland, and its success evaluated
within the current framework of student feedback and course review
mechanisms by academic staff.
Another possible area of research (and perhaps the most interesting due to recent public
focus on the near earth object threat) is that related to the study of asteroid light curves.
Due to unseasonal weather patterns during the final stages of the project, a planned
observational program of binary asteroid candidates was unable to be undertaken and

48
instead is scheduled for the August-October 2010 observing window. The activities that
will make up this program are outlined in the following narrative.
For the compilation of asteroid light curves, the CCD camera would be used with the V
filter applied which maximises the sensitivity of the photometric array. As shown
earlier, the KAF-1301E reaches a maximum quantum efficiency of 72% at around
550nm which corresponds to the 'V' band of the installed filter set.
Possible targets have been identified firstly by selecting asteroids for which good
rotational data was readily available, then entering them in to The Sky software to
ensure they would be visible at the observatory. Exposure times are to be fixed at 30,
60, 120 and 180 seconds depending on the expected brightness of the object being
observed and other factors such as sky brightness, which is affected by the lunar phase
etc. These of course can be adjusted should the need arise, and can be entered as any
value from .001 to 3600 seconds as required.
The following list of potential targets has been compiled as available for study in the
coming months:
Object V Magnitude
(3105) Stumpff 15.1
(3850) Peltier 15.9
(6384) Kervin 14.5
(13166) 1995 WU1 16.0
Table 4.1 Potential binary asteroid targets for August-October 2010.
49
Each object is to be imaged as part of a time series, and by allowing changes in the
background field, confirmation of photometric calibration to standard R-band
magnitudes using sufficient stars from the Landolt standards (Landolt 1992) is possible.
These standards are imaged at air-masses between 1.1 and 2.5 during the observation
window and extinction values derived for the purpose of calibration. Since all images
are taken with the 'V' filter, they are calibrated as for the Cousins R system.
Of potential future interest is the search for new minor planets using alternative
techniques to those described here such as time delay integration. Further work to
explore its possible inclusion in research activities is expected as the site is included in
more undergraduate programs.
50
Chapter 5
Conclusions
The details and capabilities of the O’Mara Telescope at the USQ Mount Kent
Observatory have been described. It has been shown that an installation which can
obtain high quality images using modest commercial equipment need not require the
presence of an observer at the telescope, since the data acquisition can be performed
robotically.
The system can routinely make in excess of 200 observations per night, largely due to
the combined efficiencies of each sub-component (hardware, acquisition software and
most importantly the scheduling engine), but also due to a high degree of reliability as
would be expected from commercially supported instruments. Furthermore, this can be
done extremely economically, with minimal system downtime and little human
intervention.
The observatory has been constructed, tested and implemented successfully within the
budget constraints of a regional university faculty and would not be beyond the
resources of an individual or small astronomy collective.
In contrast to other pragmatic approaches, solving the overall problem of
interoperability rather than each sub-task individually has resulted in a working
implementation of a robotic observation platform, that satisfies that aim and objectives
of the project and provides a solid foundation for future enhancement.

51
List of References
Breger, M. 1968, Photoelectric Observations of DS Andromedae and RZ Pyxidis. PASP, Vol. 80, p.417
Carter, B. (2008) Telescopes at Mt Kent Observatory 2007 University of Southern Queensland, viewed 1 July 2008, http://orion.mko.usq.edu.au/telescopes/index.html
2006 Census QuickStats : Toowoomba Statistical District (QLD) 2008 Australian Bureau of Statistics, viewed 20 March 2009, http://www.censusdata.abs.gov.au
Climate Statistics for Australian Locations: Toowoomba 2007 Australian Government Bureau of Meteorology, viewed 5 July 2008, http://www.bom.gov.au/climate/averages/tables/cw_041103.shtml
Climate Statistics for Australian Locations: Toowoomba 2007 Australian Government Bureau of Meteorology, viewed 5 July 2008, http://www.bom.gov.au/climate/averages/tables/cw_041103.shtml
Castellano, T. et al. 2004, The Journal of the American Association of Variable Star Observers, 33, 1, 1. Duncan, A. R. 2007. Observation Scheduling for a Network of Small-Aperture Telescopes. Publications of the Astronomical Society of Australia 24, 53–60.
Everett, M., Howell, S., 2001, A Technique for Ultrahigh-Precision CCD Photometry. PASP, 113, 1428.
Hayes, D. S., and Genet, R.M., (eds.) 1989, Remote-Access Automatic Telescopes (Mesa, AZ: Fairborn Press).
Henden, A. A., & Kaitchuk, R. H. 1990, Astronomical Photometry (Richmond: Wilmann‐Bell)
Henry, W. H., ATIS Dispatch Scheduling of Robotic Telescopes, ASP Conference Series, Vol. 87, 1996.
Hoffmeister, C., 1936. Astr. Nachr., 258, 39.
Honeycutt, R.K., Kephart, J.E., and Hendon, A.A. 1978, Sky and Telescope, 56, 495.

52
Howell, S.B, 1989, Two-dimensional aperture photometry - Signal-to-noise ratio of point-source observations and optimal data-extraction techniques. PASP, Vol. 101, p.616.
Kinman, T.D., 1960. Mon. Not. R. astr.Soc. Sth Afr., 19, 62.
Landoldt, A.U., 1992, UBVRI photometric standard stars in the magnitude range 11.5-16.0 around the celestial equator. Astronomical Journal, 104, 340.
MPC Guide to Minor Body Astrometry, Minor Planet Center, Cambridge, MA, viewed 20 July, 2009, http://www.cfa.harvard.edu/iau/info/Astrometry.html
Malcolm, G. J. & Bell, S.A., 1986. Mon. Not. R. astr.Soc. Sth Afr., 45, Nos 1 & 2.
Moller, P., 1996, Astronomical seeing measurements using a differential image motion monitor. (Toowoomba: USQ Press).
Parimucha1, S. & Vanko, M. 2005, Photometry of the variable stars using CCD Detectors, Contrib. Astron. Obs. Skalnat´e Pleso 35, 35 – 44, (2005)
Raab, H., 2009, Shareware for research grade CCD Astrometry http://www.astrometrica.at/
Sidgwick, J.B.,1955, Amateur Astronomer’s Handbook. (London:Faber & Faber)
Sinclair, S.V., 2004, Asteroid (4179) Toutatis to Pass Closely By Earth on Wednesday, September 29, 2004., viewed 20 July 2009 http://neo.jpl.nasa.gov/news/news144.html
Truebold, M. and Genet, R.M., 1985, Microcomputer Control of Telescopes (Richmond: Willmann-Bell).
Weber, L., and Brady, S., Fast Auto-Focus Method and Software for CCD-based Telescopes, viewed 20 July, 2009 http://users.bsdwebsolutions.com/~larryweber/ITSPaper.htm
Wesley, A. 2009, Impact mark on Jupiter., viewed 21 July 2009 http://jupiter.samba.org/
Wood, P.R., Rodgers, A.W., Russell, K.S. 1995, Seeing Measurements at Freeling Heights and Siding Spring Observatory, Astronomical Society of Australia, vol. 12, pp. 97-105.

53
Bibliography
Davis Instruments. http://www.davisnet.com Fattal, R., Lischinski, D., and Werman, M. 2002. Gradient domain high dynamic range compression. ACM Transactions on Graphics 21, 3 (Proc. SIGGRAPH 2002), 249--256. Genet, Russell., et al. Robotic Observatories. (Mesa, AZ: Autoscope Corporation, 1989). Henry, G. W., & Hall, D.S., ATIS and the Evolution of Automatic Telescopes. I.A.P.P.P. Communications No. 52, p82-84, Summer 1993, (NASA Astrophysics Data System). Optec Inc. Technical Manual for Theory of Operations and Operating Procedures for and of the TCF-S Focuser. Accessed 10 December 2007. http://www.optec.inc
Mallama, A. 1993. The Limiting Magnitude of a CCD Camera. Sky & Telescope., Vol. 85, No. 2, p. 84 – 86 Montenbruck, Oliver. Practical Ephemeris Calculations. (Berlin: Springer-Verlag 1989). Romanishin, W. An Introduction to Astronomical Photometry using CCDs. (OK: University of Oklahoma 2001). Rutten, H. & van Venrooij, M. Telescope Optics. (Richmond VA: Willman-Bell 1998).
Santa Barbara Instrument Group. http://www.sbig.com
West, Mark. Astronomical Site Survey for Future Telescopes on the Darling Downs. (QLD: University of Southern Queensland 1995).
Wodaski, Ron. The New CCD Astronomy. (Duvall WA: New Astronomy Press 2002).

54
List of Figures
Figure 1.1 Mean clear day distribution for Oakey station. 5
Figure 1.2 Mean annual rainfall distribution at Oakey station. 5
Figure 1.3 The Mount Kent Observatory site looking West. 7
Figure 2.1 The O’Mara Telescope. 11
Figure 2.2 An overview of the O’Mara Telescope System. 13
Figure 2.3 Block diagram of the relationships between the components. 14
Figure 2.4 The schematic layout of a typical commercial SCT. 17
Figure 2.5 Quantum efficiency of the KAF-1301E CCD. 20
Figure 2.6 The Crayford Focuser design. 22
Figure 2.7 The major components of the optical train of the O’Mara Telescope. 23
Figure 2.8 The initial login page of the O’Mara Telescope web site. 27
Figure 2.9 Top level options available to authenticated users. 28
Figure 2.10 Criteria-based observation options available for imaging requests. 28
Figure 2.11 Catalog search input page. 29
Figure 2.12 Catalog search results page. 29
Figure 2.13 Image priority and quality confirmation page. 30
Figure 2.14 Filter selection page. 30
Figure 2.15 Final job submission confirmation page. 31
Figure 2.16 Submission receipt page. 31

55
Figure 2.17 Job submission email receipt sent to the user. 32
Figure 2.18 Job submission scheduling results. 33
Figure 2.19 Example daily planner detail for the submitted request. 34
Figure 3.1 MPC formal astrometric submission. 37
Figure 3.2 Landolt Field surrounding SAO 136365. 40
Figure 3.3 Airmass of SAO 136365 during photometric measurement. 42
Figure 3.4 V Mag of SAO 136365 during photometric measurement. 43
Figure 3.5 Computed photometric variance of SAO 136365. 43
Figure 3.6 Light curve (measured points versus Breger) of RZ Pyx. 44
List of Tables
Table 2.1 Optical specifications of the O’Mara Telescope. 19
Table 2.2 Signal to Noise Ratio calculations for the O’Mara Telescope. 21
Table 3.1 V Magnitude and Air mass measurements of SAO 136365. 42
Table 4.1 Potential binary asteroid targets for August-October 2010. 48
56
Glossary of Terms
API Application Programming Interface. Astrometry The branch of astronomy that relates to precise
measurements and explanations of the positions and movements of stars and other celestial bodies.
Differential Photometry Measurement of the brightness of a celestial object
compared to a known source, e.g. standard magnitude star Ephemeris An ephemeris is a tabulation of computed positions and
velocities (and/or various derived quantities such as right ascension and declination) of an orbiting body at specific times.
Geocentric Refers to a reference system centered at the Earth, or
viewed or measured as from the center of the Earth. Light Curve A light curve is a chart that graphs the variation in
magnitude with time.
Minor Planet Relatively small celestial bodies composed of metals and rocks that revolve around the sun, a.k.a asteroid and planetoid.
MPC Minor Planet Center, the organization responsible for the
collection, computation, checking and dissemination of astrometric observations and orbits for minor planets and comets.
Photometry The measurement of the flux or intensity of an
astronomical object's electromagnetic radiation.

57
Equations
1) The surface area of the telescope objective. 2) The ratio of the 14” Celestron to the 12” Meade optical tube assemblies. 3) The resolving power of a given aperture. 4) Signal to Noise Ratio of a Charge-Coupled Device.