Embed Size (px)
Citation preview

ARTICLE IN PRESS
0969-8043/$ - se
doi:10.1016/j.ap
�CorrespondE-mail addr
Applied Radiation and Isotopes 66 (2008) 1419–1426
www.elsevier.com/locate/apradiso
An autonomous in situ detection system for radioactivity measurementsin the marine environment
C. Tsabarisa,�, C. Bagatelasb, Th. Dakladasc, C.T. Papadopoulosb, R. Vlastoub, G.T. Chronisa
aHellenic Centre for Marine Research, Institute of Oceanography, P.O. Box 712, GR-19013 Anavyssos, GreecebDepartment of Applied of Mathematic and Physical Sciences, National Technical University of Athens, Zografou Campus,
Polythechnioupoli, GR-15780 Athens, GreececDepartment of Electrical Engineering, National Technical University of Athens, Zografou Campus, Polythechnioupoli, GR-15780 Athens, Greece
Received 14 December 2007; accepted 10 February 2008
Abstract
A new detection system named ‘‘KATERINA’’ is developed and applied for measuring marine radioactivity using NaI(Tl) as a crystal.
This apparatus is designed for qualitative and quantitative radionuclide detection in the marine environment with maximum depth of
deployment 400m. A detailed study for the enclosure of the system and for the electronics development is performed. The system
offers volumetric activities in Bq/m3 using the marine efficiency calibration, which is measured by dilution of three reference sources
(99mTc, 137Cs, and 40K) in a special tank. The calibration procedures for energy, energy resolution and efficiency were analyzed with
particular attention to the factors that affect the calibration parameters. The underwater detector is tested in the field for acquiring radon
daughters (214Pb and 214Bi) in a region where submarine groundwater discharge exists in the coastal zone.
r 2008 Elsevier Ltd. All rights reserved.
Keywords: Autonomous underwater detectors; Marine radioactivity; Scintillation spectrometry
1. Introduction
The most common method for radioactivity measure-ments in the environmental sciences is gamma ray spectro-metry. The traditional laboratory analysis is a time-consuming method and demands special facilities andknow-how for the chemical treatment of the samples,introducing various uncertainties concerning the tracer-reference data and half-life limitations. In addition, theapplication of in situ underwater detection systemsdemands, stability and reliable marine efficiency calibra-tion, provided that the energy of the gamma rays from thevarious involved radionuclides does not overlap.
In situ detection systems for long-term measurements arevery scarce concerning their applicability in the marineenvironment. NaI(Tl) are the most common crystals forlong-term measurements due to low consumption, goodefficiency and low cost. Such crystals are used during the
e front matter r 2008 Elsevier Ltd. All rights reserved.
radiso.2008.02.064
ing author. Tel.: +3022910 76410; fax: +30 22910 76323.
ess: [email protected] (C. Tsabaris).
last years in many marine applications like continuousmeasurements with buoy operation (Aakenes, 1995;Soukissian et al., 1999; Wedekind et al., 1999; Tsabarisand Ballas, 2005; Osvath et al., 2005), seabed mapping(Maucec et al., 2004; Osvath and Povinec, 2001) and in situmeasurements of gamma ray emitters in seawater (Povinecet al., 1996; van Put et al., 2004). Other scintillators havealso been applied (YAP-Ce) for radon measurements(Plastino et al., 2002) to simulate environments ofgeophysical interest found in geothermal and volcanicareas. HpGe detectors were also used in aquatic environ-ments and on the seabed (Povinec et al., 1996), but thecooling of the crystal could not make such a systemapplicable for long-term measurements in the marineenvironment.In addition, a lot of effort has been made during the last
years in developing software for simulating the measuredspectra. NaI(Tl) crystals have relatively bad energyresolution compared to HpGe detectors, so that variousemissions from naturally occurring radionuclides overlapand a lot of observed photopeaks cannot be accepted for
ARTICLE IN PRESSC. Tsabaris et al. / Applied Radiation and Isotopes 66 (2008) 1419–14261420
further analysis. Various methods have been developed inthe literature (Vlastou et al., 2006; Vlachos and Tsabaris,2005) for the simulation of NaI(Tl) gamma spectrometers,taking into account the photon interactions in the seawaterand the crystal.
Radon monitoring is a significant application,since it is atracer strongly correlated to microseismicity (Singh et al.,1999) and to the dynamics of groundwater input into thecoastal zone (Burnett, 2003). Continuous monitoringdemands long-term data and buoy operation is needed.The application of underwater spectrometers in deep-watermasses (4200m) for short acquisition periods (3–12 h)demands the independent operation of any computerconnection for acquisition and data storage.
In the present work, a new autonomous system forradioactivity measurements named ‘‘KATERINA’’ ispresented, which can be applied in a variety of radio-nuclides (Jones, 2001) like naturally occurring radio-nuclides (238U daughters, 232Th daughters, 235U and 40K),cosmogenic radionuclides (207Bi) as well as for anthropo-genic radionuclide detection (137Cs, 134Cs, 95Zr/95Nb,106Ru and 60Co). The detection system was studied forstability and linearity, and was calibrated for energy,energy resolution and efficiency, and is tested in the fieldfor geophysical purposes detecting the 222Rn daughters(214Bi and 214Pb).
Table 1
The specifications of the detection system ‘‘KATERINA’’
Sensor type 300 � 300 NaI(Tl)
Energy range Adjustable maximum and minimum
energy of detection (with maximum
value of 3000 keV)
ADC Successive approximation 10 bit
High voltage Internally controlled 100–1200V
Spectroscopy Adjustable 256, 512 or 1024 channels
Gain amplification, pole-zero
cancellation, base-line restoration
Internally controlled and adjustable
Dead time o0.5% in aquatic operation mode
Energy resolution (140.5 keV) 10%
Energy resolution (661.6 keV) 6.5%
Operating temperature �5 1C to +50 1C
Consumption 1.2�1.4W
Preset time Gross g and g-spectrometry
Output Time, date, cps, spectrum, dead time.
RS232 settings Baud rate adjustable, parity ‘‘space’’,
flow control ‘‘none’’
Enclosure Shape ‘‘Cylinder’’, material ‘‘Acetal’’
2. Experimental
2.1. System description
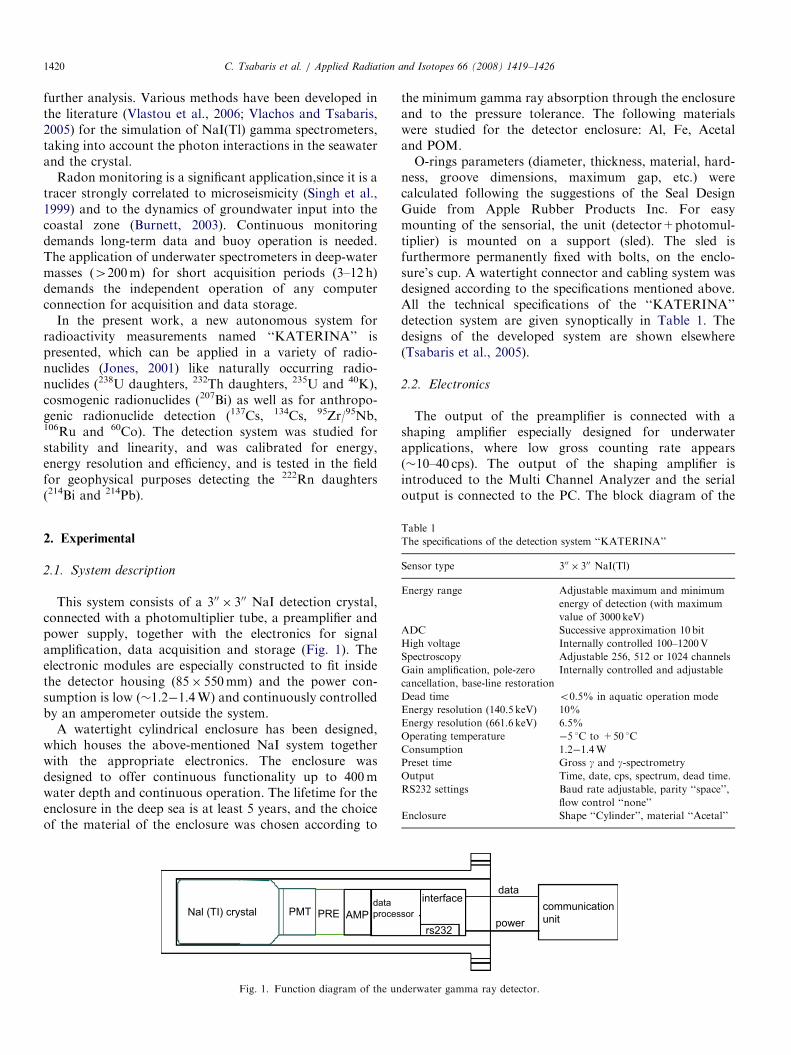
This system consists of a 300 � 300 NaI detection crystal,connected with a photomultiplier tube, a preamplifier andpower supply, together with the electronics for signalamplification, data acquisition and storage (Fig. 1). Theelectronic modules are especially constructed to fit insidethe detector housing (85� 550mm) and the power con-sumption is low (�1.2�1.4W) and continuously controlledby an amperometer outside the system.
A watertight cylindrical enclosure has been designed,which houses the above-mentioned NaI system togetherwith the appropriate electronics. The enclosure wasdesigned to offer continuous functionality up to 400mwater depth and continuous operation. The lifetime for theenclosure in the deep sea is at least 5 years, and the choiceof the material of the enclosure was chosen according to
Nal (TI) crystal PMT PRE AMPdataproces
Fig. 1. Function diagram of the un
the minimum gamma ray absorption through the enclosureand to the pressure tolerance. The following materialswere studied for the detector enclosure: Al, Fe, Acetaland POM.O-rings parameters (diameter, thickness, material, hard-
ness, groove dimensions, maximum gap, etc.) werecalculated following the suggestions of the Seal DesignGuide from Apple Rubber Products Inc. For easymounting of the sensorial, the unit (detector+photomul-tiplier) is mounted on a support (sled). The sled isfurthermore permanently fixed with bolts, on the enclo-sure’s cup. A watertight connector and cabling system wasdesigned according to the specifications mentioned above.All the technical specifications of the ‘‘KATERINA’’detection system are given synoptically in Table 1. Thedesigns of the developed system are shown elsewhere(Tsabaris et al., 2005).
2.2. Electronics
The output of the preamplifier is connected with ashaping amplifier especially designed for underwaterapplications, where low gross counting rate appears(�10–40 cps). The output of the shaping amplifier isintroduced to the Multi Channel Analyzer and the serialoutput is connected to the PC. The block diagram of the
sorinterface
rs232
data
powercommunicationunit
derwater gamma ray detector.

ARTICLE IN PRESSC. Tsabaris et al. / Applied Radiation and Isotopes 66 (2008) 1419–1426 1421
whole procedure is shown in Fig. 2. A special memory andmicrocontroller is incorporated in the system in order to beindependent of any computer connection.
The amplifier uses the CR- (RC) 2 method (oneintegrator and two differentiators) for the shaping of theinput pulse (pre-amplifier output). It offers adjustments forthe amplification gain, so that the maximum and minimumdetection energy is adjusted according to the requestedapplication. The shaping time, the pole-zero cancellationand base-line restoration can also be adjusted for achievinghigh performance of the system (optimum energy resolu-tion, efficiency and dead time). The general characteristicsof the developed shaping amplifier are given in Table 2.
The amplifier consists of the following stages as shown inFig. 2:
�
Input stage: A jumper for adopting the input resistance(50 or 93O). This follows the optoisolator, which makesthe main amplification. � Stage pole–zero cancellation and integrators. � Stage of the 1st differentiator. � Stage of the 2nd differentiator. � Stage of baseline restoration adjustment.Table 2
� The specifications of the shaping amplifierOperating voltage 9–18V
Shaping method CR-(RC)2
Shaping time constant 590 ns–7ms (optional)Input Unipolar (negative or positive)
Input impedance 50O or 93O (optional)
Gain 10–100 dB (optional)
Table 3
The characteristics of the calibrated point sources. The activity is the
reference value
Isotope Energy (keV) Half-life Activity (Bq) Ig (%)
137Cs 661.6 30.2 yr 41,700 8560Co 1173.2 100
1332.5 5.26 yr 36,200 10022Na 511 2.60 yr 33,100 180
1274.5 10054Mn 834.8 313 d 33,000 100109Cd 88 464d 42,600 3.765Zn 1115.5 244 d 37,100 5157Co 122.1 271 d 45,700 85.5
Stage of output optoisolation.
The spectrometer is equipped with an electronic boardallowing measurements to be carried out in the autono-mous mode (without cable connection) as well as in thereal-time mode (with cable communication).
2.3. Calibrations
The underwater detector is calibrated (energy, energyresolution and efficiency) from energy threshold to3000 keV and tested for its stability to temperaturevariations. The detection system was required to becalibrated first in the laboratory with and without theprotective cover for choosing the most appropriatematerial of the housing. This calibration was performedwith seven specific point sources of gamma radiation (seeTable 3), which were placed in a fixed geometry and thedistance between the source and the detector was 13.1 cm.The activity was corrected for the period of measurement.
Measurements of detector efficiency and absolutecalibration in Bq/m3 have also been performed in thewater environment. For this purpose, a calibration tank of
Crystal, PM andPreAmp
input BufferAmplifier
Pole ZeroCancellation
(S-1)
s(s+1)1s
integrator
Fig. 2. Block diagram for the electroni
5.5m3 volume filled with water was used (see Fig. 3). Theunderwater detector was mounted in the middle of the tankin order to be surrounded by one meter of water, which isenough to simulate the high attenuation of the gammarays (for Ego1100 keV). At the bottom of the tank, anelectric pump was used to circulate the water, to mix theappropriate radionuclides with the water and to obtainhomogenous conditions.
2.4. Field measurements
The system was installed in a special frame and wasdeployed in two regions in Evoikos Gulf, where submarinegroundwater discharges appear in the coastal zone. Duringthese experiments, a CTD system was deployed in order tomeasure conductivity, temperature and density of theseawater, and then to specify the position of the wholesystem (output of the groundwater) according to theminimum values. The system was positioned 1m abovethe seabed and 2m below the sea surface and wasconnected with a battery together with a simple personalcomputer for real-time measurements.
du/dt
Differentiator1
du/dt
Differentiator2 Baseline restorer Output Buffer
1
SpectrumAnalyser
c modules, acquisition and storage.

ARTICLE IN PRESS
1m
1m
Fig. 3. Layout of the water tank along with the NaI detector.
Fig. 4. Total attenuation coefficients for four candidate materials (Fe, Al,
Acetal and POM).
Fig. 5. Acquired spectra using the ‘‘KATERINA’’ detector in the
laboratory. The reference point source is 137Cs. The solid line represents
the spectrum without the enclosure material Acetal and the dotted line
with it.
C. Tsabaris et al. / Applied Radiation and Isotopes 66 (2008) 1419–14261422
3. Results
3.1. Detector enclosure
The minimum gamma ray absorption through theenclosure was studied using four candidate materials forthe enclosure (Al, Fe, Acetal and POM). In Fig. 4 the totalattenuation coefficient is depicted as a function of energyfor the above materials. Acetal exhibits the lowest value ofthe total mass attenuation coefficient multiplied by thedensity of the material. The attenuation coefficients werecalculated with the XCOM software package (Berger andHubell, 1995). The thermoplastic material Acetal is chosenfor the enclosure of the system for maximum depthdeployment 400m. The material has an excellent resistancein the sea environment, as well as good mechanical strength
properties. The wall thickness of the cylindrical enclosurehas been calculated using Roark’s thick wall formulas(Tsabaris and Thanos, 2004). In order to take into accountthe creeping behavior of the thermoplastic material,additional calculations have been performed using theapproved ‘‘Under Pressure’’ housing design softwarepackage from Deep-Sea Company (Tsabaris and Thanos,2004). A conservative working strength of 0.9 ksi has beenassumed for Acetal. Two radial and one axial Buna N(nitrile) O-rings have been used in order to achieve a verygood sealing mechanism despite the frequent reopening ofthe enclosure.
3.2. Calibrations
Typical spectra are shown in Fig. 5 detected by theNaI(Tl) (without the protective cover) and by the wholesystem (with the cover). The spectra are plotted without thebackground using 137Cs as a point source. The measuredspectra show that the protective cover Acetal does not alterthe energy resolution of the detector. The material of theenclosure affects the Compton tail and the maximumphotopeak value. However, on comparing the measuredspectra, a small percentage of photons are detected in thevalley of photopeak (see Fig. 5).The detection system was calibrated in the laboratory
with and without the protective cover. For the energycalibration of the system, specific reference sources are used(see Table 3), positioned at a distance of 13.1 cm from thecrystal of the detector. The energy calibration becomes withthe use of linear function: Eg (keV) ¼ a+bCh, where Ch isthe number of channel and the parameters a, b are obtainedexperimentally. The results of the fitting procedure aredrawn in Fig. 6. The energy calibration factor b (keV/channel) and the offset a (keV) of the system are not variedwhen the system operates with and without its enclosure.

ARTICLE IN PRESSC. Tsabaris et al. / Applied Radiation and Isotopes 66 (2008) 1419–1426 1423
The energy resolution calibration is requested in orderto specify a baseline of the FWHM at various energiesand to control the deterioration of the system. Thiscalibration was performed (with and without enclosure)using point gamma ray sources (see Table 3), which wereplaced in the same fixed geometry. The energy resolution asa function of gamma ray energy is depicted in Fig. 7. Themeasurements are drawn together with the statisticaluncertainties. The energy resolution of the system hasbeen fitted assuming a simplified form following theequation: FWHM2
¼ c+dEg (Tsoulfanidis, 1983; Knoll,2000). The parameters c and d are obtained experimentallyby fitting the FWHM2 experimental values with a linearfunction. The energy resolution of the system is notchanged using Acetal as a material of the protective cover(see Fig. 7).
Similar analysis is performed for the absolute photopeakefficiency of the NaI(Tl) detector (in laboratory) with and
Fig. 6. Energy calibration curve of the ‘‘KATERINA’’ system by means
of a set of radioactive point sources. The solid line is a linear fit through
the experimental points.
Fig. 7. Energy resolution curve (with and without the enclosure) by means
of a set of radioactive point sources. The solid line is a linear fit through
the experimental points.
without the enclosure. The ratio of the photopeak countsand the total number of counts emitted by each pointsource provides the absolute efficiency of the spectrometer(with and without the enclosure) as a function of gammaray energy. The resulting efficiency is fitted with theexponential decay function and the curves are drawn inFig. 8. It is clearly seen that the enclosure decreases theefficiency of the detection system from 10% to 50%,depending inversely on the energy of gamma ray. Anestimate for 137Cs photopeak is 15%. The uncertaintybars represent the statistics and the simplified geometry isadopted.
3.3. Marine calibration
The detection system was then mounted in the middle ofa special tank with a volume of 5.5m3 (see Fig. 3). Thegamma rays used to perform the calibration of the systemwere 140.5 keV of 99mTc, 661.6 keV of 137Cs and 1460.6 keVof 40K. More specifically, 1995 g natural KCl was dilutedin the tank, resulting in 7440Bq/m3 volumetric activity.Furthermore, liquid 137Cs with a known activity of915Bq/m3 was mixed in the water together with 65%HNO3 0.005N. Finally, liquid 99mTc of 36223 kBq wasmixed with the water and then acquisition started for 6 and12 h. Due to the limited half-life the reference sourceactivity was corrected according to the nuclear decay law.The acquired spectra diluting the three reference sources inthe tank are shown in Fig. 9a (40K and 137Cs) and b(99mTc), after the subtraction of the background (thespectrum acquired in water without dilution of referencesources). In case of 99mTc the background spectrum alsocontains the 40K and 137Cs contributions. In addition, thenatural activity of water at 2615 keV (208Tl) was also usedfor the calibration of energy and energy resolution.Analysis of spectra was performed with the ‘‘SPECTRG’’software package (Kalfas and Tsoulou, 2003). The energy
Fig. 8. Absolute efficiency curve (with and without the enclosure) by
means of a set of radioactive point sources. The measured data are fitted
with the exponential decay function.

ARTICLE IN PRESS
Table 4
The marine volume efficiency measurements at three energies: 140.5, 661.6
and 1460.6 keV
Radioactive
source
Energy
(keV)
Ig (%) Half-life Marine volume
efficiency
(� 10�4m3)
40K 1460.6 10.7 1.28� 109 yr 1.3270.07137Cs 661.6 85.1 30.2 yr 1.8070.0799mTc 140.5 89.3 6.019 h 2.1570.05
C. Tsabaris et al. / Applied Radiation and Isotopes 66 (2008) 1419–14261424
calibration and the FWHM are not changed when thesystem operates in the aquatic environment.
The marine volume efficiency (eV) of the underwatersystem at the specific gamma ray energy is defined by thefollowing equation:
�V ¼CPS
rI gin units of m3
where CPS is the counts/s for the reference radionuclide, r
is the specific activity of the reference radionuclide (inBq/m3) mixed in the tank, Ig is the intensity of specificgamma ray. The experimental efficiency values are shownin Table 4 and the resulting efficiency curve for aquaticenvironments is presented in Fig. 10. The efficiency valuefor 99mTc was corrected for summing effects and dead time
Fig. 9. (a) Typical spectra in the water tank with the diluted reference
sources of 137Cs and 40K. The solid line represents the foreground, while
the dashed line is the spectrum without the background. (b) Typical
spectrum in the water tank with diluted reference source of 99mTc. The
solid line represents the foreground, while the dashed line is the only
spectrum by 99mTc (the 40K ,137Cs and the background contribution is
subtracted). The spectrum is also plotted in a different window in the
upper-left position (dashed line).
Fig. 10. Marine volume efficiency as measured in the water tank using
three reference sources (99mTc, 137Cs and 40K). The line represents a linear
fit through the experimental points.
as observed during the measurement. The calculatedefficiencies for other gamma ray energies can be calculatedby fitting the experimental data with a linear func-tion (eff ¼ a+bEg). The calculated fit parameters area ¼ 2.23� 10�4m3 and b ¼ �6.26� 10�8m3/keV. Thesevalues have significant importance for quantifying radio-activity in aquatic environments and offer activity results(in Bq/m3), since the infinite volume (the volume where thegamma rays can reach the detector) for each gamma raymust not be calculated from the attenuation law. Themarine efficiency calibration values given by the linearfunction can introduce uncertainties especially at lowenergies (Ego400 keV), since a non-linear variation couldbe expected due to the attenuation of the gamma rays inthe water. More experimental data are needed forimproving the fitting procedure at this energy interval. Infuture, Monte Carlo simulation in combination with moreexperimental data will give the full marine efficiency as afunction of energy for each gamma ray emitter.
ARTICLE IN PRESSC. Tsabaris et al. / Applied Radiation and Isotopes 66 (2008) 1419–1426 1425
In addition, the volumetric activity R in Bq/m3 has beencalculated from the measured CPS (counts/s) of thereference radionuclides, which have the following values:
R for 99mTc (Bq/m3) ¼ 0.51� 104�CPS (counts/s),R for 137Cs (Bq/m3) ¼ 0.65� 104�CPS (counts/s), andR for 40K (Bq/m3) ¼ 7.1� 104�CPS (counts/s).
The uncertainty has been estimated to be 5–6% and ismainly due to the uncertainty of the statistics of the netarea of the activity of the reference radionuclides.
3.4. Test deployment
The detection system was deployed in the coastal zone inEvoikos Gulf, where submarine groundwater dischargesare present. The groundwater is enriched in 222Rn and canbe used as a tracer for estimating water dynamics. Thesystem was positioned 1m above the seabed and 2m belowthe sea level in order to eliminate the background due tothe seabed and cosmic radiation, respectively.
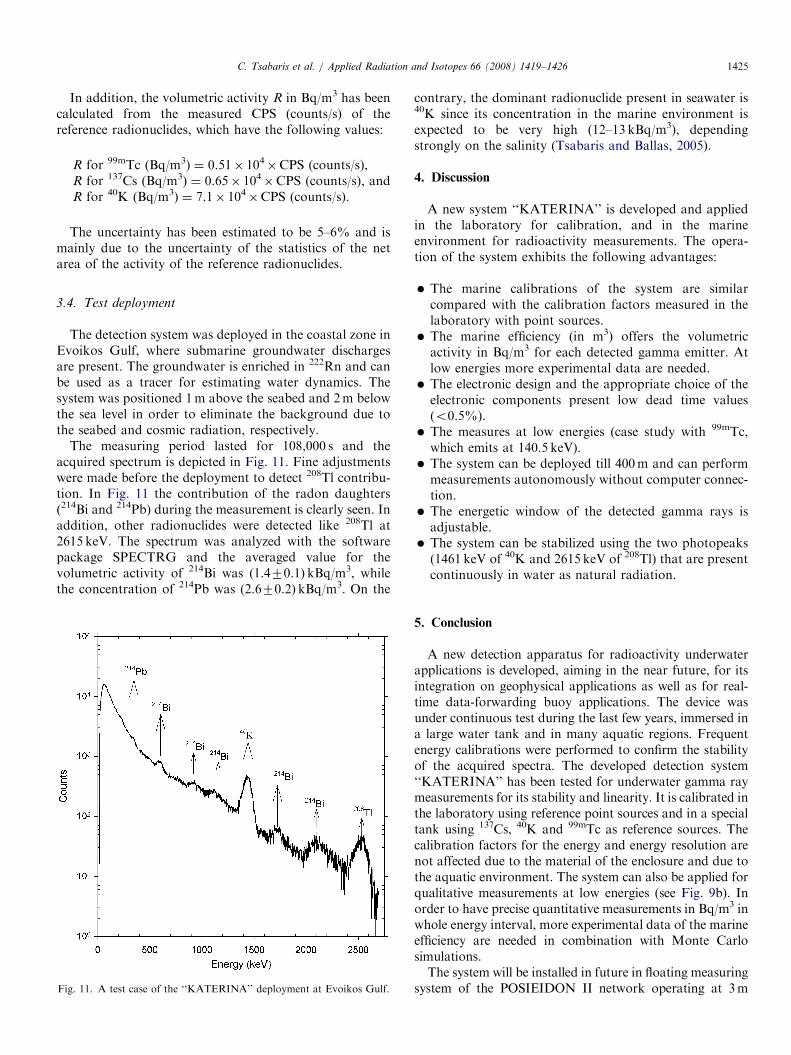
The measuring period lasted for 108,000 s and theacquired spectrum is depicted in Fig. 11. Fine adjustmentswere made before the deployment to detect 208Tl contribu-tion. In Fig. 11 the contribution of the radon daughters(214Bi and 214Pb) during the measurement is clearly seen. Inaddition, other radionuclides were detected like 208Tl at2615 keV. The spectrum was analyzed with the softwarepackage SPECTRG and the averaged value for thevolumetric activity of 214Bi was (1.470.1) kBq/m3, whilethe concentration of 214Pb was (2.670.2) kBq/m3. On the
Fig. 11. A test case of the ‘‘KATERINA’’ deployment at Evoikos Gulf.
contrary, the dominant radionuclide present in seawater is40K since its concentration in the marine environment isexpected to be very high (12–13 kBq/m3), dependingstrongly on the salinity (Tsabaris and Ballas, 2005).
4. Discussion
A new system ‘‘KATERINA’’ is developed and appliedin the laboratory for calibration, and in the marineenvironment for radioactivity measurements. The opera-tion of the system exhibits the following advantages:
�
The marine calibrations of the system are similarcompared with the calibration factors measured in thelaboratory with point sources. � The marine efficiency (in m3) offers the volumetricactivity in Bq/m3 for each detected gamma emitter. Atlow energies more experimental data are needed.
� The electronic design and the appropriate choice of theelectronic components present low dead time values(o0.5%).
� The measures at low energies (case study with 99mTc,which emits at 140.5 keV).
� The system can be deployed till 400m and can performmeasurements autonomously without computer connec-tion.
� The energetic window of the detected gamma rays isadjustable.
� The system can be stabilized using the two photopeaks(1461 keV of 40K and 2615 keV of 208Tl) that are presentcontinuously in water as natural radiation.
5. Conclusion
A new detection apparatus for radioactivity underwaterapplications is developed, aiming in the near future, for itsintegration on geophysical applications as well as for real-time data-forwarding buoy applications. The device wasunder continuous test during the last few years, immersed ina large water tank and in many aquatic regions. Frequentenergy calibrations were performed to confirm the stabilityof the acquired spectra. The developed detection system‘‘KATERINA’’ has been tested for underwater gamma raymeasurements for its stability and linearity. It is calibrated inthe laboratory using reference point sources and in a specialtank using 137Cs, 40K and 99mTc as reference sources. Thecalibration factors for the energy and energy resolution arenot affected due to the material of the enclosure and due tothe aquatic environment. The system can also be applied forqualitative measurements at low energies (see Fig. 9b). Inorder to have precise quantitative measurements in Bq/m3 inwhole energy interval, more experimental data of the marineefficiency are needed in combination with Monte Carlosimulations.The system will be installed in future in floating measuring
system of the POSIEIDON II network operating at 3m

ARTICLE IN PRESSC. Tsabaris et al. / Applied Radiation and Isotopes 66 (2008) 1419–14261426
below the sea level together with other sensors for thesurveillance and monitoring of the marine environment atthe Ionian and Aegean Sea. The system will also be appliedfor geophysical applications for radon monitoring, and asan early warning system for possible water pollution fromnatural and/or anthropogenic radionuclides.
References
Aakenes, U.R., 1995. Radioactivity monitored from moored oceano-
graphic buoys. Chem. Ecol. 10, 61–69.
Berger, M.J., Hubell, J.H., 1995. XCOM: photon cross sections, with a
personal computer. NBSIR 87-3597.
Burnett, W.C., 2003. Estimating the dynamics of groundwater input into
the coastal zone via continuous 222Rn measurements. J. Environ.
Radioact. 69, 21–35.
Jones, D.G., 2001. Development and application of marine gamma-ray
measurements: a review. J. Environ. Radioact. 53, 313–333.
Kalfas, C.A., Tsoulou, E., 2003. SIMULATE program: a gamma ray
spectroscopy tool. Nucl. Instrum. Methods Phys. Res. A 500, 386–390.
Knoll, G.F., 2000. Radiation Detection and Measurement. Wiley,
New York.
Maucec, M., de Meijer, R.J., Rigollet, C., Hendricks, P.H.G.M., Jones,
D.G., 2004. Detection of radioactive particles offshore by g- ray
spectrometry part I: Monte Carlo assessment of detection of depth
limits. Nucl. Instrum. Methods Phys. Res. A 525, 593–609.
Osvath, I., Povinec, P.P., 2001. Seabed g- ray spectrometry applications at
IAEA-MEL. J. Environ. Radioact. 53, 335–349.
Osvath, I., Povinec, P.P., Livingston, H.D., Ryan, T.P., Muslow, S.,
Commanducci, J.-F., 2005. Monitoring of radioactivity in NW Irish
Sea water using a stationary underwater gamma-ray spectrometer with
satellite data transmission. J. Radioanal. Nucl. Chem. 263, 437–440.
Plastino, W., De Felice, P., De Notaristefani, F., 2002. Radon gamma-ray
spectrometry with YAP:Ce scintillator. Nucl. Instrum. Methods Phys.
Res. A 486, 146–149.
Povinec, P.P., Osvath, I., Baxter, M.S., 1996. Underwater gamma-
spectrometry with HpGe and NaI(Tl) detectors. Appl. Radiat. Isot.
47, 1127–1133.
van Put, P., Debauche, A., De Lellis, C., Adam, V., 2004. Performance
level of an autonomous system of continuous monitoring of radio-
activity in seawater. J. Environ. Radioact. 72, 177–186.
Singh, M., Kumar, M., Jain, R.K., Chatrath, R.P., 1999. Radon in ground
water related to seismic events. Radiat. Meas. 30, 465–469.
Soukissian, T.H., Chronis, G.T., Nittis, K., 1999. POSEIDON: opera-
tional marine monitoring system for Greek seas. Sea Technol. 40,
31–37.
Tsabaris, C., Thanos, I., 2004. An underwater sensing system for
monitoring radioactivity in the marine environment. Mediterr. Mar.
Sci. 5, 5–17.
Tsabaris, C., Ballas, D., 2005. On line gamma-ray spectrometry at open
sea. Appl. Radiat. Isot. 62, 83–89.
Tsabaris, C., Thanos, I., Dakladas, Th., 2005. The development and
application of an underwater g- spectrometer in the marine environ-
ment. Radioprotection 40 (Suppl 1), 677–683.
Tsoulfanidis, N., 1983. Measurement and Detection of Radiation.
Hemisphere Publishing Corporation, Washington, DC.
Vlachos, D.S., Tsabaris, C., 2005. Response function calculation of an
underwater gamma ray NaI(Tl) spectrometer. Nucl. Instrum. Methods
Phys. Res. A 539, 414–420.
Vlastou, R., Ntziou, I.Th., Kokkoris, M., Papadopoulos, C.T., Tsabaris,
C., 2006. Monte Carlo simulation of g- ray spectra from natural
radionuclides recorded by a NaI detector in the marine environment.
Appl. Radiat. Isot. 64, 116–123.
Wedekind, Ch., Schilling, G., Gruttmuller, M., Becker, K., 1999.
Gamma-radiation monitoring network at sea. Appl. Radiat. Isot. 50,
733–741.