Embed Size (px)
Citation preview
An Automatedfor EstimatingCotton Market
Econometric Approachand Reporting DailyPrices
Jeff E. Brown, Don E. Ethridge, Darren Hudson and Carlos Engels’
Abstract
Anautomatedpricereportingsystemdevelopedthroughcomputertechnologyand hedonicprice theory is used to estimate daily cotton market prices, premiums, and discounts. This objectiveapproach for reporting cotton market prices was developed to complement the objective measuresof high volume instrument grading of cotton. The computerized, econometric system is limited tothe Texas and Oklahoma marketing regions where sales are readily available from electronicmarkets. The econometric based system has shown all the characteristics of an efficient pricereporting system; it is accurate, reliable, consistent, and repeatable in its working process and priceestimates.
Key words: computer automation, cotton marketing, econometrics, hedonic price analysis,price reporting
Introduction
Accurate and timely price information is akey to the existence and function of an efficientcompetitive market. In a commodity market, priceinformation facilitates production, selling, andpurchasing decisions for all market participants,Consequently, price reporting systems have beenestablished to disseminate price information formany commodities, including prices of variousqualities of some commodities. Price reportingsystems are expected to provide accurate andreliable information to facilitate the trading of acommodity and aid in the price discovery process,To accomplish this, reported prices must beperceived as objective and accurate. This allowsmarket participants to make decisions based on
reliable information and to be equally informedabout market conditions.
For price reporting on quality differentialsto meet these goals, the initial measures of thequality of the product must be accurate (reliable)and timely. [n cotton marketing, the industryrecognizes the quality characteristics embodiedwithin each bale of cotton as constituting reliableproduct information on which the market canfunction. The United States Department ofAgriculture (USDA) administers and maintains agrading system to measure the quality characteristicsof cotton fibers. The system of grading cotton byits quality attributes has evolved from a fewsubjective measures to more objective measures ofa larger number of attributes. This evolution has
*Former research associate, professor, research assistant and former research assistant, respectively, Department ofAgricultural Economics, Texas Tech University. The authors acknowledge the contributions of Cad Anderson, KenBowman, Ron Cole, Dan Davis, Billy Freeman, Melanie Gillis, Kevin Kesecker, Preston Sasser and Dale Shaw to thework reported in this paper. They also thank Sukant Misra, Eduardo Segama and Sujit Roy for their suggestions onthe manuscript. This research was supported by the U.S. Department of Agriculture, Cotton lnco~orated and the TexasState Support Committee. Texas Tech University, College of Agricultural Sciences and Natural Resources ManuscriptNumber T-1-370.
J. Agr, and Applied Econ, 27 (2), December, 1995:409-422Copyright 1995 Southern Agricultural Economics Association

J. Agr and Applied Econ., Decembec 1995 410
accelerated since the inception of high volumeinstrument (HVI) grading and its adoption industry-wide in the U.S. in 199 I (Ethridge, Engels, andBrown). The HVI grading technology has allowedcotton grading to become more rapid, accurate,consistent, and objective in the measuring of cottonquality attributes. For efficient market performance,price information concerning the various qualityattributes must also be known,
The official cotton price report in the U.S.for the cash (spot) market is administered by the
USDA’s Agricultural Marketing Service (AMS),Cotton Division, in the form of the Daily SpotCotton Quotations (DSCQ). The DSCQ provideestimates of prices and quality premiums anddiscounts for each of the seven designated marketsin the U.S. for each trading day (USDA, dailyissues). AMS reports a base price for each regionfor the “base” combination of quality attributes (theprice for grade 41, staple 34, micronaire 3.5-4,9,strength 24 and 25), Premiums and discounts aredetermined for all other combinations of qualityattributes to be added to or subtracted from the baseprice. The quality attributes in cotton are grade (acombination of leaf, bark, grass, and other foreignmatter content and color), staple (fiber length), fiberstrength, micronaire (a measure of fiber finenessand maturity), and length uniformity of the cottonfibers. The various components of “grade” wereseparated into color grade, leaf grade, and otherforeign matter in the quality grading system in1993. This separation added two more qualitydimensions to price reporting. Both gradingsystems are covered in this paper.
The increased number of quality attributesrecognized by the industry has made it increasinglydifficult for the price reporting system used byAMS. The AMS market reporters collect samples(i.e., recaps of mixed-lot sales) of markettransactions and conduct interviews with marketparticipants (primarily merchants and marketingorganizations) to obtain market information. Themarket reporter then arrives at an intuitive(subjective) determination of the market activity andthe DSCQ are formulated (Hudson et al,), Thegrading system for cotton has become more precisewith the use of HVI technology to measure ninedifferent aspects of the fiber. Levels of these nineattributes make up more than 25,000 qualitycombinations that have different implications to
textile manufacturers and thus have different valuesin the market. The increased number of HV1quality attributes has made separating the effects ofthe quality attributes on price more difficult andincreased the risk of error in the interpretation ofthe market information.
A new objective approach for estimatingand reporting cotton prices has been developed andtested for the Texas and Oklahoma markets (WestTexas and East Texas-Oklahoma). This approach,referred to as the Daily Price Estimation System(DPES), has been in development since 1988 tocomplement the more accurate and objective HVIgrading system. The objectives of the DPES are toprovide an objective and accurate tool to supportreporting prices, premiums, and discounts. Morespecifically, the DPES is a computer-automatedsystem for receiving and statistically analyzing salesdata, estimating prices using an econometric modeldeveloped from hedonic price research, andtransmitting the results to market participants. Theobjectives of this paper are to describe thedevelopment and current operation of the DPES andprovide evidence for its accuracy, application, andinclusion in the daily reporting of cotton marketprices.
Hedonic Price Analysis: Concepts and
Requirements
The premise of hedonic price analysis isthat a commodity is valued by the amount of utility-bearing characteristics associated with thatcommodity (Rosen). Therefore, a product is acollection of characteristics or attributes that havevalue. The explicit price of the product isobservable in the market, and is composed of theaggregated values of these characteristics. Thecharacteristics’ values are termed (marginal) implicitprices, The implicit prices of the characteristics ofproducts are not readily observable in the marketbecause the attributes are not bought and soldindependently; they are embodied in the product.However, to the extent that the characteristics areobservable and/or measurable, they can be derivedthrough a process of disaggregating the prices (seeEthridge and Morse for an overview of studies onthese procedures).
These implicit prices may be determined byregressing the product’s price against its attributes

411 Bmwnj Ethridge,H&on and Engels: An AutomatedEcorwmetricAppIuachfor Estimatingand Repotiing Daily Cotton
and then differentiating the resulting equation withrespect to each attribute. These procedures havebeen useful in determining the prices of attributes incotton (Ethridge and Davis; Ethridge, Shaw, andRoss; Robinson et al.; Ethridge, Sudderth, andMoore; Ethridge and Mathews; Hembree, Ethridge,and Neeper; Ethridge and Neeper; Bowman andEthridge; Ethridge, Engels, and Brown; Chen,Chiou, and Anderson), Statistically derived implicitprices indicate the average implicit price of eachattribute at each attribute level, ceterus paribus, thusdetermining the average price of each attribute asobserved in the specified market.
Hedonic Model For Daily Cotton Market PriceReporting
From 1988 through 1992, 30% of the totalU.S. cotton production was produced in Texas andOklahoma (USDA, 1993). The large number ofmarket participants in the region meets the conditionfor a competitive market structure. The availabilityof marketed cotton provides the daily salesobservations of lot prices and average lot values foreach of the quality attributes for a daily hedonicpricing model for cotton. The data are obtainedfrom two electronic spot marketing systemsoperating in the Texas and Oklahoma regions. Thetwo electronic marketing systems are TELCOT,which merchandises cotton throughout Texas andOklahoma (Ethridge, 1978), and The Network,which operates primarily in the Texas RollingPlains. The observed sales of cotton constitutesover 25’XOof all Texas and Oklahoma cotton andabout 33% of all cotton in the spot market. Thesample also represents purchases (buying behavior)of approximately 75°/0of the total merchants in thetwo regions. The daily sets of data contain theobserved sale price of each mixed lot, the averagequality attributes of classer’s trash and leaf grade,reflectance, yellowness, and color grade, staple(fiber length), strength, micronaire, lengthuniformity, bark content, other extraneous mattercontent, and other relevant information about eachsale, such as the location (region) and lot size.
Prior research on hedonic cotton modelsprovides some evidence on the mathematical modelstmcture used by the DPES. Such past works dealtwith both aggregated data and individual lot sales(less aggregated) data. A linear functional form
performed well in cases where aggregated data wereused (Hembree, Ethridge, and Neepeq Chen, Chiou,and Anderson; Bowman and Ethridge). As databecome less aggregated--e.g., more towardindividual sales and less toward regional or nationalaverages--the non-linear fi.mctional forms haveperformed better (Ethridge and Mathews; Ethridgeand Neeper).
Initial investigation into the development ofthe system for daily cotton market price reportingrecognized that the most important ingredient wouldbe the mathematical model structure. The initialresearch concentrated on identi~ing and evaluatingpossible mathematical model structures. Theselection was narrowed, based on statisticalevaluation, from 12 models down to 2 specificmathematical model structures (Ethridge, Engels,and Brown).
The two mathematical model structureswere a “linear difference” model (Bowman andEthridge) and a multiplicative or “double-log” model(Ethridge, Engels, and Brown). The “lineardifference” model was determined to be inferior tothe double-log model on the basis of conceptual andempirical criteria. As well, Ethridge, Engels, andBrown studied various weighting procedures forgrouping days of data and for evaluating sales lotsize impact on price. Both of these proceduresfailed to improve estimates based on estimationaccuracy as the criteria for model selection.Therefore, an unweighed single-day sales modelwas concluded to produce the most accurateestimates.
An extensive search for the appropriatefunctional form using a single day of unweighedsales was performed (Brown and Ethridge). Thatstudy determined the “best” mathematical modelstructure for the pre-1993 grading system and the“expected best” for the 1993 grading system, whichseparated the grade code into its component parts ofcolor, leaf content, and bark content. Each modelused in estimating prices for the two gradingsystems was developed with consideration for bothconceptual and empirical factors. The expectedmarginal productivity of each attribute in theproduction of yarn was one such conceptualconsideration. Empirical considerations includedpartial regression analysis (Neter, Wasserman, and

J. Agr and Applied Econ., December 1995
Kutner) to determine the general relationshipsbetween price and each quality attribute and anextensive analysis of residual error terms fromvarious statistically estimated functional forms.Both empirical considerations allowed the “best”mathematical model specifications to be determined.The “best” functional form daily model for the pre-1993 grading system was:
f,=~o e p,G/,’+p,BG,(G/, )+p,G2,+p,G2,’+p,sTA,+p.sTA,’+&s-rR,+p,hf,+pJ4: +p,”R,E
(l)’
where:
Pi = price of mixed lot i in cents perpound;
Gli
BGi
G2i
STA,
STR,
M,
R,
412
average of the first digit of thegrade code in mixed lot i;binary indicator variable denotingbelow grade cotton (BG = O if G1<7and BG=lif Gl> 7);average of the second digit of thegrade code in mixed lot i;
average staple length of cotton inmixed lot i in 32nd”of an inch;average strength reading of cottonin lot i in grams per tex;average micronaire index readingof mixed lot i;binary indicator variable denotingregion (R = O if market reportingregion is West Texas and R = 1 ifmarket reporting region is EastTexas or Oklahoma);stochastic error term.
Table 1. EsdsnatedParsmetemof Model 1 froma RandomSampleof 5 DaysCoefficients”
Inde- DatespendentVariables 03NOV92 01DEC92 23DEC92 14JAN93 21JAN93
Int. -0.2904 0.1138 -3.4552 -0.7765 1.0485(-0.26) (0.11) (-1.75) (-0.93) (0.56)
Cl’ -0.0077 -0.0028 -0.0Q44 -0.0042 -0.0Q47(-16.70) (-9.27) (-7.90) (-14.04) (-10.31)
BG(G1) O.m -0.0293 -0.0193 -0.0152(:F (0.OQ) (-6.67) (-8.09) (4.49)
G2 -0.0346 -0.0096 0.1543 -0.0442 -0.1123(-1.57) (-0.99) (3.75) (-4.14) (-5.2a)
G2Z -0.0056 -0.0063 -0.0542 -0.0021 0.0137(-1.12) (-0.27) (-5.27) (-0.96) (3.06)
STA 0.174 0.1305 0.3234 0.1646 0.0494(2.62) (2.18) (2.64) (3.20) (0.43)
STAZ -0.0024 -0.0019 -0.0048 -0.0024 -0.0006(-2.45) (-2.12) (-2.58) (-3.06) (-0.38)
STR 0.0040 0.CQ24 0.0040 0.0020 0.0028(1.50) (2.42) (1,49) (1.63) (1.56)
M 0.5079 0.7594 0.8337 0.9640 1.0720(8.15) (1s.99) (11.30) (25.14) (16.58)
M’ -0.0613 -0.0938 -0.1006 -0.1187 -0.1350(-7.90) (-17.93) (-10.32) (-22.54) (-14.81)
R 0.0016 -0.0009 0.0051 -0.0074 -0.0180(0.20) (-0.23) (0.46) (-1.34) (-2.13)
CT 0.0397 0.00(M3 -0.0370(H%’ (1.25) (:Y (0.CQ) (-2.37)
k? 0.9275 0.7691 0.8894 0.8965 0.8764F-Value 278.62 122.61 71.58 335.27 188.18d.Jb 196 368 89N. O.B.c
387 292208 380 101 399 304
“Numbersbelow coefficientsare t-values.
bdegreesof freedom.
‘numberof obsm-vations

413 Brown,Ethridge,Hutkon and Engek: An AutomatedEconometricApproachjbr Estimatingand ReportingDaily Cotton
With the implementation of the 1993 grading form of the quality information available to marketsystem, the mathematical model structure was participants. The functional form daily model tofurther evaluated and revised to accommodate the accommodate the grading system which began in
1993’ is:
P,=~oe p, CrR,’ +p,c/,’+fl,c 1: +~4ST,4,+~,STA,’ +&STR,+!3,M, +O,M : +P,R,+O,.LB,+P,, HU,+P,,Lfj,+P,,ffC~,E (2)
Table 2. Estimated Parameters of Model 2 from a Random Sample of 5 DaysCoefficients”
pendentVariables 180CT93 03NOV93 19NOV93 07DEC93 29DEC93Jnt -2.5654 0.7324 1.2140 1.0795 3.0625
(-3.36) (1.42) (4.39) (6.00) (9.67)CTI? -0.0008 -0.0017 -0.0025 -o.C013
(-1.18) (-4.90) (-19.51) (-16.70) (2.WC12 -0.0002 -0.0004 -0.0002 -0.0021 -0.0017
(-o.13) (-0.47) (-0.58) (-10.89) (-5.48)C22 -0.0095 -0.0055 -0.0065 -0.0065 -0.0057
(-4.42) (-3.99) (-11.79) (-22.17) (-14.07)STA 0.2973 0.1230 0.1033 0.1176 0.0269
(6.45) (4.03) (6.16) (10.86) (1.40)STA2 -0.0043 -0.0016 -0.0014 -0.0016 ‘~o.0003
(-6.15) (-3.58) (-5.35) (-9.76) (-1.10)STR 0.0019 0.0021 0.0016 0.0010
(:T (2.11) (5.25) (6.92) (3.00)M 0.6815 0.4203 0.3738 0.3683 0.2179
(10.53) (8.46) (17.94) (25.70) (14.76)M1 -0.0835 -0.0516 -0.0451 -0.0446 -0.0264
(-10.13) (-8.48) (-17.91) (-25.86) (-14.57)R 0.0119 0.0006 -0.0030 0,0023 0.0097
(1.62) (0.14) (-1.69) (2.23) (4.74)LB -0.0234 -0.0366 -0.0186 -0.0206 -0.C089
(-2.93) (-6.73) (-7.36) (-14.43) (-4.68)HB -0.8873 0.0000 0.0000
(-0.54) ;:F (0.00) (:W (0.00)LO -0.0620 -0.oltm -0.0788 -0.0911 -0.0483
(-1.61) (-0.94) (-7.36) (-12.22) (-2.62)HO -0.1238 -0.0781 -0.0399
(:T (::T (-6.73) (-7.41) (-3.73)F 0.8790 0.8341 0.7837 0.8543 0.7624F-Value 55.45 74.02 285.31 663.87 138.27d.fi’ 84 162 945 1359 517N.O.B.’ 98 176 959 1373 531“Numbersbelow coefficients are t-values
b&gmes of ikedom.
cnumberof observaticms.

J. Agr and Applied Econ., DecembeC 1995 414
where:
CTRI
cl,
C2,
LB,
HB,
LO,
HO,
. average of the classer’s trashdesignation in mixed lot i;
. average of the first digit of thecolor grade in mixed lot i;
= average of the second digit of thecolor grade in mixed lot i;
= percentage of level 1 bark inmixed lot i;
— percentage of level 2 bark inmixed lot i;
. percentage of level 1 otherextraneous matter content inmixed lot i;
—— percentage of level 2 otherextraneous matter content inmixed lot i;
and the other attributes are the same as defined inmodel 1. A sample of daily model results (i.e.,coefficients, t-values, R2’s, F-values, degrees offreedom, and number of observations) for bothequations 1 and 2 are shown in tables 1 and 2. Thevariability in the magnitudes of the coetllcients cangenerally be explained by the supply and demand ofthe specific levels of each attribute over themarketing period.
These models both have apriori conceptualappeal. The price-quality relationships developpremium and discount patterns that are curvilinearrather than linear, and the coefficient magnitudessuggest decreasing marginal productivityy of thedesirable attributes. Each functional form wasselected on the basis of no patterns in the errorterms with respect to each attribute and they had thegreatest accuracy in their estimates. In addition,they can be easily estimated using the ordinary leastsquares regression technique and provide prices,premiums, and discounts for the DPES.
Daily Price Estimation System Structure andOperation
The Daily Price Estimation System is madepossible by the existence of computer technology.The centerpiece of the system is the econometricmodel (equation 1 or 2). However, computerhardware and software, including communication
capabilities, give the system the capacity to function
as a daily price information system. A schematicdiagram of the DPES operations is shown in figure1.
The DPES procedures are initiated by adata contributor at the end of each trading day. Thedata contributor upIoads the sales data via telephonecommunication to the DPES computer, then theDPES computer dials and downloads the data fromthe other data contributor. The DPES systemanalyzes the lot sales data received from thecontributors with the aid of a spreadsheet. Theinitial analysis of the data determines whether thevalues for each variable are realistic by determiningif maximum and minimum values lie within anexpected range (e.g., staple length between 28 and38/32nd”of an inch), If the reported data are outsidethe specified range, the system ceases operation andproduces an error message to all parties.
Data are up-loaded to a mainframecomputer where Statistical Analysis System (SASInstitute, Inc.) is used to estimate the ordinary leastsquares regression coefficients for equation 1 or 2and derive test statistics. The means, standarddeviations, maximums, and minimums of that day’slot sales data are also obtained. The program alsochecks for conceptually reasonable modelcoefficients, If a coefficient has a wrong sign, therespective variable/attribute is excluded from themodel and the model is re-estimated. Thisprocedure of excluding variables from the modelhas occurred on only 1.74V0 of the days sinceinitiating operation in February, 1989. To date,there has been no instance in which a wrong signcoefficient has been statistically significant. Theresults from the SAS runs are then down-loaded tothe DPES computer where they are again evaluated(i.e., coefficients for wrong signs and maximumsand minimums for relevant ranges) and permanentlystored.
The end products of the DPES are a DailySpot Cotton Price Estimates table for (a) the WestTexas region (table 3) and (b) the East Texas andOklahoma region. This table provides a base price(price for base quality--color grade 41, staple 34,micronaire 3,5-4,9, leaf grade 4, strength 24-25, andno bark or other extraneous matter). The base pricein table 3 is 53,22 @/lb, Premiums and discounts

415 BmwrLEthridge,Hudson and Engels: An AutomatedEconometricApproachfor Estimatingand ReportingDaily Cotton
Figure 1. A Schematic Diagram of the Daily Price Estimation System
AYEE !
Manuel Ewlumlon 01 Syotem
la
-1 A=’::oe1-ME8SAGE:
Not Encwph Obaervattona
<->mll Statlmtlonl NO Error* w+r*
OUtDUt V*ttd?round In tha d.ta
/-
‘fa
YES Mnnunl E!mluatlon of 9ys10m
P*rman*nt Etor&ge of
Tebl@ Qenbretlon
!
IAnaly#ls of thu
Emtlmmtlon Arxurnoy Anmlmiw Prl.tout
Ior TTUE
POrmanent L3t.raa. of
r3sn*r*l Intormntlon J
Mnmaagen and(ar Tables
oent out VlmPaxor L/
about tha Dala/
are shown for all other quality combinations inpoints/lb. (100 points = 1~). For example, thediscount for color grade 61, staple 33, all otherattributes at base level, is 276 points (2.76 g$/lb.),making the price for that quality 50.46 @/lb. TheDPES, via a spreadsheet, uses the model and itsestimated coefficients, inserts the various qualitycombinations into the equation, and calculates theprices and the various premiums and discounts inthe tables. The system also measures the accuracyof the estimated prices by running regressions of themodel’s estimated prices against the actual prices.This provides a daily gauge of the performance ofthe model’s estimates. Finally, the DPES transmits,via FAX or computer text file, a copy of bothregions’ tables to the National Cotton Council’sCOTNET (computer bulletin board) and severalother outlets. The tables could be sent to otherdestinations. The entire working process of theDPES is usually performed during the night and iscompleted in a few hours.
wReported Price Comparison Analysis
Prior research has studied the relationshipbetween the DPES and DSCQ reported prices.Hudson et al. found that the DSCQ reported priceswere an average 5% ( 1.54~/lb.) higher than theDPES for the period 1989-1992. That study alsoindicated that differences existed in structuralpatterns of the premiums/discounts across attributelevels between the DPES and DSCQ reportedprices. Ethridge, Engels, and Brown found errors inprices reported by both the DPES and DSCQagainst actual prices for the period of March 1989through April 1990. DSCQ estimates systematicallyoverestimated high priced cotton and underestimatedlow priced cotton. The DPES model used duringthat period also had a smaller, but significant,systematic error in the opposite direction,Subsequent analysis of the DPES model structure(Brown and Ethridge) resulted in changes thateliminated systematic error in the DPES estimates.

J. Agr and Applied Econ., December 1995 416
Table3. Sample Table from the Daily Price EmanationSystem, West Texas Market 1993 Grading System”
0?,{ly spot cotton Price E$ti*tn$E341914te$bY the Cmpsrtmsntof Agriwltural fconmics, TSWS Tech 13niv.Oate: 07WC93: U {cm: Usst Tams
!# ti mle$: 51,3m
COW Wade and Z.tape P!’$woM and Pi$count$ in P@J#lb, # of Sala$: 9!6
11 21 31 41 51 &.aPle 61 71 12 22 32 42
-418 -U9 -500 -571 -660 28-767 -891 ;% -W -593 -662-284 -316 ;;:; -441 -533 29-643 -770 -412-fg -1%
-464 -535-324 -419 30-531 -551 -263 -295 -347 -421
-y -145 -2?1-54 -132
-317 31-432 -565 -1S8 -191 -244 -319
lti-’330 32-347 -682 -68 -101 -]S6 -.23?
171 1:;-157 33-276 ~~ -27 -22 -159
x 53:$! -100 34 -?20214 179
:32121 53
-;: -102
240 205-M 35-181 -320 106 13 -62
146 66 -35 35.157 -297 133 41 -36247 212 154 74 -28 37-150 .:x ;$ ;: 49 -M247 212 164 74 -28 38 -MO 49 -30
W 62 23 33 43 StdPIIS53 63 34 U 64
-760 -7355 -695 -743 -Qll ‘N -8% -1000 -646 -1011 -1092-625 -733 -569 ;;; -6o8 29-775 .@o -637 -693 -977-613 -623 -455 -577 30-666 -713 -719 -7a7 +73-413-s26-3Z0-Wz +& -406 -4i’8 31-570 -679 -624 -693 -780
-257 -373 -195-320 -394 32-487 -598 .642 -612 .701-249 -324 33-418 -531 -474 -M5 -635
-201 -318 -139 -193 -?69 34 -~ -478 .421 -493 ;S&-361 -279 ~~ j: && ~ ;% -440 ~g -45s-137 -256 -418 -433 -525-1s0 -249 -122-MO -249
-199 37-235 ::~] :35: :L4? w::: -122 -199 36-335
14ika 12wk(tiffW41KQ$
StrmgthOiffmmm Offfarbncas
Po{nts/lb. Trash Rlffqwnces-Point$/lb. Points/lb. Points/lb.
Mike Tra4h hOf$CWnt COdO Hbite !p~tt Spot TitI@ % oiSC. Level
Pm/Ran+ Disc
$ ~gbalw -524 1 1$ io2 992
9$ Leval 1 -103 <18 -5479
30-32 :%75 Level 2 -- 19 -45
43 :464433-34
20-140
-37!
3s-49 5 -~ -~ -~ -i Cthor-29
SO-62:; -21
-2;! 6 -136 -133 -129 -123 Ilifformces538 mow -317 7
-12-222 -?16 -211 -202 Pcjint5/lb. ;~2s -o
1221
%T Oi$c. ;::
level 1 -463 ~ 46Level 2 -- 31+ 54
Rnsults are not for g-anerald{stribvtim.
%i.s table represents a sample table produced by the DPESon a daily basis. It is intended to provide an example of thearmy of prices a producer has to make decisions from aswell as provide a general picture of the information providedby the DPEfl.
Analysis of tests for accuracy of bothDSCQ and DPES price estimates for the 1993/94marketing year are presented here. Accuracy of theDPES estimates, both the tables and the formula,and the DSCQ estimates were examined. Thesecomparisons were made against actual producer lotsales transactions, It is important to note that thestatistical reliability of the DSCQ cannot be directlydetermined, That is, since the characteristics of thesample (e.g., size and representativeness) are notknown, direct statistical measurements of the
accuracy of the DSCQ in reporting prices,premiums, and discounts are not possible (Hudsonet al.).
To perform this analysis, a random sampleof 350 observations from 34,285 mixed lot salesduring the 1993/94 cotton marketing year (August1, 1993 to July 31, 1994) was drawn.2 The samplewas verified to accurately represent salestransactions during the marketing year by comparingthe mean price and quality values of the sample

417 Brown,Ethridge,Hudkonand Engels: An AutomatedEconometricAppmachfor Estimatingand ReportingDaily Cotton
against the 34,285 mixed lot sales means. Meandifference tests indicated no significant differencesbetween the sample and the population,
The DPES was evaluated in two ways.The daily model estimates based on the regressionequations were calculated for each sale in thesample and DPES table prices were also used tocalculate the prices for each sale. Since the tablesidentify only discrete quality categories, lot averageprice estimates were calculated as extrapolationsbetween the discrete prices. These calculated pricesare often not exactly the same as the valuesdetermined directly from the formula. The DSCQprices were determined in a manner similar to thatperformed in determining the DPES table prices.Since some qualities in the random sample areexcluded from DSCQ reporting, the sample forcomparison was reduced from 350 to 326 mixed lotsales. The fewer number of observations in thesample had no significant effect on itsrepresentativeness of the population.
Two analyses were performed on theaccuracy of each set of estimated prices in trackingactual prices: (1) Theil’s inequality measure wascalculated for both the DPES and the DSCQ againstactual prices and (2) the price estimates from eachwere regressed against the actual prices.
Analysis using Theil’s inequality coefficient(U) (Pindyk and Rubinfeld) revealed somedifferences between the DSCQ and DPES whencompared to the actual prices. The DSCQ had a U
= 0.0434 while the U values for the DPES were0.0052 and 0.0018 for the table and formulaestimates, respectively. None of the coefficientswere close to one. Nevertheless, both of the DPESestimates appear to have performed better than theDSCQ. The primary disadvantage of Theil’sinequality procedure is the inability to test forstatistical differences.
Regression analysis was also used toexamine the relationships between actual prices andDSCQ and DPES prices. A simple linear model ofprices was:
PA. /
=a +~PE, , +s, (3)
where PA,,is the actual price of mixed lot ~, f’E,/iseither the DSCQ, DPES table, or DPES formulaestimated price of lot j, a and 13are parameters, andGis the normally distributed, mean zero error term.The standard null hypothesis is that a = O and 13=1. Any significant deviations from this resultprovides evidence of systematic error in the priceestimates (Holden and Peel; Belongia).
Since these data are not a true time series(each day’s estimate is from cross-section data andthe random sample was drawn from the large setwhich varied over time) time series properties arenot applicable.3 This regression determines whetherthe estimated prices of a mixed lot (DPES orDSCQ) are equal to the actual prices of those lots,on average. Given the large sample size, regressionparameters are expected to be unbiased (Elam andDixon).
Results indicate the neither the DPESformula nor the DPES table prices showed asystematic bias with respect to actual mixed lotprices (table 4). However, the DSCQ showed asystematic bias (a > 0 and (3< 1; significant n.This indicates that the DPES estimated prices werecloser to the actual than the DSCQ.
The F-values shown in table 4 werecalculated following Harrison. The standard nullhypothesis of cx= O and ~ = 1 from Equation 3 istested jointly. That is, the F-test shows biasednessin the model without directly testing the individualparameters. The limitation here is that noknowledge is obtained of the nature of the bias.Therefore, both the t and F-tests are presented.
Taken together, the results of the Theil’sinequality and regression analysis support theconclusion that the DPES performs better atestimating market prices than the DSCQ. Bothanalyses indicated that the DPES prices were closerto the actual prices than the DSCQ. Additionally,the regression analysis indicated that the DPESestimated prices had no systematic bias.

J. Agr and Applied Econ., Decembe~ 1995 418
Table 4. RegressionPatmnetets of EstitnafedLot Prieea vs. Acfnal Sales Prices in Texas-OkfshomsMarkets, Based on a Sample of 326 Mwed Lot Observations’
Source ofEstimatedPrices Inrercerx slow R2 F-Value
Tab]& 8.76431 0.7976 0.8430 1919.68(8.26~ (10.58)”
DPESTables 0.3958 0.9873 0.9460 5.94’
(0.57) (0.97)
DPESModels 0,8851 0.9815 0.9442 6.49’
(1.26) (1.40)
“ Numbers in parenthesesare t-vafues.b The null hypothesisof a = Oand (1 = 1 cannot be rejected at the a = 001 level.C Significantlydifferent from Oat the a = .01 level.d Sigrriffcantfydlffererrtfrom 1 at the a = .01 level.
Implications for Price Reporting
The use of econometric procedures andcomputer technology such as those contained in theDPES has the potential to affect price reporting.
The greatest potential impact may be in aprocedural context. These procedures make theDPES objective; however, data requirements maylimit the proportion of time that estimates areforthcoming when compared to a subjectivelydetermined price report. This section addressessome of the impacts and limitations of theprocedures used by DPES.
The DPES approach minimizes humanerror and/or subjective judgement in the process ofanalyzing prices to support price reporting. Thesystem is automated, thus reducing the possibility ofhuman error with the exception of the initial entryof price and quality data on the sales transactions,However, these types of errors are minimized whenthe computerized electronic sales systems areproviding data. Another possibility of human erroris the development of the daily model structure that
is used by the system for the estimation of theprices. However, with the prior investigation intothe appropriate functional form of the daily model(Brown and Ethridge), plus the diagnostics ofaccuracy on the daily estimates, human error of thistype should be minimal.
The DPES price estimates cannot beaccepted as truth. This was particularly evident in
the 1991/92 crop year in which a record number of“below grade” (very high trash content) cotton baleswere produced in the two regions. The largeproportion of below grade cotton, which sold for aminimal price, caused the magnitude of the trashpremiums and discounts to deviate out of anyreasonable proportion. The below grade cottoncaused an increase in the slope of the premiums anddiscounts that would not have been discoveredwithout a thorough inspection of the initial salesdata. The model was adjusted using a dummyvariable to identifi and isolate the below gradecotton in the estimates. In the final analysis,ongoing evaluation, testing, and experimentation isthe most effective safeguard against these sources oferror.
An advantage of the DPES as opposed tosubjectively estimated prices is its inability to adjustto events occurring within the market not shown byactual sales, Thus, if trade or harvest rumors arise,the DPES will not react unless market participantsreact in their buying behavior. This makes theDPES results more consistent with marketparticipants’ behavior without a preconceived ideaof how prices should be progressing.
Since the system is automated, it allowsprices to be reported on heavy trading days as easilyand timely as when trading is less active, with thesame effort on the part of an analyst. However,analysis has shown that days with less than 40observed lot sales throughout Texas and Oklahoma,

419 Brown,Ethridge,Hudson and En,gels:An AutomatedEconometricAppmzch for Estimatingand ReportingDaily Cotton
the DPES does not produce statistically reliableestimates. Thus, the system is designed not toestimate or report prices if less than 40 lot sales aretraded for any given trading day. The perspectivethat “no information is better than misinformation”has been adopted to date. This is a potentialproblem for users, but could be lessened with theaddition of other participating merchandising firms.
The computerized econometric approach isfaster and more accurate than an “impressionisticanalysis” of the market. The underlying premise ofleast squares procedure is to minimize the squarederrors; therefore, the estimates are as accurate asstatistical methods will allow. The system providesestimates that are easily repeatable. The data areeasily stored, and the model can be re-estimated atany time and the same prices, premiums, anddiscounts obtained. The prices, premiums, anddiscounts currently provided by AIMSare based onthe market news reporter having a sample of cottontraded and market intelligence based on discussionswith merchants to form a mental picture of the waytrading has been that day.
An approach such as the DPES hasqualities that warrant consideration in marketreporting. The DPES is easily changed toaccommodate changes in the large amount ofinformation provided by the grading system. Asgrading adopts new measurement technology, theDPES can accommodate the new information.
Summary and Conclusions
The primary purpose of this paper is todescribe an objective approach for daily cottonmarket price reporting. The Daily Price EstimationSystem has been developed, tested, and evaluated,and is operating on a daily routine. Because themarket in which it operates is dynamic, the DPEScontinues to require and receive periodic testing andvalidation. However, the basic operational andconceptual structure of the system is reliable.
The Daily Price Estimation System is readyto be introduced to a broader spectrum of themarket, It has been operational for three years, andprice estimates have been generated and tested foralmost five years. It is currently limited to the
producer sale pricing point in the Texas andOklahoma markets because of the availability ofelectronic sales transactions data. However,expansion of the Daily Price Estimation System isfeasible. The DPES could be adapted relativelyeasily to become a national system for cotton pricereporting, but the data needs would necessitatebroad-based participation of marketing firms-m-arketing associations and merchants, and perhapssome textile processors. The sales informationcould be keyed into the system for regions that donot have operational computerized electronicmarkets. This process would be logisticallydemanding, yet realistic with existing technology.
The most relevant concern in expanding thesystem to other regional markets would be thefictional form of the daily hedonic model. Cottonquality varies across regions. Therefore, thefunctional form used for the Texas and Oklahomamarkets may not necessarily be the appropriatefictional form for the other market regions.Consequently, it would require model developmentwork in each market to determine the appropriatefictional form for each market. Whether it couldbe one model for all regions or a specific model foreach region would have to be ascertained.However, work has been conducted in the area ofregional price differences (Bowman and Ethridge;Chen, Chiou, and Anderson; Chen and Ethridge),and other analysis is in progress.
The system might also be expanded toinclude all pricing points throughout the marketingchannels. In an efficient market, the only change inprices throughout the marketing channels shouldreflect the marketing margins, assuming equivalentqualities (Kohls and Downey). The structure of thepremium and discount patterns should not besubstantially affected4. Therefore, the functionalform of the model under these conditions would notchange with respect to the implicit prices reflectedby the model if the markets are efficient in terms ofconveying price signals. Initial indications are thatthe marketing system is not operating efficiently ingetting price signals through to cotton growers(Ethridge and Chen). Thus, the producer prices,premiums, and discounts resulting from this modelmay not reflect the quality premiums and discountsat other pticing points.

J. Agr and Applied Econ., December 1995 420
References
Alder, H.L., and E.B. Roessler. Introduction to Probabili@ and Statistics. 6th ed. San Francisco:W.H. Freeman and Co., 1977, pp. 163-166.
Belongia, M.T. “Are Economic Forecasts by Government Agencies Biased? Accurate?” Econ. Rev.,Federal Reserve Bank of St. Louis, Nov./Dee. 1988, pp. 15-23.
Bowman, K. R. and D. E. Ethridge. “Characteristic Supplies and Demands in a Hedonic Framework:U.S. Market for Cotton Fiber Attributes,” Amer. J, of Agr. Econ., 74 (1992): 991-1002.
Brown, J.E., and D,E. Ethridge. “Functional Form Model Specification: An Application to HedonicPricing.” Agr, and Resource Econ, Res, (1995) (forthcoming).
Chen, D. T., G. T. Chiou, and C. G. Anderson. “Inter Regional Pricing of Cotton Fiber Attributes: DoesQuality Matter?” 1991 Beltwide Cotton Conference Proceedings, Cotton Economics and MarketingConference, National Cotton Council, pp. 367-373.
Chen, C., and D. Ethridge. “Premiums and Discounts Paid for Cotton Fiber Quality Attributes by U.S.Textile Manufacturers” 199.5 Beltwide Cotton Conference Proceedings, Cotton Economics andMarketing Conference National Cotton Council, Memphis, TN, (addendum), pp. 92-96.
Elam, E., and B. Dixon, “Examining the Validity of a Test of Futures Market Eftlciency.” J, of Fut, A4kts.,8 (1988): 365-372.
Ethridge, D. E. “A Computerized Remote-Access Commodity Market: Telcot,” S, J, of Agr. Econ., 10(1978): 177-182.
Ethridge D. E. and C. Chen. “Cotton Price Responsiveness to Quality in the U.S.: Textile Mill Prices PaidVS. Producer Prices,” 1993 Beltwide Cotton Conference Proceedings, Cotton Economics andMarketing Conference, National Cotton Council, pp. 441-444.
Ethridge D. E. and B. Davis. “Hedonic Price Estimation for Commodities: An Application to Cotton,” W.J. of Agr. Econ., 7 (1982): 156-163.
Ethridge, D, E,, C. Engels, and J. E. Brown. “An Econometric Approach for Estimating Daily MarketPrices,” 1992 Beltwide Cot~on Conference Proceedings, Cotton Economics and MarketingConference, National Cotton Council, pp. 399-402.
Ethridge, D. E. and K. H. Mathews. “Reliability of Spot Cotton Quotations for Price Discovery in the WestTexas Cotton Market,” Agricultural Economics Dept., Texas Tech University College of Ag.Sciences. Pub. No. T-1-212., Aug. 1983.
Ethridge, D. E. and S, Morse. “Hedonic/Characteristics Price Analysis in Agricultural Economics:Progress, Issues, and Needs,” Agricultural Economics Dept., Texas Tech University College of Ag.Sciences. Pub. No. T-1-347. Aug. 1991. Abstract in Amer. J. of Agr. Econ., 73 (199 I): 1528-1529.
Ethridge, D. E. and J. T, Neeper. “Producer Returns From Cotton Strength and Uniformity: An HedonicPrice Approach,” S. J, qfAgr. Econ., 19 (1987): 9 I-97.

421 Brrnon,Ethndge, Hudson and .Ekgels:An Automated EconometricAppmacit,for liktimatingand ReportingDaily Cotton
Ethridge, D. E., D, L. Shaw, and J. E. Ross. “An Evaluation of the Impact of Instrument Test Line Valueson Cotton Marketing and Use: Progress Report,” CED Working Paper, Economic ResearchService, USDA, Aug. 1977.
Ethridge, D, E., R. Sudderth, and M. Moore. “A Model for Cotton Variety Selection with Yield and QualityConsiderations,” ]983 Beltwide Cotton Research Conference Proceedings., Cotton Economics andMarketing Conference, National Cotton Council, pp. 251-253.
Harrison, S.R. “Regression of a Model on Real System Output: An Invalid Test of Model Validity.” Agr.L$LS., 34(1990): ]83-190.
Hembree, J. F., D. E. Ethridge, and J. T. Neeper. “Market Values of Fiber Properties in SoutheasternTextile Mills,” Textile Res. J., 56 (1986): 140-141.
Holden, K., and D.A. Peel. “On Testing for Unbiasedness and Efficiency of Forecasts.” The Manchester&/ZOO/, 58(1990): 120-127.
Hudson, D., D, Ethridge, and J. Brown. “Producer Prices in Cotton Markets: An Evaluation of ReportedPrice Information Accuracy.” Agribusiness: An Intl. J., (in press).
Kohls, R. L. and W. D. Downey. “Cotton Marketing,” Marketing of Agricultural Products, 4th cd., NewYork, New York: The Macmillan Company, 1967, pp. 392-407.
Neter, J., W. Wasserman, and M. H. Kutner. Applied Linear Regression Models. 2nd ed. Homewood, IL.:Richard D. Irwin, Inc., 1989.
Pindyk, R., and D. Rubinfeld. Econometric Models and Economic Forecasting. 3rd ed. New York: TheDryden Press, 1991, pp. 216-217.
Robinson, J. A., D. E. Ethridge, D. L. Shaw, and C. D. Rogers. “Market Impact Evaluation of theInstrument Testing of Cotton: 1977 Crop Progress Report.” CED Working Paper, Economic,Statistics, and Cooperative Service, USDA, May 1979.
Rosen, S. “Hedonic Prices and Implicit Markets: Product Differentiation in Pure Competition,” J. Polit.Econ., 82 (1974): 34-55.
SAS Institute, Inc. “SAS/STAT User’s Guide, Release 6.03 Edition.” Cary, NC, 1988.
U.S. Department of Agriculture, “Daily Spot Cotton Quotations.” Market News Branch, Cotton Division,Agricultural Marketing Service, Memphis, TN, daily issues.
U.S. Department of Agriculture, “Cotton and Wool Situation and Outlook Report,” Commodity EconomicsDivision, Economic Research Service, CWS-73, August 1993.
Endnotes
1. The functional form is a modification of that found by Brown and Ethridge to facilitate the reportingof prices, premiums, and discounts. The difference is the relinquishing of a quadratic term on level 2 bark,the addition of the two other extraneous matter designations, and use of the color grade, which were notavailable in that study.
J. Agx and Applied Eccm., December 1995 422
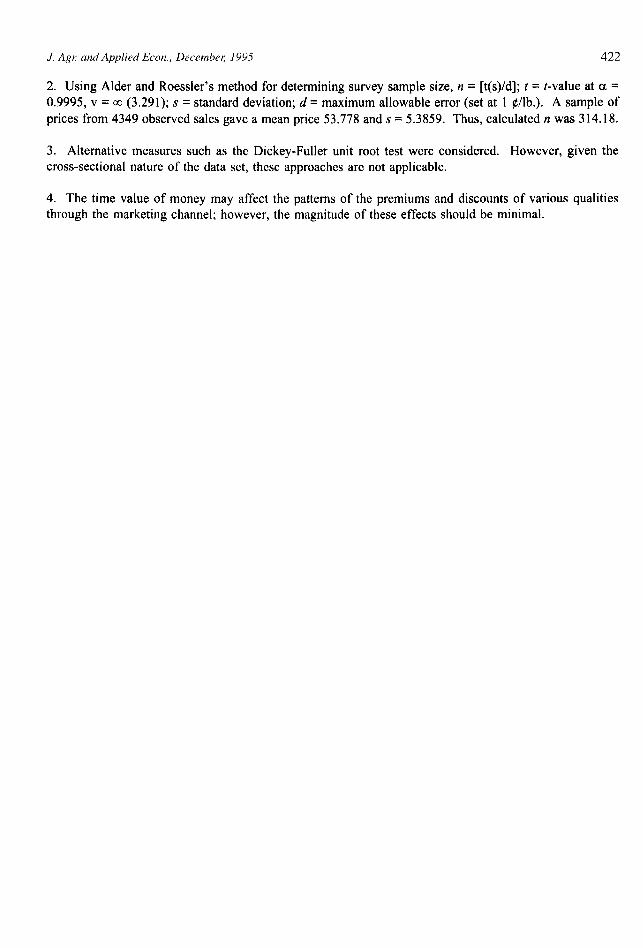
2. Using Alder and Roessler's method fordetemining sumeysample size, n=[t(s)/d]; t=t-value at a=0,9995, v = co (3.291); s = standard deviation; d = maximum allowable error (set at 1 gVlb.). A sample ofprices from 4349 observed sales gave a mean price 53.778 ands = 5.3859. Thus, calculated n was 314.18.
3. Alternative measures such as the Dickey-Fullet unit root test were considered. However, given thecross-sectional nature of the data set, these approaches are not applicable.
4. The time value of money may affect the patterns of the premiums and discounts of various qualitiesthrough the marketing channel; however, the magnitude of these effects should be minimal.