Embed Size (px)
Citation preview

FINAL REPORTCopyright © 2011 American Water Works Association. All Rights Reserved.
An Assessment of the State of Nitrate Treatment Alternatives
FINAL REPORT
The American Water Works Association
Inorganic Contaminant Research and
Inorganic Water Quality Joint Project Committees
by
Jacobs Engineering Group, Inc.
Chad Seidel, Ph.D., P.E. and Craig Gorman, M.S., P.E.
and
The University of California at Davis (UC Davis)
Jeannie L. Darby, Ph.D., P.E. and Vivian B. Jensen, M.S., E.I.T.
June, 2011

June, 2011FINAL REPORT TOC ii
Copyright © 2011 American Water Works Association. All Rights Reserved.
Acknowledgements
Special thanks to the members of the AWWA Inorganic Contaminants Research and Inorganic Water Quality Project Subcommittee:
Name Affiliation Michelle De Haan, Chair Water Works Engineers Jennifer Baldwin, Chair CH2M HILL Jess Brown Carollo Engineers Susan Brownstein California Department of Public Health Dennis Clifford University of Houston Elise Harrington AWWA Tarrah Henrie California Water Service Company France Lemieux Health Canada Jerry Lowry Lowry Systems, Inc.
This document was prepared for the American Water Works Association (AWWA) Inorganic Contaminant Research and Inorganic Water Quality Joint Project Committee. Support for this research was provided from the following sources:
American Water Works Association Technical & Education Council California Department of Public Health Safe Drinking Water Revolving Fund Contract
No. 06-55254 California State Water Resources Control Board, Contract No. 09-122-250
The authors would also like to thank the drinking water utilities surveyed and the various treatment technology vendors for their contributions to the project.
Disclaimer
This document is intended as a guide of nitrate treatment technologies and should be used as an informational tool only. The contents of this document are solely the responsibility of the authors and do not necessarily represent the official views of supporting agencies. The selection and design of the most appropriate nitrate treatment alternative for a particular water system depends on a variety of factors and requires the expertise of experienced professional engineers. Discussion of proprietary technologies is intended to provide information about treatment alternatives and does not imply endorsement.

June, 2011FINAL REPORT TOC iii
Copyright © 2011 American Water Works Association. All Rights Reserved.
Table of ContentsPage
Abbreviations ...........................................................................................................................................viii
0.0 Executive Summary.................................................................................................................ES-1
0.1 Objective ............................................................................................................................ES-10.2 Background........................................................................................................................ES-10.3 Approach............................................................................................................................ES-30.4 Summary of Findings........................................................................................................ES-5
0.4.1 Non-Treatment Options ................................................................................................ ES-50.4.2 Treatment Options ........................................................................................................ ES-5
0.4.2.1 Ion Exchange (IX) ........................................................................................................ ES-80.4.2.2 Reverse Osmosis (RO).................................................................................................. ES-90.4.2.3 Electrodialysis (ED, EDR, SED) .................................................................................. ES-90.4.2.4 Biological Denitrification (BD) .................................................................................. ES-100.4.2.5 Chemical Denitrification (CD) ................................................................................... ES-10
0.5 Summary and Conclusions .............................................................................................ES-111.0 Introduction.................................................................................................................................... 1
1.1 Management Options for Nitrate in Potable Water............................................................. 12.0 Non-Treatment Options for Nitrate Contaminated Potable Water .......................................... 3
2.1 Well Abandonment.................................................................................................................. 32.2 Wellhead Protection and Land Use Management................................................................ 32.3 Development of Alternative Sources and Source Modification........................................... 42.4 Blending.................................................................................................................................... 5
3.0 Treatment Options for Nitrate Contaminated Potable Water .................................................. 6
3.1 Ion Exchange (IX) ................................................................................................................... 93.1.1 Conventional Ion Exchange.............................................................................................. 103.1.2 Ion Exchange - Design Considerations............................................................................. 11
3.1.2.1 Water Quality.................................................................................................................... 133.1.2.2 System Layout and Site Considerations ........................................................................... 163.1.2.3 Residuals Management and Disposal ............................................................................... 163.1.2.4 Maintenance, Monitoring and Operational Complexity ................................................... 17
3.1.3 Ion Exchange - Cost Considerations................................................................................. 173.1.4 Ion Exchange - Selected Research.................................................................................... 183.1.5 Ion Exchange - Summary of Advantages and Disadvantages .......................................... 183.1.6 Modifications to Conventional Ion Exchange .................................................................. 19
3.1.6.1 Counter Current Flow with Specialized Resin.................................................................. 193.1.6.2 Improved Hydraulics and Nitrate Selective Resins .......................................................... 213.1.6.3 Multiple Vessel Carousel Configuration .......................................................................... 213.1.6.4 Multiple Vessel Staggered Configuration......................................................................... 243.1.6.5 Weak Base Anion Exchange (WBA IX) .......................................................................... 25
3.1.7 Ion Exchange - Case Studies............................................................................................. 273.1.7.1 Conventional Ion Exchange - Case Studies ...................................................................... 273.1.7.2 Modifications to Conventional Ion Exchange - Case Studies........................................... 33
3.2 Reverse Osmosis (RO)........................................................................................................... 433.2.1 Reverse Osmosis - Design Considerations ....................................................................... 44
3.2.1.1 Water Quality.................................................................................................................... 453.2.1.2 System Components and Site Considerations................................................................... 473.2.1.3 Residuals Management and Disposal ............................................................................... 473.2.1.4 Maintenance, Monitoring and Operational Complexity ................................................... 48
3.2.2 Reverse Osmosis - Cost Considerations ........................................................................... 49

June, 2011FINAL REPORT TOC iv
Copyright © 2011 American Water Works Association. All Rights Reserved.
3.2.3 Reverse Osmosis - Selected Research .............................................................................. 503.2.4 Reverse Osmosis - Summary of Advantages and Disadvantages..................................... 513.2.5 Reverse Osmosis - Improvements and Modifications ...................................................... 51
3.2.5.1 Process Modification ........................................................................................................ 513.2.5.2 Membrane Modification – Low Pressure Membranes...................................................... 53
3.2.6 Reverse Osmosis - Case Studies ....................................................................................... 533.3 Electrodialysis (ED/EDR/SED) ............................................................................................ 69
3.3.1 Electrodialysis - Design Considerations ........................................................................... 713.3.1.1 Water Quality.................................................................................................................... 723.3.1.2 System Components and Site Considerations................................................................... 733.3.1.3 Residuals Management and Disposal ............................................................................... 743.3.1.4 Maintenance, Monitoring and Operational Complexity ................................................... 74
3.3.2 Electrodialysis - Cost Considerations ............................................................................... 753.3.3 Electrodialysis - Selected Research .................................................................................. 763.3.4 Electrodialysis - Summary of Advantages and Disadvantages......................................... 763.3.5 Modifications to Electrodialysis ....................................................................................... 77
3.3.5.1 Selective Electrodialysis (SED)........................................................................................ 773.3.6 Electrodialysis - Case Studies........................................................................................... 78
3.4 Biological Denitrification (BD)............................................................................................. 873.4.1 Biological Denitrification – Design Considerations ......................................................... 89
3.4.1.1 Water Quality.................................................................................................................... 903.4.1.2 System Components and Site Considerations................................................................... 913.4.1.3 Fixed Bed.......................................................................................................................... 913.4.1.4 Fluidized Bed.................................................................................................................... 923.4.1.5 Membrane Biological Reactor (MBR)/Membrane Biofilm Reactor (MBfR)................... 923.4.1.6 In Situ Denitrification ....................................................................................................... 953.4.1.7 Post-Treatment Requirements - Filtration/Taste & Odor/Disinfection............................. 953.4.1.8 Residuals Management and Disposal ............................................................................... 953.4.1.9 Maintenance, Monitoring, and Operational Complexity .................................................. 96
3.4.2 Biological Denitrification - Cost Considerations.............................................................. 963.4.3 Biological Denitrification - Selected Research................................................................. 973.4.4 Biological Denitrification - Summary of Advantages and Disadvantages ....................... 973.4.5 Biological Denitrification - Case Studies ......................................................................... 98
3.5 Chemical Denitrification (CD) ........................................................................................... 1073.5.1 Zero Valent Iron (ZVI) ................................................................................................... 1083.5.2 Catalytic Denitrification ................................................................................................. 1103.5.3 Chemical Denitrification - Design Considerations ......................................................... 110
3.5.3.1 Water Quality.................................................................................................................. 1113.5.3.2 System Components and Site Considerations................................................................. 1123.5.3.3 Residuals Management and Disposal ............................................................................. 1123.5.3.4 Maintenance, Monitoring and Operational Complexity ................................................. 112
3.5.4 Chemical Denitrification - Emerging Technologies ....................................................... 1133.5.4.1 Sulfur-Modified Iron (SMI) Media................................................................................. 1133.5.4.2 Granular Clay Media ...................................................................................................... 1153.5.4.3 Powdered Metal Media................................................................................................... 116
3.5.5 Chemical Denitrification - Cost Considerations ............................................................. 1163.5.6 Chemical Denitrification - Selected Research ................................................................ 1173.5.7 Chemical Denitrification - Summary of Advantages and Disadvantages....................... 117
3.6 Brine Treatment Alternatives and Hybrid Treatment Systems...................................... 1183.6.1 Electrochemical Destruction of Nitrate in Waste Brine.................................................. 1193.6.2 Catalytic Treatment of Waste Brine ............................................................................... 119
3.7 Residential Treatment (Point-of-Use, Point-of-Entry)..................................................... 121

June, 2011FINAL REPORT TOC v
Copyright © 2011 American Water Works Association. All Rights Reserved.
4.0 References................................................................................................................................... 123
5.0 Appendix..................................................................................................................................... 133
5.1 Tables of Selected Research................................................................................................ 133

June, 2011FINAL REPORT TOC vi
Copyright © 2011 American Water Works Association. All Rights Reserved.
List of TablesPage
Table ES-1 Utilities Included in the Case Studies. ...................................................................ES-4Table ES-2 Comparison of Major Treatment Types.................................................................ES-6Table ES-3 Potable Water Treatment Options for Nitrate Management......................................ES-12Table 3-1 Utilities Included in the Case Studies. .........................................................................7Table 3-2 Potable Water Treatment Options for Nitrate Management (adapted from
WA DOH, 2005)..........................................................................................................8Table 3-3 Selection of Full Scale Ion Exchange Installations for Nitrate Removal. ...................9Table 3-4 Summary of Design Considerations for Conventional IX.........................................12Table 3-5 Selected Published Costs* of Ion Exchange Systems for Nitrate Removal. .............18Table 3-6 Summary of Design Considerations for Reverse Osmosis. .......................................44Table 3-7 Selected Costs* of Reverse Osmosis Systems for Nitrate Removal..........................50Table 3-8 Summary of Design Considerations for Electrodialysis/Electrodialysis
Reversal......................................................................................................................72Table 3-9 Comparison of EDR and Conventional Surface Water Treatment O&M
Costs (from Werner & Gottberg, 2005).....................................................................76Table 3-10 Full Scale Biological Denitrification Systems for Potable Water Treatment. ...........89Table 3-11 Summary of Design Considerations for Biological Denitrification. .........................90Table 3-12 Membrane Biological Reactor Configurations. .........................................................94Table 3-13 Cost Information* for Biological Denitrification of Potable Water. .........................97Table 3-14 Summary of Design Considerations for Chemical Denitrification..........................111Table 3-15 Selected Research on Brine Treatment Alternatives and Hybrid Systems for
Nitrate Treatment of Potable Water. ........................................................................119Table 3-16 Costs of POU Treatment for Nitrate Removal (from Mahler et al., 2007). .............122

June, 2011FINAL REPORT TOC vii
Copyright © 2011 American Water Works Association. All Rights Reserved.
List of Figures Page
Figure ES-1 Summary of Nitrate Management Options. ……………………………………...ES-2Figure 2-1 Selective Well Screening Using a Packer/Plug. .......................................................................4Figure 3-1 Conventional Ion Exchange Schematic................................................................................10Figure 3-2 Process Flow Diagram for Counter Current MIEX® Process (Orica Watercare, N.D.b). ...............20Figure 3-3 Vessel Rotation in Calgon Carbon’s Countercurrent ISEP® System (Calgon Carbon
Corporation, 2004). .........................................................................................................22Figure 3-4 Example of Flow Through the ISEP® System (Calgon Carbon Corporation, 2004). .....................23Figure 3-5 Example of an Envirogen Multiple Bed Proprietary Anion Exchange System (Envirogen,
N.D.a)...........................................................................................................................24Figure 3-6 Process Schematic of Weak Base Ion Exchange for Nitrate ("WIN" Process) (ARA &
Purolite, N.D.b). .............................................................................................................27Figure 3-7 Reverse Osmosis Schematic. .............................................................................................43Figure 3-8 Flow Chart of the HERO™ Process (Central Arizona Salinity Study, 2006). ..............................52Figure 3-9 Electrodialysis Reversal Schematic.....................................................................................69Figure 3-10 Illustration of Electrodialysis Membrane Stack. ....................................................................70Figure 3-11 Biological Denitrification Schematic...................................................................................87Figure 3-12 Surface Chemistry of ZVI Particles (Chui, 2009).................................................................109Figure 3-13 Process Schematic for Denitrification Using SMI-III® (DSWA, 2010). ...................................114Figure 3-14 Schematic of an Ion Exchange System with Brine Regeneration Coupled with Catalytic
Treatment of Brine for Reuse (Werth, 2010).......................................................................120

June, 2011FINAL REPORT TOC viii
Copyright © 2011 American Water Works Association. All Rights Reserved.
Abbreviations
AFY Acre Feet per YearAWWA American Water Works AssociationBMP Best Management PracticeBD Biological DenitrificationCD Chemical DenitrificationDBP Disinfection By-ProductDL Detection LimitEBCT Empty Bed Contact TimeED ElectrodialysisEDR Electrodialysis ReversalGAC Granular Activated CarbonGPM Gallons per MinuteGWUDI Groundwater Under Direct Influence (of Surface Water)HERO™ High Efficiency Reverse OsmosisHLR Hydraulic Loading RateISEP® Ion Exchange Separation SystemIX Ion ExchangeLSI Langelier Saturation IndexMBfR Membrane Biofilm ReactorMBR Membrane BioreactorMCL Maximum Contaminant LevelMGD Million Gallons per DayMIEX® Magnetic Ion ExchangeNDMA N-nitrosodimethylamineO&M Operations and MaintenancePOE Point-of-EntryPOU Point-of-UseRO Reverse OsmosisSBA IX Strong Base Anion ExchangeSBR Sequencing Batch ReactorSDWA Safe Drinking Water ActSED Selective ElectrodialysisSMI Sulfur Modified IronTDS Total Dissolved SolidsTSS Total Suspended SolidsULPRO Ultra-Low Pressure Reverse OsmosisUSBR Upflow Sludge Blanket ReactorVSEP Vibratory Shear Enhanced ProcessWAC Weak Acid Cation ExchangeWBA IX Weak Base Anion ExchangeZVI Zero Valent Iron

FINAL REPORT June, 2011Executive Summary ES - 1
Copyright © 2011 American Water Works Association. All Rights Reserved.
0.0 Executive Summary
0.1 Objective
Jacobs Engineering Group, Inc. (Jacobs), in collaboration with the University of California at
Davis (UC Davis), has conducted An Assessment of the State of Nitrate Treatment Alternatives
for the American Water Works Association (AWWA) Inorganic Contaminant Research and
Inorganic Water Quality Joint Project Committees. The purpose of this document is to provide
a detailed guide to the current state of nitrate treatment alternatives that can be used as a
reference tool for the drinking water community.
0.2 Background
Nitrate contamination of potable water sources is becoming one of the most important water
quality concerns in the United States. The maximum contaminant level (MCL) for nitrate is 10
mg/L as nitrogen (N). The major health concern of nitrate exposure through drinking water is
the risk of methemoglobinemia, or “blue baby syndrome,” especially in infants and pregnant
women. Due to the nature of the infant digestive system, nitrate is reduced to nitrite which can
render hemoglobin unable to carry oxygen (SWRCB, 2010). Nitrate is naturally occurring at low
levels in most waters, but it is particularly prevalent in groundwater that has been impacted by
certain agricultural, commercial or industrial activities. Of specific concern are crop fertilization
activities and discharges from animal operations, wastewater treatment facilities, and septic
systems. Small rural communities are particularly impacted by nitrate (Pacific Institute, 2011).
Nitrate presents unique water treatment challenges. The United States Environmental
Protection Agency (USEPA) lists only anion exchange (IX), reverse osmosis (RO), and
electrodialysis reversal (EDR) as accepted potable water treatment methods for nitrate removal
(USEPA, 2010). Due to the production of high-strength brine residuals, sustainable application
of these three technologies is often limited by a lack of local residual disposal options and the
challenge of increasing salt loads. The lack of affordable and feasible nitrate treatment
alternatives can force impacted utilities to remove nitrate-contaminated sources from their
available water supply. In many instances, this action can severely compromise a water utility’s
ability to provide an adequate supply of safe and affordable potable water.

FINAL REPORT June, 2011Executive Summary ES - 2
Copyright © 2011 American Water Works Association. All Rights Reserved.
The need for additional nitrate treatment technologies has driven the drinking water
community to begin developing alternative options to effectively remove nitrate while limiting
cost and brine production challenges. Promising treatment options include weak base anion
(WBA) exchange and improvements in strong base anion (SBA) exchange such as low brine
residual technologies; biological treatment using fluidized bed, fixed bed, and membrane
biofilm (MBfR) reactors; and chemical reduction using media such as zero valent iron (ZVI) and
sulfur modified iron (SMI). A summary of the options to address nitrate contamination of
drinking water is presented in Figure ES.1. In this diagram treatment options are classified in
terms of their ability to either remove nitrate to a residual waste stream or transform nitrate to
other nitrogen species through reduction.
Figure ES-1 Summary of Nitrate Management Options.

FINAL REPORT June, 2011Executive Summary ES - 3
Copyright © 2011 American Water Works Association. All Rights Reserved.
0.3 Approach
This report includes a comprehensive literature review and case studies of specific systems
across the range of nitrate treatment alternatives. The literature review is intended to provide
background information about current and emerging potable water treatment alternatives to
address nitrate contamination. In addition to peer-reviewed literature, information found in the
“grey papers” of conference proceedings has been included to assure capture of the most recent
technology developments. For each of the major treatment technologies, subsections of the
literature review detail the following:
Design considerations including water quality, system layout and site considerations;
residuals management and disposal; and maintenance, monitoring and operational
complexity,
Cost considerations,
Selected research, and
A summary of advantages and disadvantages.
Information is summarized in tables whenever appropriate, including a summary table of
selected research studies for each of the major treatment technologies (Appendix).
A survey was conducted to collect detailed information about the application of nitrate
treatment. A subset of utilities, currently treating for nitrate and/or in design for future
treatment, was included in the survey. The survey was developed to gather information with
respect to the benefits and limitations of the various nitrate treatment technologies and was
conducted via phone and in-person when applicable. The list of utilities included in the survey
was developed with the intention of covering a range of utilities with respect to geographic
location, treatment type, population size and residual handling techniques (Table ES.1).
Detailed case studies have been compiled for each of the treatment technologies where full-
scale facilities have been in operation or are moving ahead with design.

FINAL REPORT June, 2011Executive Summary ES - 4
Copyright © 2011 American Water Works Association. All Rights Reserved.
Table ES-1 Utilities Included in the Case Studies.
Case # Treatment Type Location Capacity (gpm)Avg. Influent Nitrate
(mg/L as N)
Ion Exchange
1 Conventional ion exchange with blending California 400 7-12
2 Conventional ion exchange with blending California 400 ~10
3 Counter Current Ion Exchange (MIEX®) Indian Hills, CO 50 12-16
4 Multiple vessel ion exchange California 500-900 8-20
5 Multiple vessel ion exchange Chino, CA 5000 9-45
Reverse Osmosis
6 Reverse osmosis and blending Bakersfield, CA 120 17-19
7 Reverse osmosis, exploring biological reduction Brighton, CO 4600 11-20
8 Reverse osmosis and blending Arlington Desalter, Riverside, CA 4583 10-20
Combined Reverse Osmosis and Ion Exchange
9 Reverse osmosis, ion exchange and blending Chino Desalter I, Chino, CA 4940 (RO), 3400 (IX) 32-65
10 Reverse osmosis, ion exchange and blending Chino Desalter II, Mira Loma, CA 4167 (RO), 2778 (IX) 15-48
Electrodialysis (ED/EDR/SED)
11 Electrodialysis Reversal (EDR) Spain 3,260 (each, 2 systems) ~18
12 Selective Electrodialysis (SED) Israel 310 19-20
Biological Denitrification
13 Implementing fluidized bed biological reduction Rialto, CA 2000-4000 17-19
14 Implementing fixed bed biological reduction Riverside, CA 1670 10-20

FINAL REPORT June, 2011Executive Summary ES - 5
Copyright © 2011 American Water Works Association. All Rights Reserved.
0.4 Summary of Findings
0.4.1 Non-Treatment Options
The focus of this assessment is the current state of nitrate treatment alternatives. However, in
practice, non-treatment options are generally considered first as they can often be more
sustainable and less costly. Non-treatment options include wellhead protection, land use
management, well inactivation, source modification, development of alternative sources
(including consolidation/connection to a nearby system), and blending. Blending was found to
be the most common method to address nitrate contamination. When a low nitrate concentration
water supply source is available, dilution of high nitrate concentration sources to produce water
with nitrate concentrations below the MCL is typically more cost effective than installing
treatment.
0.4.2 Treatment Options
Nitrate treatment technologies were categorized into five major types. Ion exchange (IX),
reverse osmosis (RO), and electrodialysis/electrodialysis reversal (ED/EDR) remove nitrate to a
concentrated waste stream, while biological denitrification (BD) and chemical denitrification
(CD) transform nitrate to other nitrogen species through reduction. Common concerns in the
application of the removal technologies include waste management costs and treatment
interference from other water quality parameters (e.g., hardness and sulfate). Pretreatment is
often required to avoid fouling or scaling of the resin for IX and the membranes for RO and
ED/EDR. Due to the destruction of nitrate, both biological and chemical denitrification have the
potential for more sustainable treatment without brine residuals but also have limitations to
consider. Full scale application of these nitrate treatment options is currently limited.
The selection of the most appropriate treatment option depends on various key factors specific
to the needs and priorities of individual water systems. A brief comparison of fundamental
design considerations, advantages and disadvantages of these treatment options is listed in
Table ES.2. It is important to note that the contents of Table ES.2 are not intended to provide a
comprehensive set of criteria for treatment options. Other important criteria in determining
the best treatment option, which are site specific and cannot be broadly generalized, include
capital and operations and maintenance (O&M) costs, system size (capacity), and system

FINAL REPORT June, 2011Executive Summary ES - 6
Copyright © 2011 American Water Works Association. All Rights Reserved.
footprint. Overall, there is no single treatment option that can be considered the best method
for nitrate removal across all water quality characteristics and for all systems.

FINAL REPORT June, 2011Executive Summary ES - 7
Copyright © 2011 American Water Works Association. All Rights Reserved.
Table ES-2 Potable Water Treatment Options for Nitrate Management (adapted from WA DOH, 2005).
Ion Exchange Reverse Osmosis Electrodialysis Biological Denitrification Chemical DenitrificationFull Scale Systems Yes Yes Yes Yes No
Treatment Type Removal to waste stream Removal to waste stream Removal to waste stream Biological reduction Chemical reduction
Common Water Quality Design Considerations
Sulfate, iron, manganese, total suspended solids (TSS), metals (e.g., arsenic), hardness, organic
matter
Turbidity, iron, manganese,SDI, particle size, TSS,
hardness, organic matter, metals (e.g., arsenic)
Turbidity, iron, manganese, TSS, hydrogen sulfide,
hardness, metals (e.g., arsenic)
Temperature and pH, anoxic conditions
Temperature and pH
Pretreatment Needs Pre-filter, address hardness Pre-filter, address hardness Pre-filter, address hardness pH adjustment, nutrient and substrate addition, need for
anoxic conditions
pH adjustment
Post-treatment Needs pH adjustment pH adjustmentRemineralization
pH adjustmentRemineralization
Filtration, disinfection, possible substrate adsorption
pH adjustment, iron removal, potential ammonia control
Waste/Residuals Management
Waste brine Concentrate Concentrate Sludge/biosolids Waste media, Iron sludge
Start-up Time Minutes Minutes Minutes Initial plant startup:Days to weeks
After reaching steady state: Minutes
Minutes
Water Recovery Conventional (97%)Low brine (Up to 99.9%)
Up to 85% Up to 95% Nearly 100% Not demonstrated full scale
Advantages Nitrate selective resins,common application,
multiple contaminant removal
Multiple contaminant removal, desalination (TDS
removal)
Multiple contaminant removal, higher water
recovery(less waste), desalination,
unaffected by silica
No waste brine or concentrate, nitrate reduction rather than transfer to a waste stream,high water recovery, and
potential for multiple contaminant removal
No waste brine or concentrate, nitrate reduction rather than
transfer to a waste stream, and potential for multiple contaminant removal
Disadvantages Potential for nitrate peaking, high chemical use (salt), brine waste disposal, potential for
disinfection byproduct (DBP) formation (e.g., NDMA)
Membrane fouling and scaling, lower water recovery,
operational complexity, energy demands, waste
disposal
Energy demands, operational complexity, waste disposal
Substrate addition, potentially more complex, high
monitoring needs, possible sensitivity to environmental
conditions, risk of nitrite formation (potential
incomplete denitrification), post-treatment to address
turbidity standards and 4-log virus removal (state
dependent)
Inconsistency of nitrate reduction, risk of nitrite
formation (potential incomplete denitrification),
reduction to ammonia, lack of full scale systems, pH and temperature dependence,
possible need for iron removal

FINAL REPORT June, 2011Executive Summary ES - 8
Copyright © 2011 American Water Works Association. All Rights Reserved.
0.4.2.1 Ion Exchange (IX)
The most commonly used nitrate treatment method is IX. Anion exchange for nitrate removal is
similar to a water softener, with nitrate ions removed rather than hardness ions. Nitrate is
removed from the treatment stream by displacing chloride on an anion exchange resin.
Subsequently, regeneration of the resin is necessary to remove the nitrate from the resin.
Regeneration is accomplished by using a highly concentrated salt solution resulting in the
displacement of nitrate by chloride. The result is a concentrated waste brine solution high in
nitrate that requires disposal. The most significant drawback of this treatment option is the cost
for disposal of waste brine, especially for inland communities. The volume of the brine is largely
dependent on the raw water quality and the configuration of the system.
Key factors in the consideration of IX include the pretreatment requirements to avoid resin
fouling, the potential need for nitrate selective resin, the frequency of resin replacement, the
possible post-treatment requirements to address corrosion or other product water quality
concerns (e.g., the potential for NDMA formation), and the management of waste brine. If waste
brine disposal options are not limiting, IX can be the best option for low to moderate nitrate
contamination and removal of multiple contaminants (including arsenic, perchlorate and
chromium). Application of IX may not be feasible for extremely high nitrate levels due to salt
use and waste volume. Current research on brine treatment alternatives may lead to the
development of technologies capable of effectively addressing the disposal concern; however,
the costs for full scale implementation of this are unknown at this point.
Modifications to conventional IX have emerged in recent years offering low brine alternatives
with improved efficiency. It is important to note that the efficiency of IX systems is dependent
on the raw water characteristics and there can be cases where conventional IX systems yield
greater water efficiency than a modified system that is implemented at a location with lesser
water quality.
Another promising alternative to consider for the future is weak base ion exchange (WBA IX).
This emerging technology is more operationally complex than conventional IX, but may offer
the advantage of waste recycling as fertilizer.

FINAL REPORT June, 2011Executive Summary ES - 9
Copyright © 2011 American Water Works Association. All Rights Reserved.
0.4.2.2 Reverse Osmosis (RO)
As the second most common nitrate treatment alternative, RO can be feasible for both municipal
and Point-of-Use applications and can be used simultaneously for desalination and removal of
nitrate and many co-contaminants. Following pretreatment to prevent membrane fouling and
scaling, water is forced through a semi-permeable membrane under pressure such that the water
passes through, while contaminants are impeded by the membrane.
Key factors in the consideration of RO are the pretreatment requirements, the trade-off between
water recovery and power consumption, the management of waste concentrate, and the typically
higher costs relative to IX. One deciding factor favoring the selection of RO over IX for nitrate
removal would be the need to address salinity.
Recent advancements in membrane technology and optimization of pre- and post-treatment have
led to increases in the efficiency of RO treatment systems. For example, the use of Ultra-Low
Pressure Reverse Osmosis (ULPRO) membranes enables lower power consumption.
0.4.2.3 Electrodialysis (ED, EDR, SED)
The use of ED in potable water treatment has increased in recent years, offering the potential for
lower residual volumes through improved water recovery, the ability to selectively remove
nitrate ions, and the minimization of chemical and energy requirements. ED works by passing
an electric current thru a series of anion and cation exchange membranes that trap nitrate and
other ions in a concentrated waste stream. To minimize fouling and thus the need for chemical
addition, the polarity of the system can be reversed with electrodialysis reversal (EDR). By
reversing the polarity (and the solution flow direction) several times per hour, ions move in the
opposite direction through the membranes, minimizing buildup.
Key factors in the consideration of EDR are the pretreatment requirements, the operational
complexity of the system, the limited number of system manufacturers, the lack of full-scale
installations for nitrate removal from potable water in the United States, and the management of
waste concentrate. Like RO, EDR is commonly used for desalination and can be an alternative
for nitrate treatment of high TDS waters. In contrast to conventional RO, EDR is unaffected by
silica. EDR costs are similar to RO and evidence suggests that EDR can be the preferable option
as the Silt Density Index (SDI) increases. For very small particle sizes, robust pretreatment can
be necessary for RO. It is important to note that the EDR process does not directly filter the

FINAL REPORT June, 2011Executive Summary ES - 10
Copyright © 2011 American Water Works Association. All Rights Reserved.
treatment stream through the membranes; contaminants are transferred out of the treatment
stream and trapped by the membranes. This generally minimizes membrane fouling, decreasing
pretreatment requirements in comparison to RO.
0.4.2.4 Biological Denitrification (BD)
Biological denitrification in potable water treatment is more common in Europe with recent full-
scale systems in France, Germany, Austria, Poland, Italy and Great Britain. To date, full-scale
drinking water applications in the United States are limited to a single plant in Coyle, OK (no
longer online). However, two full-scale systems are anticipated in California in the next couple
of years. Biological denitrification relies on bacteria to transform nitrate to nitrogen gas (through
reduction). Substrate and nutrient addition is necessary and post-treatment can be more intensive
than for the removal processes. Biological denitrification offers the ability to address multiple
contaminants and the avoidance of costly waste brine disposal.
Key factors in the consideration of biological denitrification are the chemical requirements, the
need for anoxic conditions, the level of operator training, the robustness of the system, and the
post-treatment requirements. State regulations are expected to vary and, until more experience
with the application of biological denitrification for potable water treatment is obtained in the
United States, pilot and demonstration requirements may be intensive. Typically biological
treatment is thought to have a larger footprint; however, with the latest design configurations, the
system footprint may be comparable to that of RO or EDR systems.
With reduction of nitrate to nitrogen gas, the lack of a problematic brine waste stream is a clear
advantage of biological treatment over the removal processes. Biological treatment has the
potential to provide a sustainable nitrate treatment option for the long term. More will be known
with the completion of the anticipated full-scale systems in California, cost estimation suggests
that biological treatment can be economically competitive with IX.
0.4.2.5 Chemical Denitrification (CD)
Chemical denitrification uses metals to transform nitrate to other nitrogen species. As an
emerging technology, no full-scale chemical denitrification systems have been installed in the
United States for nitrate treatment of potable water and application for nitrate treatment has been
strictly limited to bench and pilot scale studies. A significant body of research has explored the
use of zero valent iron (ZVI) in denitrification. Several patented granular media options have

FINAL REPORT June, 2011Executive Summary ES - 11
Copyright © 2011 American Water Works Association. All Rights Reserved.
also been developed including sulfur modified iron (SMI) media, granular clay media and
powdered metal media.
Key factors in the consideration of chemical denitrification are the reliability and consistency of
nitrate reduction, the lack of full-scale installations, the type of media, and the dependence on
temperature and pH. Chemical denitrification has the potential to become a feasible full-scale
nitrate treatment alternative, with the advantage of reducing nitrate to other nitrogen species and
avoiding the need to dispose of a concentrated waste stream. However, currently this option is
an emerging technology in need of additional pilot- and full-scale testing. Due to the potential
benefits, further research and optimization of chemical denitrification systems will likely make
this a competitive option in the future, especially for multiple contaminants (e.g., arsenic and
chromium).
0.5 Summary and Conclusions
Current full-scale nitrate treatment installations in the United States consist
predominantly of IX and RO. While EDR is a feasible option for nitrate removal from
potable water, the application of EDR is generally limited to waters that have high TDS
or silica. The use of biological denitrification to address nitrate contamination of
drinking water is more common in Europe than in the U.S.. However, this option is
emerging in the U.S. and two full-scale systems are expected in a few years. Chemical
denitrification may become a feasible nitrate treatment option in the future; however, the
lack of current full-scale implementation suggests the need for further research,
development and testing.
Brine reuse and treatment are vital to the continued reliance on IX for nitrate treatment of
potable water. The low brine technologies offer a minimal waste approach and current
research and development of brine treatment alternatives seem to be lighting the path
toward future progress.
In regions with declining water quality and insufficient water quantity, the need to
address multiple contaminants will increase in the future, suggesting the future
dominance of technologies capable of multiple contaminant removal. In this context, for
any individual water source or system, the most appropriate technology will vary with the
contaminants requiring mitigation. Although complex, analysis of the optimal treatment
FINAL REPORT June, 2011Executive Summary ES - 12
Copyright © 2011 American Water Works Association. All Rights Reserved.
option for pairs and groups of contaminants will assist in the treatment design and
selection. In such scenarios, the best treatment option for nitrate may not be the most
viable overall.
Currently and into the future, selection of the optimal and most cost effective potable
water treatment options will depend not only on the specific water quality of a given
water source, but also on the priorities of a given water system. If land is limited, the
typical configuration required for biological treatment may not be feasible. If brine waste
disposal options are costly or limited, implementation of denitrification treatment or
development of brine recycling and treatment may be the most suitable option.
When deciding on nitrate treatment, the characteristics of the water system must be taken
into account as well. With consideration of economies of scale, many rural small water
systems cannot afford to install treatment. Even with financial assistance to cover capital
costs, the long term viability of a treatment system can be undermined by O&M costs that
are simply not sustainable. For such systems, treatment can become more affordable
through consolidation of multiple small water systems into larger combined water
systems that can afford treatment as a conglomerate. With a continued decline in water
quality, non-treatment options alone, like blending or drilling a new well, may become
insufficient measures for a water system to provide an adequate supply of safe and
affordable potable water. Especially in rural small communities, perhaps the most
promising approach will be a combination of consolidation and treatment.
While current cost considerations are commonly the driving force in selecting nitrate
treatment, it is essential to consider the long term implications of current industry
decisions. For example, it may be cost effective for a particular system to utilize
conventional IX currently, but future water quality changes (e.g., increasing nitrate levels,
co-contamination, high salt loading), discharge regulations, or disposal fees may lead to
an unmanageable increase in costs. Environmental sustainability in drinking water
treatment is being addressed with brine treatment alternatives and denitrification options.
It is important to approach the future of drinking water treatment with the mindset that
environmental sustainability and economic sustainability are tightly interwoven.

FINAL REPORT June, 2011Executive Summary ES - 13
Copyright © 2011 American Water Works Association. All Rights Reserved.
Within the drinking water community, the options typically considered to address nitrate
contamination are IX and RO. Alternative technologies are available because, under
some circumstances, they offer advantages over IX and RO. New technologies will
continue to be investigated and developed because no single option is ideal for all
situations. There is not a nitrate treatment option currently available that can affordably
address all possible scenarios. The following diagram is a rough guide for treatment
technology selection based on water quality concerns and possible priorities for a given
water source or system (Table ES.3). This diagram includes generalizations and is not
intended to be definitive. In the selection of nitrate treatment technologies the unique
needs of an individual water system must be assessed by professional engineers to
optimize treatment selection and design.
Table ES-3 Comparison of Major Treatment Types1.
Concerns IX RO EDR BD CD Priorities IX RO EDR BD CD
High Nitrate Removal
High Hardness Not a Major Concern
High TDS Removal
Reliability
Arsenic Removal
Training/ Ease of operation
Radium and Uranium Removal
Minimize Capital Cost
Chromium Removal
Minimize Ongoing O&M Cost
PerchlorateRemoval
Minimize Footprint
Good PoorUnknown
(blank)
Industry Experience
Ease of Waste Management
1 Ion Exchange (IX), Reverse Osmosis (RO), Electrodialysis Reversal (EDR), Biological Denitrification (BD), Chemical Denitrification (CD). This table offers a generalized comparison and is not intended to be definitive.There are notable exceptions to the above classifications.
FINAL REPORT June, 2011Introduction Page 1
Copyright © 2011 American Water Works Association. All Rights Reserved.
1.0 Introduction
Nitrate contamination of potable water sources is becoming one of the most important water
quality concerns in the United States. The federal maximum contaminant level (MCL), 10 mg/L
nitrate as nitrogen (N), is currently being approached or exceeded in potable water supply
sources at locations throughout the United States (Nolan et al., 2002; USEPA, N.D.; and Chen et
al., 2009). A major source of nitrate contamination is fertilizer. Application of fertilizer in
excess of the amount taken up by crops leads to leaching into the groundwater. Leakage from
livestock feedlots and waste storage also contributes to the nitrate problem (LLNL, 2002).
Additional sources include wastewater treatment discharge, faulty septic systems and various
industrial applications. Due to the typical sources, nitrate contamination is more common in
rural agricultural areas. The major health concern of nitrate exposure through drinking water is
the risk of methemoglobinemia, especially in infants and pregnant women. Due to the nature of
the infant digestive system, nitrate is reduced to nitrite which can render hemoglobin unable to
carry oxygen (SWRCB, 2010).
1.1 Management Options for Nitrate in Potable Water
To meet the nitrate MCL in the provision of potable water, both non-treatment and treatment
options are considered. Source management with non-treatment can sometimes provide less
costly solutions through wellhead protection, land use management, well abandonment, source
modification, development of alternative sources (including consolidation or connection to a
nearby system), or blending. The feasibility of non-treatment options can be limited by various
factors including location, budget, source availability, and variability of water quality (i.e.,
fluctuations in nitrate levels), resulting in the need for treatment to remove or reduce nitrate.
Current treatment methods include ion exchange (IX), reverse osmosis (RO),
electrodialysis/electrodialysis reversal (ED/EDR), biological denitrification (BD) and chemical
denitrification (CD). These nitrate management options are examined in detail to assess
research findings, capital and O&M costs, typical limitations and the latest improvements.
Design and cost considerations will be addressed with the development of guidelines for
determining the most appropriate treatment option based on source water quality and other

FINAL REPORT June, 2011Introduction Page 2
Copyright © 2011 American Water Works Association. All Rights Reserved.
water system characteristics. The inclusion of Point-of-Entry (POE) and Point-of-Use (POU)
treatment is also essential to a comprehensive examination of nitrate treatment. The Safe
Drinking Water Act (SDWA) [Section 1412(b)(4)(E)(ii)] (USEPA, 1998) identifies both POE and
POU treatment units as options for compliance technologies for small systems (although state
regulations governing the use of POU and POE devices for water system compliance may be
restrictive). Lastly, hybrid systems are explored. The combination of multiple treatment
technologies, including several developing brine treatment alternatives, can maximize the
advantages of each option. The goal of this investigation is to provide an overview of
management strategies and treatment options, highlighting the most recent advances and
elucidating costs and common problems in application.

FINAL REPORT June, 2011Non-Treatment Options for Nitrate Contaminated Potable Water Page 3
Copyright © 2011 American Water Works Association. All Rights Reserved.
2.0 Non-Treatment Options for Nitrate Contaminated Potable Water
2.1 Well Abandonment
With adequate capacity from other sources, the simplest option for management of nitrate
contaminated potable water sources is well abandonment. However, the lack of sufficient
alternative water supplies often rules out well abandonment as an option. Based on a recent
survey conducted by the American Water Works Association (AWWA), 30.4% (17/56) of survey
participants with wells impacted by nitrate selected well abandonment as the implemented
option for addressing nitrate contamination (Weir & Roberson, 2010, Weir and Roberson,
2011). It is important to determine the local requirements for safely removing a well from
service. For proper abandonment, local requirements can include covering, sealing and
plugging of the well to prevent contamination and to avoid hazardous conditions. Inactivation
or abandonment of a well differs from well destruction. Through inactivation or temporary
abandonment, the well can be brought back online in the future (e.g., when treatment is
installed). In contrast, well destruction involves the filling of a well, making it no longer viable.
2.2 Wellhead Protection and Land Use Management
While limiting current nitrate contamination of groundwater will not immediately remove the
need for treatment, over time, load reduction will minimize source water nitrate levels.
Agricultural practices, management of dairies, control of wastewater treatment plant
discharge, and monitoring and remediation of septic tanks can be improved to minimize
nitrogen loading. For example, a project addressing well head protection and land use
management performed by the University of Waterloo (Rudolph, 2010) successfully decreased
groundwater nitrate levels within a two year travel time from 17 to 7 mg/L total stored
nitrogen. Reduced nitrogen loading was accomplished by purchasing agricultural land and
implementing Best Management Practices (BMPs).

FINAL REPORT June, 2011Non-Treatment Options for Nitrate Contaminated Potable Water Page 4
Copyright © 2011 American Water Works Association. All Rights Reserved.
2.3 Development of Alternative Sources and Source Modification
With adequate information about the nitrate distribution and movement in the subsurface, a
new well can potentially be developed to access higher quality source water. Due to the
anthropogenic nature of the contamination, nitrate concentration typically decreases with
depth (WA DOH, 2005). If suitable water quality exists, drilling a deeper well can remove the
need for nitrate treatment. However, the quality improvements must be balanced by a
potential decrease in source capacity. Due to drilling and pumping requirements, capital and
operational costs increase with the depth to uncontaminated water. When considering the
installation of a deeper well to avoid nitrate contamination, it is important to be aware of the
risk of encountering other water quality concerns at greater depths (e.g., arsenic).
Connecting to a nearby water system that is not impacted by nitrate or to a larger system that
can afford nitrate treatment is often the best option for smaller systems. For example, since
1995, the City of Modesto, CA has been in charge of providing compliant water to the residents
of Grayson; an ion exchange plant is used for nitrate removal (Scott, 2010). Similarly,
consolidation of multiple small systems can decrease the cost of treatment per customer to
more reasonable levels. Additional alternative source options include trucking in potable
water, purchasing water rights, and temporarily relying on bottled water.
Figure 2-1 Selective Well Screening Using a Packer/Plug.
Modification of impacted source wells can allow for withdrawal
of water with lower nitrate levels by limiting screened intervals
to regions of better water quality. Down hole remediation
requires characterization of the water quality profile to
determine the screening depth range of the higher water
quality. Specialized monitoring equipment and techniques are
available that can be used without removing pumps (BESST Inc.,
2008). With water profile characterization, existing wells can be
selectively screened using a packer/plug to limit withdrawal
from unwanted regions (Figure 2-1 ).

FINAL REPORT June, 2011Non-Treatment Options for Nitrate Contaminated Potable Water Page 5
Copyright © 2011 American Water Works Association. All Rights Reserved.
The City of Ceres, CA is in the process of drilling new wells in part to avoid the need for nitrate
treatment; well modification has also been implemented to avoid water with high nitrate levels
(Cannella, 2009).
2.4 Blending
The dilution of a nitrate impacted source with an alternate low nitrate source can be a cost
effective option to produce compliant water; this is known as blending and can be applied
independently or with treatment. Blending is a common practice for the production of
compliant water, but relies on the availability of a low nitrate source and the consistency of
nitrate levels to avoid exceedances. One drawback of adding blending to address nitrate
contamination is the loss of operational flexibility. If the source used for dilution were
compromised, then production would need to be stopped from both wells. Water can also be
trucked in for blending purposes when a low nitrate source is unavailable locally. Based on the
recent AWWA survey, 51.8% (29/56) of respondents with nitrate impacted sources selected
blending as the option to address nitrate contamination (Weir & Roberson, 2010, Weir and
Roberson, 2011). In Germany, “most water utilities…affected by high nitrate concentrations do
blending of high-nitrate and low-nitrate wells…to avoid treatment costs” (Dördelmann, 2009).
When feasible, blending is a simple alternative to treatment that avoids disposal concerns and
the certification requirements of treatment (WA DOH, 2005). However, disadvantages include
the capital investment for accessing an alternative source and monitoring requirements to
ensure consistent supply of compliant water (WA DOH, 2005).

FINAL REPORT June, 2011Treatment Options for Nitrate Contaminated Potable Water Page 6
Copyright © 2011 American Water Works Association. All Rights Reserved.
3.0 Treatment Options for Nitrate Contaminated PotableWater
IX, RO and ED/EDR transfer nitrate ions from water to a concentrated waste stream that requires
disposal. The United States Environmental Protection Agency (USEPA) lists these three
processes as accepted potable water treatment methods for nitrate removal (USEPA, 2010). In
contrast, through biological and chemical denitrification, nitrate is converted to reduced nitrogen
species, rather than simply displaced to a concentrated waste stream that requires disposal.
A survey of nitrate treatment systems was conducted to assess the current state of nitrate
treatment. The list of surveyed utilities was developed with the intention of covering a range of
utilities with respect to geographic location, treatment type, population size and residual handling
techniques (Table 3-1). Detailed case studies have been compiled for each of the treatment
technologies where full-scale facilities have been in operation or are moving ahead with design.
A brief comparison of fundamental design considerations, advantages and disadvantages of the
treatment options examined herein is listed in Table 3-2. It is important to note that the
contents of Table 3-2 are not intended to provide a comprehensive set of criteria for treatment
options. Other important criteria in determining the best treatment option, which are site
specific and cannot be broadly generalized, include capital and O&M costs, system size
(capacity), and system footprint.
IX is the most commonly used nitrate treatment method, with full-scale systems in use
throughout the United States. Full-scale application of biological denitrification in potable
water treatment is mainly limited to Europe and chemical denitrification methods have been
investigated only at the pilot-scale. Others have provided thorough reviews of available nitrate
treatment technologies (Kapoor & Viraraghavan, 1997; Soares, 2000; Shrimali & Singh, 2001);
however, a recent comprehensive review of the state of nitrate treatment is absent from the
literature.

FINAL REPORT June, 2011Treatment Options for Nitrate Contaminated Potable Water Page 7
Copyright © 2011 American Water Works Association. All Rights Reserved.
Table 3-1 Utilities Included in the Case Studies.
Case # Treatment Type Location Capacity (gpm)Avg. Influent Nitrate
(mg/L as N)
Ion Exchange
1 Conventional ion exchange with blending California 400 7-12
2 Conventional ion exchange with blending California 400 ~10
3 Counter Current Ion Exchange (MIEX®) Indian Hills, CO 50 12-16
4 Multiple vessel ion exchange California 500-900 8-20
5 Multiple vessel ion exchange Chino, CA 5000 9-45
Reverse Osmosis
6 Reverse osmosis and blending Bakersfield, CA 120 17-19
7 Reverse osmosis, exploring biological reduction Brighton, CO 4600 11-20
8 Reverse osmosis and blending Arlington Desalter, Riverside, CA 4583 10-20
Combined Reverse Osmosis and Ion Exchange
9 Reverse osmosis, ion exchange and blending Chino Desalter I, Chino, CA 4940 (RO), 3400 (IX) 32-65
10 Reverse osmosis, ion exchange and blending Chino Desalter II, Mira Loma, CA 4167 (RO), 2778 (IX) 15-48
Electrodialysis (ED/EDR/SED)
11 Electrodialysis Reversal (EDR) Spain 3,260 (each, 2 systems) 18
12 Selective Electrodialysis (SED) - Nitron Israel 310 19-20
Biological Denitrification
13 Implementing fluidized bed biological reduction Rialto, CA 2000-4000 17-19
14 Implementing fixed bed biological reduction Riverside, CA 1670 10-20

FINAL REPORT June, 2011Treatment Options for Nitrate Contaminated Potable Water Page 8
Copyright © 2011 American Water Works Association. All Rights Reserved.
Table 3-2 Potable Water Treatment Options for Nitrate Management (adapted from WA DOH, 2005).
Ion Exchange Reverse Osmosis Electrodialysis Biological Denitrification Chemical DenitrificationFull Scale Systems Yes Yes Yes Yes No
Treatment Type Removal to waste stream Removal to waste stream Removal to waste stream Biological reduction Chemical reduction
Common Water Quality Design Considerations
Sulfate, iron, manganese, total suspended solids (TSS), metals (e.g., arsenic), hardness, organic
matter
Turbidity, iron, manganese,SDI, particle size, TSS,
hardness, organic matter, metals (e.g., arsenic)
Turbidity, iron, manganese, TSS, hydrogen sulfide, hardness, metals (e.g.,
arsenic)
Temperature and pH, anoxic conditions
Temperature and pH
Pretreatment Needs Pre-filter, address hardness Pre-filter, address hardness Pre-filter, address hardness pH adjustment, nutrient and substrate addition, need for
anoxic conditions
pH adjustment
Post-treatment Needs pH adjustment pH adjustmentRemineralization
pH adjustmentRemineralization
Filtration, disinfection, possible substrate adsorption
pH adjustment, iron removal, potential ammonia control
Waste/Residuals Management
Waste brine Concentrate Concentrate Sludge/biosolids Waste media, Iron sludge
Start-up Time Minutes Minutes Minutes Initial plant startup:Days to weeks
After reaching steady state: Minutes
Minutes
Water Recovery Conventional (97%)Low brine (Up to 99.9%)
Up to 85% Up to 95% Nearly 100% Not demonstrated full scale
Advantages Nitrate selective resins,common application,
multiple contaminant removal
Multiple contaminant removal, desalination (TDS
removal)
Multiple contaminant removal, higher water
recovery(less waste), desalination,
unaffected by silica
No waste brine or concentrate, nitrate reduction rather than
transfer to a waste stream, high water recovery, and potential
for multiple contaminant removal
No waste brine or concentrate, nitrate reduction rather than
transfer to a waste stream, and potential for multiple contaminant removal
Disadvantages Potential for nitrate peaking, high chemical use (salt), brine waste disposal, potential for
disinfection byproduct (DBP) formation (e.g., NDMA)
Membrane fouling and scaling, lower water recovery,
operational complexity, energy demands, waste
disposal
Energy demands, operational complexity, waste disposal
Substrate addition, potentially more complex, high monitoring
needs, possible sensitivity to environmental conditions, risk of nitrite formation (potential incomplete denitrification), post-treatment to address
turbidity standards and 4-log virus removal (state dependent)
Inconsistency of nitrate reduction, risk of nitrite
formation (potential incomplete denitrification),
reduction to ammonia, lack of full scale systems, pH and temperature dependence,
possible need for iron removal

FINAL REPORT June, 2011Ion Exchange (IX) Page 9
Copyright © 2011 American Water Works Association. All Rights Reserved.
3.1 Ion Exchange (IX)
As the most commonly used method for the removal of nitrate in potable water treatment, IX
has been widely researched, with numerous full-scale installations in operation. With the
potential for multiple contaminant removal, IX can also be used to address other water quality
concerns including arsenic, perchlorate, selenium, chromium (total and chromium-6), and
uranium (AWWA, 1990 and Boodoo, 2004). Selected IX installations used for nitrate treatment
in the United States are listed in Table 3-3.
Table 3-3 Selection of Full Scale Ion Exchange Installations for Nitrate Removal.
Locations Year Installed
Influent nitrate (mg/L as N)
Capacity(MGD)
Reference
Ellsworth, MN 1994 - 0.047 MN Dept. of Ag. (N.D.)
Clear Lake, MN 1995 - 0.047 MN Dept. of Ag. (N.D.)Adrian, MN 1998 - 0.129 MN Dept. of Ag. (N.D.)
Edgerton, MN 2002 - 0.137 MN Dept. of Ag. (N.D.)
McCook, NE 2006 Up to 28.27 6.8 Contaminant Removal News (2007)
McFarland, CA, Well 2
1983 12.92 1 Guter (1995), See also Guter (1982)
McFarland, CA, Well 4
1987 13.78 1 Guter (1995), See also Guter (1982)
La Crescenta, CA 1987 15.08-21.54 2.7 Guter (1995)
Grover City, CA, 3 wells
- 17.23-28 2.3 Guter (1995)
Des Moines, IA 1992 Up to 11.85 10 Des Moines Water Works, Rash (1992)
Glendale, AZ: full scale pilot
2010 Up to 40 10 Meyer et al. (2010), See also Clifford et al. (1987)
Indian Hills, CO 2009 10-16 0.072 (design)
See Case Study.
Due to its common application, the investigation of IX for the removal of nitrate is prevalent in
the literature (Yoon et al., 2001; Chabani et al., 2006; Samatya et al., 2006; Clifford, 2007;
Meyer et al., 2010; Clifford et al., 2010). Kapoor & Viraraghavan (1997) provide an extensive
review of IX research up to 1997. Modifications of conventional IX have led to the emergence
of more efficient IX processes including multiple vessel configurations, counter current
configurations, the use of specialized resins, improved hydraulics, and weak base anion
exchange (WBA IX).

FINAL REPORT June, 2011Ion Exchange (IX) Page 10
Copyright © 2011 American Water Works Association. All Rights Reserved.
3.1.1 Conventional Ion Exchange
Conventional IX utilizes a strong base anion exchange resin. In accordance with Figure 3-1, raw
water passes through pretreatment to remove suspended solids and to address other
constituents capable of fouling the resin. The nitrate laden treatment stream then enters the
ion exchange vessel. Upon contacting the resin, nitrate displaces chloride at surface sites,
removing nitrate from the water.
Figure 3-1Conventional Ion Exchange Schematic.
This technique is similar to a water softener, which replaces the divalent cations of hard water
(Mg2+ and Ca2+) with a monovalent cation (Na+). Eqn. 1 depicts the transfer of ions, with R as
the resin surface site.
R-Cl + NO3- R-NO3 + Cl- (Eqn. 1)
To prevent nitrate breakthrough, regeneration is necessary when the resin is exhausted of
chloride ions (chloride has been displaced at the majority of surface sites). The media is
backwashed with a high salt solution (0.5 – 3 M, Clifford, 2007) to reverse the process, resulting

FINAL REPORT June, 2011Ion Exchange (IX) Page 11
Copyright © 2011 American Water Works Association. All Rights Reserved.
in a brine waste stream high in nitrate and other concentrated ions (Eqn. 2). Leaving nitrate
behind, treated water exits the ion exchange vessel and passes on to post-treatment for
stabilization and disinfection.
R-NO3 + Cl- R-Cl + NO3- (Eqn. 2)
The relative affinity of common anions for conventional anion exchange resin is SO42- > NO3
- >
Cl- > HCO3- (Bae et al., 2002 and Clifford et al., 2010). If generic resins are not regenerated soon
enough, sulfate displacement of nitrate in the resin can lead to nitrate release from the resin to
the treatment stream (Eqn. 3). This is known as nitrate dumping, nitrate peaking and
chromatographic peaking and is further discussed below.
2R- NO3 + SO4-2 R2-SO4 + 2NO3
- (Eqn. 3)
Due to the stronger affinity of the sulfate ion for generic anion exchange resins, nitrate
selective resins have been developed for which the order of affinity is NO3- > SO4
2- > Cl- > HCO3-
(Guter, 1982 and Guter, 1995). Important factors in resin selection are the exchange capacity1
and selectivity coefficient2 of the resin and the rate of ion transfer (kinetics3).
Detailed case studies of conventional IX plants are included in section 3.1.7.
3.1.2 Ion Exchange - Design Considerations
Various tools are available to assist with IX system design including Dow’s CADIX (Computer
Assisted Design for Ion Exchange) (Dow, 2010b) and Lenntech’s Ion Exchange calculator
(Lenntech, 2009b.) Table 3-4, summarizes key design considerations in the application of
conventional IX to nitrate removal from potable water.
1
Exchange capacity: The exchange capacity is a measure of how many ions the resin can capture per unit volume.2 Selectivity coefficient: The selectivity coefficient of a resin refers to the relative affinity of resin surface sites for a particular ion, in this case nitrate.3 Kinetics: The term kinetics refers to the rate of a reaction. The rate that nitrate displaces chloride on the resin is important for efficient treatment and can be affected by competing ions.

FINAL REPORT June, 2011Ion Exchange (IX) Page 12
Copyright © 2011 American Water Works Association. All Rights Reserved.
Table 3-4 Summary of Design Considerations for Conventional IX.
Resin Selection Generic SBA resins for maximum exchange capacity (for low sulfate)o Less expensive than nitrate selective resinso Less frequent regeneration due to higher capacity (in the absence of co-
contaminants)o Nitrate dumping potential
Nitrate selective resins to avoid nitrate dumping (for high sulfate)o More expensive than generic resinso Longer bed lifeo More nitrate removed per unit of waste brine
Pretreatment Filtration to remove iron, manganese, TSS and organic matter to prevent resin fouling Water softening (anti-scalant, acid or water softener) to prevent scaling Dechlorination to prevent resin oxidation
4
Post-Treatment Chloride:alkalinity ratio and dezincification5
Chloride:sulfate ratio and galvanic corrosion6
Potential pH adjustment and restoration of buffering capacity to avoid corrosionChemical Usage pH adjustment (caustic soda or soda ash)
Regenerant brine, salt consumptionO&M Frequency of regeneration depends on water quality and resin type
Fresh brine preparation and waste disposal Resin loss and replacement: 3-8 year lifetime (WA DOH, 2005 and Dow, 2010c) Continuous or frequent monitoring of nitrate levels Backwashing to dislodge solids
System Components
Fixed bed versus Continuous regeneration Key system configuration parameters are system flow rate, bed swelling, bed depth,
backwash flow rate, and rinse requirementso Vessels in parallel or in-serieso Co-current or counter-current regeneration
Waste Management and Disposal
Significant cost of waste brine disposal is of greatest concern for inland systems Close proximity to coastal waters is beneficial for brine disposal Management options can include sewer or septic system, drying beds, trucking off-
site, coastal pipeline, deep well injection and advanced treatment Disposal options can be limited by waste brine water quality (e.g., volume, salinity,
metals and radionuclides) Optimization of recycling and treatment of waste brine is desirable
Limitations Need to manage resin foulingo Hardness, iron, manganese, suspended solids, organic matter, and chlorine
Competing ions (especially sulfate) Disposal of waste brine Possible role of resin residuals in DBP formation
4
The resin can be degraded by oxidation; the functional amine groups on the resin surface are susceptible to oxidation which can lead to diminished capacity (Dow, 2010d).5 As nitrate and other anions displace chloride on the resin, chloride is released to the product water, leading to the potential for taste issues and dezincification (Kapoor & Viraraghavan, 1997). Dezincification refers to the ability of product water to dissolve zinc from brass and is dependent on the ratio of chloride to alkalinity (> 0.5 can be problematic). By restoring alkalinity, the dezincification potential can be minimized.6 Galvanic corrosion can result in the release of lead from brass and galvanized solder-copper connections and is associated with a high ratio of chloride to sulfate (> 0.58 can be problematic) (Edwards & Triantafyllidou, 2007 and Edwards et al., 1999).

FINAL REPORT June, 2011Ion Exchange (IX) Page 13
Copyright © 2011 American Water Works Association. All Rights Reserved.
3.1.2.1 Water Quality
Raw water quality is a key factor in the efficiency of an IX system, impacting resin selection,
pretreatment and post-treatment needs, regeneration efficiency, chemical usage, and waste
disposal. Important water quality parameters include the presence of competing ions
(predominantly sulfate), alkalinity, hardness, iron, and manganese.
Selection of the appropriate resin for a given system depends directly on source water quality. In
the presence of high levels of co-contaminants, nitrate selective resins may be necessary rather
than generic resins. Both strong base anion resin (SBA) and weak base anion resin (WBA) can
be suitable for nitrate removal from potable water. The latter will be addressed separately. The
two standard types of SBA resins deviate in their functional groups. Anion exchange is
dependent on the trimethylamine groups of the SBA Type I resin and the dimethylethanolamine
groups of the SBA Type II resin (Helfferich, 1995).
Nitrate selective resin was invented in the early 1980’s by Gerald Guter (Guter, 1982, see related
patent: Guter, 1983). Clifford & Weber (1978 and 1983) contributed to the development and
characterization of these resins with their research on resin selectivity (Clifford et al., 2010).
Nitrate selective resins rely on different functional groups than Type I and Type II SBA resins.
Nitrate selectivity is attributed to the increased hydrophobicity and site spacing of exchange sites
due to the triethyl, tripropyl and tributyl functional groups of nitrate selective resin (Clifford &
Weber, 1978; Guter, 1982; and Clifford et al., 2010). The use of nitrate selective resin avoids the
problem of nitrate peaking (i.e., nitrate dumping or chromatographic peaking), typically caused
by the greater affinity of generic resins for sulfate.
It is important to note the distinction between nitrate peaking and nitrate breakthrough. As
nitrate displaces chloride on the resin, the nitrate capacity of the resin is gradually exhausted
leading to increasing effluent nitrate levels until influent levels are reached. This is known as
breakthrough and can occur regardless of resin type. Nitrate peaking can also occur upon
exhaustion of the resin capacity for nitrate. However, with nitrate peaking, the nitrate on the
resin is displaced by sulfate, thereby increasing the effluent nitrate concentration to levels above
that of the raw water (Clifford et al., 2010). The peak in nitrate concentration is due to the
combination of the influent nitrate ions and the nitrate ions that are coming off of the resin via
sulfate displacement.
FINAL REPORT June, 2011Ion Exchange (IX) Page 14
Copyright © 2011 American Water Works Association. All Rights Reserved.
Under low sulfate conditions, the use of generic SBA resins is preferred, due to their larger
exchange capacity. As the ratio of sulfate to nitrate increases, the use of nitrate selective resins
avoids possible nitrate peaking, minimizing the risk of MCL exceedance and the need for more
frequent regeneration. However, with the highest nitrate selectivity, regeneration efficiency
can decrease, increasing chemical use. With a stronger affinity for nitrate, the removal of
nitrate from the resin in regeneration is more difficult because nitrate is more strongly bound
(Dow, 2010c). Nitrate selective resins are more costly than the generic option (Water Quality
Products, 2003), but under appropriate conditions the use of regenerant can be minimized and
bed life can be increased significantly with their use. Different system configurations have been
implemented as an alternative to the use of nitrate selective resins to address the problem of
co-contaminants and the risk of nitrate peaking (Clifford, 2010). (See System Layout and Site
Considerations.) In the consideration of IX for multiple contaminant removal, the selection of
the most appropriate resin depends in part on the type and concentration of co-contaminants.
Modeling and column or pilot testing is important to determine appropriate design parameters
and to design treatment based on a full life cycle analysis of costs.
Upstream of the IX vessels, pretreatment of source water may be necessary to avoid resin
fouling (WA DOH, 2005 and Water Quality Products, 2003). Potential constituents of concern
include organic matter, turbidity, total suspended solids (TSS), sand and metals, primarily iron
and manganese (WA DOH, 2005; Water Quality Products, 2003; and Kapoor & Viraraghavan,
1997). Pre-filtration is typically used to remove these constituents; however, additional
pretreatment methods may be used. For example, coagulation/flocculation and filtration may
be necessary for surface waters. “If the combination of iron, manganese, and other metals
exceeds 0.1 mg/L, pretreatment will likely be required (Health Education Services, 1997)” (WA
DOH, 2005). Hard, alkaline water can lead to resin scaling due to calcium and magnesium
accumulation; pH adjustment or water softening can be used to prevent resin scaling (Water
Quality Products, 2003). Created by Wolfgang Holl, the carbon dioxide regeneration of ion
exchange (CARIX) process combines anion and cation exchange (Holl, 1995). The CARIX process
enables simultaneous removal of cations (for hardness reduction) and anions through the
combination of a weak acid cation exchanger and a strong base anion exchanger.

FINAL REPORT June, 2011Ion Exchange (IX) Page 15
Copyright © 2011 American Water Works Association. All Rights Reserved.
Resin exposure to disinfectants (chlorine and chloramines) should be avoided to prevent resin
oxidation and the possible release of disinfection by-products, specifically nitrosamines
(Kemper et al., 2009). Disinfection byproducts (DBPs) are potentially cancer-causing
compounds that can be formed through a reaction of disinfection chemicals like chlorine and
chloramines with organic matter. Due to the amine functional groups of anion exchange resins,
“these resins may serve as precursors for nitrogenous disinfection by-products, such as
nitrosamines, nitramines, and halonitromethanes” (Kemper et al., 2009). Recent research
suggests that the risk of DBP formation is higher with the use of new resin; however, precursors
can be a problem with downstream chloramine use or with upstream disinfection (See Kemper
et al., 2009 in Table A.1 of the Appendix). Magnetic ion exchange resin is an exception as its
primary purpose is to remove organic carbon and limit DBP formation (Boyer & Singer, 2006)
(See the MIEX® process in section 3.1.6.1).
IX can reduce alkalinity due to removal of bicarbonate. To prevent corrosion in downstream
pipes, the product water pH and buffering capacity may need to be increased7. Soda ash can be
added to the regenerant brine to load a portion of the resin sites with bicarbonate rather than
chloride. This can restore some alkalinity to the water as bicarbonate is released from the resin
when displaced by nitrate and other anions in the treatment stream (Water Quality Products,
2003). To minimize the need for caustic addition in post-treatment, an upstream atmospheric
degasifier for carbon dioxide removal can be added during pretreatment (Dow, 2010).
As nitrate and other anions displace chloride on the resin, chloride is released to the product
water, leading to the potential for taste issues, dezincification, and galvanic corrosion.
Dezincification refers to the ability of product water to dissolve zinc from brass and is
dependent on the ratio of chloride to alkalinity (> 0.5 can be problematic, according to Kapoor
& Viraraghavan (1997)). By restoring alkalinity, the dezincification potential can be minimized.
Galvanic corrosion can result in the release of lead from brass and galvanized solder-copper
7 It is important to note the relationship between alkalinity and pH. Alkalinity is a measure of buffering capacity or the resistance to changes in pH. Demineralized water or water with a low buffering capacity will be susceptible to more dramatic pH changes and is considered unstable. The pH of acidic product water should be adjusted and the buffering capacity of demineralized product water should be restored to avoid corrosion downstream and the potential for lead and copper challenges.

FINAL REPORT June, 2011Ion Exchange (IX) Page 16
Copyright © 2011 American Water Works Association. All Rights Reserved.
connections and is associated with a high ratio of chloride to sulfate (> 0.58 can be problematic)
(Edwards & Triantafyllidou, 2007 and Edwards et al., 1999). It is important to consider the
potential downstream impact of subtle water quality changes caused by treatment.
3.1.2.2 System Layout and Site Considerations
The IX system can be operated using a fixed bed or as a continuous system. Details of
modifications to conventional fixed bed systems are provided below. Key parameters in vessel
sizing and system configuration are system flow rate, bed swelling, bed depth, backwash flow
rate, and rinse requirements (Dow, 2010). Regeneration can be designed in a co-current or
counter-current configuration. Vessels can be operated in parallel or in-series for redundancy,
to maximize removal efficiency per regeneration cycle, to address nitrate peaking and to
consistently produce water with limited variation in water quality parameters (Clifford et al.,
2010).
3.1.2.3 Residuals Management and Disposal
Management of waste brine can be costly. Options include discharge to a sewer or septic
system, waste volume reduction using drying beds, trucking to an off-site approved disposal
location, ocean discharge through a coastal pipeline, deep well injection, and advanced
treatment. Water quality characteristics of the waste brine (e.g., volume, salinity, metals and
radionuclides) can affect the feasibility and costs of disposal options. Proximity and access to
coastal waters can be a significant factor in determining the burden of brine disposal.
Generally, disposal is of greatest concern to inland communities. Although other removal
technologies (RO and ED) require concentrate disposal, because IX requires the addition of salt
for resin regeneration, the waste stream consists of not only the nitrate and other ions that
have been removed from the water, but also the spent brine solution used in regeneration.
The high cost of nitrate laden brine disposal has led to research into optimization of recycling
and treatment of this waste stream. Partial regeneration and reuse of treated brine for
multiple regeneration cycles can minimize the volume of waste while maximizing regeneration
efficiency (Clifford, 2007 and Clifford et al., 2010). Application of IX systems coupled with
biological, chemical, or catalytic denitrification enables removal of nitrate from waste brine,

FINAL REPORT June, 2011Ion Exchange (IX) Page 17
Copyright © 2011 American Water Works Association. All Rights Reserved.
with reduction to nitrogen gas. The electrochemical destruction of nitrate in waste brine is also
being explored. Several combined configurations of interest are discussed below in a section
devoted to Brine Treatment Alternatives and Hybrid Treatment Systems.
3.1.2.4 Maintenance, Monitoring and Operational Complexity
Regeneration frequency will depend on pretreatment measures, water quality and the type of
resin used (WA DOH, 2005). The typical amount of brine waste compared to water produced
can range from ~3.0% for conventional systems (Clifford, 2007) to ~0.5% for low brine systems
(Calgon Carbon Corporation, 2007, discussed below). A constant supply of brine must be
available for resin regeneration and waste brine requires appropriate storage and disposal.
Resin loss can be controlled by adjusting the backwash flow rate and adding screens (Keller,
2000). Resin life will also depend on water quality and pretreatment measures; resin
replacement may be required after 3-8 years (WA DOH, 2005 and Dow, 2010c). To ensure the
production of compliant water, continuous or frequent monitoring of nitrate levels is necessary.
In addition to resin regeneration, backwashing is used to dislodge solids and “resin fines” (Dow,
2010). In comparison with alternative treatment options, IX requires limited O&M with high
feasibility of automation and low operational complexity.
3.1.3 Ion Exchange - Cost Considerations
For optimal operation of an IX system, the fundamental objective is to maximize regeneration
efficiency, while meeting necessary potable water guidelines. Factors affecting system cost
include facility size (flow rate), source water quality (including nitrate concentration),
environmental factors (temperature), and target effluent nitrate concentration. Disposal of
waste brine is commonly a significant portion of O&M costs.
Capital costs for IX include land, housing, piping, storage tanks, O&M equipment, vessels, resin,
preliminary testing (pilot studies), permits, and training. O&M costs include resin replacement
(due to loss or degradation), resin disposal, brine disposal or treatment, chemical use (salt, anti-
scalant, pH adjustment), repair and maintenance, power and labor.
Published cost information from existing IX installations is listed in Table 3-5. Costs have been
adjusted to 2010 dollars, unless indicated otherwise. Costs can be difficult to assess due to

FINAL REPORT June, 2011Ion Exchange (IX) Page 18
Copyright © 2011 American Water Works Association. All Rights Reserved.
inconsistencies in how cost information is reported. Comparison of IX costs is not always valid
due to differences in influent water quality parameters, system size, waste management
options, and system configuration. Published costs do not always include comparable
information. It would be inappropriate to compare the O&M costs of a facility that excludes
disposal costs with others that include this information. The listed cost information is provided
as an approximate range of costs for specific facilities. Costs for implementing IX may be very
different from those listed here. A thorough cost analysis of design parameters for specific
locations would be required for accurate cost estimation. The information gathered through
the questionnaire includes detailed costs associated with the unique case studies included in
this analysis.
Table 3-5 Selected Published Costs* of Ion Exchange Systems for Nitrate Removal.
System Flow** < 0.5 MGD 0.5 – 5 MGD 5+ MGD
Annualized Capital Cost ($/1000 gal) 0.37 – 1.21 [1] 0.28 – 0.94 [2, 3] 0.28 – 0.61 [3, 4, 5]
O&M Cost ($/1000 gal) 0.60 – 4.65 [1] 0.46 – 1.25 [2, 3] 0.37 – 0.87 [3, 4, 5]
Total Annualized Cost ($/1000 gal) 0.97 – 5.71 [1] 0.74 – 2.19 [2, 3] 0.65 – 1.44 [3, 4, 5]
*Costs have been adjusted to 2010 dollars with 7% interest over 20 years, unless indicated otherwise (below). **When available, costs are based on actual system flow rather than design capacity.[1] Minnesota Department of Agriculture (N.D.), not adjusted to 2010 dollars, 20 year amortization without interest. [2] Guter (1995). [3] Conlon et al. (1995). [4] Meyer et al. (2010). [5] Drewry (2010).
3.1.4 Ion Exchange - Selected Research
A large body of research has focused on IX. Table A.1 of the Appendix is a list of recent studies
relevant to nitrate removal from potable water. Given the many years of successful full scale
operating experience with IX, current applied research is focused on brine recycling efficiency,
the optimization of waste management, and improvements in resin capacity and selectivity, to
improve efficiency and reduce costs.
3.1.5 Ion Exchange - Summary of Advantages and Disadvantages
A summary of advantages and disadvantages of IX in comparison with other treatment options
is listed in Table A.6 of the Appendix. Significant advantages of IX include years of industry
experience, multiple contaminant removal, selective nitrate removal, financial feasibility, use in
small and large systems, and the ability to automate. Disadvantages include the costly disposal

FINAL REPORT June, 2011Ion Exchange (IX) Page 19
Copyright © 2011 American Water Works Association. All Rights Reserved.
of waste brine, the potential for nitrate dumping and resin fouling, the possible need for pH
adjustment, the potential for hazardous waste generation (i.e. brine with traces of co-
contaminants like arsenic and chromium), and the possible role of resin residuals in DBP
formation (Kemper et al., 2009).
3.1.6 Modifications to Conventional Ion Exchange
Modifications of conventional IX have led to the emergence of low-brine IX processes including
magnetic ion exchange (MIEX®), ion exchange separation (ISEP®), Envirogen (formerly Basin
Water) systems, and weak base ion exchange (WBA IX). Despite their potential advantages, it is
important to note that proprietary technologies may have inherent disadvantages, such as a
lack of flexibility to use better technology when it becomes available, vulnerability if the
manufacturer goes out of business or discontinues supporting the product, and a lack of
competition to keep O&M costs down.
3.1.6.1 Counter Current Flow with Specialized Resin
Magnetic ion exchange technology (MIEX®), developed by Orica Watercare, offers a low brine
alternative to conventional IX, using a unique SBA Type I resin. The MIEX® process (Figure 3-2)
differs from conventional IX in that the resin is fluidized in a contactor with spent resin removed
from the contactor for regeneration outside of the process water stream and then returned to
the contactor. This is in contrast to conventional IX, where the resin is stationary. Unlike
conventional IX, the MIEX® fluidized bed process is tolerant of suspended solids and low levels
of oxidants.

FINAL REPORT June, 2011Ion Exchange (IX) Page 20
Copyright © 2011 American Water Works Association. All Rights Reserved.
Figure 3-2Process Flow Diagram for Counter Current MIEX® Process (Orica Watercare, N.D.b).
The minimization of waste brine is accomplished through frequent batch regeneration. The
magnetized resin encourages agglomeration of loaded resin particles, resulting in faster
settling. Loaded resin is removed from the bottom of the IX vessel and is passed to
regeneration, while regenerated resin is added at the top of the IX vessel. This configuration
removes the risk of nitrate peaking because clean resin, added at the end point of the system,
captures any displaced nitrate, while competing ions, such as sulfate can be removed early on
in the resin vessel. The MIEX® process has been proven to effectively address various water
quality concerns including nitrate, organic carbon, arsenic, chromium-6 and perchlorate (Boyer
& Singer, 2006; Humbert et al., 2005; and Seidel et al., 2004. See also Orica Watercare, N.D.).

FINAL REPORT June, 2011Ion Exchange (IX) Page 21
Copyright © 2011 American Water Works Association. All Rights Reserved.
A detailed case study of a MIEX® treatment plant in Indian Hills, CO is included in section 3.1.7.
3.1.6.2 Improved Hydraulics and Nitrate Selective Resins
The Layne Christensen Company and Rohm and Haas offer their Advanced Amberpack® system
which utilizes nitrate selective resins and their patented Fractal Distribution Technology to
increase the treated water volume and decrease the waste brine. Nitrate selective resins have
a greater affinity for nitrate than non-selective resins resulting in an improvement in removal
efficiency, especially in waters where the sulfate to nitrate ratio is greater than 1.
The distributor system is designed to provide uniform flow through the ion exchange vessels in
both treatment and regeneration modes. As a result of the uniform flow the exchange capacity
of the resin can be maximized while the brine and rinse values can be minimized, thus
increasing the water efficiency of the system (Rohm and Haas Company, 2007).
3.1.6.3 Multiple Vessel Carousel Configuration
Calgon Carbon’s Continuous Ion Exchange Separation System (ISEP® System) utilizes a carousel
configuration. This configuration has the potential to avoid downtime for regeneration,
minimize the amount of resin needed, and maximize regeneration efficiency. Illustrated in
Figure 3-3, multiple resin vessels are rotated from active treatment to resin regeneration and
rinsing and back to active treatment. The countercurrent system can provide consistent
product water, operating uninterrupted with up-flow regeneration and down-flow treatment.
The vessels (Table 3-3) rotate in the opposite direction of the water movement (Table 3-4).
This configuration results in five zones within the system (Calgon Carbon Corporation, 2004). In
“the adsorption wash zone” several vessels are washed in series with clean water. The effluent
is added to the treatment stream to avoid loss. In “the feed zone” the feed stream is passed
through two stages of 10 parallel vessels and product water is collected.
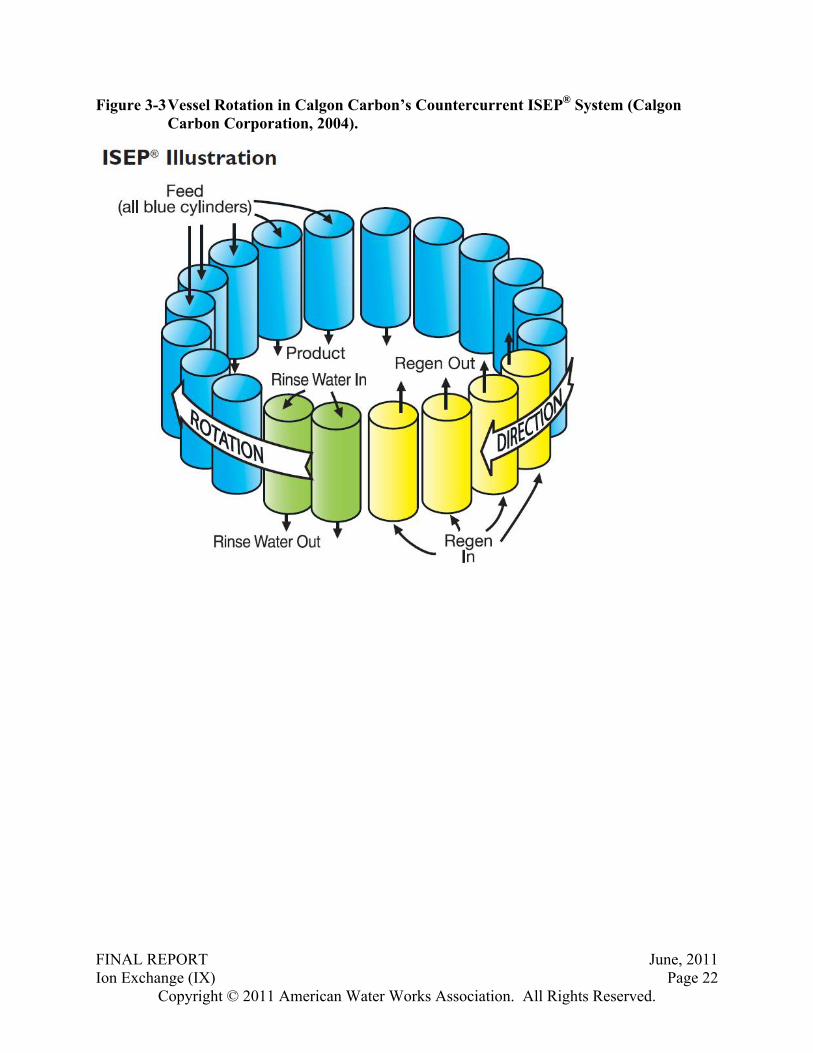
FINAL REPORT June, 2011Ion Exchange (IX) Page 22
Copyright © 2011 American Water Works Association. All Rights Reserved.
Figure 3-3Vessel Rotation in Calgon Carbon’s Countercurrent ISEP® System (Calgon Carbon Corporation, 2004).
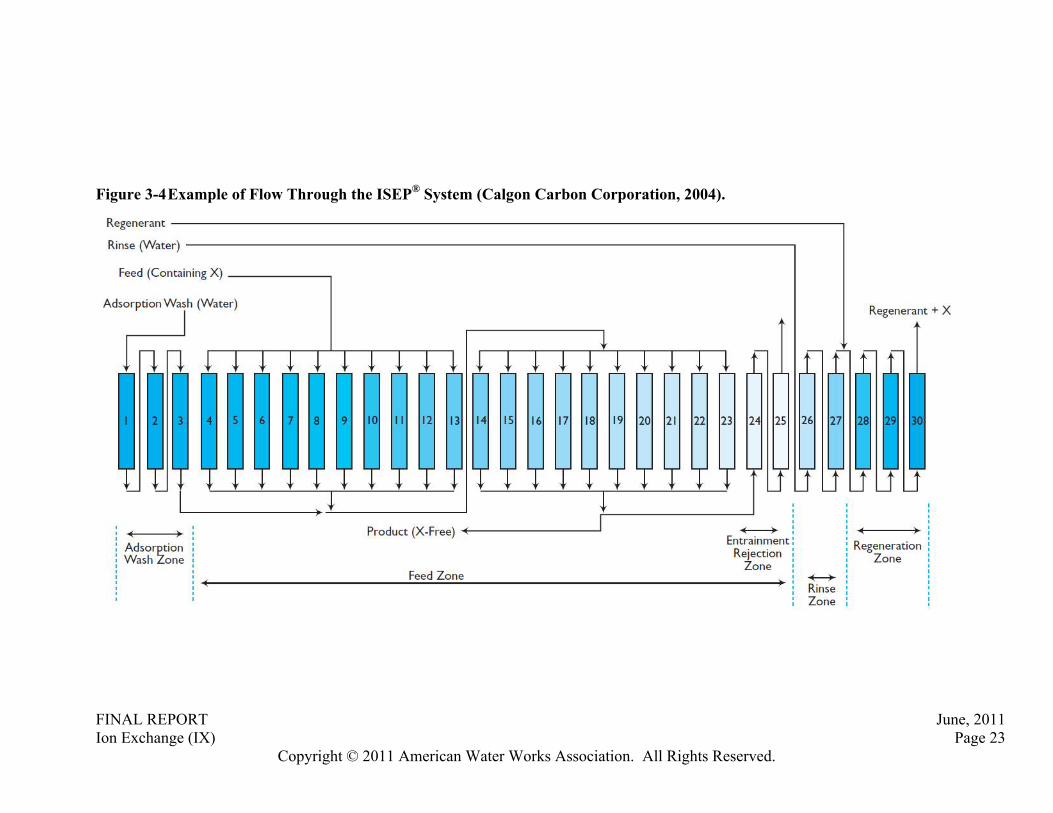
FINAL REPORT June, 2011Ion Exchange (IX) Page 23
Copyright © 2011 American Water Works Association. All Rights Reserved.
Figure 3-4Example of Flow Through the ISEP® System (Calgon Carbon Corporation, 2004).

FINAL REPORT June, 2011Ion Exchange (IX) Page 24
Copyright © 2011 American Water Works Association. All Rights Reserved.
In “the entrainment rejection zone” a portion of the product water is passed through two
vessels in series for reuse as rinse water. Regenerant brine is rinsed through two in series
vessels in “the rinse zone.” Lastly, regeneration occurs through three in series vessels with the
addition of regenerant brine in “the regeneration zone.”
A detailed case study of an ISEP® treatment plant in Chino, CA is included in section 3.1.7.
3.1.6.4 Multiple Vessel Staggered Configuration
Envirogen Technologies, Inc., formerly Basin Water, Inc., offers proprietary IX systems using
multiple beds operated in a staggered design (Figure 3-5). Such a configuration has the
potential to maximize resin capacity and minimize waste and chemical use.
Figure 3-5 Example of an Envirogen Multiple Bed Proprietary Anion Exchange System (Envirogen, N.D.a).
Envirogen’s low brine IX system has been successfully implemented for nitrate and uranium
removal in San Bernardino County, CA (Envirogen, 2010). Delivering 2 MGD with nitrate levels
reduced from 10.77-12.92 mg/L as N (50-60 mg/L as nitrate) to 7.54 mg/L as N (35 mg/L as

FINAL REPORT June, 2011Ion Exchange (IX) Page 25
Copyright © 2011 American Water Works Association. All Rights Reserved.
nitrate) and a system footprint of 50’ X 50’, the installation resulted in recovery of a well that
had been previously decommissioned. Envirogen is contracted to handle all operation and
maintenance, including waste disposal.
In Yucca Valley, CA, nitrate treatment was required due to over pumping and the resulting
intrusion of septic system contaminated waters. An Envirogen IX system was installed to
provide 2.8 MGD. With treatment, nitrate concentrations are decreased from 12.49 mg/L as N
(58 mg/L as nitrate) to 4.31 mg/L as N (20 mg/L as nitrate) with 50% blending and a 0.3% waste
rate (0.15% net) (Envirogen, N.D.b).
A detailed case study of an Evirogen low-brine IX treatment plant in California is included in section 3.1.7.
3.1.6.5 Weak Base Anion Exchange (WBA IX)
Weak base anion exchange (WBA IX), an emerging technology, can be an effective option for
nitrate removal from potable water. Highly pH dependent, nitrate removal using WBA IX is
governed by Eqn. 5 (Applied Research Associates, N.D.). While SBA IX resin can remove nitrate
by splitting nitrate salts, WBA IX resin removes strong acids (Remco Engineering). First, acid
addition protonates the WBA resin (Eqn. 4). Next, the positively charged resin sites remove
anions, like nitrate, from the treatment stream (Eqn. 5).
R-NH2 + H+ R-NH3+ (Eqn. 4)
R-NH3+ + NO3
- R-NH3-NO3 (Eqn. 5)
Resin regeneration occurs by neutralizing the resin, in accordance with Eqn. 6. Rather than the
high salt solution used to regenerate SBA resins, weak bases are used to neutralize the WBA
resin.
R-NH3-NO3 + Na+OH- R-NH2 + HOH + Na+NO3- (Eqn. 6)
As discussed in previous sections, the use of SBA IX resin results in a high-nitrate brine waste
stream. Due to the high salt content, the nitrate in the waste stream generally cannot be
beneficially reused. However, with the use of alternative weak bases for regeneration (Eqns. 7
and 8), the waste stream does not have a high salt content and can sometimes be recycled as
fertilizer (NH4NO3 and Ca(NO3)2) (Clifford, 2007).

FINAL REPORT June, 2011Ion Exchange (IX) Page 26
Copyright © 2011 American Water Works Association. All Rights Reserved.
R3N-HNO3 + NH4OH R3N-HOH + NH4NO3 (Eqn. 7)2 R3N-HNO3 + Ca(OH)2 2R3N-HOH + Ca(NO3)2 (Eqn. 8)
The use of WBA resins is more operationally complex than the use of SBA resins. Chemical use
includes acids and bases, the system is susceptible to corrosion and pH adjustments are more
significant. Adjustment of influent pH to between 3 and 6 is necessary, with subsequent
product water pH adjustment as well (Clifford, 2007). WBA resins can also be more sensitive to
temperature, with one resin having a maximum operating level of 95oC (Dow, 2010), but this
should not impact their use with municipal drinking water treatment. Regeneration of WBA
resin is more efficient than that of the SBA resin of conventional IX; regenerant waste volumes
are minimized and waste products can sometimes be recycled as fertilizer (Clifford, 2007 and
ARA & Purolite, N.D.a).
Weak Base Ion Exchange for Nitrate, or the “WIN” Process, was developed by Applied Research
Associates, Inc. (ARA) and The Purolite Company (ARA & Purolite, N.D.b) as a treatment option
that can be less costly and more efficient, with significantly lower waste volumes, than
conventional SBA IX (Figure 3-6).

FINAL REPORT June, 2011Ion Exchange (IX) Page 27
Copyright © 2011 American Water Works Association. All Rights Reserved.
Figure 3-6Process Schematic of Weak Base Ion Exchange for Nitrate ("WIN" Process) (ARA & Purolite, N.D.b).
As an emerging technology, available information is limited to that provided by the
manufacturers. The process consists of a pretreatment step to decrease pH, followed by ion
exchange vessels in series, and post-treatment to increase pH. The manufacturer states, “The
volume of nitrate-containing effluent from the WIN process is typically less than 0.2% of the
treated water and, in some cases, may be land applied as fertilizer” (ARA & Purolite, N.D.b). As
discussed above, the use of SBA IX resin results in a high-nitrate brine waste stream. Due to the
high salt content, the nitrate in the waste stream generally cannot be beneficially reused.
However, with the use of alternative weak bases for regeneration, the waste stream does not
have a high salt content and could potentially be recycled as fertilizer.
3.1.7 Ion Exchange - Case Studies
3.1.7.1 Conventional Ion Exchange - Case Studies
The following case studies provide detailed information on the design and operation of full-scale
conventional IX treatment plants for nitrate removal. Conventional IX is also used by the Chino

FINAL REPORT June, 2011Ion Exchange (IX) Page 28
Copyright © 2011 American Water Works Association. All Rights Reserved.
Basin Desalter Authority in combination with RO. Detailed case studies for the Chino Desalter
are listed separately in the RO case study section.

FINAL REPORT June, 2011Ion Exchange (IX) Page 29
Copyright © 2011 American Water Works Association. All Rights Reserved.
System Location: CaliforniaCASE #1 System Type: Community Water SystemTreatment Type: Conventional Ion ExchangeStartup Date: 2007
System Description
A California utility is responsible for a system that has two groundwater supplies, one of which has nitrate at levels that exceed the MCL. The impacted well has a production capacity of 400 gpm and historical nitrate concentrations ranging from 7 mg/L to 12 mg/L of nitrate as N. The utility has implemented a blending program and installed a conventional IX treatment system in 2007 for nitrate control and treatment.
The nitrate impacted sources also have arsenic levels above the MCL of 10 g/L which influenced the decision to install IX. IX can simultaneously remove nitrate and arsenic. The treatment system is comprised of three pressure vessels. Two vessels contain Purolite A300E for arsenic removal and the third vessel contains the nitrate selective Purolite A520E resin. The system was originally installed in 2007 and was further modified in 2009. The system is designed to decrease nitrate levels to less than 5 mg/L prior to blending. The maximum distribution system watergoal for nitrate is 8 mg/L as N. To assure the system maintains the treatment goals, online nitrate analyzers have been installed at two locations, after the IX system and after blending.
Source Water Quality
Nitrate (mg/L N)o Average – 8o Minimum – 7o Maximum – 12
Co-contaminantso Arsenic (15 g/L)o Sulfate (66 mg/L)
Treatment Technology Selection
The conventional IX system was selected to treat both nitrate and arsenic. The decision was further influenced by the ability to discharge the waste brine to a municipal sewer, a cost effective disposal option. Often technology selection is limited by the costs of brine management. If a utility has the option to dispose of the waste brine to a municipal sewer it can significantly decrease the operations and maintenance cost of the system. No other technologies were pilot tested prior to installation of the IX system.
Treatment Type Ion Exchange and Blending
System Capacity 400 gpm
Raw Water Nitrate 7-12 mg/L

FINAL REPORT June, 2011Ion Exchange (IX) Page 30
Copyright © 2011 American Water Works Association. All Rights Reserved.
Treatment System Parameters
Design Capacity o 400 gpm maximum capacity
Pretreatmento None
Treatment system foot print o Treatment system: 30’ x 35’o Building footprint: None
Ion exchange pressure vesselso Number of vessels: 3o Diameter of vessels: 6’o Height of vessels: 6’
Design Loading Rate o 5.2 gpm/ft2
Bed volumes prior to regenerationo 345-470 (approximately 220,000-
300,000 gallons treated) Resin Type: Purolite A200E and Purolite
A520E nitrate selective Previous resins used: None Salt Consumption: 1,700 lb/week (May-
Sept) and 600 lb/week (Oct-April) Volume of brine generated
o 800 gal/vessel/backwash o 99.7% water efficiency
Monitoring:o Online nitrate analyzero Laboratory samples
Residuals Management
The waste brine is discharged to the sewer and sent to a municipal wastewater treatment facility, with an annual cost of $12,000. There have not been any unexpected residuals that have impacted the disposal option.
Technology Benefits and Drawbacks
Benefits Ease of regeneration Direct-to-sewer brine disposal Simple, manually operated system
Drawbacks System has potential for breakthrough of
nitrate or arsenic Time intensive operations Required increase in operator certification
(California T-3)
Treatment Technology Costs
Capital Costs (Total with explanation or component costs)
Total: $350,000
Annual O&M Costs (Total with explanation or component costs)
Total: $66,500Resin: $13,000Brine Disposal or Treatment:
$12,000
Chemicals: $5,500Repair/Maintenance (not including Labor):
$4,500
Power: $2,500Labor ($): $28,000
Operational Notes
Since nitrate is an acute contaminant, the reliability of the treatment system is an utmost concern. The system is equipped with online nitrate analyzers which causes a shutdown of the treatment system when nitrate is at or above 8 mg/L as N. Additionally, the treatment system has experienced arsenic breakthrough resulting in concentrations above the MCL. The treatment system has also experienced premature nitrate breakthrough as a result of faulty distributors in the ion exchange vessels which have since been replaced.

FINAL REPORT June, 2011Ion Exchange (IX) Page 31
Copyright © 2011 American Water Works Association. All Rights Reserved.
System Location: CaliforniaCASE #2 System Type: Community Water SystemTreatment Type: Conventional Ion ExchangeStartup Date: 2006
System Description
A California water utility operates a system that has three groundwater supplies with varying amounts of nitrate contamination. Two of the wells require treatment as the nitrate concentration is at or above the 10 mg/L N MCL. The third well has nitrate ranging from 5 mg/L as N to 7 mg/L as N and does not require treatment, but is blended with the IX treated water prior to distribution.
In 2006, a conventional IX system was installed. The treatment system is comprised of three pressure vessels that contain the Rohm and Haas HP 555 ion exchange resin. Since the nitrate concentration in the impacted wells is typically at the MCL, but above the established water quality goal of 8 mg/L, a sidestream treatment approach is utilized. In sidestream treatment a portion of the flow is passed through the treatment system while the remainder is bypassed. The IX treatment results in very low nitrate concentration and allows the two streams to be combined to achieve the water quality goal. Sidestream treatment offers capital and operational costs savings.
Source Water Quality
Nitrate (mg/L N)o Average – 10
Co-contaminantso Sulfate
Treatment Technology Selection
IX was selected for this system because the utility was familiar with the technology from other installations. No technologies were pilot tested prior to the installation of the IX system.
Treatment System Parameters
Design Capacity o 400 gpm maximum capacity
Pretreatmento 100 mesh strainero 10 micron screen
Treatment system foot print o Treatment system: 20’ x 100’o Residual handling : 40’ x 100’o Total footprint: 60’ x 100’
Ion exchange pressure vesselso Number of vessels: 3o Diameter of vessels: 4’o Height of vessels: 6’
Design Loading Rate o 10 gpm/ft2
Bed volumes prior to regenerationo 309 BVo Regeneration occurs every 12.4
hours Resin Type: Rohm and Haas HP 555 Previous resins used: None Salt Consumption: Estimated to be 32,000
lbs of salt per month Volume of brine generated
o 1,000 gal/vessel/backwash o 99.2% water efficiency
Monitoring:o Online nitrate analyzero Laboratory samples
Treatment Type Ion Exchange
System Capacity 400 gpm
Raw Water Nitrate 10 mg/L

FINAL REPORT June, 2011Ion Exchange (IX) Page 32
Copyright © 2011 American Water Works Association. All Rights Reserved.
Residuals Management
The spent brine is held in a storage tank and ultimately disposed off site. Brine volumes are minimized by using a partial flow treatment strategy where only 400 gpm is treated by the IX system while the remaining 500 gpm bypasses the system. The untreated flow is recombined with the treated water prior to entering the distribution system.
Technology Benefits and Drawbacks
Benefits Familiarity with technology Simple, manually operated system
Drawbacks No onsite brine disposal Design flaws Inconsistent operations Potential for nitrate breakthrough
Treatment Technology Costs
Cost information was not included with the survey response.
Operational Notes
This particular IX system has had a series of operational challenges, many of which can be attributed to faulty engineering. Sections of exposed Schedule 80 PVC failed due to freezing, while other sections of pipe failed due to prolonged UV exposure. The brine reclaim tank experienced algal growth and was ultimately replaced with an opaque, UV-resistant tank.
The plant has experienced shut downs due to an exceedance of the nitrate MCL. Routine sampling showed distribution system nitrate concentrations above the MCL. The system utilizes an online nitrate analyzer to prevent MCL violation; however, a calibration error prevented the system from shutting down as programmed. It is believed a second failure occurred as a result of the brine saturator having a low salt concentration resulting in incomplete regeneration of the resin.
It should be noted that, due to concerns of nitrosamine release (which can be common for IX systems), the effluent of each vessel and the Point of Entry of the distribution system are tested before the system is placed in service.

FINAL REPORT June, 2011Ion Exchange (IX) Page 33
Copyright © 2011 American Water Works Association. All Rights Reserved.
3.1.7.2 Modifications to Conventional Ion Exchange - Case Studies
The following case studies provide detailed information on the design and operation of full-scale
low-brine IX systems including MIEX®, ISEP®, and Envirogen (formerly Basin Water) systems.

FINAL REPORT June, 2011Ion Exchange (IX) Page 34
Copyright © 2011 American Water Works Association. All Rights Reserved.
System Name: Indian HillsSystem Location: Indian Hills, CO
PWSID: CO 0130065CASE #3 System Type: Community Water SystemTreatment Type: Counter Current Magnetic Ion Exchange Questionnaire completed by: Operations staff and Orica Water Care RepresentativesStartup Date: 2009
System Description
The Indian Hills Water District(District) utilizes a groundwater well with a production capacity of approximately 50 gpm. The well has historical nitrate concentrations ranging from 12 mg/L to 16 mg/L of nitrate as N. The District has implemented the Counter-Current Ion Exchange process developed by Orica Water Care. Unlike traditional packed bed IX, the Orica process uses a Magnetic Ion Exchange (MIEX®) resin in a series of fluidized beds which allows for a reduction in brine generation.
The minimization of waste brine is accomplished through frequent batch resin regeneration. The magnetized resin encourages agglomeration of loaded resin particles, resulting in faster settling. Loaded resin is removed from the bottom of the IX vessel and is passed to regeneration, while regenerated resin is continuously added at the top of the IX vessel. This configuration reduces the risk of nitrate spiking/chromatographic peaking because clean resin, added at the end point of the system, captures any displaced nitrate, while competing ions, such as sulfate can be removed early on in the resin vessel.
Regeneration is performed continuously in small batches. Loaded resin is passed to regeneration tanks through the bottom of the IX vessel. The loaded resin is regenerated and then returned to the contactor vessel, thus maintaining a consistent ion exchange capacity in the contactor vessel. Numerous regenerations are performed on a daily basis, with the actual number of regenerations depending on the system’s flow rate.
Source Water Quality
Nitrate (mg/L N)o Average – 14o Minimum – 12o Maximum – 16
Co-contaminantso None noted in survey
Treatment Technology Selection
The counter current magnetic ion exchange system was selected based on the expected low levels of brine when compared to conventional packed bed IX. Prior to full scale implementation, the MIEX® process was pilot tested at Indian Hills. Indian Hills did not pilot test any other technology prior to implementation.
Treatment Type Counter Current Ion Exchange
System Capacity 50 gpm
Raw Water Nitrate 12 – 16 mg/L

FINAL REPORT June, 2011Ion Exchange (IX) Page 35
Copyright © 2011 American Water Works Association. All Rights Reserved.
Treatment System Parameters
Design Capacity o 50 gpm maximum capacityo 25 gpm typicalo 11- 14 gpm actual
Pretreatment/Post-treatmento 1 micron bag filterso Chlorination
Treatment system foot print o Treatment system: 9.75’ x 5.5’o Regeneration system: 13.3’ x 6.5’o Residuals handling system:
2,000 gal storage tanko Total system footprint: 20.5’ x 9.75’ o Building footprint: 30’ x 50’
Number of contactorso (2 ) – 3’ diameter; 6.75’ height
Design Loading Rate o 7.27 gpm/ft2 at design flow
Bed volumes prior to regenerationo 125 BV
Resin Type: MIEX DW 1401- Strong base anion exchange resin in chloride form
Previous resins used: None Salt Consumption: 3,500 lbs/MG treated
water Volume of brine generated
o 2,800 gal brine/MG treated watero 99.7% water efficiency
Monitoring:o Online nitrate analyzero Laboratory sampleso Field colorimeter
Residuals Management
The waste brine is sent to a 2,000 gallon underground storage tank. The brine is periodically pumped from thestorage tank and ultimately land applied. Indian Hills is investigating deep well injection as an alternative disposal mechanism. The waste brine was analyzed in the pilot portion of the project and no unforeseen residuals were identified that would further limit the brine disposal options.
While not specifically analyzed at this site, waste brine from other MIEX® installations has not had detectable nitrosamine concentrations.
For the MIEX® System, Bed Volumes are defined as the volume of water treated per volume of resin regenerated. BV = gal water treated/gal resin regenerated. For example, if 5 gal of resin were regenerated for every 1000 gal of water treated, the regeneration rate would be: BV = 1000gal/5gal = 200BV.
The design regeneration rate for the MIEX® System is 125 BV, meaning that 8.0 gal of resin are regenerated per 1000 gal of water treated. The system regeneration rate can be adjusted through the control system. There is approximately 1-2 gallons of resin attrition per 1 MG of treatment. Small amounts of resin are periodically added to the regeneration system manually.

FINAL REPORT June, 2011Ion Exchange (IX) Page 36
Copyright © 2011 American Water Works Association. All Rights Reserved.
Technology Benefits and Drawbacks
Benefits Consistent treatment performance Relatively low volumes of waste brine No nitrate dumping
Drawbacks Generation of waste brine Resin lost in the treatment must be
removed prior to distribution
Treatment Technology Costs
Capital Costs (Total with explanation or component costs)
Operating and Monitoring Equipment:
Approximately $150,000 (IX treatment system, including initial resin fill)
O&M Costs (Total with explanation or component costs)
Resin: $0.08 - $0.15/1000 gallons treatedResin Disposal: N/ABrine Disposal or Treatment:
N/A
Chemicals: Salt (based on an estimated salt cost of $100/ton):$0.15 - $0.20/1000 gallons treated
Sources *:
Vaughan, Forrest, Orica Watercare, Personal Communication (August, 2010)Martin, Barbara (September, 2010). Completed questionnaire.
*Unpublished sources used in the development of the case studies are not reflected in the References section of this report.

FINAL REPORT June, 2011Ion Exchange (IX) Page 37
Copyright © 2011 American Water Works Association. All Rights Reserved.
System Location: CaliforniaCASE #4 System Type: Community Water SystemTreatment Type: Ion Exchange, Well Modification (proposed), Well AbandonmentStartup Date: 2003-2009
System Description
A California district operates 27 groundwater sources, 15 of which contain nitrate at or near the MCL.The district has considered and implemented a variety of solutions including IX, well modifications and well destruction. The nitrate impacted wells range in capacity from 500 gpm to 1000 gpm with nitrate ranging from 8 mg/L to 19 mg/L as N. It should be noted that a water quality goal of < 8 mg/L of nitrate as N has been implemented in the district, and all sources are treated to below this level.
The district began actively treating the nitrate contaminated sources in 2003 and the most recent system was installed in 2009. The district currently has 6 wells with active IX systems, 7 wells have been destructed or made inactive, 2 wells are being considered for well modifications and one well has an enhanced control system where there will be an automatic shut down if the nitrate levels exceed a predetermined level. The range of historical nitrate concentrations of the wells is shown below.
Source Water Quality
Nitrate (mg/L N)o Well A- 2 – 13.1o Well B- 3 – 11o Well C- 1 – 11o Well D- 3 – 20o Well E- ND – 9.3o Well F- 3 – 12o Well G- 1 – 12o Well H- 2 – 16
o Well I- 3 – 9o Well J- 1 – 8o Well K- 12o Well L- 20o Well M- 8o Well N- 8o Well O- 15
Treatment Technology SelectionThe first nitrate treatment system the district installed was in 2003. At the time of installation IX was deemed the best available technology as it was the most economical with respect to the well’s nitrate concentrations and flow rates. When possible, the district elected to install similar systems on the wells that required treatment in an effort to establish operational parallels between their systems. When the footprint of the system or excessive nitrate concentrations made IX treatment infeasible, the district has elected for well destruction. In recent cases where treatment is necessary, the district has evaluated well modifications to determine if it is feasible to reduce the nitrate concentrations without the need for active treatment.
Treatment Type Ion Exchange and Blending
System Capacity 500-900 gpm
Raw Water Max Nitrate
8 -20 mg/L

FINAL REPORT June, 2011Ion Exchange (IX) Page 38
Copyright © 2011 American Water Works Association. All Rights Reserved.
The following section shows the typical parameters of the districts individual IX systems with the exception of the salt consumption which represents the total salt use for the entire district.
Treatment System Parameters
Design Capacity o 500-900 gpm
Pretreatmento None
Treatment system foot print o Two 35’ x 20’ cement slabso Treatment system: 35’ x 10’o Housed in a cargo container
Residuals handling system:o Three 12’ x 12’ dia. tanks
Ion exchange pressure vesselso Number of vessels: 16o Diameter of vessels: 3’o Height of vessels: 6’
Design Loading Rate o 12 gpm/ft2
Bed volumes prior to regenerationo 300 BV
Treatment System Manufacturer:o Envirogen Technologies
Resin Type: Conventional type 1 ion exchange resin
Previous resins used: None Salt Consumption: 25 tons/ week
combined for all systems Volume of brine generated:
o 1.3 bed volumes per vessel regenerated
o Approximately 99.6% water efficiency
Monitoring:o Online nitrate analyzero Laboratory samples
Residuals Management
The waste brine is disposed of at an offsite facility. This decision has been impacted by elevated selenium and NDMA in the waste brine.
Technology Benefits and Drawbacks
Benefits Allows wells that would normally be
offline due to nitrate contamination to be used for potable purposes
The treatment system vendor provides on-site technical support and operations
Drawbacks Treatment system failure poses an acute
health risk to the potable water system Time intensive operations if there is a
treatment disruption The systems have numerous valves and
moving parts. If there is a mechanical failure it can be difficult to identify the source
High operating and brine disposal costs The district pays the system vendor for
stand-by fees and service charges if the system is in stand-by mode during times of low water use

FINAL REPORT June, 2011Ion Exchange (IX) Page 39
Copyright © 2011 American Water Works Association. All Rights Reserved.
Treatment Technology Costs
Capital Costs (Total with explanation or component costs)
Total: $360,000 per unit – Electrical, Piping, Set-up, and Sampling/testing (construction costs)
The district does not own the treatment plants, tanks, resins, etc.
O&M Costs (Total with explanation or component costs)
Total: $59,239.41 per month, per unitBrine Disposal or Treatment:
$34,016.75 per month, per unit
Repair/Maintenance (not including Labor):
$3,525.00 (service fee) per month, per unit
Salt: $13,541.41 (salt) per month, per unitOther: $7,500.00 (stand by fee) per month, per unit
$656.25 (tax) per month, per unit

FINAL REPORT June, 2011Ion Exchange (IX) Page 40
Copyright © 2011 American Water Works Association. All Rights Reserved.
System Name: City of ChinoSystem Location: Chino, CA
PWSID: CA3610012 CASE #5 System Type: Community Water SystemTreatment Type: Ion Exchange (IX) Questionnaire completed by: Gilbert Aldaco, Water Utilities Supervisor, City of Chino Public WorksStartup Date: 2006
System Description
The City of Chino, CA operates 13 groundwater sources and 3 GWUDI (groundwater under direct influence of surface water) sources. All of the GWUDI and 8 of the groundwater sources are impacted by nitrate contamination. IX and blending are used to address high nitrate and perchlorate levels. One of the wells is inoperable due to perchlorate contamination. IX using the ISEP® system is used for the treatment of 3 wells ranging in capacity from 1100 to 2300 gpm and is being considered for a 4th well. Additionally, an Envirogen (formerly Basin Water) IX system is used for the treatment of an 800 gpm well. Treated surface water from the Metropolitan Water District of Southern California (MWDSC) and treated groundwater from the Chino Basin Desalter Authority is used for blending. The blend ratio is 3:1. The ISEP® system was built in2005, with a capacity of 5000 gpm (7.2 MGD), and approved for operation in 2006.
Source Water Quality
Nitrate (mg/L N)o 9 – 45
Co-contaminantso Perchlorate
Treatment Technology Selection
The costs and feasibility of several alternatives for nitrate treatment, including reverse osmosis, biological processes, and conventional (fixed bed) IX were investigated. Biological treatment and fixed bed IX were pilot-tested prior to installation of the current system. The ISEP® system was selected based in part on the potential to simultaneously address perchlorate contamination and due to the efficiency of operation.
Treatment Type Ion Exchange and Blending
System Capacity 5000 gpm
Raw Water Nitrate ~9 – 45 mg/L as N

FINAL REPORT June, 2011Ion Exchange (IX) Page 41
Copyright © 2011 American Water Works Association. All Rights Reserved.
Treatment System Parameters Design Capacity
o 5000 gpm Pretreatment: Filtration Foot print
o Treatment system: 4400 sq.ft.o Residuals handling: 2300 sq.ft.o Total system: 6700 sq.ft.
Ion exchange vesselso Number of vessels: 30o Diameter of vessels: 3’o Height of vessels: 6’
Max. nitrate concentration goal for delivered water:
o ~ 8.2 mg/L as N Nitrate concentration goal for the treatment
system (before blending):o ~ 4.3 mg/L as N
Manufacturer: Calgon Carbon Corporation Resin Type: Purolite SBA
Previous resins used: None Bed volumes prior to regeneration
o Continuous regeneration Salt Consumption (@ 2400 gpm)
o Nitrate mode – 4.9 tons/dayo Perchlorate mode – 18.6 tons/day
Volume of brine generated (@ 2400 gpm)o Nitrate mode: 12.7 gpm
99. 5% water efficiencyo Perchlorate mode: 31 gpm
98.7% water efficiency Monitoring:
o Weekly effluent testing for nitrate and perchlorate
o Monthly effluent testing fornitrite, sulfate and total Coliform
o Monthly raw water testing for nitrate, perchlorate, nitrite, sulfate, total Coliform, HPC
Grab Samples for resin byproduct testing were negative for nitrosamines.
Residuals Management
Waste brine is discharged to a non-reclaimable waste pipeline leading to the LA County Sanitation District, with a total disposal cost of ~$50,000/yr.
Technology Benefits and Drawbacks
Benefits Flexibility of operation and High efficiency Reliability and Ease of O & M
Drawbacks None listed
Treatment Technology Costs
Capital Costs (Total with explanation or component costs)
Total: ~ $4.6 millionHousing: ~ $492 KPiping: ~ $1.1 millionResin: ~ $350 KTesting: ~ $20 KOther: ~ $2.4 million for ISEP Equipment and Engineering; ~ $350 K
for electrical upgrade; ~ $200 K for pumps and associated equipment.
Annual O&M Costs (Total with explanation or component costs)
Total: Not reportedBrine Disposal or Treatment: ~ $50 KChemicals: ~ $364 K for salt, ~ $50 K for hydrochloric acid

FINAL REPORT June, 2011Ion Exchange (IX) Page 42
Copyright © 2011 American Water Works Association. All Rights Reserved.
Additional Information Operators were not required to increase their level of certification to operate the treatment plant. When asked about the areas in which the nitrate treatment technology has exceeded expectations, the
response was “Reliability and ability to effectively remove contaminants at varied flow rates (i.e., 1500 gpm to 5000 gpm).”
There has been no incidence of a plant shutdown due to an alarm or exceedance of an MCL; however, the plant was shut down for approximately 1 month due to theft of computer control equipment.

FINAL REPORT June, 2011Reverse Osmosis (RO) Page 43
Copyright © 2011 American Water Works Association. All Rights Reserved.
3.2 Reverse Osmosis (RO)
Reverse osmosis can be a feasible option for nitrate removal in both municipal and Point-of-Use
applications (Howe, 2004; Cevaal et al., 1995; and Black, 2003). The first commercial
application of RO for potable water treatment was in Coalinga, CA in 1965 (National Academy
of Engineering, 2008). RO can be used to address multiple contaminants simultaneously
including ionic (i.e., nitrate, arsenic, sodium, chloride and fluoride), particulate (i.e., asbestos
and Protozoan cysts) and organic constituents (i.e., some pesticides) (Dvorak & Skipton, 2008).
Water is forced through a semi-permeable membrane under pressure such that the water
passes through, while contaminants are impeded by the membrane. A typical process
schematic of RO for nitrate removal from potable water is illustrated in Figure 3-7.
Figure 3-7Reverse Osmosis Schematic.
The required pressure will be dependent on the concentration of solute in the feed water. The
collected concentrate is high in nitrate and other rejected constituents (salts) and requires
appropriate disposal. The extent to which the RO membrane removes constituents from the
water is called the rejection rate. Rejection rates for sodium chloride and sodium nitrate can be
as high as 98% and 93%, respectively (Elyanow & Persechino, 2005). The water recovery rate of
an RO system refers to the “maximum percentage of permeate produced from a given feed
flow,” and the flow/flux rate is “the maximum flow of permeate through a sq. ft. of the
membrane” (Cevaal et al., 1995). Modifications and improvements to standard RO have led to
the emergence of more efficient RO processes including High Efficiency Reverse Osmosis
(HERO™) and Ultra-low Pressure Reverse Osmosis (ULPRO) systems.

FINAL REPORT June, 2011Reverse Osmosis (RO) Page 44
Copyright © 2011 American Water Works Association. All Rights Reserved.
3.2.1 Reverse Osmosis - Design Considerations
Table 3-6 summarizes key design considerations in the application of RO to nitrate removal
from potable water.
Table 3-6 Summary of Design Considerations for Reverse Osmosis.
RO Membranes Thin film membranes - Higher rejection rates, lower pressures than CTA membranes Cellulose triacetate membranes (CTA) - Not sensitive to chlorine Hollow fiber membranes - Compact configuration Ultra-low pressure RO membranes (ULPRO) Consider rejection rate, water recovery, and frequency of cleaning Multiple contaminant removal
Pretreatment Prevent membrane damage, scaling and biological, colloidal and organic fouling Scaling
o Acid (e.g., sulfuric acid) and/or anti-scaling agents (e.g., poly-acrylic acid)o Water softening
Biological foulingo Upstream disinfection, but dechlorination to prevent membrane damage
Reducing agent (e.g., sodium bisulfate) or activated carbon Colloidal fouling
o Prefiltration to remove suspended solids o Chemical treatment to keep suspended solids in solution
Post-Treatment Avoid corrosiono Adjust pH, restore alkalinity for buffering capacity (see remineralization)
and/or add corrosion inhibitor (e.g., polyphosphate) Remineralization
o Blending, pH adjustment, addition of caustic soda, bicarbonate, sodium carbonate, phosphates, and/or silicates
Blending, disinfection, and storageChemical Usage pH adjustment, up and down (acids and bases)
Anti-scalants Cleaning chemicals (acids and bases)
O&M Frequency of membrane cleaning depends on water quality and membrane usedo Typically once a month for 1 hour
Management of chemicals and prefiltration system Waste storage and disposal Membrane replacement/membrane life
o Up to 20 years or more with appropriate pretreatment and maintenance Monitoring of nitrate levels and membrane flux rate Automation can be feasible Low operational complexity (though higher than IX depending on pretreatment
needs)System Components
Maximize water recovery while minimizing energy useo Pressure range of 100 to 200 psio Based on system size and feed water quality
Key system configuration parameters are system flow rate, number of membranes/stages, system footprint, flux rate, water recovery rate, pump selection and sizing, pressure requirement, cleaning frequency

FINAL REPORT June, 2011Reverse Osmosis (RO) Page 45
Copyright © 2011 American Water Works Association. All Rights Reserved.
Waste Management and Disposal
Significant cost of waste brine/concentrate disposal of greatest concern for inland systems
Management options include sewer or septic system, drying beds, trucking off-site, coastal pipeline, deep well injection and advanced treatment
Disposal options can be limited by waste brine/concentrate water quality (e.g.,volume, salinity, metals and radionuclides)
Optimization of recycling and treatment of waste brine/concentrate Higher water recovery (more costly) to minimize waste volume (tradeoff between
energy costs and disposal costs)Limitations Need to prevent membrane scaling, fouling and damage
o Hardness, iron, manganese, suspended solids, silica and chlorine High energy demands Disposal of waste concentrate Complete demineralization (no control over target constituents)
3.2.1.1 Water Quality
While regulated by operational pressure, the water recovery rate depends largely on feed
composition. Problematic constituents include sulfate, calcite, calcium sulfate dehydrate
(gypsum), silica, colloids, and microorganisms (Cevaal et al., 1995; Elyanow & Persechino, 2005;
and Tarabara, 2007). Filtration upstream of the RO membranes is required to remove
suspended solids. The life of the RO membranes and prefilters, and the frequency of
membrane cleaning are also directly dependent on water quality and the efficiency of
pretreatment measures.
Treatment efficiency can be compromised by membrane fouling. Anything that decreases
available membrane surface area can limit the passage of water through the membrane and
decrease water recovery. The four main types of membrane fouling are scaling, colloidal
fouling, biological fouling and organic fouling. When the salt concentration in the feed water
exceeds the saturation point at the membrane surface, precipitation of solids on the membrane
can diminish the removal efficiency (Elyanow & Persechino, 2005). Scale forming constituents8,
8 Pretreatment options to prevent scaling include addition of acid and/or anti-scaling agents and water softening. By decreasing the pH, the prevalent form of the carbonate cycle is bicarbonate rather than the carbonate ion. The precipitation of calcium carbonate will therefore be limited by the concentration of the carbonate ion. Note: the addition of acid helps only if the scale forming constituent is calcite, due to the speciation of carbonate (Lenntech, 2009c). Anti-scaling chemicals can function in three ways: threshold inhibition, crystal modification and dispersion (Lenntech, 2009c). Threshold inhibition occurs when the anti-scalant increases the solubility of a potential scalant to super saturation, allowing for a greater concentration to remain in solution. Crystal modification refers to the interference of negatively charged functional groups on the anti-scalant with salt crystal formation and membrane attachment. Anti-scaling chemicals can also promote dispersion of crystals by attaching to them and increasing their

FINAL REPORT June, 2011Reverse Osmosis (RO) Page 46
Copyright © 2011 American Water Works Association. All Rights Reserved.
such as calcium, barium and strontium salts pose a significant threat to RO by limiting the
membrane surface area through which water can pass9. Development of biomass on the
membrane surface can have a similar negative effect on performance10. Additionally, RO
membranes have limited to zero tolerance for organic species, like grease and oil; organic
fouling inhibits membrane performance (Lenntech, 2009e). Lastly, suspended solids not
removed by pretreatment filtration can inhibit membrane performance through colloidal
fouling11. Common pretreatment measures used to address membrane fouling are included in
Table 3-6.
With acid addition in pretreatment, the permeate will need to be neutralized in post-treatment
to avoid corrosion in the distribution system. Alternatively a corrosion inhibitor like
polyphosphate or poly-orthophosphate can be used. Additionally, because RO is not selective
in the removal of ions, treated water is demineralized. Thus, alkalinity may need to be added to
restore minerals and buffering capacity to avoid corrosion in the distribution system12 (WHO,
2004 and Lenntech, 2009f). In post-treatment, blending (if used) follows the RO modules, after
which water is disinfected and stored (Cevaal et al., 1995).
negative charge. The most economical means of membrane scale control will depend on the system, but typically the use of anti-scaling agents alone or in combination with acid addition is the most financially prudent option. The third alternative to prevent membrane scaling is to remove the problematic constituents from the water entirely.Water softening can be used to replace calcium and magnesium cations with sodium ions. Generally the most expensive option, this requires the addition of a water softener upstream of the membranes and will result in an additional brine waste stream.9 The Langelier Saturation Index (LSI) and other corrosion indices are used to characterize the scaling potential of calcium carbonate (calcite), a commonly problematic constituent.10 Upstream disinfection can limit membrane biofouling; however, additional measures must be taken to avoid membrane exposure to chlorine “by dosing with a reducing agent (such as sodium bisulfate) or by contacting with activated carbon” (Elyanow & Persechino, 2005).11
The potential for colloidal fouling is typically characterized by the silt density index (SDI). A SDI greater than 3 can indicate the need for further pretreatment to minimize cleaning frequency and membrane damage (Lenntech, 2009e and Elyanow & Persechino, 2005). Chemical treatment can keep suspended solids in solution. Alternatively, a prefilter should be used to remove solids from the feed water (Remco Engineering). 12 It is important to note the relationship between alkalinity and pH. Alkalinity is a measure of buffering capacity or the resistance to changes in pH. Demineralized water or water with a low buffering capacity will be susceptible to more dramatic pH changes and is considered unstable. The pH of acidic product water should be adjusted and the buffering capacity of demineralized product water should be restored to avoid corrosion downstream. Options for the stabilization and remineralization of demineralized water include blending, pH adjustment, and addition of caustic soda, bicarbonate, sodium carbonate, phosphates, and/or silicates (WHO, 2004 and Lenntech, 2009f). Corrosion indices and models can be used to determine appropriate solutions for specific scenarios.

FINAL REPORT June, 2011Reverse Osmosis (RO) Page 47
Copyright © 2011 American Water Works Association. All Rights Reserved.
3.2.1.2 System Components and Site Considerations
RO systems are operated in stages. Following pretreatment, water is pumped through the
membranes with booster pumps (Cevaal et al., 1995). Water recovery can be improved by
passing the concentrate through the membranes more than once, but higher water recovery
comes at the expense of increased scaling potential. As the water becomes more
concentrated, saturation can lead to precipitation on the membrane (Elyanow & Persechino,
2005). The membrane flux rate can be decreased to limit scaling and increase membrane life
(Cevaal et al., 1995). Key aspects of the system are pressure pumps, membrane configuration,
membrane flux rate, number of stages/number of membranes, flow rate, and cleaning and anti-
scalant requirements. Pump sizing is based on system size and the pressure requirements. The
water recovery rate can be regulated by the operational pressure. The necessary pressure is
dependent on the concentration of solute in the feed water. For example, with a conductivity
of 1550 μS/cm, Panglisch et al. (2005) determined the suitable pressure to be 145-174 psi.
Similarly, at start-up, the operational pressure at an RO facility in Brighton, CO used for nitrate
removal was 170 psi (Cevaal et al., 1995).
Two types of spiral wound RO membranes are commonly used: polyamide thin film composite
membranes (TF) and cellulose triacetate membranes (CTA) (Remco Engineering and Cevaal et
al., 1995). While TF membranes are capable of slightly higher rejection rates and can be
operated at lower pressures, CTA membranes are not sensitive to chlorine (Remco
Engineering). Hollow fiber RO membranes are also available, which can minimize system
footprint but can be more susceptible to fouling from suspended solids (Hydranautics, 2001).
Using recently developed ultra-low pressure RO (ULPRO) membranes, operational pressures
can be reduced, decreasing power costs (Drewes et al., 2008). For additional information see
the section Reverse Osmosis – Improvements and Modifications.
3.2.1.3 Residuals Management and Disposal
The volume of the waste stream can be considerable, ranging from 15% to 50% of the starting
volume depending on the operational parameters (Howe, 2004). The waste stream, or
concentrate, can be discharged to a wastewater treatment plant or a septic system (Bilidt, 1985
FINAL REPORT June, 2011Reverse Osmosis (RO) Page 48
Copyright © 2011 American Water Works Association. All Rights Reserved.
and Howe, 2004), as long as the system can accommodate an increased salt concentration.
Additional disposal options include drying beds, infiltration basins, trucking off-site, a coastal
pipeline, deep well injection, advanced treatment, and most commonly, discharge to nearby
surface salt-waters (i.e., oceans), when available (Howe, 2004). Important water quality
characteristics of the waste brine (e.g., volume, salinity, metals and radionuclides) can affect
the feasibility and costs of disposal. Options for inland communities are more limited and
costly. Proximity to coastal power plants can be advantageous. Power plants using ocean
water for cooling can provide a pre-existing infrastructure for disposal to ocean waters (Black,
2003).
The high cost of nitrate laden concentrate disposal has led to research into optimization of
recycling and treatment of this waste stream. Coupling of RO systems with biological, chemical,
or catalytic denitrification enables removal of nitrate from the waste concentrate, with
reduction to nitrogen gas. Additionally, the Vibratory Shear Enhanced Process (VSEP), from
New Logic Research, has been explored in the context of treatment of RO concentrate from
wastewater treatment. By applying a shear force across the membrane, pore clogging by
colloidal particles is minimized, leading to the potential for improved water recovery (Lozier et
al., N.D.). Several combined configurations of interest are discussed below in a section devoted
to Brine Treatment Alternatives and Hybrid Treatment Systems.
3.2.1.4 Maintenance, Monitoring and Operational Complexity
RO systems are typically highly automated, accommodating the greater operational complexity
of RO operation, in comparison with IX. Several operational decisions will be dictated by
operator availability and training. For instance, chemical addition in pretreatment can be quite
effective, but will require more intensive maintenance. In contrast, opting for the more
expensive choice, installing a water softener, will require less operator time. Membrane
cleaning frequency varies widely and depends on the efficiency of pretreatment measures and
water quality. Interruption of operation is not always necessary as the membranes can be
isolated and cleaned in place (CIP) in stages. Membranes are typically cleaned with “acid or
caustic solutions” (WA DOH, 2005). Cleaning agents are selected based on the cause of

FINAL REPORT June, 2011Reverse Osmosis (RO) Page 49
Copyright © 2011 American Water Works Association. All Rights Reserved.
membrane fouling. Cleaning and rinsing can take an hour and with effective pretreatment,
monthly membrane cleaning should be sufficient (Remco Engineering and Bates, N.D.). With
effective pretreatment, cleaning frequency can be significantly minimized. A RO plant in Milan,
Italy using anti-scalants, requires cleaning only once every 18 months (Elyanow & Persechino,
2005). Filters should be checked weekly and, if used, the water softener should be maintained
with sufficient salt every day. Effluent nitrate concentrations require monitoring to ensure
compliance and to assess membrane performance. Over time, membrane degradation will lead
to a gradual decrease in removal efficiency. Membrane life varies and can range from 5 to 20
years or more (Remco Engineering). Waste concentrate management consists of appropriate
storage and disposal. More operationally complex than IX, operators of RO systems will
typically require more training and system maintenance will demand more time and chemicals.
However, with the implementation of appropriate pretreatment measures and the ability for
system automation, operational complexity can be minimized.
3.2.2 Reverse Osmosis - Cost Considerations
For the efficient operation of an RO system, the fundamental objective is to maximize water
recovery with the minimum amount of energy and chemical usage, while meeting necessary
potable water guidelines. Factors affecting system cost include facility size (how much water),
source water quality (including nitrate concentration), environmental factors (temperature and
pH), and target effluent nitrate concentration (Bilidt, 1985). Lower operating pressures are less
costly, but result in decreased water recovery. High operating pressures maximize water
recovery (decreasing disposal costs), but increase energy demands and the need for
“specialized pumps” (WA DOH, 2005). Thus, there is a trade-off between the costs of
increasing water recovery (increased pretreatment and operational pressure) and the costs of
disposal (pumping, storage and disposal expenses). In pretreatment, the use of anti-scalants
rather than acid or a water softener is generally the least expensive. The use of a water
softener is the least cost competitive option (Lenntech, 2009c). Regarding small water systems,
“reverse osmosis is one of the most expensive forms of centralized treatment and will not likely
be cost effective unless there are multiple contaminants needing removal” (WA DOH, 2005).

FINAL REPORT June, 2011Reverse Osmosis (RO) Page 50
Copyright © 2011 American Water Works Association. All Rights Reserved.
Capital costs for RO include land, housing, piping, storage tanks, O&M equipment, membranes,
preliminary testing (pilot studies), permits, and training. O&M costs include membrane and
filter replacement, membrane and filter disposal, concentrate disposal or treatment, chemical
use (anti-scalant, pH adjustment, disinfection etc.), repair, maintenance, power, and labor.
Published cost information, from existing RO installations used for nitrate treatment, is listed in
Table 3-7. Costs have been adjusted to 2010 dollars, unless indicated otherwise. Costs can be
difficult to assess due to inconsistencies in how cost information is reported. Comparison of
treatment costs is not always valid due to differences in influent water quality parameters,
system size, waste management options, and system configuration. Published costs do not
always include comparable information. It would be inappropriate to compare the O&M costs
of a facility that excludes disposal costs with others that include this information. The listed
cost information is provided as an approximate range of costs for specific facilities. Costs for
implementing RO may be very different from those listed here. A thorough cost analysis of
design parameters for specific locations would be required for accurate cost estimation. The
information gathered through the questionnaire includes detailed costs associated with the
unique case studies included in this analysis.
Table 3-7 Selected Costs* of Reverse Osmosis Systems for Nitrate Removal.
System Flow** < 0.5 MGD 0.5 – 5 MGD 5+ MGD
Annualized Capital Cost ($/1000 gal) 3.51 – 5.17 [1, 2] 1.00 – 1.30 [3, 4] 0.95 [3]
O&M Cost ($/1000 gal) 1.46 – 16.16 [1, 2] 1.22 – 2.01 [3, 4] 1.63 [3]
Total Annualized Cost ($/1000 gal) 5.73 – 19.70 [1, 2] 2.52 – 3.21 [3, 4] 2.58 [3]
*Costs have been adjusted to 2010 dollars with 7% interest over 20 years, unless indicated otherwise. **When available, costs are based on actual system flow rather than design capacity.[1] Walker (N.D.), costs not adjusted to 2010 dollars. [2] Personal communication with two small water systems (2010). [3] Conlon et al. (1995). [4] Cevaal et al. (1995).
3.2.3 Reverse Osmosis - Selected Research
Much research has focused on RO; Table A.2 of the Appendix is a list of recent studies relevant
to nitrate removal from potable water and several examples of RO application. Current RO
FINAL REPORT June, 2011Reverse Osmosis (RO) Page 51
Copyright © 2011 American Water Works Association. All Rights Reserved.
research focuses on improvements of membranes and waste management, and decreasing
energy use.
3.2.4 Reverse Osmosis - Summary of Advantages and Disadvantages
A summary of advantages and disadvantages of RO in comparison with other treatment options
is listed in Table A.6 of the Appendix. Advantages of RO include high quality product water,
multiple contaminant removal, desalination (TDS removal), feasible automation and application
for POU applications. According to Elyanow & Persechino (2005) in their comparison of RO and
EDR, “…the best economical choice for small capacity systems (<110 gpm or <25 m3/hr) are
simple RO plants, which have less electrical and hydraulic complexity than EDR and other
technologies.” In waters where salinity is a problem, RO can be better suited than IX due to the
ability to remove multiple contaminants (including trihalomethane formation potential
precursors (THMFPs)) (Cevaal et al., 1995).
Disadvantages of RO include high capital and O&M costs, membrane fouling susceptibility, high
pretreatment and energy demands, and potentially large waste volume (lower water recovery)
requiring disposal. The high cost of disposal from inland locations can result in RO treatment
becoming cost prohibitive. Howe (2004) presents several alternatives to conventional disposal
measures of RO waste brine, including reuse for industrial processes, processing (e.g., for salt
production), or use in energy generation (“solar brine pond.”)
3.2.5 Reverse Osmosis - Improvements and Modifications
3.2.5.1 Process Modification
High Efficiency Reverse Osmosis (HERO™) is a patented multi-step process enabling increased
water recovery (greater than 90%) and minimizing cleaning requirements. This process limits
scaling by incorporating hardness reduction, CO2 stripping, and pH adjustment (GE, 2010b).
Raw water is subjected to intensive pretreatment before passing through the RO membranes as
follows (Engle, 2007):
Weak acid cation exchange (WAC) is used to remove hardness ions,
CO2 stripping is used to remove carbonate and increase pH, and
Base addition is used to increase the pH to a level of 10.5.

FINAL REPORT June, 2011Reverse Osmosis (RO) Page 52
Copyright © 2011 American Water Works Association. All Rights Reserved.
An example flow diagram is illustrated in Figure 3-8.
Figure 3-8 Flow Chart of the HERO™ Process (Central Arizona Salinity Study, 2006).
With such pretreatment, water fed to the RO membranes is softened and pH is adjusted high
enough to significantly increase the solubility of silica. The high chemical usage and multiple
steps result in a more complicated process than conventional RO. However, benefits include
increased water recovery, decreased waste volume, and the ability to treat severely impaired and
poor quality source water containing multiple contaminants (Engle, 2007).
The HERO™ process was initially designed to produce ultra-pure water for use in electronics
applications and was patented by Debasish Mukhopadhyay with licensing rights for different
applications (Engle, 2007). The HERO™ process has been implemented for drinking water
treatment in the small community of Yalgoo, Australia to produce high quality drinking water

FINAL REPORT June, 2011Reverse Osmosis (RO) Page 53
Copyright © 2011 American Water Works Association. All Rights Reserved.
from brackish groundwater high in silica and nitrate (Thomson et al., 2009; Water Corporation,
2007 and 2009). Higher removal rates result in decreased waste volume. Using the HERO™
process in Yalgoo, waste volumes are as low as “one-tenth of a conventional plant’s
concentrated brine residue for disposal, eliminating the need for big evaporation ponds” (Water
Corporation, 2007).
3.2.5.2 Membrane Modification – Low Pressure Membranes
Research and development in membrane technology has resulted in the emergence of Ultra-Low
Pressure Reverse Osmosis (ULPRO). In contrast to the high pressures required for conventional
RO, use of ULPRO membranes allows for lower operating pressures and improved flux rates.
Energy demands can be reduced due to lower operating pressures; however, pretreatment
practices to prevent membrane scaling and fouling are similar to those necessary for
conventional RO membranes (Drewes et al. 2008). ULPRO membranes are available from
several manufacturers. Operating pressures are in the range of 50 to 125 psi, while the pressures
required for conventional RO membranes can be over 200 psi (Drewes et al., 2008; Excel Water,
2007; and Koch Membrane Systems, 2008). Drewes et al. (2008) compared the performance of
ULPRO membranes and conventional RO membranes. Pretreatment included nano-filtration for
both RO options. Findings indicate that the ULPRO membranes included in the study are
capable of successfully removing nitrate and multiple additional contaminants to potable water
standards. “With regard to operating costs, operating pressure is the only TMG [ULPRO
membrane] operating parameter considered to deviate from the benchmark ESPA2 [conventional
RO membrane] membrane. Pretreatment requirements and recovery rate are the same.
Electrical consumption will be directly proportional to the required operating pressure” (Drewes
et al., 2008, pg. 93). However, in the cost comparison between the two membranes, the benefits
of lower operating pressures were overshadowed by the poor recovery of the ULPRO
membranes after cleaning. The authors suggest that the cleaning of the ULPRO membranes
would need to be optimized for an improved cost comparison.
3.2.6 Reverse Osmosis - Case Studies
The following case studies provide detailed information on the design and operation of full-scale
RO treatment plants used for nitrate removal. Chino I Desalter and Chino II Desalter are
combination systems using both RO and conventional IX.

FINAL REPORT June, 2011Reverse Osmosis (RO) Page 54
Copyright © 2011 American Water Works Association. All Rights Reserved.
System Location: CaliforniaCASE #6 System Type: Community Water SystemTreatment Type: Reverse Osmosis (RO)
Startup Date: 2002
System Description
A California water utility operates a system that has three groundwater supplies, one of which has nitrate at levels that exceed the MCL. The impacted well has nitrate concentrations that range from 17 mg/L to 19 mg/L as N and has a typical production capacity of 100 gpm. In 2002, the utility implemented a blending program and installed a RO system for nitrate control and treatment.
In RO, raw water is forced through a semi-permeable membrane under pressure such that the water passes through, while contaminants are impeded by the membrane. The required pressure will be dependent on the concentration of solute in the feed water. The collected concentrate is high in nitrate and other rejected constituents (salts) and requires appropriate disposal. The extent to which the RO membrane removes constituents from the water is called the rejection rate. Rejection rates for sodium chloride and sodium nitrate can be as high as 98% and 93%, respectively (Elyanow & Persechino, 2005).
The high nitrate supply is blended with one of the other two groundwater sources prior to RO treatment. The RO system reliably removes nitrate to below 8 mg/L as N and the water delivered to consumers typically has nitrate levels below 3 mg/L as N. This system utilizes a leach field type system to land apply the RO concentrate.
Source Water Quality
Nitrate (mg/L N)o Average –17o Minimum – 18o Maximum – 19
Co-contaminantso Fluoride – 3.3 mg/Lo Arsenico Radium
Treatment Technology Selection
RO was selected as the most appropriate treatment system as the technology can reliably remove nitrate in addition to the co-occurring contaminants that are present, specifically fluoride, arsenic and radium.
Treatment Type Reverse Osmosis and Blending
System Capacity 120 gpm
Raw Water Nitrate 17 - 19 mg/L

FINAL REPORT June, 2011Reverse Osmosis (RO) Page 55
Copyright © 2011 American Water Works Association. All Rights Reserved.
Treatment System Parameters
Design Capacity o 120 gpm maximum capacity
Pretreatmento Anti-scalant (Hyposperse MCD
150) Treatment system foot print
o Treatment system: 15’ x 30’o Total system footprint: 40’ x 100’
RO System o System manufacturer: Aria™o Membrane manufacturer:
Osmonicso Number of stages: 4o Number of RO elements per
stage: 4
Clean-in-place (CIP)o CIP frequency: Quarterly
(4x/year)o Initiated when there is a 15%
decrease in permeate flow or salt rejection or a 15% increase in trans-membrane pressure
o CIP chemicals: Dilute phosphoric acid
Water efficiency: 80% Monitoring
o Laboratory samples Service life of membranes
o Approximately 8 years
Residuals Management
The concentrate is disposed to an on-site leach field.
Technology Benefits and Drawbacks
Benefits Effectively removes nitrate and other co-
contaminants On-site concentrate disposal Consistent operations
Drawbacks Energy intensive Relatively low water efficiency (80%)
Treatment Technology Costs
Treatment technology costs are not available for this system.
Operational Notes
The RO system has never had any extended unplanned shut downs or been shutdown as the result of an alarm. There has been an exceedance of the fluoride MCL that occurred near the end of the useful life of the membranes. The membranes have since been replaced, resolving this operational issue.
References
Elyanow, D. and Persechino, J. (2005). “Advances in Nitrate Removal.” GE – General Electric Company, Water & Process Technologies. Accessed June 11, 2010 via < http://www.gewater.com/pdf/Technical%20Papers_Cust/Americas/English/TP1033EN.pdf>.

FINAL REPORT June, 2011Reverse Osmosis (RO) Page 56
Copyright © 2011 American Water Works Association. All Rights Reserved.
System Name: City of BrightonSystem Location: Brighton, CO
PWSID: CO 0101025CASE #7 System Type: Community Water SystemTreatment Type: Reverse Osmosis (RO)Questionnaire completed by: Dave Anderson, City of Brighton RO Chief Plant OperatorStartup Date: 1993
System Description
The City of Brighton (City) utilizes six groundwater wells with production capacities ranging from 900 to 1500 gpm and one groundwater source which has been designated as groundwater under direct influence of surface water (GWUDI), as an emergency well, with a production capacity of 700 gpm. These seven sources are impacted by nitrate with average concentrations ranging from 10.6 mg/L to 20.4 mg/L of nitrate as N. The City has implemented RO with blending. The design capacity of the RO system is 6.65 MGD of permeate at 80% recovery (1150 gpm/train). Green sand and cartridge filters (Graver) are used to treat the GWUDI source, primarily for the removal of manganese. (Additional sources operated by the City that are not impacted by nitrate are purchased treated surface water and additional GWUDI wells.)
The original RO treatment system is illustrated below. Raw water enters the system with 40% of feed water bypassing the RO system and 60% of feed water passing to pretreatment. After anti-scalant addition, pretreated water is pressurized with boost pumps and passed to the RO skids. Waste concentrate exits the system for disposal and post-treatment of the permeate includes CO2 stripping and the addition of chlorine and caustic. Post-treated water is blended with bypassed water and sent to storage and ultimately distribution.
Original RO Treatment Schematic (Cevaal et al., 1995).
Treatment Type Reverse Osmosis
System Capacity 6.65 MGD (4,600 gpm)
Raw Water Nitrate 11 – 20 mg/L

FINAL REPORT June, 2011Reverse Osmosis (RO) Page 57
Copyright © 2011 American Water Works Association. All Rights Reserved.
Source Water Quality
Nitrate (mg/L N)o Average – 10.6 to 20.4o Minimum – 4.52 to 15.8o Maximum – 17.8 to 25.5
Co-contaminantso TDS: 580 to 1000 mg/L,
RO TDS ~34 mg/L, Finished TDS ~280 mg/L
o Fluoride: 1.3 mg/Lo TOC: < 2 mg/Lo Hardness: 370-480
mg/L as CaCO3
(historically, Cevaal et al., 1995)
Treatment Technology Selection
IX and EDR were also considered and pilot-tested prior to installation of the RO system. RO was selected due to nitrate levels and hardness. IX could have been less costly; however, the lower salt levels in RO concentrate make it possible to discharge waste to the South Platte River. “By selecting RO, the City hoped to actually reduce the salt load on the river with RO since many Brighton residents currently using home ion-exchange softening units would no longer use them” (Cevaal et al., 1995). Biological treatment is also being explored for the treatment of nitrate in the waste brine.

FINAL REPORT June, 2011Reverse Osmosis (RO) Page 58
Copyright © 2011 American Water Works Association. All Rights Reserved.
Treatment System Parameters
Design Capacityo 6.65 MGD of permeate at 80%
recovery (1150 gpm/train) Pretreatment/Post-treatment
o Anti-scalant: King Lee TechnologiesPre Treat Plus 0100 phosphonate
o 5 micron cartridge filters 2.5 inch diameter 90 day replacement
o pH adjustment caustic soda (NaOH) Air stripping (CO2 removal)
Treatment system foot print o Treatment system:
11,000 sq. ft. at installation(Cevaal et al., 1995)
Number of contactorso 2 stages, 5 trainso RO elements/stage:
36 x 18 array 6 membranes/vessel 324 total
Max. Concentration goal for delivered watero 8 mg/L as N, (always produce lower)
Rejection Rateo 95-98% rejectiono Nitrate goal (before blending):
~1 mg/L as N
Flux rate of the RO membranes o 13 gpd/sf
System Manufacturero Hydranautics and Hydrocode
Membrane Typeo CPA2 (no others used in past)
Membrane Lifeo Unknown, none have required
replacement (5 yrs. ago, the manufacturer said the membranes should last 3 more yrs.).
Membrane Cleaningo Clean in Place initiated by time
rather than decrease in flux. Every ~157 million gals treated (~2x/yr)
o Chemicals:Nalco Product and Citric acid
Waste o Discharge via Brine line to South
Platte Rivero Recovery Rate: 80%
Monitoringo Ion chromatography
At Source At Point-of-Exit
o Grab ISE (HACH) At Blending Point At Point-of-Exit
o Testing once per year is required for compliance
Residuals Management
The waste concentrate is continuously discharged via a brine line to the South Platte River. Biological treatment is being explored for the treatment of the waste concentrate. The biological system would be located on the West side of the RO treatment system and would allow for reduction of nitrate in the waste stream. As mentioned above, the use of RO rather than ion exchange was an effort to decrease salt loading to the South Platte River. Historically, Brighton residents used in-home ion exchange units to soften water.
Technology Benefits and Drawbacks
Benefits Consistent treatment performance Ease of operation
Drawbacks Constant generation of waste stream High power consumption

FINAL REPORT June, 2011Reverse Osmosis (RO) Page 59
Copyright © 2011 American Water Works Association. All Rights Reserved.
Treatment Technology Costs
Capital Costs (Total with explanation or component costs)
Operating and Monitoring Equipment:
$8,253,000 (1993) 4MGD RO facility
Annual O & M Costs (Total with explanation or component costs)
Total: $2,873,293.00Membrane: 0Membrane Disposal: 0Brine Disposal or Treatment: 0Chemicals: Approx. $100,000 yearPower: Approx $210,000 year for ROLabor (Hours per Year): 10 hr/day, 7 day/wk2 MGD Thornton treated $3.60/1000 gallonsCOMPLETE Cost (including treatment, distribution, everything)
$3.16/1000 gallons
Additional Information:
The level of certification required for plant operators is Colorado A treatment. During a power outage, there is a pause before the generators start. This required a manual restart of the
system. This system has never produced water exceeding the nitrate MCL and has never had an unplanned
shutdown exceeding one week. The major benefit of the RO system is the rejection rate allowing for removal of regulated contaminants. The most significant disadvantages are the high power consumption and the continuous brine discharge. The operator also noted that there has been a decreasing trend in nitrate levels in their sources.
References
Cevaal, J.N., Suratt, W.B., and Burke, J.E. (1995). “Nitrate removal and water quality improvements with reverse osmosis for Brighton, Colorado.” Desalination, 103, 101-111.
Anderson, D. (July 19, 2010). In-person interview and tour of the facility.Anderson, D. (September 15, 2010). Completed questionnaire.

FINAL REPORT June, 2011Reverse Osmosis (RO) Page 60
Copyright © 2011 American Water Works Association. All Rights Reserved.
System Name: Western Municipal Water District - Arlington DesalterSystem Location: Riverside, CA
PWSID: CA3310049 CASE #8 System Type: Community Water SystemTreatment Type: Reverse Osmosis (RO) and Blending Questionnaire completed by: Joseph Bernosky, Director of EngineeringStartup Date: 1990 strictly for desalting, Upgraded to drinking water treatment in 2002
System Description
The Western Municipal Water District (District) operates a system comprised of seven wells, five of which contain nitrate above the MCL. Three of the nitrate impacted wells are treated by a 6.6 MGD RO facility. The permeate, or treated water, from the RO system is blended with the remaining two wells prior to distribution. The RO and blending facilities are collectively referred to as the Arlington Desalter. Approximately 60% of the total flow is treated by the RO system and the remaining 40% is blended with the treated water. The District targets a nitrate concentration of 5 mg/L as N in the distribution system.
The Arlington Desalter facilities were originally installed in 1990 to address the salt imbalance in the Upper Santa Ana Watershed. High salinity waters withdrawn from the South Arlington Basin were treated by the Arlington Desalter and subsequently discharged to the Santa Ana River for downstream use (and downstream drinking water treatment). The system was upgraded to a drinking water treatment facility in 2002 with the addition of disinfection, a clear well and a pump station used to pump drinking water into the distribution system for the city of Norco, CA.
Source Water Quality
Nitrate (mg/L N)o Average – 17o Minimum – 10o Maximum – 20
Co-contaminantso TDS – 1200 mg/L
Treatment Technology Selection
Due to the original intent of the system and the 2002 conversion for drinking water production, no other technologies were pilot tested prior to the installation of the RO and blending facilities. However, biological treatment of RO bypass water was recently pilot tested with full scale implementation anticipated. A case study about this fixed bed biological pilot study is listed separately.
Treatment Type Reverse Osmosis and Blending
System Capacity 6.6 MGD (4,600 gpm)
Raw Water Nitrate 10 -20 mg/L

FINAL REPORT June, 2011Reverse Osmosis (RO) Page 61
Copyright © 2011 American Water Works Association. All Rights Reserved.
Treatment System Parameters
Design Capacity: 6.6 MGD Pretreatment/Post-treatment
o Anti-scalant: Y2K Anti-scalant Treatment system foot print
o Treatment system: Approximately 7,500 ft2 excluding clear well and pump station
Number Stageso Stage 1-36 vessels each with 6
unitso Stage 2-12 vessels each with 6
units Max. Concentration goal for delivered
watero 5 mg/L as N
Water Recoveryo Original design: 75-76%o Current: 80%
Flux rate of the RO membranes o 16 gpd/ft2
System Manufacturero Hydranautics
Membrane Type o Koch HR400
Membrane Lifeo > 10 years
Membrane Cleaningo Occurs 2 times per yearo Chemicals: Low pH solution,
hydrofluorosilic acid, high pH solution
Waste: The RO concentrate is disposed of offshore via the Santa Ana Regional Interceptor (SARI) brine line
Monitoringo Ion chromatographyo Online nitrate analyzers
Residuals Management
Waste is discharged to the Santa Ana Regional Interceptor (SARI) (Brine Line). The SARI line prevents degradation of natural waters caused by increased salinity. Managed by the Santa Ana Watershed Project Authority (SAWPA), the SARI line is a dedicated interceptor line built to help users meet discharge requirements. In addition to the Arlington Desalter, the SARI line is used by other dischargers including industrial and domestic sources. The District’s contribution to the total flow of the SARI line is approximately 5%. The SARI line carries water to the Orange County Sanitary District for wastewater treatment with ultimate offshore discharge.
Having access to the SARI line for brine disposal is a benefit of this system; however, there have been complications with the SARI line. Tremendous scaling problems in Arlington Desalter’s reach of the SARI line have resulted in the need to address calcium carbonate buildup and to consider additional cleanout points. Due to multiple discharge sources, the SARI line combines waters having very different water quality characteristics. Reactions within the mixed water can vary based on water chemistry. Several cleaning and maintenance options are being considered.
Technology Benefits and Drawbacks
Benefits Reliable Access to SARI line for disposal The treatment potential of the pre-existing
RO system has been maximized through conversion for drinking water treatment
Drawbacks Costly brine disposal Complications with SARI line (scaling,
etc.)

FINAL REPORT June, 2011Reverse Osmosis (RO) Page 62
Copyright © 2011 American Water Works Association. All Rights Reserved.
Treatment Technology Costs
Capital Costs (Total with explanation or component costs)
Total Capital Costs: Unavailable for initial installation in 1990
Annual O&M Costs (Total with explanation or component costs) (2009/2010)
Total: $2,931,228Labor and Overhead: $836,530Outside Services: $200,000Emergency Repairs: $25,000General & Administrative: $85,000Vehicle and Equipment: $9,000SARI Fixed Cost: $151,800Materials and Supplies: $5,500Permits and Fees: $27,000SARI Variable Cost: $470,000Chemicals: $150,000Energy: $971,398
Additional Information
Regarding water recovery, the original design recovery rate was 75-76%. With modifications to anti-scalant use, the recovery rate increased to 78% and then to the current operational water recovery rate of 80%. To further improve the water recovery rate, additional testing is anticipated which will require engineering work and a cost-benefitanalysis.
Currently used membranes are 10 years old and are still performing adequately with respect to operational parameters (flux rate, rejection rate, etc.). The District has budgeted for membrane replacement in this fiscal year; however, due to adequate performance, the current membranes may be used for an additional year. Membranes are actually attaining better water recovery than manufacturer specifications. Membrane life is also exceeding initial expectations.
Sources*
Bernosky, J. (November 5, 2010). Personal communication.Bernosky, J. (October, 2010). Completed questionnaire.
*Unpublished sources used in the development of the case studies are not reflected in the References section of this report.

FINAL REPORT June, 2011Reverse Osmosis (RO) Page 63
Copyright © 2011 American Water Works Association. All Rights Reserved.
System Name: Chino Basin Desalter Authority (CDA) – Chino I DesalterSystem Location: Chino, CA
PWSID: CA31610075CASE #9 System Type: Community Water SystemTreatment Type: Reverse Osmosis (RO) and Ion Exchange (IX)Questionnaire completed by: Timothy Mim Mack, CDA Coordinator, City of OntarioRené Cruz, Engineering Project Manager, Project Partners Inc., serving the (CDA).Startup Date: RO in 2000, IX added in 2005
System Description
The Chino Basin Desalter Authority (CDA) in southern California is a conglomerate of the following agencies: Inland Empire Utilities Agency (IEUA), Jurupa Community Services District (JCSD), City of Chino, City of Chino Hills, City of Ontario, City of Norco, Santa Ana River Water Company (SARWC), and Western Municipal Water District (WMWD). The CDA drinking water treatment facilities include two desalters: Chino I Desalter (discussed here) and the Chino II Desalter (discussed in the next case study) to address high TDS levels as well as nitrate contamination. The Chino I Desalter operates 14 source wells, 11 of which have raw nitrate levels well above the MCL. Treatment consists of a combination of RO, conventional anion exchange and blending. Sixty percent of total flow is treated with RO, 27% with IX and 13% passes only through VOC/Air-stripping prior to blending. The RO system was installed in 2000 and the IX system was added in 2005.
Source Water Quality
Nitrate (mg/L N) (of nitrate impacted wells)
o Average – ~32-65o Minimum – ~24-62o Maximum – ~35-76
Co-contaminantso TDS: 1100 mg/L
Treatment Technology Selection
RO and IX were selected because combined they were determined to be the best mode of technology to adequately treat the high-TDS, high-nitrate source water. No other technologies were pilot-tested or considered prior to the installation of the system.
Treatment Type Reverse Osmosis,
Ion Exchange
And Blending
System Capacity RO: 4940 gpm
IX: 3400 gpm
Raw Water Nitrate 32-65 mg/L as N

FINAL REPORT June, 2011Reverse Osmosis (RO) Page 64
Copyright © 2011 American Water Works Association. All Rights Reserved.
Treatment System Parameters
Design Capacity o RO: 4940 gpmo IX: 3400 gpm
Pretreatmento Anti-scalant: threshold inhibitoro Filtration: 1 micron pre-filterso pH adjustment: sulfuric acid
Post-treatmento pH adjustment: sodium hydroxide
Treatment system foot print o RO system: 143’ X 80’o IX system: 190’ X 60’
Number of contactors:o 4 trains, 2 stages/traino RO elements/stage:
stage 1: 196 elements stage 2: 98 elements
Ion exchange pressure vesselso Number of vessels: 4o Diameter of vessels: 12’o Height of vessels: 11’
Design Loading Rate: 1.66 gpm/ft2
Max. nitrate concentration goal for delivered water: 7.75 mg/L as N
Nitrate concentration goal for the treatment system (before blending): 2.15 mg/L as N
RO recovery rate: 80% RO membrane flux rate: 0.9 gfd/psi
System Manufacturer:o RO: Code-lineo IX: Hungerford and Terry
Membrane Type: Dow 400 BW-30 Membrane Life: 5 years Membrane Cleaning:
o Flux decrease initiates CIPo Every 6 montho Chemicals: for pH adjustment
based on manufacturer recommendation
Resin Type: Rohm and Hass Amberjet 4400 CL SBA
Volume treated prior to regenerationo 700,000 gallonso Regeneration once every 12 hrs
Salt consumption:75 tons per week Volume of brine/backwash:
o 53,000 gallonso 92.4 % water efficiency
Resin life: Has not been replaced (online for 5 years)
Monitoring:o Online nitrate analyzers
Treatment train Blending point POE
o Laboratory sampleso Quarterly testing for NDMA
Residuals Management
Concentrate/brine is discharged into a regional brine line called the Inland Empire Brine Line (IEBL) and formerly known as the Santa Ana Regional Interceptor (SARI).
Technology Benefits and Drawbacks
Benefits RO provides better removal IX is inexpensive IX has very low energy demands
Drawbacks RO is expensive High waste rate of RO IX does not address TDS Resin replacement will be costly

FINAL REPORT June, 2011Reverse Osmosis (RO) Page 65
Copyright © 2011 American Water Works Association. All Rights Reserved.
Treatment Technology Costs
Capital Costs (Based on projected costs in 2004)
Treatment Plant Expansion Total (5000 afy expansion):
$6,379,530
Ion Exchange Treatment (4.9 MGD): $4,031,900Onsite Modifications $1,735,000SARI Discharge Upgrades & Storm Drain:
$612,630
Additional SARI Capacity Purchase (not included in above total):
$4,140,000
O & M Costs(Based on CDA 2010/11 Budget, for complete plant operation, not just the treatment system)
Total: $7,496,315 Chemicals: $662,257Electricity – Plant Total: $2,843,000Operating Fees: $1,353,439 (includes SARI fees, permits and other fees)Labor ($): $1,370,698
Additional Information
The RO treatment system is described as falling short of expectations with respect to the high waste rate. 15% of all incoming water is sent to the brine line and delivered to a treatment plant outside of the local watershed at the Orange County Sanitation District.
Plant shutdown has been required in the past due to high or low pressure, high nitrate and high TDS. In the event of insufficient treatment and the production of water in exceedance of an MCL, the plant has a
MOV that closes automatically, sending water to a storm drain.
Sources*
Listed costs are based on:Presentation: “Chino I Desalter Expansion & Chino II Desalter Project Update.” (2005). “Fiscal Year 2010/11 Budget Adoption.” (2010). Chino Basin Desalter Authority.
*Unpublished sources used in the development of the case studies are not reflected in the References section of this report.

FINAL REPORT June, 2011Reverse Osmosis (RO) Page 66
Copyright © 2011 American Water Works Association. All Rights Reserved.
System Name: Chino Basin Desalter Authority (CDA) – Chino II DesalterSystem Location: Mira Loma, CA
PWSID: CA3310083CASE #10 System Type: Community Water SystemTreatment Type: Reverse Osmosis (RO) and Ion Exchange (IX)Questionnaire completed by: Timothy Mim Mack, CDA Coordinator, City of OntarioRené Cruz, Engineering Project Manager, Project Partners Inc., serving the (CDA).Startup Date: 2006
System Description
The Chino Basin Desalter Authority (CDA) in southern California is a conglomerate of the following agencies: Inland Empire Utilities Agency (IEUA), Jurupa Community Services District (JCSD), City of Chino, City of Chino Hills, City of Ontario, City of Norco, Santa Ana River Water Company (SARWC), and Western Municipal Water District (WMWD). The CDA drinking water treatment facilities include two desalters: Chino I Desalter (discussed above) and the Chino II Desalter (discussed here) to address high TDS levels as well as nitrate contamination. The Chino II Desalter operates 8 source wells, all of which have raw nitrate levels well above the MCL. Treatment consists of a combination of RO, conventional anion exchange and blending. The combined RO/IX system was installed in 2006.
Source Water Quality
Nitrate (mg/L N) (of nitrate impacted wells)
o Average – ~15-48o Minimum – ~11-41o Maximum – ~17-56
Co-contaminantso TDS
Treatment Technology Selection
RO and IX were selected because combined they were determined to be the best mode of technology to adequately treat the high-TDS, high-nitrate source water. No other technologies were pilot-tested or considered prior to the installation of the system.
Treatment Type Reverse Osmosis,
Ion Exchange
And Blending
System Capacity RO: 4167 gpm
IX: 2778 gpm
Raw Water Nitrate 15-48 mg/L as N

FINAL REPORT June, 2011Reverse Osmosis (RO) Page 67
Copyright © 2011 American Water Works Association. All Rights Reserved.
Treatment System Parameters
Design Capacity o RO: 4167 gpmo IX: 2778 gpm
Pretreatmento Anti-scalant: threshold inhibitoro Filtration: 1 micron pre-filterso pH adjustment: sulfuric acid
Post-treatmento pH adjustment: sodium hydroxide
Treatment system foot print o RO system: 30’X 188’o IX system: 30’ X 188’o Total system: 60’ X 300’
Number of contactors:o 3 trainso 48 vessels/traino RO elements/stage:
7 elements per stage Ion exchange pressure vessels
o Number of vessels: 4 Design Loading Rate: 10.1 gpm/ft2
Max. nitrate concentration goal for delivered water: 5.4 mg/L as N (goal), 7.54mg/L as N(max.)
Nitrate concentration goal for the treatment system (before blending): 0.86 mg/L as N
RO membrane flux rate: 0.30 – 1.70 gfd/psi
System Manufacturer:o RO: PROTEC Bekaerto IX: Hungerford and Terry
Membrane Type: Dow/Filmtec Model BW30-400
Membrane Life: ~5 years Membrane Cleaning:
o Flux decrease initiates CIPo Every 6 months to 1X per yearo Chemicals: King Lee (anti-
scalant), high/low pH, Silica Cleaner
Resin Type: Rohm and Hass Amberjet 4400 CL SBA
Volume treated prior to regenerationo 0.8-1.4 MGDo Regeneration is based on nitrate
levels Salt consumption:50 tons per week Volume of brine/backwash:
o NA Resin life: NA Monitoring:
o Online nitrate analyzers At source Blending point POE
o Laboratory samples
Residuals Management
Concentrate/brine is discharged to an industrial sewer that drains to the Inland Empire Brine Line (IEBL). Waste is transported 45 miles to the Orange County Sanitation District.
Technology Benefits and Drawbacks
Benefits RO works well for nitrate removal IX is less expensive
Drawbacks RO is expensive IX does not accomplish contaminant
removal as well as RO

FINAL REPORT June, 2011Reverse Osmosis (RO) Page 68
Copyright © 2011 American Water Works Association. All Rights Reserved.
Treatment Technology Costs
Capital Costs (Based on projected costs in 2004)
Treatment Plant Total (10400 AFY): $19,171,837Ion Exchange Treatment: $4,346,900Chino II Desalter: $14,284,500RO Membranes: $540,437Ion Exchange Land (not included in above total):
$1,730,138
Ion Exchange SARI Fee (not included in above total):
$10,105,000
O & M Costs(Based on CDA 2010/11 Budget, for complete plant operation, not just the treatment system)
Total: $6,111,799Chemicals: $615,000Electricity – Plant Total: $2,331,000Operating Fees: $706,154 (includes SARI fees, permits and other fees)Labor ($): $1,133,615
Additional Information Operator certification levels range from T-3 to T-5. Plant shutdown has been required in the past due to chemical pump failure and high clearwell. Overall the combined system is described as working well but at a high price.
Sources*
Listed costs are based on:Presentation: “Chino I Desalter Expansion & Chino II Desalter Project Update.” (2005). “Fiscal Year 2010/11 Budget Adoption.” (2010). Chino Basin Desalter Authority.
*Unpublished sources used in the development of the case studies are not reflected in the References section of this report.

FINAL REPORT June, 2011Electrodialysis (ED/EDR/SED) Page 69
Copyright © 2011 American Water Works Association. All Rights Reserved.
3.3 Electrodialysis (ED/EDR/SED)
Competitive with RO, the use of Electrodialysis (ED) including electrodialysis reversal (EDR) and
selective electrodialysis (SED) in potable water treatment (Figure 3-9) has increased in recent
years, offering the potential for improved water recovery, the ability to selectively remove
nitrate ions, and the minimization of chemical and energy requirements (Kneifel & Luhrs, 1988;
Banasiak & Schafer, 2009; Hell et al., 1998; Koparal & Ogutveren, 2002; Midaoui et al., 2002;
Sahli et al., 2008; and Kapoor & Viraraghavan, 1997).
Figure 3-9Electrodialysis Reversal Schematic.
Nitrate removal is accomplished by passing an electrical current through a series or stack of
anion and cation exchange membranes, resulting in the movement of ions from the feed
solution to a concentrated waste stream. Illustrated in Figure 3-10, nitrate ions (and other
anions) move through the anion exchange membrane toward the anode. Continuing toward
the anode, nitrate is rejected by the anion-impermeable cation exchange membrane and
trapped in the recycled waste stream. Cations can be removed in a similar manner, migrating
toward the cathode through the cation exchange membrane and rejected by the cation-
impermeable anion exchange membrane. Nitrate selective membranes allow for treatment
without significantly altering the balance of other ions in the water.

FINAL REPORT June, 2011Electrodialysis (ED/EDR/SED) Page 70
Copyright © 2011 American Water Works Association. All Rights Reserved.
Figure 3-10 Illustration of Electrodialysis Membrane Stack.
The electrical current is passed through the system with the migration of ions across the
membranes. For every anion that leaves a compartment, a cation of equivalent charge also
leaves, maintaining the charge balance in each compartment. Across the system, the flow of
electrons, moving from the cathode to the anode (negative to positive), is governed by the
movement of ions through the membrane stack and by the reactions in the electrode
compartment. Small levels of gaseous by-products must be removed. Electrolysis of water
generates oxygen at the anode and hydrogen gas at the cathode and chloride can be reduced at
the anode, producing chlorine gas (AWWA, 1995). The electrode compartment is rinsed to
restore ions for current transfer and to remove unwanted reaction products.
Requiring constant electrical current and low-pressure water, ED has inherent energy demands.
However, voltage adjustment enables selective demineralization. “Plants can be designed to
remove from 50 to 99 percent of source water contaminants or dissolved solids. Source water

FINAL REPORT June, 2011Electrodialysis (ED/EDR/SED) Page 71
Copyright © 2011 American Water Works Association. All Rights Reserved.
salinities of less than 100 mg/L up to 12,000 mg/L TDS can be successfully treated to produce
finished water of less than 10 mg/L” (AWWA, 1995).
A detailed case study of an EDR plant in Spain is included in section 3.3.6.
3.3.1 Electrodialysis - Design Considerations
Table 3-8, summarizes key design considerations in the application of ED to nitrate removal
from potable water.

FINAL REPORT June, 2011Electrodialysis (ED/EDR/SED) Page 72
Copyright © 2011 American Water Works Association. All Rights Reserved.
Table 3-8 Summary of Design Considerations for Electrodialysis/Electrodialysis Reversal.
Membranes Use of anion and cation exchange membranes Selective membranes
o Monovalent versus multivalent Consider water recovery and frequency of cleaning
Pretreatment Lower pretreatment requirements because this is not direct filtration EDR systems can avoid or limit chemical use Prevention of scaling and fouling
o Filtration to remove suspended solidso Treatment for iron and manganese removalo Water softening or use of anti-scalants or acid to prevent scaling
Post-Treatment pH adjustment to avoid corrosion (if acid used to prevent scaling) Disinfection
Chemical Usage Possible pH adjustment (acids and bases) Possible anti-scalants Possible cleaning chemicals
O&M Highly automated Frequency of membrane cleaning depends on water quality and membrane used
o Polarity reversal (electrodialysis reversal) multiple times per hour minimizes fouling
o ED systems can require weekly cleaning Management of chemicals and prefiltration system
o Including electrode compartment rinse solution Waste storage and disposal High monitoring demands Potentially higher operator demand than IX and RO, due to system complexity
System Components
Maximize water recovery while minimizing energy use Key aspects of the system are pretreatment requirements, the number and
configuration of electrodialysis stacks and stages, membrane selection and configuration, operating voltage and pressure, reversal frequency (for EDR), gas venting of the anode and cathode compartments, disinfection, “brine loop, electrode rinse loop, concentrate discharge, and dosing station” (Hell et al., 1998).
Waste Management and Disposal
Concentrate disposal of greatest concern for inland systemso Close proximity to coastal waters is beneficial for brine/concentrate disposal
Management options include sewer or septic system, reuse for irrigation, drying beds, trucking off-site, coastal pipeline, deep well injection and advanced treatment
Disposal options can be limited by waste brine/concentrate water quality (e.g.,volume, salinity, metals and radionuclides)
Optimization of recycling and treatment of waste concentrateLimitations Need to prevent membrane scaling and fouling
o Hardness, iron, manganese and suspended solids Disposal of waste concentrate High system complexity
3.3.1.1 Water Quality
Membrane life, cleaning frequency, and pretreatment needs are dependent on feed water
quality. Pretreatment may be needed for iron levels above 0.3 mg/L, manganese levels above
0.1 mg/L, and hydrogen sulfide levels exceeding 0.3 mg/L (WA DOH, 2005). Specifications for

FINAL REPORT June, 2011Electrodialysis (ED/EDR/SED) Page 73
Copyright © 2011 American Water Works Association. All Rights Reserved.
an example EDR system from GE indicate feed water turbidity levels should be < 0.5 NTU with
typical TDS levels between 100 and 3,000 mg/L (maximum 12,000 mg/L) (GE, 2008). SDI limits
are generally higher for EDR than for RO, with typical limits of 12 and 4-5, respectively (Elyanow
& Pereschino, 2005). Softening may be necessary to reduce hardness, while prefiltration
diminishes suspended solids. The potential for scaling increases with increasing TDS and is
exacerbated by increased solids precipitation with higher water recovery goals. To minimize
fouling/scaling, membranes can be treated with anti-scaling chemicals and cleaned with acid
(AWWA, 1995). However, in comparison with other membrane processes, fouling is minimal
because the membrane is subjected to the transfer of ions (directed by the electrical current),
rather than the transfer of the entire feed stream. Unfortunately, because ED does not serve as
a filter (the water does not pass through the membrane), ED fails to remove microbial
contamination (AWWA, 1995). Prefiltration in pretreatment and disinfection in post-treatment
address these concerns.
To further minimize fouling and thus the need for chemical addition, the polarity of the system
can be reversed with electrodialysis reversal (EDR). By reversing the polarity (and the solution
flow direction) several times per hour, ions move in the opposite direction through the
membranes, minimizing buildup and the need for chemical addition to control scaling.
Biological fouling concerns are lower than other separation processes due to development of
membranes that are “more organic resistant and chlorine tolerant” (Elyanow & Persechino,
2005). ED depends on the transfer of an electrical current and is therefore more efficient when
used for brackish waters. In low conductivity feed waters, the ion removal efficiency declines.
In contrast to conventional RO, EDR is unaffected by silica.
3.3.1.2 System Components and Site Considerations
ED and EDR systems are operated in stages. Water recovery can be improved with stages
operated in series while capacity can be increased with stages operated in parallel. Key aspects
of the system are pretreatment requirements, the number and configuration of electrodialysis
stacks and stages, membrane selection and configuration, operating voltage (based on desired
removal), reversal frequency (for EDR), gas venting of the anode and cathode compartments,
FINAL REPORT June, 2011Electrodialysis (ED/EDR/SED) Page 74
Copyright © 2011 American Water Works Association. All Rights Reserved.
disinfection, “brine loop, electrode rinse loop, concentrate discharge, and dosing station” (Hell
et al., 1998).
The membranes used in ED/EDR are anion and cation exchange membranes. Membranes have
been designed for selective removal based on valency (monovalent versus multivalent) to
screen for particular constituents (AWWA, 1995). Alternating different selective membranes in
the membrane stages can avoid precipitation in the concentrate stream. For example, one
stage can remove calcium and a second stage can remove sulfate (to an alternate concentrate
stream), this prevents calcium sulfate precipitation (AWWA, 1995).
3.3.1.3 Residuals Management and Disposal
Waste management requirements are similar to RO and IX; however, the burden of disposal in
ED/EDR systems is not as significant due to higher water recovery, selective removal, and the
lack of direct filtration (Reahl, 2006). Disposal options include sewer, septic system, drying
beds, off-site trucking, coastal pipeline, deep well injection, reuse for irrigation, and advanced
treatment. Important water quality characteristics of the concentrate (e.g., volume, salinity,
metals and radionuclides) can affect the feasibility and costs of disposal options. Several
combined configurations of interest are discussed below in a section devoted to Brine
Treatment Alternatives and Hybrid Treatment Systems.
3.3.1.4 Maintenance, Monitoring and Operational Complexity
Although ED/EDR systems are amenable to automation, operator demands can be higher than
other separation processes as “daily monitoring of differential pressure and other operational
parameters should be performed” (WA DOH, 2005, pg. 30). While ED systems have greater
pretreatment demands and can require membrane cleaning once a week, EDR systems
minimize pretreatment demands and scaling issues, but can still have higher maintenance
demands than RO, due to the complexity of the system (Kapoor & Viraraghavan, 1997).
Appropriate gas venting is important to avoid hazardous conditions (WA DOH, 2005).
Membrane life will depend on water quality and pretreatment measures. However, due to the
lack of direct filtration and operation under low pressure, membranes are long lasting, and do
not require frequent replacement.

FINAL REPORT June, 2011Electrodialysis (ED/EDR/SED) Page 75
Copyright © 2011 American Water Works Association. All Rights Reserved.
3.3.2 Electrodialysis - Cost Considerations
For the efficient operation of an ED system, the fundamental objective is to maximize water
recovery with the minimum amount of energy and chemical usage, while meeting necessary
potable water guidelines. Factors affecting system cost include facility size, source water
quality (including nitrate concentration and other contaminants), target effluent nitrate
concentration, and disposal options.
Capital costs for ED/EDR systems include land, housing, piping, storage tanks, O&M equipment,
cation and anion exchange membranes, preliminary testing (pilot studies), permits, and
training. O&M costs include membrane replacement, membrane disposal, concentrate disposal
or treatment, chemical use (limited – anti-scalant etc.), repair, maintenance, power, and labor.
Very little published cost information from existing ED systems used for nitrate removal is
available in the literature, due to the limited number of full-scale systems. Costs have been
adjusted to 2010 dollars, unless indicated otherwise. Costs of ED systems are most comparable
to RO. However, in some instances, ED can be the less costly choice due to the greater
pretreatment and post-treatment demands (higher chemical use and post-treatment pH
adjustment) of RO (Reahl, 2006). EDR can be chosen over RO when high water recovery is a
priority, especially if land must be purchased for concentrate ponds. “New technology has also
reduced the capital and operating cost of EDR nitrate removal by increasing the hydraulic
efficiency of the EDR stacks and pumping system” (Elyanow & Persechino, 2005). In a technical
paper from GE Water & Process Technologies (the primary supplier of EDR systems in the U.S.),
Werner & Gottberg (2005) compared O&M costs of an electrodialysis plant in Suffolk, VA (not
specifically for nitrate treatment) and a conventional surface water treatment plant (Table 3-9).
Based on O&M costs, the electrodialysis plant was cost competitive with the conventional
surface water treatment plant (Werner & Gottberg, 2005). It is unclear how disposal costs
were included in this study. High water recovery in comparison with other removal processes
and disposal of waste concentrate to a nearby estuarine tributary would maintain low disposal
costs (Werner & Gottberg, 2005). According to Ameridia, the American division of Eurodia
Industrie (a manufacturer of EDR systems), the capital investment for a nitrate treatment EDR
unit for a ~0.5 MGD system (in 2005) was $475,000 or $0.94 per gallon of daily capacity

FINAL REPORT June, 2011Electrodialysis (ED/EDR/SED) Page 76
Copyright © 2011 American Water Works Association. All Rights Reserved.
($559,653 or $1.11 in 2010 dollars, respectively) (Ameridia). However, additional capital costs
are likely not included in this figure.
Table 3-9 Comparison of EDR and Conventional Surface Water Treatment O&M Costs (from Werner & Gottberg, 2005).
O&M Category EDR (/1000 gallons) Conventional (/1000 gallons)Fixed $0.72 ($1.07 adjusted) $0.72 ($1.07 adjusted)Professional Services $0.06 ($0.09 adjusted) $0.05 ($0.07 adjusted)Chemicals $0.02 ($0.03 adjusted) $0.13 ($0.19 adjusted)Utilities $0.21 ($0.31 adjusted) $0.25 ($0.37 adjusted)Maintenance $0.17 ($0.25 adjusted) $0.17 ($0.25 adjusted)Membrane Replacement $0.23 ($0.34 adjusted) $0.00Production (1997) 827,339,440 gallons 390,953,560 gallonsTotal O&M Cost $1.41 ($2.09 adjusted) $1.32 ($1.96 adjusted)Costs adjusted from 1998 dollars to 2010 dollars.
The listed cost information is provided as an approximate range of costs for specific facilities.
Costs for implementing ED may be very different from those listed here. A thorough cost
analysis of design parameters for specific locations would be required for accurate cost
estimation.
3.3.3 Electrodialysis - Selected Research
Much research on ED has focused on desalination applications. Table A.3 of the Appendix is a
list of recent studies relevant to nitrate removal from potable water and several examples of ED
application. Research is focused on the influence of co-contaminants on system performance
and improvements in exchange membranes, including nitrate selectivity.
3.3.4 Electrodialysis - Summary of Advantages and Disadvantages
A summary of advantages and disadvantages of ED in comparison with other treatment options
is listed in Table A.6 of the Appendix. Advantages of ED/EDR systems include limited to no
chemical usage, long lasting membranes (infrequent replacement), selective removal of target
species, flexibility in removal rate through voltage control, better water recovery (lower waste
volume), feasible automation, and multiple contaminant removal (Hell et al., 1998; AWWA,
1995; WA DOH, 2005; and Prato & Parent, 1993). With the ability to selectively remove
multiple contaminants, ED/EDR systems can be used to address the following constituents: TDS,

FINAL REPORT June, 2011Electrodialysis (ED/EDR/SED) Page 77
Copyright © 2011 American Water Works Association. All Rights Reserved.
total chromium, chromium-6, arsenic, perchlorate, sodium, mercury, chloride, copper, sulfate,
uranium, fluoride, nitrate/nitrite, iron, selenium, hardness, barium, bicarbonate, cadmium and
strontium (AWWA, 1995 and GE, 2010). Using current reversal, EDR offers additional
advantages, improving system performance by “detaching polarization films, breaking up
freshly precipitated scale or seeds of scale before they can cause damage, reducing slime
formations on membrane surfaces, reducing problems associated with the use of chemicals,
and cleaning electrodes with acid automatically during anodic operation” (AWWA, 1995).
Additionally, in comparison with RO systems, EDR can treat waters with higher SDI, silica and
chlorine levels (Elyanow & Persechino, 2005).
Disadvantages of ED/EDR systems include the possible need for pretreatment to prevent
membrane scaling and fouling, waste disposal, high maintenance demands, costs (comparable
to RO systems), the need to vent gaseous by-products, the potential for precipitation (especially
for high water recovery), high system complexity, and limited manufacturers with U.S.
experience (e.g., GE is the primary source of EDR systems for drinking water in the U.S.).
Additionally, unlike RO, ED does not remove uncharged constituents in the water.
3.3.5 Modifications to Electrodialysis
3.3.5.1 Selective Electrodialysis (SED)
Since 1997, selective electrodialysis (SED) has been successfully implemented, providing high
quality potable water throughout Israel and reducing national water costs by 55%. Developed
by Shikun & Binui, formerly Nitron, Ltd., SED offers high water recovery (up to 95%), thereby
minimizing waste volume (Nitron, 2010). The SED system is accepted by the EPA as a nitrate
treatment option for large plants (Nitron, 2009). While similar to traditional ED processes, SED
utilizes nitrate selective membranes which have been shown to increase operational
performance when used for nitrate treatment.
The nitrate selective membranes used in the SED process have been shown to remove up to
70% of nitrate from solution. At the same time, sulfate ions and carbonate ions, which have a
tendency to cause scaling issues in the concentrate stream of traditional ED/EDR and RO
technologies, are more readily rejected by the nitrate selective membranes used in the SED

FINAL REPORT June, 2011Electrodialysis (ED/EDR/SED) Page 78
Copyright © 2011 American Water Works Association. All Rights Reserved.
process. As a result, the scaling potential is reduced in the concentrate stream. Since scaling
problems are minimized, membrane cleaning frequency, maintenance costs, and down time are
reduced compared to traditional EDR installations. Another important aspect of membrane
selectivity is the energy efficiency of the process. Energy efficiency is related to the extent of
ion transfer in ED/EDR and SED technologies. In traditional ED/EDR energy use is less focused,
resulting in the removal of many ions, including ions that do not need to be addressed. SED
specifically targets nitrate ions, avoiding energy use for the removal of non-target ions and
improving energy efficiency.
Pretreatment can be limited to filtration, energy efficiency is maximized due to low pressure
operation (2-4 bars), chemical use is limited to concentrate treatment, and low maintenance
demands are possible due to automation, remote monitoring and control, and infrequent
cleaning. In the SED process there is no change in the pH of the product water. This avoids the
need for pH adjustment or remineralization in post-treatment (Nitron, 2009, 2010).
Membranes are cleaned in place (CIP) for 1 hour every 4-6 months and membrane life is
typically 7-10 years (Nitron, 2010). Additional advantages of SED include constant membrane
performance, no chemical contact with potable water, the simplicity of the system consisting of
pre-filtration and membrane stacks (UV can be added for disinfection), and a small footprint
(Nitron, 2009b). Potential drawbacks of SED include the lack of full-scale application in the U.S.
for nitrate removal from drinking water and, unlike RO, ED does not remove uncharged
constituents in the water.
A detailed case study of the use of SED for nitrate removal at locations in Israel is included in the following section.
3.3.6 Electrodialysis - Case Studies
The following case studies provide detailed information on the design and operation of full-scale
EDR and SED treatment plants used for nitrate removal.

FINAL REPORT June, 2011Electrodialysis (ED/EDR/SED) Page 79
Copyright © 2011 American Water Works Association. All Rights Reserved.
System Name: Gandia EDRSystem Location: Valencia, Spain
CASE #11 System Type: NA Treatment Type: Electrodialysis Reversal (EDR)Questionnaire completed by: GE Water & Process TechnologiesStartup Date: 2007
System Description
Gandia is a tourist area on the Mediterranean coast of Spain. The area sees peak demand during the summer months when the population almost triples. Spanish Legislature released royal Decree 140/2003 which changed the nitrate limit to 50 mg/L as nitrate (11.3 mg/L as N). This new law required treatment of the existing system to achieve the new nitrate limits. Additionally, the existing well systems had deteriorated over time, forcing the municipality to find alternate wells to feed the community.
Upon analysis of the wells (old and new), it was determined that the nitrate levels were too high to meet the drinking water standard. The well samples had up to 80 mg/L as nitrate(18.1 mg/L as N). Treatment was necessary to produce acceptable levels of nitrate in the product water. An evaluation was conducted and EDR was selected as the technology of choice for the Gandia treatment plants. EDR offered high recovery while effectively reducing the nitrate levels below 25 mg/L as nitrate (5.6 mg/L as N).
EDR was piloted on the wells to verify the nitrate removals and operating cost estimates for power requirements and chemical consumption. The pilot study was successful, and the final systems were designed around 90% water recovery with the overall nitrate removal of 73%.
Source Water Quality
Nitrate (mg/L N)o < 80 mg/L as NO3
Treatment Type Electrodialysis Reversal
System Capacity 2 systems at 4.7 MGD each
Raw Water Nitrate 18 mg/L as N

FINAL REPORT June, 2011Electrodialysis (ED/EDR/SED) Page 80
Copyright © 2011 American Water Works Association. All Rights Reserved.
Treatment Technology Selection
EDR, Selective ED, and Reverse Osmosis were considered for treating the Gandia Wells. EDR was eventually selected for the high recovery and reduced operating costs compared to RO. SED was ruled out based on the high capital costs of the system.
Treatment System Parameters
Design Capacity o 3,260 gpm
EDR Systemo No. of modules: 4o Lines per module: 5o Stages per line: 2
Water recovery rate:o 94.3%
Water Quality Results
The table below summarizes the water quality of the raw water, finished water, concentrate stream, and the total waste from the Gandia EDR facility. Total waste includes concentrate blowdown, electrode waste, and off-spec product from the system.
Ion Raw Water
Treated Water
PercentRemoval
ConcentrateStream
Total Waste
Ca 82 24.9 70% 772.6 544.3
Mg 24 8.3 65% 213.7 151.0
Na 23 10 57% 180 128.1
K 1.0 0.3 70% 9.2 6.5
HCO3 250 99.1 60% 2074.1 1471.2
SO4 58 12.7 78% 605.2 424.4
Cl 29 7.5 74% 289.3 203.3
NO3 60 16.6 72% 584.4 411.1
TDS 527 179.3 66% 4728.6 3339.8
pH 7.5 7.1 8.3 8.1

FINAL REPORT June, 2011Electrodialysis (ED/EDR/SED) Page 81
Copyright © 2011 American Water Works Association. All Rights Reserved.
Technology Benefits and Drawbacks
Benefits EDR membranes are chlorine tolerant,
providing means to control biological growth.
Relatively low operational expendituresMembrane life expectancy is 15 years.Low chemical consumption compared to other technologies.Lower energy consumption compared to RO.
High water recovery, small concentrate stream for disposal compared to other technologies.
Drawbacks Higher capital cost than RO System footprint larger than competitive
technologies
Operating Costs
Capital costs for the EDR system were not provided.
O & M Costs (Total with explanation or component costs)Unit Cost
Labor: $/1,000 gal 0.17
Energy: $/1,000 gal 0.15
Maintenance: $/1,000 gal 0.03
Chemicals: $/1,000 gal 0.10
Consumables: $/1,000 gal 0.19
Overhead: $/1,000 gal 0.04
Total: $/1,000 gal 0.67
Operational Notes
Operating costs were based on estimates prior to plant start-up. After four years of operating, the plant has not replaced any membranes. In 2010, another facility (L’Eliana) was commissioned in the Valencia area for 2.9 MGD production rate for nitrate removal using the EDR technology.
Sources*
“Nitrate and Hardness Removal with Electrodialysis Reversal (EDR) in Gandia, (Valencia, Spain)” by Vicent Sarrió Cháfer, Javier Sanchís Carbonell, Juan Carlos de Armas Torrent
*Unpublished sources used in the development of the case studies are not reflected in the References section of this report.

FINAL REPORT June, 2011Electrodialysis (ED/EDR/SED) Page 82
Copyright © 2011 American Water Works Association. All Rights Reserved.
System Name: Weizmann InstituteSystem Location: Rechovot, Israel
CASE #12 System Type: NA Treatment Type: Selective Electrodialysis (SED)Questionnaire completed by: Shikun & Binui Environmental GroupStartup Date: 2008
System Description
The Weizmann Institute of Science(Institute), located in Rechovot, Israel, is one of the top-ranking multidisciplinary research institutions in the world. In 2007, the nitrate MCL in the Israeli National drinking water regulations changed from 90 mg/L (20.3 mg/L as N) to 70 mg/L (15.8 mg/L as N). Because of that change, two of the Institute's wells were removed from the drinking water supply and the Institute had to rely on external water suppliers. Over time, municipal and national water costs increased. The Institute’s management looked for solutions to solve nitrate problems and enable them to reopen the Institute's wells.
Prior to treatment the wells were used for potable purposes and the Institute’s irrigation needs. Selective Electrodialysis (SED) was identified as the Institute’s most appropriate treatment technology. A SED system was implemented for the 310 gpm well. The Institute opted for treatment of one well and uses the second well as a dedicated irrigation supply source. The nitrate enriched concentrate from the SED process is fed into the non-potable irrigation system where the nitrate enhances plant growth.
SED has been successfully implemented, throughout Israel since 2007. Developed by Nitron, Ltd., SED offers high water recovery (up to 95%), thereby minimizing waste volume. Pretreatment can generally be limited to filtration, energy efficiency is maximized due to low pressure operation (30-60 psi), chemical use is limited to concentrate treatment (no need for chemical addition to feed or product water), and low maintenance demands are possible due to automation, remote monitoring and control and infrequent cleaning. Membranes are cleaned in place (CIP) for 1 hour every 4-6 months and membrane life is typically 7-10 years.
Source Water Quality
Nitrate (mg/L N)o Average – 19o Minimum – 19o Maximum – 20
Treatment Technology Selection
SED and RO were considered for treating the Weizmann Institute Well. A 10 year life cycle cost analysis that included capital and operations costs identified SED as the more cost effective solution.
Treatment Type Selective Electrodialysis
System Capacity 310 gpm
Raw Water Nitrate 19 – 20 mg/L

FINAL REPORT June, 2011Electrodialysis (ED/EDR/SED) Page 83
Copyright © 2011 American Water Works Association. All Rights Reserved.
Treatment System Parameters
Design Capacity o 310 gpm
Pretreatmento Cartridge filtration
Post-treatmento Chlorination o Acid addition (pH 4.5 -5) to
concentrate to prevent the precipitation of calcium carbonate and calcium sulfate in the concentrate cells
Treatment system foot print o Treatment system: 8’ x 5’o Building footprint: Butler
building - 50’ x 13’ as per client request
Bed volumes prior to regenerationo 345-470 BV (approximately
220,000-300,000 gallons treated) Water recovery rate:
o 94.3% SED unit information:
o Number of SED units: 1 o Membrane pairs: 240o 59% Nitrate reductiono 30% TDS reductiono Energy consumption: 2.3
KWh/1,000 gal Monitoring:
o Online nitrate analyzero Laboratory nitrate sampleso Online pH meterso Online turbidityo Online conductivity meters
Water Quality Results
The table below summarizes the water quality of the raw water, finished water, and concentrate stream from the Weizmann Institute.
Ion Raw Water
Treated Water
PercentRemoval
ConcentrateStream
Cl 194 105 45.9% 2051
SO4 95 92 3.0% 140
HCO3 232 165 28.7% 442
NO3 92 44 52.2% 835
Na 109 76 30.4% 627
Ca 118 73 37.8% 808
Mg 24 15 36.6% 160
K 3.6 2.5 30.6% 20.5
Ba 0.149 0.093 37.8% 1.020
Sr 0.84 0.52 37.8% 5.75
TDS 869 574 33.9% 5090
pH 7.8 7.8 6.5
Residuals Management
The concentrate from the SED process is fed into the Weizmann Institutes non-potable system which is used for irrigation purposes. Since the SED process selectively removes nitrate, the Total Dissolved Solids (TDS) of the concentrate is less than a RO system would be if it were treating the same water, which allows the concentrate to be used for irrigation without the salinity adversely affecting plant growth. This management approach is also beneficial since the concentrated nitrate solution has limited the amount of fertilizer applied by the Weizmann Institute.

FINAL REPORT June, 2011Electrodialysis (ED/EDR/SED) Page 84
Copyright © 2011 American Water Works Association. All Rights Reserved.
Technology Benefits and Drawbacks
Benefits Ease of regeneration Fewer chemicals than comparable
technologies Membranes 7-10 years life span Energy consumption less than that of RO High water recovery Concentrate solution has relatively low
TDS which may increase disposal options
Drawbacks Capital intensive technology Requires specific operator training
Treatment Technology Costs
Capital Costs (Total with explanation or component costs)
$ CommentsTotal: 650,000Housing: Light building 50X13 feet. According to customer demands.Piping: 50,000 Pipes, electric valves, storage tanks (the largest would be with a
volume of about 180 cu. ft. for product water)Storage Tanks (include description of uses):
See above.
Operating and Monitoring Equipment:
90,000 Control system, remote assistance for the control system, on line nitrate measurement, conductivity, pH, turbidity.
Membranes Modules: 300,000 Complete SED membrane stack.Permits: According to local regulations.
Other (Please describe): 210,000 Design,Electricity boards – design and manufacturing & erection. Pumps and blowers.

FINAL REPORT June, 2011Electrodialysis (ED/EDR/SED) Page 85
Copyright © 2011 American Water Works Association. All Rights Reserved.
Operational Notes
The SED system is highly instrumented and the PLC has over 200 monitored inputs. As a result there have not been any failures that have resulted in water in violation of the MCL delivered to consumers. While there have been failures resulting in alarms and shutdowns, the control system has been robust enough to shut down the system and prevent water with high nitrate entering the distribution system. Typical shutdowns can be rectified in a matter of hours and normal operation is resumed.
Sources*:Merhav, Neta. (October, 2010). Completed questionnaire.
*Unpublished sources used in the development of the case studies are not reflected in the References section of this report.
O & M Costs (Total with explanation or component costs)
Unit CommentsMembrane: %/year 10% per year is the replacement rateConcentrate Disposal or Treatment:
Gallons/year Site specific. 4%-5% of the SED system capacity.
Chemicals: Total, [lb/1000 gallon]
0.77
Specific acid consumption [lb/1000 gallon]
0.72
Specific chlorine consumption
[lb/1000 gallon]
0.04
Specific caustic soda consumption
[lb/1000 gallon]
0.01
Repair/Maintenance (not including Labor):
$/year 7,000
Specific power consumption
[kWh/1000 gallon]
1.4
Labor ($): $ 16,000 (40$ per hour basis)Labor (Hours per Year): hours 400


FINAL REPORT June, 2011Biological Denitrification (BD) Page 87
Copyright © 2011 American Water Works Association. All Rights Reserved.
3.4 Biological Denitrification (BD)
Commonly used in wastewater treatment, biological reactors are emerging as a method for
denitrification of potable water with the potential to address multiple contaminants including
nitrate, chromate, perchlorate, and trace organic chemicals (Brown, 2008). Biological
denitrification (BD) in potable water treatment has been implemented in Europe since 1804
(Lenntech, 2009), with recent full-scale systems in France, Germany, Austria, Poland, Italy and
Great Britain (Meyer, N.D. and Dördelmann, 2009). To date, full-scale drinking water
applications in the United Sates have been limited to a single plant in Coyle, OK (no longer
online). However, two full-scale biological denitrification systems are anticipated in California
within the next couple of years.
Denitrification occurs naturally in the environment as part of nitrogen cycling. Application of
biological denitrification to potable water treatment (Figure 3-11) utilizes denitrifying bacteria
to reduce nitrate to innocuous nitrogen gas in the absence of oxygen (anoxic conditions).
Figure 3-11 Biological Denitrification Schematic.
The reduction of nitrate proceeds stepwise in accordance with Eqn. 9. In contrast with the
separation processes of IX, RO and ED/EDR, nitrate is reduced and thereby removed from the
system rather than simply being displaced to a concentrated waste stream.
NO3- NO2
- NO N2O N2 (Eqn. 9)
Denitrifying bacteria require an electron donor (substrate) for the reduction of nitrate to
nitrogen gas. In conventional wastewater treatment, substrate addition is not typically needed,
because the wastewater contains sufficient carbon for denitrification to occur. However,

FINAL REPORT June, 2011Biological Denitrification (BD) Page 88
Copyright © 2011 American Water Works Association. All Rights Reserved.
depending on the source, substrate addition is often required for the biological denitrification
of potable water. The addition of a carbon substrate in potable water treatment is somewhat
counter intuitive. In fact, one principal objective of potable water treatment is to minimize
dissolved carbon in the water to minimize growth of microbes (e.g., biofilms) and production of
disinfectant byproducts (e.g., THMs). Feed water composition may need to be further
augmented with the addition of nutrients required for cell growth (phosphorus for example).
Autotrophic bacteria utilize sulfur or hydrogen as an electron donor and inorganic carbon
(typically carbon dioxide) as a carbon source for cell growth (Eqns. 10 and 11), while
heterotrophic bacteria consume an organic carbon substrate, like methanol, ethanol or acetate
(Eqn. 12) (Kapoor & Viraraghavan, 1997, Mateju et al., 1992).
11S0+0.5CO2+10NO3-+2.54H2O+1.71NH4
+0.92C5H7O2N+11SO42-+5.4N2+9.62H+(Eqn. 10)
H2 + 0.35 NO3- + 0.35 H+ + 0.052 CO2 0.010 C5H7O2N + 0.17 N2 + 1.1 H2O (Eqn. 11)
1.08 CH3OH + NO3- + H+ 0.065 C5H7O2N + 0.467 N2 + 0.76 CO2 + 2.44 H2O (Eqn. 12)
Eqns. 10 through 12 illustrate the overall denitrification reaction defining the stoichiometric
relationship between electron donor, carbon source and nitrate in the production of cells and
the conversion of nitrate to nitrogen gas. Not all nitrogen is converted to nitrogen gas. Some
nitrogen is required for cell growth. The governing stoichiometric equation indicates the
necessary dose and varies with the substrate used. For example, the stoichiometric factor for
acetic acid is 0.82 moles of acetic acid per mole of nitrate (Dördelmann et al., 2006).
Various species of bacteria are responsible for denitrification including Thiobacillis denitrificans,
Micrococcus denitrificans, Pseudomonas maltophilia and Pseudomonas putrefaciens (Kapoor &
Viraraghavan, 1997). Due to slower bacterial growth rates, autotrophic denitrification offers
the advantage of minimizing biomass accumulation; however, autotrophic denitrification
requires alkalinity to supply the inorganic carbon source (carbon dioxide) for cell growth (Della
Rocca et al., 2006). BIODEN® and DENICARB® are heterotrophic biological denitrification
processes, while DENITROPUR® is an autotrophic option. Selected full scale biological
denitrification systems are listed in Table 3-10 (Dördelmann, 2009).

FINAL REPORT June, 2011Biological Denitrification (BD) Page 89
Copyright © 2011 American Water Works Association. All Rights Reserved.
Table 3-10 Full Scale Biological Denitrification Systems for Potable Water Treatment.
Location Reactor Configuration Substrate, Denitrification type Flow rate m3/h (MGD)
GermanyNeuss [1] Fixed bed, downflow Acetic acid, Heterotrophic 150 (0.95)Frankfurt Airport [1] Fluidized bed, upflow, DENICARB® Ethanol, Heterotrophic 320 (2.03)Aschaffenburg [1]
Fixed bed, upflow, DENITROPUR® Hydrogen and CO2, Autotrophic1600 (10.14)
Föhr Island [1] 90 (0.57)AustriaObersiebenbrunn [1] Fixed bed, downflow, BIODEN® Ethanol, Heterotrophic 180 (1.14)PolandCzestochowa [1] Fixed bed, downflow, BIODEN® Ethanol, Heterotrophic 500 (3.17)1: Dördelmann, 2009
In their review of potable water treatment methods for the removal of nitrate, Mateju et al.
(1992), Kapoor & Viraraghavan (1997), Soares (2000) and Shrimali & Singh (2001) discuss
previous research and applications of biological denitrification. Problems associated with the
application of conventional biological denitrification to potable water treatment include
additional post-treatment for removal of biomass and dissolved organics, increased capital
costs, and sensitivity to environmental conditions (Kapoor & Viraraghavan, 1997). To address
these concerns, several treatment configurations using biological denitrification have been
developed.
3.4.1 Biological Denitrification – Design Considerations
Table 3-11,summarizes key design considerations in the application of biological denitrification
for nitrate removal from potable water.

FINAL REPORT June, 2011Biological Denitrification (BD) Page 90
Copyright © 2011 American Water Works Association. All Rights Reserved.
Table 3-11 Summary of Design Considerations for Biological Denitrification.
Pretreatment Substrate and nutrient dosing pH adjustment
Post-Treatment Carbon adsorption for organic carbon removal o Carbon adsorption is not always requiredo Residual substrate removal can be accomplished via biological filtration
Aeration Filtration Disinfection
Chemical Usage Possible pH adjustment Substrate and nutrient addition Coagulant/polymer use to meet turbidity standards Disinfection
O&M Historically operator intensiveo Operator demands can be minimized with the latest design configurations
Constant monitoring required to assure efficient removal, health of microbes etc. Monitoring of nitrite and ammonia will also be necessary due to the potential for
incomplete denitrification Management of chemicals Waste sludge storage and disposal New plants can be highly automated Historically viewed as operationally complex
o More unit processes than IXo New design configurations can minimize complexity (e.g., fixed bed reactor)
System Components
Important process considerations include (Dördelmann, 2009): Dosage requirements of substrate and nutrients Reactor configuration and governing equation of the biological process Aeration to remove nitrogen gas and provide oxygen Filtration to remove particulate matter Activated carbon may be used to remove substrate residual and avoid DBP formation
(for heterotrophic systems) Disinfection
Waste Management and Disposal
Sludge disposal – Biological solids and residual organic matter No waste brine or concentrate as in separation processes
Limitations Requires anoxic conditions Chemical management Few examples for nitrate removal in the U.S. Post-treatment requirements Operator training Intermittent use of wells may be challenging due to the need for acclimation of
microorganisms
3.4.1.1 Water Quality
Anoxic conditions are required for denitrification to occur. In the presence of oxygen (> 0.1
mg/L) bacteria preferentially reduce oxygen rather than nitrate, diminishing the efficiency of
the process. For all configurations, the optimal growth of microbes must be considered.

FINAL REPORT June, 2011Biological Denitrification (BD) Page 91
Copyright © 2011 American Water Works Association. All Rights Reserved.
Control and monitoring of water quality characteristics including temperature, pH, salinity, and
oxidation reduction potential (ORP) can be fundamental to the stability and efficiency of the
biological denitrification system (WA DOH, 2005). For biological denitrification, near neutral pH
is preferred (7-8) and temperatures below 5oC/41oF can inhibit denitrification (WA DOH, 2005).
Pretreatment will include addition of substrate and nutrients in the appropriate dose while
post-treatment requirements can include coagulant addition, filtration, gas exchange, and
disinfection for the removal of biomass, particulates and substrate residuals (Dördelmann et al.,
2006 and Panglisch et al., 2005).
3.4.1.2 System Components and Site Considerations
Important process considerations in the design and operation of BD systems include
(Dördelmann, 2009):
Dosage requirements of substrate and nutrients
Reactor configuration and governing equation of the biological process
Aeration to remove nitrogen gas and provide oxygen
Filtration to remove particulate matter
Activated carbon to remove substrate residual and avoid DBP formation (for
heterotrophic)
Disinfection
Conditions should be optimized to ensure complete denitrification. In addition to nitrate
reduction to meet the nitrate MCL (10 mg/L as N), effluent nitrite levels must not exceed the
nitrite MCL of 1 mg/L as N.
System configurations of biological denitrification include: fluidized bed reactor, fixed bed
reactor, membrane biofilm reactor, and bio-electrochemical reactors. In situ options (including
bank filtration) have also been explored in the research.
3.4.1.3 Fixed Bed
Fixed bed biological reactors can be in up-flow or down-flow systems in a pressurized or open
flow configuration (Brown, 2008). Typical options for growth support media are “sand, plastic,
or granular activated carbon” (Brown, 2008). Accumulation of biomass in the media leads to
FINAL REPORT June, 2011Biological Denitrification (BD) Page 92
Copyright © 2011 American Water Works Association. All Rights Reserved.
head loss requiring periodic backwashing. Post-treatment requirements can include filtration,
gas exchange, and disinfection for the removal of biomass, particulates and substrate residuals
(Dördelmann et al., 2006 and Panglisch et al., 2005). The fixed bed configuration “is often
coupled with pre-ozonation to improve the removal of organic material, which reduces
regrowth potential and DBP formation in distribution systems” (Brown, 2008). (See
Dördelmann et al. (2006), Panglisch et al. (2005), Soares (2002), Upadhyaya (2010), Meyer et al.
(2010), City of Thornton (2010), Carollo Engineers (2008) and Aslan (2005) in Table A.4 for
research examples of the fixed bed configuration.)
A detailed case study of the Fixed Bed configuration of biological denitrification in Riverside, CA is included in section 3.4.5.
3.4.1.4 Fluidized Bed
The fluidized bed reactor operates in an up-flow mode, resulting in granular growth support
media expansion. Fluidizing the granular media offers several advantages over the fixed bed
configuration. Flow resistance is minimized and the system does not need to be taken off line
for backwashing because accumulated biomass is removed by the fast flowing feed water
and/or “in-line mechanical shearing devices” (Brown, 2008). “The biofilm is detached from the
support material only upon strong mechanical effect, thus the excess biomass can be
intermittently removed from the reactor, independently of the purified water” (Holló & Czakó,
1987).
Maintenance of the sufficient up-flow velocity can be achieved through recycled flow and
reactor volumes are designed for a typical bed expansion of 25 to 30% (Brown, 2008). (See
Webster & Togna (2009), Kurt et al. (1987) and Holló & Czakó (1987) in Table A.4 for research
examples of the fluidized bed configuration.)
A detailed case study of the Fluidized Bed configuration of biological denitrification in Rialto, CA is included in section 3.4.5.
3.4.1.5 Membrane Biological Reactor (MBR)/Membrane Biofilm Reactor (MBfR)
With the addition of membrane technology to conventional biological denitrification, common
concerns of biological treatment can be minimized through physical separation of biomass and

FINAL REPORT June, 2011Biological Denitrification (BD) Page 93
Copyright © 2011 American Water Works Association. All Rights Reserved.
substrate from the treated water. In a comprehensive review of membrane bioreactors,
McAdam & Judd (2006) present the pros and cons of a variety of MBR configurations (Table
3-12). MBRs can be designed for autotrophic or heterotrophic denitrification. Pressurized
systems have been explored using submerged ultrafiltration membranes or external
(sidestream) MBRs, while pressure neutral diffusion systems have been implemented with ion
exchange membranes and microporous membranes (Brown, 2008 and McAdam & Judd, 2006).
Membrane types include hollow fiber, ion exchange, microporous and flat sheet. (See Meyer et
al. (2010), City of Thornton (2010), Mansell & Schroeder (2002), Ergas & Rheinheimer (2004),
Chung et al. (2007), and Nerenberg & Rittman (2004) in Table A.4 for research examples of MBR
configurations.)
Applied Process Technology, Inc. (APT) has developed an autotrophic membrane biofilm reactor
(MBfR) (Gormly & Borg, APT) using hydrogen gas as the electron donor rather than a carbon
substrate. As part of a long term pilot scale study13 in Glendale, AZ, APT’s MBfR was examined
to address high nitrate levels in groundwater. This autotrophic biological denitrification system
successfully reduced nitrate levels to below the MCL. Three types of hollow fiber membranes
were examined for substrate delivery. Operational concerns highlighted by this study include
(Meyer et al., 2010):
Problems with leaking fibers,
Hydrogen sulfide formation due to excessive hydrogen gas pressure,
Ammonium generation from biomass decay due to operational interruption and
insufficient electron donor, and
Nitrite levels above the 1 mg/L nitrite as N limit (incomplete denitrification).
To address these concerns, the authors suggest:
The use of the latest optimized membranes,
Consistent and adequate nutrient and electron donor supply,
Oxidation of nitrite in post-treatment if necessary,
Stable loading and continuous operation to avoid system upset, and 13 Project partners and participants: City of Glendale, Arizona, Water Research Foundation, Arizona State University, CH2M HILL, Applied Process Technology, Inc., Intuitech, Inc., KIWA Water Research, and Layne-Christensen.

FINAL REPORT June, 2011Biological Denitrification (BD) Page 94
Copyright © 2011 American Water Works Association. All Rights Reserved.
Parallel reactors to allow for maintenance and repair.
The MBfR pilot was one of three biological configurations examined in Glendale. Two upflow
heterotrophic fixed bed bioreactors were also examined, each with a different media type.
Post-treatment included filtration using biologically active carbon and ozonation. The two most
promising biological treatment options, the MBfR and the upflow fixed bed bioreactor with
plastic media, were compared with each other and also with an IX system. Overall, using a
multi-criteria analysis with consideration of sustainability, the MBfR scored the most favorably
regarding benefits, but the least favorably regarding life cycle costs. The life cycle costs of both
the IX and the fixed bed bioreactor options were lower than that of the MBfR. The Glendale
study highlights several key areas of future research including “a shut-down test where
biological treatment processes sit dry for a period of time and then re-start at optimal hydraulic
loading rates [and] a re-acclimation test where systems are re-initiated after losing all viable
biomass” (Meyer et al., 2010).
As a promising technology, with further research and design optimization to reduce costs, the
MBfR may become a more feasible treatment option. As of 2008, a demonstration project of
the MBfR for nitrate and Dibromochloropropane (DBCP) removal was under consideration for
the City of Fresno, CA to test performance of the MBfR as an alternative treatment option (City
of Fresno, 2008).
Table 3-12 Membrane Biological Reactor Configurations.
Diffusive Extraction Microporous Membranes
Relying on diffusion for nitrate transfer through the membrane, extractive MBRs (aka Fixed MBRs) do not directly filter the treatment stream, but they do provide separation of the denitrification chamber (substrate, biomass and associated residuals) and the treatment stream. Key issues are the transfer of biomass or substrate across membrane, the potential for fouling/scaling, and the need for a high transfer rate of nitrate to the denitrification compartment.
Diffusive ExtractionIon Exchange Membranes
With the use of an ion exchange membrane rather than a microporous membrane, selectivity for nitrate and decreased mass transfer from the denitrification compartment are facilitated; however, capital and maintenance costs of ion exchange membranes can be significant and the need to manage membrane fouling persists (McAdam & Judd, 2006).
Gaseous Substrate DeliveryHollow Fiber Membranes
In autotrophic systems, membranes can be used for gaseous substrate delivery, (i.e.,hydrogen gas) (McAdam & Judd, 2006). Previous problems with limited hydrogen gas transfer have been addressed with the use of hollow fiber membranes for delivery. Substrate passes through the membrane to the biofilm on the outer membrane surface. The membrane does not separate the biomass from the treatment stream and “the membrane is not used for direct filtration” (McAdam & Judd, 2006); the presence of “sloughed biomass” and biological residuals in the treatment

FINAL REPORT June, 2011Biological Denitrification (BD) Page 95
Copyright © 2011 American Water Works Association. All Rights Reserved.
stream requires further treatment downstream.Pressure Driven Direct Filtration MBRs
Pressurized MBRs provide the advantage of direct filtration. Pressure is used to draw the denitrified water through the submerged membrane, leaving behind biomass and other undesirable constituents. However, the use of this configuration for denitrification is complicated by the fact that aeration is typically used for mixing and to minimize fouling of the external membrane surface (Brown, 2008).
3.4.1.6 In Situ Denitrification
Bank filtration refers to the withdrawal of surface water through an embankment. The porous
media (soil) of the bank serves as a biological reactor providing treatment through “filtration,
dilution, sorption, and biodegradation processes” (Brown, 2008). Bank filtration was employed
in water treatment as early as 1870 along the Rhine River in Germany (Brown, 2008). As a
recent example, a full scale study in Aurora, CO demonstrated effective nitrate removal with
bank filtration of surface water from the South Platte River (Waskom, Carlson & Brauer, N.D.).
Biological denitrification for in situ removal of nitrate from groundwater was explored by
Hunter (2001), Haugen et al. (2002) and Schnobrich et al. (2007). Through in situ
denitrification, the subsurface acts as the porous media through which water is filtered.
Residual organics and biomass from denitrifiers can thus be removed naturally. (See Hunter
(2001), Haugen et al. (2002), and Schnobrich et al. (2007) in Table A.4 for research examples of
in situ application.)
3.4.1.7 Post-Treatment Requirements - Filtration/Taste & Odor/Disinfection
With the use of microorganisms and the addition of a carbon substrate, post-treatment is
essential to meet turbidity standards, to remove biomass and residual organic matter, and to
address taste and odor concerns. Post-treatment must include disinfection to address
biological contamination and can also include dual media filtration and/or activated carbon
filtration and aeration (individual state regulations will need to address local requirements).
3.4.1.8 Residuals Management and Disposal
In contrast to the concentrated waste stream from removal processes, biological denitrification
has limited waste demands due to the conversion of nitrate to nitrogen gas. Waste sludge,
consisting of biological solids and residual organic matter, requires appropriate disposal;

FINAL REPORT June, 2011Biological Denitrification (BD) Page 96
Copyright © 2011 American Water Works Association. All Rights Reserved.
however, with nearly 100% water recovery, the low waste volumes are not a significant burden
(Kapoor & Viraraghavan, 1997).
3.4.1.9 Maintenance, Monitoring, and Operational Complexity
Because biological denitrification is microbially mediated, to maximize performance, systems
should be run continuously, with a consistent supply of substrate and nutrients at the appropriate
dosage (Dördelmann, 2009). An initial startup period may be necessary for development and
acclimation of the microorganisms (Holló & Czakó, 1987; Aslan, 2005). This may be
problematic for intermittent use of wells and wasting may be required for acclimation to occur.
Backwashing, consistent maintenance and regular monitoring of product water quality are also
essential. Constituents that should be monitored frequently are nitrate, nitrite, pH, oxygen,
turbidity, conductivity, dissolved organic carbon, and bacterial count (Dördelmann, 2009).
Operation and maintenance demands of biological denitrification systems typically exceed those
of alternative treatment technologies. However, these systems are more sustainable because
nitrate is reduced to innocuous nitrogen gas rather than concentrated in a waste stream that
requires costly disposal (Dördelmann, 2009).
3.4.2 Biological Denitrification - Cost Considerations
For efficient operation of a biological denitrification system, maintaining optimal conditions for
the bacteria is essential, as is balancing the appropriate substrate and nutrient dose and
managing pre and post-treatment while meeting necessary potable water guidelines. Factors
affecting system cost include facility size (flow rate), source water quality (including nitrate
concentration), environmental factors (temperature and pH), target effluent nitrate
concentration, and possible wasting due to intermittent use of wells and associated acclimation
of microorganisms.
Capital costs for biological denitrification include land, housing, piping, storage tanks, O&M
equipment, preliminary testing (through extensive pilot studies), permits, and significant
operator training. O&M costs include post-treatment, sludge disposal, chemical use (pH
adjustment, substrate and nutrient), repair, extensive monitoring and maintenance, power, and
labor. Costs can be higher in certain states, depending on post-treatment requirements.

FINAL REPORT June, 2011Biological Denitrification (BD) Page 97
Copyright © 2011 American Water Works Association. All Rights Reserved.
Very little published cost information from existing biological denitrification systems for
drinking water is available in the literature, due to the limited number of full-scale systems
(Table 3-13). Costs have been adjusted to 2010 dollars, unless indicated otherwise. The listed
cost information is provided as an approximate range of costs for specific facilities. Costs for
implementing biological denitrification may be very different from those listed here. A
thorough cost analysis of design parameters for specific locations would be required for
accurate cost estimation. The information gathered through the questionnaire includes
detailed costs associated with the individual case studies included in this analysis.
Table 3-13 Cost Information* for Biological Denitrification of Potable Water.
System Flow** < 0.5 MGD 0.5 – 5 MGD 5+ MGD
Annualized Capital Cost ($/1000 gal) 0.83 [1] 0.61 – 0.80 [2, 3]*** 0.51 – 0.62 [4]
O&M Cost ($/1000 gal) 0.30 [1] 0.33 – 0.46 [2, 3] *** 0.74 – 0.94 [4]
Total Annualized Cost ($/1000 gal) 1.13 [1] 1.03 – 1.13 [2, 3] *** 1.25 – 1.56 [4]*Costs have been adjusted to 2010 dollars with 7% interest over 20 years, unless indicated otherwise. **When available, costs are based on actual system flow rather than design capacity.***Listed costs are based on biological treatment for perchlorate and should be considered only as a rough estimate of similar systems for nitrate treatment.[1] Silverstein (2010), not adjusted to 2010 dollars. [2] Webster & Togna (2009). [3] Carollo Engineers (2008). [4] Meyer et al. (2010).
3.4.3 Biological Denitrification - Selected Research
Table A.4 of the Appendix is a list of recent research studies relevant to the use of biological
denitrification in potable water treatment.
3.4.4 Biological Denitrification - Summary of Advantages and Disadvantages
A summary of advantages and disadvantages of biological denitrification in comparison with
other treatment options is listed in Table A.6 of the Appendix. Advantages of the use of
biological denitrification for nitrate removal from potable water include high water recovery, no
brine or concentrate waste stream (reduction of nitrate rather than removal to a concentrated
waste stream), low sludge waste, less expensive operation, limited chemical input, multiple
contaminant removal, and increased sustainability (Brown, 2008; WA DOH, 2005; and
Upadhyaya, 2010).

FINAL REPORT June, 2011Biological Denitrification (BD) Page 98
Copyright © 2011 American Water Works Association. All Rights Reserved.
Disadvantages of nitrate removal using biological denitrification are post-treatment
requirements for the removal of biomass and dissolved organics, high capital costs, potential
sensitivity to environmental conditions (although recent pilot tests indicate robust newer
designs), system footprint larger than typical IX systems, high system complexity (may be
simplified with new configurations), lack of full scale systems in the U.S., potential for
incomplete denitrification, pilot study requirements, and slow start-up (Kapoor & Viraraghavan,
1997 and WA DOH, 2005).
3.4.5 Biological Denitrification - Case Studies
The following case studies provide detailed information on the design and operation of a pilot-
scale and planned full-scale biological treatment systems that can be used for nitrate removal.

FINAL REPORT June, 2011Biological Denitrification (BD) Page 99
Copyright © 2011 American Water Works Association. All Rights Reserved.
System Name: West Valley Water DistrictSystem Location: Rialto, CA
PWSID: CA 3610004CASE #13 System Type: Demonstration System, Full Scale Installation is under constructionTreatment Type: Biological Denitrification, Fluidized Bed Bioreactor (FBR)Questionnaire completed by: Todd Webster from Envirogen Technologies, Inc., Director of Sales &
Bioreactor Applications. Tom Crowley from the West Valley Water District.
Demonstration Dates of Operation: 2007-2008, Full Scale Installation Proposed Startup Date: 2012
System Description
The West Valley Water District (District) utilizes 2 surface water sources and 5 groundwater wells. Of these supplies, one groundwater well is impacted by nitrate contamination above the MCL, with an average nitrate concentration of 18 mg/L of nitrate as N. The well source is the Chino Basin which has an estimated capacity of 300-400K ac. ft. For the immediate future this well has been abandoned due to nitrate contamination, while feasible treatment options are being explored. The primary water quality concern in the District is perchlorate contamination. Biological denitrification has been explored principally to address perchlorate levels typically in the range of 50-53 μg/L. However, simultaneous nitrate reduction in the biological denitrification process makes this system an appropriate example as a nitrate treatment alternative.
Unlike the removal processes of IX, RO and EDR, biological denitrification allows for the destruction of nitrate through reduction to innocuous nitrogen gas. The fluidized bed configuration maximizes media surface area for thegrowth of denitrifying bacteria. After a successful 1-year demonstration study on well Rialto #2, a full scale Fluidized Bed Bioreactor (FBR) is expected to be online in early 2012.
“The system is the fluidized bed bioreactor (FBR). The contaminated feed water is pumped from the wellhead and fed directly into a recycle line of the reactor. The feed and recycle water enters the vessel through an inlet header at the bottom of the reactor and is distributed through lateral piping and nozzles. The fluid passes upward through the media, causing the media to hydraulically expand approximately 28% of the settled bed height. Through a self-inoculating process from the contaminated feed water, microorganisms attach on to the fluidized media.
Adequate quantities of electron donor (i.e., acetic acid) and nutrients are added to the reactor. Utilizing this electron donor and the nutrients, the attached microorganisms perform an oxidation/reduction reaction in consuming all of the dissolved oxygen, nitrate, and perchlorate. As the microorganisms grow, the amount of attached microbes per media particle also increases. Since the microbes primarily consist of water, the volume of the microbe/media particle increases, but the specific density decreases. This allows the media bed to expand and fluidize further such that longer hydraulic retention times can be achieved for contaminant removal. The treated fluid flows into a submerged recycle collection header pipe and the effluent collection header pipe at the top of the reactor. A portion of the fluid exits the FBR system to a post-aerator while the balance is recycled back to the suction of the influent pump. An in-bed biomass separation device controls bed height growth by physically separating biomass from the
Treatment Type Fluidized Bed Bioreactor
System Capacity 2,000 - 4,000 gpm (for proposed full scale treatment)
Raw Water Nitrate
Raw Water Perchlorate
17 - 19 mg/L
(abandoned well)
6.2-6.3 (pilot)
50+ g/L (pilot)

FINAL REPORT June, 2011Biological Denitrification (BD) Page 100
Copyright © 2011 American Water Works Association. All Rights Reserved.
media particles. Typically, a bed expansion of 40-60% of the settled bed height is targeted. Any excess biomass that is separated from the media exits the system through the effluent collection system” (Webster & Togna, 2009).
Source Water Quality
Nitrate (mg/L N)o Demonstration well: 6.2-6.3o Abandoned nitrate impacted well: 18
Co-contaminants: Perchlorateo Demonstration well: 50-53 μg/L, spiked to 1000
μg/L (with appropriate substrate and nutrient adjustments)
o Abandoned nitrate impacted well: a few ppb
Treatment Technology Selection
The fluidized bed bioreactor was selected for perchlorate removal; however, nitrate reduction is also accomplished. Due to the levels of nitrate and perchlorate, biological denitrification was deemed to be more cost-effective than alternative physico-chemical technologies. Generally, with nitrate levels well above the MCL (e.g., 100 mg/L as nitrate), removal processes can become more costly. Biological denitrification can be the more feasible option for source water containing co-contaminants and/or high levels of nitrate.
For the Rialto #6 and West Valley Water District #11 wells, the fluidized bed reactor and IX were considered. Two additional pilot studies were performed to assess nitrate and perchlorate treatment using a packed bed bioreactor and zero valent iron.
Demonstration System Parameters
Design Capacity o 50 gpm capacity
Pretreatmento Substrate and nutrient addition
Acetic Acid:16.2 mg/L as C (+20-25%)
15 mL/min, 50% acetic acido Nutrient addition
Phosphoric Acid:0.3 mg/L as P10.5 mL/min
Post-treatmento Aeration tank
Increase dissolved oxygeno Clarifier/multimedia filtero GAC filtrationo UV disinfection versus chlorination
Water Recovery: > 99% Bed Expansion:
o 28% of settled bed heighto Max: 40-60%
Media: Sand or GAC Cleaning requirements
o Biomass separator o In-bed cleaning eductor
Manufacturer:Envirogen Technologies, Inc.
Monitoring: Throughout the demonstration using online nitrate and perchlorate analyzers

FINAL REPORT June, 2011Biological Denitrification (BD) Page 101
Copyright © 2011 American Water Works Association. All Rights Reserved.
Demonstration System Cost Estimation - Scaling up from 50 gpm to 1000 gpm
Capital Costs (2008 dollars) (1000 gpm)
Total Equipment Costs $1,966,000Total Contractor Costs $570,140Total Home Office Costs $664,000Total Installed Capital Costs (1000 gpm) $3,200,140Amortized Capital Cost ($/AF) $128 (30 years, 4.9% bonding rate)
O & M Costs (2008 dollars) (1000 gpm)
Electricity ($/yr) $87,600Chemicals ($/yr) $133,187Maintenance ($/yr) $20,000Total Operating Costs ($/yr) $240,787Operating Costs ($/AF) $149
Total Cost (2008 dollars) (1000 gpm)
Total Annualized Cost ($/AF) $277
Proposed Full Scale System Parameters
Design Capacity o 2000 gpm capacityo Expandable to 4000 gpm
Pretreatmento Substrate and nutrient addition
Acetic Acid: 10-15 mg/L as C Post-treatment
o Aeration tank Increase dissolved oxygen
o Clarifier/multimedia filtero Chlorine disinfection
Treatment system foot print o Treatment system: 2 FBRs
14’ diameter x 24’ heighto Residuals handling system
DAF for solids removalo Total system footprint:
For 4000 gpm 180’ x 130’
For 2000 gpm 25% less than above
Water Recovery: > 99% expected Bed Expansion:
o 28% of settled bed heighto Max: 40-60%
Media: Sand or GAC Cleaning requirements
o Biomass separator o In-bed cleaning eductor
Manufacturer:Envirogen Technologies, Inc.
Monitoring: N/A Waste Volume:
0.3 gpm waste per 2000 gpm treated

FINAL REPORT June, 2011Biological Denitrification (BD) Page 102
Copyright © 2011 American Water Works Association. All Rights Reserved.
Proposed Full Scale System Cost Estimation
Capital Costs (Total with explanation or component costs)
Treatment and Monitoring Equipment:
$1.8 million for the 2 FBR vessels, the 2 post-aeration vessels, nitrate and perchlorate monitoring, 1 DAF, chemical feed systems, pumps,
valves, additional componentsFiltration System: $800,000 for the 2 clarifier and multimedia filters
O & M Costs (Total with explanation or component costs)
Unavailable because system is not yet operating. Please see above for estimated O & M costs from the full-scale demonstration study.
Residuals Management
Unlike removal technologies, the use of the FBR results in destruction of nitrate and perchlorate, rather than the transfer of these constituents to a concentrated waste stream requiring disposal.
Technology Benefits and Drawbacks
Benefits Capable of perchlorate removal and
handling high nitrate levels Reduction of nitrate rather than just
removal High water recovery and limited waste Lower operating costs than removal
technologies
Drawbacks Limited application in the U.S. Large system footprint More complicated permitting Extensive pilot study necessary Start-up time (up to a month) Increased operator attention Sensitivity to system interruption
Additional Information
The full scale system is being planned specifically to address perchlorate contamination, but will reduce nitrate as well. The proposed start-up date for the full scale system is Late-2011 to Early-2012. Construction has begun and all equipment is scheduled to be in place by December of 2011. The system should be fully operational with discharge to groundwater by Mid-2012. With approval from the California Department of Public Health (CDPH) it is expected that distribution of treated drinking water will begin by the end of 2012. Regarding operator training, for this system, the operators already held the required certification due to operation of a surface water treatment plant; however, for other utilities lacking this pre-existing experience, additional training would likely be needed.

FINAL REPORT June, 2011Biological Denitrification (BD) Page 103
Copyright © 2011 American Water Works Association. All Rights Reserved.
Regarding permitting, the 97-005 process from the CDPH Policy Memo 97-005, (“Guidance for the Direct Domestic Use of Extremely Impaired Sources”) was followed as guidance for the FBR installation. The 97-005 process is strenuous and involved, requiring analysis of failure and worst-case scenarios and a 6 month demonstration of proper operation of the treatment plant. The system sizes for which a FBR would be appropriate vary with the concentration of contaminants. Feasible application of a FBR can be more dependent on load than on flow capacity. The FBR has been implemented or tested for systems as small as 7 to 12 gpm and across perchlorate concentrations from 12 to 13000 ppb. Typical flow rates are 250 to 5000 gpm, but with high loads FBRs can become more feasible for lower flow rates.
Source*
Webster, T.S., Guarini. W.J. and Wong, H.S. (May, 2009). “Fluidized bed bioreactor treatment of perchlorate-laden groundwater to potable standards.” Journal of the American Water Works Association, 101 (5).Webster, T.S. and Togna, P. (January, 2009). “Final Report: Demonstration of a Full-Scale Fluidized Bed Bioreactor for the Treatment of Perchlorate at Low Concentrations in Groundwater.” ESTCP Project ER-0543.Webster, T.S. and Crowley, T. (October, 2010). Completed questionnaire and personal communication.
*Unpublished sources used in the development of the case studies are not reflected in the References section of this report.

FINAL REPORT June, 2011Biological Denitrification (BD) Page 104
Copyright © 2011 American Water Works Association. All Rights Reserved.
System Name: Western Municipal Water District (WMWD) - Arlington DesalterSystem Location: Riverside, CA
PWSID: CA3310049 CASE #14 System Type: Pilot- Full Scale System is Currently in the Design PhaseTreatment Type: Fixed Bed Bioreactor (FXB)Questionnaire completed by: Joseph Bernosky, WMWD, Director of Engineering
Jess Brown, Carollo Engineers, Carollo Research Group ManagerStartup Date: Proposed 2012
System Description
The Western Municipal Water District (Western) operates the Arlington Desalter as a drinking water supply facility. The original RO water treatment facility was constructed in the late-1980s for salt management in the Arlington groundwater basin. In 2002 the facility was upgraded and subsequently approved as a potable water supply by the California Department of Public Health (CDPH). Three wells supply raw water to the RO process and two additional wells supply bypass water for blending with the RO permeate to produce the finished water (product water).
The current capacity of the Arlington Desalter is 5 million gallons per day (MGD) of RO permeate and approximately 1.3 MGD of untreated bypass for a total product water capacity of 6.3 MGD. Western’s water supply reliability program, developed through the Integrated Regional Water Management Plan (IRWMP), includes plans for expansion of the Arlington Desalter to 10 MGD capacity.
A pilot study was conducted at the Arlington Desalter from April through November 2007 that demonstrated the feasibility of nitrate removal using fixed bed biological treatment (biodenitrification) of the RO bypass stream. After completion of the initial pilot study, CDPH proposed a turbidity standard for the biodenitrification process. Supplemental pilot testing conducted between May and September 2008 demonstrated compliance with the new turbidity standard by adding a nitrogen degasification step followed by coagulation and polishing filters.
The FXB biological process utilizes a stationary bed of granular activated carbon (GAC) on which biofilmscontaining nitrate-reducing bacteria develop. Raw water is drawn from a well amended with an electron donor such as acetic acid. The water is then pumped through the GAC bed. Bacteria in the bed convert the nitrate to nitrogengas and water. A one-time acclimation period is required to develop the nitrate-reducing biological activity, which is done by contacting virgin GAC with raw water and acetic acid for two to three weeks. The denitrifying bacteria used in the system are indigenous to the natural groundwater, meaning the system is naturally seeded with bacteria present in the groundwater.
During the pilot, a clone library analysis was performed on the bacteria within the biofilter to classify the various types of denitrifying bacteria present. The analysis revealed a diverse community of bacteria. At least 10 different denitrifying genera were identified, including Acidovorax, which comprised approximately 37 percent of the total bacteria in the FXB biofilters. The bacteria identified were gram negative, suggesting that they would be particularly sensitive to chemical disinfection, as gram-negative bacteria tend to have thin cell walls.
Source Water Quality
Nitrate (mg/L N)o Average – 17 o Minimum – 10o Maximum – 20
Co-contaminantso Perchlorate: 6 g/Lo DBCP: 0.025 µg/L
Treatment Type Fixed Bed Bioreactor
System Capacity 2.4 MGD (1670 gpm)
Raw Water Nitrate 10 -20 mg/L as N

FINAL REPORT June, 2011Biological Denitrification (BD) Page 105
Copyright © 2011 American Water Works Association. All Rights Reserved.
Treatment Technology Selection
The FXB process has been used successfully for removal of nitrate from drinking water supplies in Europe for decades, but has not yet been used full-scale in the United States. Reasons for using the FXB process at the Arlington Desalter include the following:• Nitrate is not concentrated in a waste stream, as in RO or IX treatment, but is converted to nitrogen gas,
which is released to the atmosphere—a harmless emission because the atmosphere is 78 percent nitrogen.• Nitrate removal efficiencies are high. Typically, greater than 90 percent removal was achieved during the
Arlington pilot studies and removal to non-detect levels was possible. • The biodenitrification process results in simultaneous destruction of some anthropogenic contaminants.
For example, perchlorate, found in the Arlington Desalter supply, was reduced to non-detect levels in the pilot study.
Historically, IX treatment has been the process of choice for nitrate removal in this country; however, it results in the replacement of nitrate with chloride in the drinking water supply. It is estimated that the equivalent IX system installed at the Arlington Desalter would add approximately 3 million pounds of salt to the basin annually. The removal of salt was the purpose for construction of the Arlington Desalter in the first place.
Treatment System Parameters
Design Capacity o 1,670 gpm capacity
Pretreatmento Substrate and nutrient addition
Post-treatmento Degasification of N2 removal
Filtration for compliance with SWTR
Water Recovery: expected 95% Media: GAC Treatment system foot print TBD
Bioreactor(O2 H2ONO3
- N2
ClO4- Cl-)
Clarification/Filtration(Turbidity Removal)
Electron donorNutrients
Distribution
Chlorine
Reoxygenation(Add O2 and
release N2 bubbles)
Backwash water to sewer, brine line, or solids separation process
Polymer
Residuals Management
The residuals from this process, primarily biological growth, are accumulated in the filtration process. Once a predetermined pressure loss is experienced in filtration, the filters are backwashed to remove the accumulated solids. The solid laden backwash is then sent to the Santa Ana Regional Interceptor (SARI) line and ultimately disposed of off shore.

FINAL REPORT June, 2011Biological Denitrification (BD) Page 106
Copyright © 2011 American Water Works Association. All Rights Reserved.
Technology Benefits and Drawbacks
Benefits Less expensive than other technologies No disposal of waste brine High water recovery rate: > 95% Can remove co-contaminants
Drawbacks No full-scale applications in operation More complicated permitting
Treatment Technology Costs
Detailed cost estimates are being developed. Detailed design of this system may occur in 2012, and full-scale construction of this system may be in 2013.
As an approximation, the below costs are based on a fixed-bed demonstration system for the removal of perchlorate with a similar EBCT (Carollo Engineers, 2008).
Capital Costs (2008 dollars)
Flow Rate: 1000 gpm 2000 gpmTotal: $4,193,000 $7,395,000Direct Installed Costs: $2,373,000 $4,200,000
O & M Costs (2008 dollars)
Total Estimated Annual O&M Costs: $175,000 $348,000Chemicals ($/yr): $161,000 $323,000Other (GAC and Filter Sand) ($/yr): $9,000 $17,000Power ($/yr): $5,000 $8,000
Total Costs (2008 dollars, 2.8% discount rate, 30-year lifecycle)
Amortized Project Costs: $209,000 $368,000Estimated Annual Budget: $384,000 $716,000Total Treatment Costs ($/1000-gal): $0.73 $0.68Total Treatment Costs ($/AF): $238 $222
Source*:
Bernosky, J. 2010. Personal communication.Brown, J. 2010. Personal communication.Carollo Engineers. Final Report: “Fixed-Bed Biological Nitrate Removal Pilot Testing at the Arlington Desalter
Facility.”Carollo Engineers (2008). Final Report: “Direct Fixed-Bed Biological Perchlorate Destruction Demonstration.”
ESTCP Project ER-0544.
*Unpublished sources used in the development of the case studies are not reflected in the References section of this report.

FINAL REPORT June, 2011Brine Treatment Alternatives and Hybrid Treatment Systems Page 107
Copyright © 2011 American Water Works Association. All Rights Reserved.
3.5 Chemical Denitrification (CD)
Chemical denitrification can be accomplished with reduction of nitrate by metals. Various
metals have been investigated for use in nitrate reduction including aluminum and iron (both
Feo and Fe2+), while copper, palladium and rhodium can be used as catalysts in nitrate reduction
(Shrimali & Singh, 2001). The advantage of chemical denitrification over the removal
technologies is that nitrate is converted to other nitrogen species rather than simply displaced
to a concentrated waste stream that requires disposal. Problems with chemical denitrification
of potable water are the reduction of nitrate beyond nitrogen gas to ammonia, partial
denitrification and insufficient nitrate removal (nitrite can be converted to nitrate with the use
of chlorine in disinfection). No full-scale chemical denitrification systems have been installed in
the United States for the removal of nitrate in potable water treatment. A significant body of
research has explored the use of zero valent iron (ZVI) in denitrification. Several patented
granular media options are also emerging, including SMI-III® (Sulfur Modified Iron), MicroNose™
Technology, and Cleanit®-LC.
Based on lab and pilot scale studies, there is much variation in the configuration of chemical
denitrification systems for nitrate removal from potable water. The generic mechanism of
denitrification involves the transfer of electrons from an electron donating metal to nitrate. As
in biological denitrification, nitrate is reduced in accordance with Eqn. 9. However, in contrast
with biological denitrification, using chemical denitrification, the nitrogen in nitrate is often
reduced to the least oxidized form, ammonium (Eqn. 9a) (Hao et al., 2005; and Huang et al.,
1998).
NO3- NO2
- NO N2O N2 (Eqn. 9)NO3
- NO2- NH4
+ (Eqn. 9a)
Nitrate is exposed to an electron donating metal by passing the treatment stream through
granular media. Particle size, surface area and surface chemistry are important media
characteristics related to the efficiency of nitrate removal.

FINAL REPORT June, 2011Brine Treatment Alternatives and Hybrid Treatment Systems Page 108
Copyright © 2011 American Water Works Association. All Rights Reserved.
3.5.1 Zero Valent Iron (ZVI)
Due to the extensive research focused on the use of zero valent iron (ZVI), ZVI will serve as a
preliminary example. There is some variation in the use of ZVI. Forms of application include
powdered iron, stabilized iron as nanoparticles, iron filings and permeable reactive barriers
(PRBs). Relevant reactions are listed in Eqns. 13 to 18 (Hao et al., 2005; Huang et al., 1998; and
Xiong et al., 2009). Nitrate can be reduced to nitrite (Eqn. 14), ammonia (Eqn. 15) or nitrogen
gas (Eqn. 18) by ZVI. Following nitrate reduction to nitrite, nitrite can then be reduced to
ammonia (Eqn. 17). Nitrate can also be reduced by the hydrogen gas that is produced from
corrosion reactions (Eqn. 13) to ammonia (Eqn. 16).
Feo + 2H+ H2(g) + Fe2+ (Eqn. 13)Feo + NO3
- + 2H+ Fe2+ + NO2- + H2O (Eqn. 14)
4Feo + NO3- + 10H+ NH4
+ + 4Fe2+ + 3H2O (Eqn. 15)NO3
- + 4H2 + 2H+ NH4+ + 3H2O (Eqn. 16)
3Feo + NO2- + 8H+ 3Fe2+ + NH4
+ + 2H2O (Eqn. 17)5Feo + 2NO3
- + 6H2O N2(g) + 5Fe2+ + 12OH- (Eqn. 18)
The reduction of nitrate by iron is characterized by an increase in pH and consumption of
hydrogen ions. pH is a significant controlling factor for this treatment method (Hao et al.,
2005). The kinetics of nitrate reduction by ZVI have been thoroughly covered in the literature
to determine the reaction rate under various conditions. For example, Alowitz & Scherer
(2002) examined the nitrate reduction rates of three types of iron. Findings indicate that
reduction rate increases with decreasing pH. Huang et al. (1998) investigated the use of
powdered zero-valent iron (ZVI) for the reduction of nitrate to ammonia. Highly pH dependent,
nitrate reduction was kinetically favorable only at a pH below 4. The minimum ratio of iron to
nitrate was 120 m2/mol NO3- for complete reduction within 1 hour. Nitrate reduction by ZVI
can be optimized through pretreatment of iron particles. High temperature exposure to
hydrogen gas and deposition of copper were explored separately as options for pretreatment
of the iron surface (Liou et al., 2005). Both methods resulted in improvement of nitrate
reduction in almost neutral solutions. The mechanism of improvement is due to the surface
chemistry of iron. With a buildup of a surface oxide layer, the availability of sites for nitrate
reduction decreases. Hydrogen gas pretreatment reduces the oxide layer, while deposited

FINAL REPORT June, 2011Brine Treatment Alternatives and Hybrid Treatment Systems Page 109
Copyright © 2011 American Water Works Association. All Rights Reserved.
copper serves as a catalyst for the transfer of electrons. In their investigation of stabilized ZVI
nanoparticles, Xiong et al. (2009) found that the end product of denitrification (nitrogen gas
versus ammonium) could be controlled by the iron to nitrate ratio and the use of catalysts.
Figure 3-12 Surface Chemistry of ZVI Particles (Chui, 2009).
Examination of the surface chemistry of ZVI particles is of the utmost importance to model and
understand its use in the reduction of nitrate. Illustrated in Figure 3-12, relevant factors
include: corrosion of ZVI, complexation with water, surface complexation, reduction,
precipitation and adsorption. In the corrosion of ZVI, the formation of “green rusts” and
“suspended green particles” is associated with stabilization of pH and steady decrease in nitrate
(Choe et al., 2004). For nitrate reduction to occur, contact with the reducing agent is required.
Reduction of nitrate by ZVI or by any surface bound species requires access to surface sites.
Competition for surface sites can impede nitrate reduction; Moore & Young (2005) examined
chloride as a potential competitor. Results indicate a minimal impact on nitrate removal;
however, other competing ions could be important regarding both competition for adsorption
sites and reduction.

FINAL REPORT June, 2011Brine Treatment Alternatives and Hybrid Treatment Systems Page 110
Copyright © 2011 American Water Works Association. All Rights Reserved.
3.5.2 Catalytic Denitrification
An extension of chemical denitrification, catalytic denitrification involves metal reduction of
nitrate in the presence of a catalyst. Extensive research has investigated catalytic
denitrification which may become more readily applicable to potable water treatment with
further advances (Reddy & Lin, 2000; Chen et al., 2003; Constantinou et al., 2007; Gavagnin et
al., 2002; Lemaignen et al., 2002; Palomares et al., 2003; Pintar et al., 2001; Pintar, 2003;
Pirkanniemi & Sillanpaa, 2002; and Sun et al., 2010.)
3.5.3 Chemical Denitrification - Design Considerations
Table 3-14 summarizes key design considerations in the application of chemical denitrification
for nitrate removal from potable water.

FINAL REPORT June, 2011Brine Treatment Alternatives and Hybrid Treatment Systems Page 111
Copyright © 2011 American Water Works Association. All Rights Reserved.
Table 3-14 Summary of Design Considerations for Chemical Denitrification.
Pretreatment pH adjustmentPost-Treatment Filtration for iron removal
pH adjustment Chlorine addition for disinfection and oxidation of iron Gas stripping, breakpoint chlorination (for ammonia)
Chemical Usage pH adjustment (acids and bases) Disinfection and oxidation of iron (chlorine)
O&M Constant monitoring required to ensure efficient nitrate reductiono Nitrate levelso Oxidation reduction potential (ORP)
Monitoring of nitrite and ammonia will also be necessary due to the potential for incomplete denitrification
Management of chemicals o pH adjustment o Disinfection
Waste media and backwash water storage and disposalSystem Components/Design Parameters
Ratio of electron donor to nitrate for desired removal Hydraulic Loading Rate (HLR), Empty Bed Contact Time (EBCT) Reactor configuration (upflow, downflow, in series, in parallel) Gas stripping, breakpoint chlorination to remove ammonia (if ammonia is the end-
product) Monitoring equipment Filtration to remove iron pH adjustment (decreased in pretreatment and increased before distribution) Disinfection
Waste Management and Disposal
Spent media disposal Iron sludge management Backwash water No waste brine or concentrate as in removal processes
Limitations No examples of full-scale application for nitrate treatmento Unknown reliability for full-scale treatmento Unknown costs and operational complications
Potential for incomplete denitrification
3.5.3.1 Water Quality
The performance of chemical denitrification systems can be affected by pH, temperature,
potential interference by co-contaminants, and the availability of surface sites. The reduction
of nitrate by iron is characterized by an increase in pH and consumption of hydrogen ions. pH is
a significant controlling factor for this treatment method (Hao et al., 2005). Alowitz & Scherer
(2002) examined the nitrate reduction rates of three types of iron. Findings indicate that
reduction rate increases with decreasing pH. If nitrate in the water does not come in contact
with the electron donor, then reduction will not be possible. The build-up of precipitates can

FINAL REPORT June, 2011Brine Treatment Alternatives and Hybrid Treatment Systems Page 112
Copyright © 2011 American Water Works Association. All Rights Reserved.
negatively impact nitrate reduction. The appropriate iron to nitrate ratio will be based on
influent and target nitrate concentrations. Product water quality will require monitoring for
nitrate, nitrite and ammonia.
3.5.3.2 System Components and Site Considerations
Major system components include chemical storage (for pH adjustment and disinfection), the
column containing the media, and post-treatment disinfection. With reduction to ammonia,
post-treatment ammonia stripping may also be necessary. Design constraints include
temperature, long EBCTs, avoidance of incomplete denitrification, determination of the
appropriate iron to nitrate ratio, “chlorine demand to oxidize the released iron,” (DSWA, 2010)
and nitrate, nitrite and ammonia monitoring.
3.5.3.3 Residuals Management and Disposal
In contrast to IX and membrane technologies, the burdens of brine and concentrate disposal
are minimized because nitrate is reduced rather than removed. There is no concentrated brine
solution requiring costly disposal. However, disposal of backwash water, spent media, and iron
sludge is necessary.
3.5.3.4 Maintenance, Monitoring and Operational Complexity
With the possibility of incomplete denitrification, monitoring is required to ensure that product
water does not contain high levels of ammonia or nitrite. Exposure of these nitrogen species to
chlorine in disinfection or oxygen downstream can lead to nitrification (oxidation back to
nitrate) in the distribution system, unless controlled. Additional O&M demands include
management of chemicals (acids, bases and chlorine), backwashing the column to maintain
flow and performance, and waste management. Despite having no full-scale installation for
comparison, overall, chemical denitrification may potentially be less operationally complex than
biological denitrification.

FINAL REPORT June, 2011Brine Treatment Alternatives and Hybrid Treatment Systems Page 113
Copyright © 2011 American Water Works Association. All Rights Reserved.
3.5.4 Chemical Denitrification - Emerging Technologies
3.5.4.1 Sulfur-Modified Iron (SMI) Media
Chemical reduction of nitrate has been demonstrated for potable water treatment using sulfur-
modified iron granular media (DSWA, 2010). Certified to the NSF/ANSI Standard 61 for use in
drinking water treatment, SMI-III® is a patented media that is recyclable and offers the
advantage of multiple contaminant removal (SMI-PS, 2009). Arsenic and metals can be
removed via adsorption (Cr(VI) can also be reduced and precipitated), while nitrate is reduced
to ammonia (Prima Environmental) or nitrogen gas (DSWA, 2010). “The SMI-III® manufacturer
believes sulfur modification regulates the environment of reactions to achieve greater and a
consistent nitrate reduction” (DSWA, 2010). Nitrate reduction is governed by the following
reactions (SMI-PS, 2009):
4Fe0 + NO3- + 10H+4Fe2+ + NH4
+ + 3H2O (Eqn. 19)5Fe0 + 2NO3
- + 12H+ 5Fe2+ + N2 + 6H2O (Eqn. 20)
Key advantages of SMI-III® are the ability to remove multiple contaminants simultaneously and
the limited waste disposal costs relative to other nitrate removal options (no brine waste
stream is produced) (DSWA, 2010). Some previous research indicates inconsistent and
insufficient nitrate removal to meet potable water regulations (DSWA, 2010).
DSWA and the City of Ripon, California conducted a pilot study investigating the use of SMI-III®
in potable water treatment. Findings suggest that this treatment option may be suitable for
source nitrate concentrations slightly above the MCL (up to 15.07 mg/L as N (70 mg/L as
nitrate)). Phase A of the pilot study was operated with the SMI-III® media in an up-flow
fluidized bed across a pH range of 6.0-6.8 and with an EBCT of 15 to 30 minutes, while phase B
tested improved media performance across the same pH range and with an EBCT of 30
minutes. Figure 3-13 displays a process schematic of the SMI-III® process.

FINAL REPORT June, 2011Brine Treatment Alternatives and Hybrid Treatment Systems Page 114
Copyright © 2011 American Water Works Association. All Rights Reserved.
Figure 3-13 Process Schematic for Denitrification Using SMI-III® (DSWA, 2010).
Coagulant
pH Adjust(Acid)
StaticMixer
Chlorine
DistributionSystem
Wellhead
StaticMixer
ChlorinepH Adjust
(Caustic)Pressure Filter
SMI-III®
Reactor
To Waste
Backwash
Fluff
The media was fluffed (backwashed in upflow mode) daily to remove oxidized iron and to avoid
media agglomeration. The SMI-III® reactor was followed by coagulation and filtration for the
removal of iron, arsenic and other constituents. In phase A, the greatest nitrate removal (3.88
mg/L as N, 18 mg/L as nitrate) was insufficient to meet the 20% safety margin of the project (a
goal of 7.75 mg/L as N, 36 mg/L as nitrate), with a starting nitrate concentration of 12.92 mg/L
as N (60 mg/L as nitrate). Problems in phase B resulted in operation interruption; however, a
maximum nitrate removal of 5.17 mg/L as N (24 mg/L as nitrate) was achieved. When the pH
was reduced to 6, the system did produce water with nitrate below the MCL and the project
goal nitrate level, on two occasions. Temperature was found to have the most significant
impact on removal efficiency. Nitrate reduction improved with increasing source water
temperatures.
Design constraints include temperature, EBCT, avoidance of incomplete denitrification,
determination of the appropriate iron to nitrate ratio, “chlorine demand to oxidize the released
iron,” clogging from precipitates and pH. Nitrate reduction typically increases with decreasing
pH, increasing EBCT and increasing temperature (DSWA, 2010).

FINAL REPORT June, 2011Brine Treatment Alternatives and Hybrid Treatment Systems Page 115
Copyright © 2011 American Water Works Association. All Rights Reserved.
SMI - Cost ConsiderationsCost analysis in the City of Ripon report included acid, caustic soda and media and excluded
labor and waste management. In both phases, minimal variation in nitrate reduction was found
with operation at a pH of 6 versus a pH of 6.8. Operation at the higher pH minimizes costs due
to prolonging media life and decreasing chemical input. The production costs for operation at a
pH of 6 and 6.8 were estimated to be $729/ac.ft. ($2.24/1000 gal.) and $287/ac.ft. ($0.88/1000
gal.), respectively (DSWA, 2010). Due to dissolution of the media over time, media disposal is
not expected to be necessary. Dissolved iron is oxidized and then removed through filtration.
In the Ripon pilot study backwash water was discharged to the sewer; however, when “…direct
sewer disposal is not feasible, the backwash water must undergo solid/liquid separation with
the decant liquids recycled to the head of the treatment system and the dewatered solids sent
to an appropriate landfill for disposal” (DSWA, 2010). If the waste is deemed hazardous,
disposal can be a major cost consideration.
3.5.4.2 Granular Clay Media
Certified to the NSF/ANSI Standard 61 for use in drinking water treatment, MicroNose™
Technology media is currently being examined in Manteca, California for nitrate removal in
potable water treatment (MicroNose™). The media consists of “absorbent and permeable
pottery granules which function similar to the mucous membrane in the human nose”
(University of Hawaii, 2006). Limited information is available on this emerging technology. The
company states, “MicroNose™ Technology media removes heavy metals, such as arsenic,
manganese, and lead as well as nitrates through non-chemical processes” (MicroNose™).
MicroNose™ offers removal of multiple contaminants concomitantly and claims to be cost
effective, suitable for nitrate removal and a green technology. Additional information is
needed to assess the design considerations, costs and applications of MicroNose™ for nitrate
removal from potable water.

FINAL REPORT June, 2011Brine Treatment Alternatives and Hybrid Treatment Systems Page 116
Copyright © 2011 American Water Works Association. All Rights Reserved.
3.5.4.3 Powdered Metal Media
As an emerging technology, Cleanit®-LC (from North American Höganäs) is a metal powder with
the potential to achieve 60-90% nitrate removal (Lavis, 2010). Certified to the NSF/ANSI
Standard 61 for use in drinking water treatment, this proprietary iron-based powder could be
used for removal of co-contaminants in addition to nitrate, including “arsenic, heavy metals,
phosphates and pathogens” (Lavis, 2010), and potentially hexavalent chromium. Cleanit®-LC
media is characterized by the following: a density of 1800-2100 kg/m3, a particle size of 150-850
microns, and a porosity of 60%. The powder can be used to adsorb arsenic in under 10
minutes, with an arsenic capacity of 4 – 8 mg/g powder.
With an up-flow configuration, the treatment stream is pumped through a column containing
the media, maximizing surface contact. The most significant consideration is the EBCT. At the
particle surface, nitrate is reduced to nitrogen gas with EBCTs of 10 - 30 minutes. Additional
key design factors are pH and temperature. In contrast to membrane technologies, the
burdens of disposal are minimized because nitrate is reduced rather than removed. There is no
concentrated brine solution requiring costly disposal. Preliminary third party results indicate
nitrate removal over 7 months to below the MCL (North American Höganäs, data). However, as
a new product on the market, further research is required to assess Cleanit®-LC for the removal
of nitrate and other constituents in potable water treatment.
3.5.5 Chemical Denitrification - Cost Considerations
For efficient operation of a chemical denitrification system, maintaining efficient nitrate
reduction is essential. Optimal performance includes managing pre and post-treatment to
provide appropriate environmental conditions, while meeting necessary potable water
guidelines. Factors affecting system cost can include facility size (flow rate), source water
quality (including nitrate concentration and co-contaminants), environmental factors
(temperature and pH), and target effluent nitrate concentration.
Capital costs for chemical denitrification include land, housing, piping, media, storage tanks,
O&M equipment, preliminary testing (through pilot studies), permits, and operator training.

FINAL REPORT June, 2011Brine Treatment Alternatives and Hybrid Treatment Systems Page 117
Copyright © 2011 American Water Works Association. All Rights Reserved.
O&M costs include pre and post-treatment, media replenishment and disposal, backwashing,
chemical use (pH adjustment, chlorine), repair, monitoring, maintenance, power, and labor.
The availability of published cost information for chemical denitrification is strictly limited to
pilot scale studies, due to the lack of full scale systems. Cost analysis in the City of Ripon report
included acid, caustic soda and media and excluded labor and waste management. In both
phases, minimal variation in nitrate reduction was found with operation at a pH of 6 versus a
pH of 6.8. Operation at the higher pH minimizes costs due to prolonging media life and
decreasing chemical input. The production costs for operation at a pH of 6 and 6.8 were
estimated to be $729/ac.ft. ($2.24/1000 gal.) and $287/ac.ft. ($0.88/1000 gal.), respectively
(DSWA, 2010). Due to dissolution of the media over time, media disposal is not expected to be
necessary. Dissolved iron is oxidized and then removed through filtration. In the Ripon pilot
study backwash water was discharged to the sewer; however, when “…direct sewer disposal is
not feasible, the backwash water must undergo solid/liquid separation with the decant liquids
recycled to the head of the treatment system and the dewatered solids sent to an appropriate
landfill for disposal” (DSWA, 2010). If the waste is deemed hazardous, disposal can be a major
cost consideration.
3.5.6 Chemical Denitrification - Selected Research
Table A.5 of the Appendix is a list of recent research studies relevant to the use of chemical
denitrification in potable water treatment.
3.5.7 Chemical Denitrification - Summary of Advantages and Disadvantages
A summary of advantages and disadvantages of chemical denitrification in comparison with
other treatment options is listed in Table A.6 of the Appendix. Advantages of chemical
denitrification for nitrate removal from potable water include the conversion of nitrate to other
nitrogen species (no brine or concentrate waste stream), the potential for more sustainable
treatment, and the ability to remove multiple contaminants.
Problems with chemical denitrification of potable water are the potential reduction of nitrate
beyond nitrogen gas to ammonia, the possibility of partial denitrification, and the lack of full-
scale chemical denitrification systems.

FINAL REPORT June, 2011Brine Treatment Alternatives and Hybrid Treatment Systems Page 118
Copyright © 2011 American Water Works Association. All Rights Reserved.
3.6 Brine Treatment Alternatives and Hybrid Treatment Systems
Brine or concentrate disposal can be a great concern with the use of the removal processes, IX,
RO, and ED/EDR, especially for inland communities. Brine treatment and recycling alternatives
have the potential to address disposal concerns, improving sustainability and decreasing
operating costs. Hybrid systems, combining different nitrate treatment technologies, have
been explored to include the advantages of multiple treatment options, while avoiding their
respective disadvantages (Kabay et al., 2007; Matos et al., 2006; Pintar et al., 2001; Van Ginkel
et al., 2008; and Wisniewski et al., 2001). Table 3-15 lists a selection of additional research
related to brine treatment alternatives and the use of hybrid systems to improve nitrate
treatment performance.
The combination of denitrification methods with removal technologies enables resolution of
common problems with each option. The brine waste stream from IX, for example can be
treated using biological denitrification to reduce nitrate to nitrogen gas. Biological
denitrification of IX waste brine using an upflow sludge blanket reactor (USBR) was
demonstrated at the lab-scale by van der Hoek & Klapwijk (1987). Clifford & Liu (1993)
implemented a lab-scale sequencing batch reactor (SBR) for the denitrification of waste brine
resulting in the ability to recycle the treated waste brine for 15 regeneration cycles. The SBR
process was pilot tested in McFarland, CA (Liu & Clifford, 1996). With denitrification of spent
brine followed by reuse, a 95% decrease was achieved in salt waste. Use of a membrane bio-
reactor in this context has also been explored (Bae et al., 2002; Van Ginkel et al., 2008; Chung
et al., 2007). Through the reduction or destruction of nitrate in spent IX brine, disposal needs
may be significantly reduced as treated brine can be repeatedly recycled back for use in resin
regeneration. Additionally, through treatment of RO or ED/EDR waste concentrate, removal of
nitrate from the waste stream may improve disposal options.

FINAL REPORT June, 2011Brine Treatment Alternatives and Hybrid Treatment Systems Page 119
Copyright © 2011 American Water Works Association. All Rights Reserved.
Table 3-15 Selected Research on Brine Treatment Alternatives and Hybrid Systems for Nitrate Treatment of Potable Water.
IX and Catalytic Reduction Pintar et al. (2001)
RO and EDR EET Corporation (2008)
IX and EDR Kabay et al. (2007)
ED and MBR Wisniewski et al. (2001)
IX and Biological Denitrification
Clifford & Liu (1993), Van Ginkel et al. (2008), Bae et al. (2002), Van der Hoek & Klapwijk (1987)
RO and VSEP Lozier et al. (N.D.)Electrochemical destruction of nitrate (in IX brine)
DOW/STWP collaboration (Goltz & Parker, 2010/2011), Dortsiou et al. (2009), and Yu & Kupferle (2008).
3.6.1 Electrochemical Destruction of Nitrate in Waste Brine
Two major companies are developing a system which incorporates IX with electrochemical
destruction of nitrate. With the removal of nitrate from spent brine, the brine can be recycled for
reuse in regeneration (Goltz, 2010 and Goltz & Parker, 2010/2011). Spent brine is treated
following IX treatment. With electricity distributed over a high surface area electrode, upon
contacting the electrode surface, nitrate in the brine waste is reduced to nitrogen gas. In the
overall reaction, nitrate is reduced and water is oxidized producing nitrogen gas and oxygen.
Possible reduction to ammonia/ammonium is accounted for in the process. Laboratory tests have
been successful and planning of site tests is underway to examine system performance across a
variety of raw water characteristics. The potential benefits of this brine treatment alternative are
in the increased sustainability and the decreased disposal costs. The objective is to optimize the
process such that the savings on disposal costs, especially for inland communities, outweigh the
increased electricity costs of the process.
3.6.2 Catalytic Treatment of Waste Brine
Calgon Carbon is working with the University of Illinois to develop a brine recovery system with
the goal of up to 90% brine recovery for reuse using Pd-based catalytic treatment (Drewry,
2010). The following information was provided by Dr. Charles Werth (2010) from the
University of Illinois.

FINAL REPORT June, 2011Brine Treatment Alternatives and Hybrid Treatment Systems Page 120
Copyright © 2011 American Water Works Association. All Rights Reserved.
Figure 3-14 Schematic of an Ion Exchange System with Brine Regeneration Coupled with Catalytic Treatment of Brine for Reuse (Werth, 2010).
As illustrated in Figure 3-14, “The spent brine solution is equilibrated with hydrogen in a gas-liquid membrane, and subsequently treated to remove nitrate in the packed bed catalyst system containing Pd-In on granular activated carbon (GAC). The treated brine is then put back into a holding tank and reused when ion exchange breakthrough occurs again” (Werth, 2010).
Advantages of this brine treatment alternative include conversion of nitrate mainly to nitrogen
gas, avoidance of the need for brine waste disposal, and rapid reduction of nitrate with the Pd-
based catalyst. Disadvantages include the use of flammable hydrogen gas, some conversion of
nitrate to ammonia, “the cost of Pd and potential fouling of the catalyst which requires
regeneration using a strong oxidant like hypochlorite (Chaplin et al., 2007)” (Werth, 2010).
Catalytic removal of nitrate has not yet been implemented at the full-scale, but “catalytic systems
have been used to remove chlorinated solvents at contaminated groundwater field sites, and they
appear to be economically competitive (Davie et al., 2008)” (Werth, 2010). Dr. Werth stated,
“Catalytic systems show great promise for removing nitrate from IX brines, but pilot scale
studies are needed to evaluate the economic viability.”

FINAL REPORT June, 2011Residential Treatment (Point-of-Use, Point-of-Entry) Page 121
Copyright © 2011 American Water Works Association. All Rights Reserved.
3.7 Residential Treatment (Point-of-Use, Point-of-Entry)
Point-of-Use (POU) and Point-of-Entry (POE) water treatment devices can be used to address
high nitrate levels and other constituents of concern at the residential scale. A POU treatment
device is installed for the purpose of reducing contaminants in drinking water at a single tap,
typically the kitchen tap. A POE treatment device is installed for the purpose of reducing
contaminants in drinking water entering a house or building.
Treatment technologies for POU and POE systems, used to address nitrate contamination,
include IX, RO and distillation (Mahler et al., 2007). IX is generally considered more for POE
than for POU and requires disposal of concentrated waste brine. RO systems require more
maintenance and have lower water recovery (Mahler et al., 2007). However, according to the
New Hampshire Department of Environmental Services (2006), RO “is the most cost effective
method for producing only a few gallons of treated water per day” (NHDES, 2006). While
distillation can require lower maintenance, energy demands are higher than the other options.
Distillation systems are generally intended as POU devices as they remove all minerals and
produce water that is aggressive towards plumbing materials.
Certification to the relevant ANSI/NSF standards by an ANSI accredited third party certifier
ensures the safety and performance of the residential treatment systems. In the U.S., the
following certifiers have been accredited by ANSI to certify drinking water treatment systems:
Canadian Standards Association International (www.csa-international.org); International Association of Plumbing & Mechanical Officials (www.iapmo.org); NSF International (www.nsf.org); Underwriters Laboratories Inc. (www.ul.com); and Water Quality Association (www.wqa.org).
Numerous RO devices for nitrate removal are certified to the ANSI/NSF standard specific to RO
POU devices: NSF Standard 58 - Reverse osmosis drinking water treatment systems (NSF, 2009).
Additionally, the Water Quality Association, an accredited certifier, lists two POU ion exchange
devices for nitrate removal that are certified to NSF Standard 53: Drinking Water Treatment
Units – Health Effects (Water Quality Association, 2011). All the technologies listed above are
capable of reducing nitrate levels. However, it is important to conduct periodic testing using an

FINAL REPORT June, 2011Residential Treatment (Point-of-Use, Point-of-Entry) Page 122
Copyright © 2011 American Water Works Association. All Rights Reserved.
accredited laboratory on both the influent water and the water produced by the treatment
system to verify that it is working effectively.
The CDPH provides a list of approved POU devices for nitrate treatment and only RO systems
are listed (CDPH, 2009). Published cost information for POU systems is listed in Table 3-16.
Based on a survey in Minnesota, “the average cost of nitrate removal systems was $800 to
install and $100 per year to maintain” (Lewandowski, 2008). It is important to note that water
systems are responsible for meeting federal, state and local requirements and the allowable
uses of POU/POE devices vary by state.
Table 3-16 Costs of POU Treatment for Nitrate Removal (from Mahler et al., 2007).
Upfront Investment Annual Costs Comments
Ion Exchange $660-$2425[1] Salt costs ($3.30-$4.40/bag)[1]
Requires disposal of brine waste
Distillation4-10 gal/d
$275-$1650[1] $440-$550/yr +electricity[1] Requires scale removal, higher energy use
Reverse Osmosis2-10 gal/d
$330-$1430[1] $110-$330/yr + electricity[1] Requires filter replacement, high maintenance, lower water recovery
Costs have been adjusted to 2010 dollars, unless indicated otherwise.[1] Mahler et al. (2007).

FINAL REPORT June, 2011References Page 123
Copyright © 2011 American Water Works Association. All Rights Reserved.
4.0 References
Alowitz, M.J. and Scherer, M.M. 2002. Kinetics of nitrate, nitrite, and Cr(VI) reduction by iron metal. Environ. Sci & Technol., 36(3), 299-306.
American Water Works Association (AWWA) (1995). “Electrodialysis and Electrodialysis Reversal.” Manual of Water Supply Practices – M38, First Edition, AWWA, Denver, Colorado.
Ameridia Division of Eurodia Industrie (N.D.) “Electrodialysis for Nitrate Removal in Drinking Water.” Accessed August 8, 2010 via http://www.ameridia.com/html/pw.html.
Applied Research Associates (N.D.). “Large-Scale Demonstration of Perchlorate Removal Using Weak Base Anion Resin.” Accessed August 21, 2010 via <http://www.ara.com/perchlorate/PDFs/Perchlorate-Technology.pdf>
ARA & Purolite - Applied Research Associates and The Purolite Company (N.D.a). “Perchlorate Ion Exchange Process using Weak Base Anion Resin.” Accessed October 8, 2010 via < http://www.purolite.com/customized/uploads/pdfs/Perchlorate%20Brochure.pdf >.
ARA & Purolite – Applied Research Associates and The Purolite Company (N.D.b). “The “WIN” Process: Performance Test.”
ARA & Purolite – Applied Research Associates and The Purolite Company (N.D.c). “Regenerable Weak Base Anion Exchange Process for Treatment of Perchlorate in Drinking Water.”
Arnold, Ken (2004). “Low-Cost Solution to Treating Nitrates in Drinking Water.” Water Quality Products, 9 (6). Accessed July 8, 2010 via <http://www.wqpmag.com/Low-Cost-Solution-to-Treating-Nitrates-in-Drinking-Water-article5208>.
Aslan, Ş. (2005). “Combined removal of pesticides and nitrates in drinking waters using biodenitrification and sand filter system.” Process Biochemistry, 40, 417-424.
Bae, B.U., Jung, Y.H., Han, W.W., and Shin, H.S. (2002). “Improved brine recycling during nitrate removal using ion exchange.” Water Research, 25, 3330-3340.
Banasiak, L. and Schafer, A. (2009). “Removal of boron, fluoride and nitrate by electrodialysis in the presence of organic matter.” Journal of Membrane Science, 334, 101-109.
Basin Water (2007) Water Online. Accessed August 20, 2010 via <http://www.wateronline.com/article.mvc/Basin-Water-To-Provide-Groundwater-Nitrate-Re-0001>
Bates, W.T. (N.D.). “Cleaning your RO.” Hydranautics. Accessed July 17, 2010 via <http://www.membranes.com/docs/papers/02_cleaning.pdf.>
BESST, Inc. (2008). “BESST August 2008 Profiling Services Guide: Edition #1.” Accessed July 19, 2010 via http://www.besstinc.com/pdf/WSW%20Presentation%20083008.pdf
Bilidt, H. (1985). “The use of reverse osmosis for removal of nitrate in drinking water.” Desalination, 53, 225-230.Black, J. (2003, May 1). “Treasure from the Deep: Drinking Water.” Business Week Online May 1, 2003.Boodoo, F. (2004). “Multi-Contaminant Control with Ion Exchange.” The Purolite Company. Accessed December
12, 2010 via <http://www.purolite.com/customized/uploads/pdfs/Multi-Contaminant%20Control.pdf>Boyer, T.H. and Singer, P.C. (2006). “A pilot-scale evaluation of magnetic ion exchange treatment for removal of
natural organic material and inorganic anions.” Water Research, 40, 2865-2876.Brown, J.C. (2008). “Biological Treatments of Drinking Water.” In: National Academy of Engineering. Frontiers
of Engineering: Reports on Leading–Edge Engineering from the 2007 Symposium. National Academies Press, Washington DC.
Calgon Carbon Corporation (2004). “ISEP® System – Continuous Ion Exchange Separations.” Calgon Carbon Corporation (2007). “Case History: City of Chino: Their Road to Nitrate Removal.”Cannella, A. (2009). “State of the City Address 2009.” City of Ceres, CA. Mayor Anthony Cannella. Accessed
August 20, 2010 via http://www.ci.ceres.ca.us/newsroom/20090723.pdf.Carollo Engineers (2008). Final Report: “Direct Fixed-Bed Biological Perchlorate Destruction Demonstration.”
ESTCP Project ER-0544.CDPH, California Department of Public Health (2009). “List of Certified Water Treatment Devices Certified for the
Reduction of Nitrates.” California Department of Public Health, Drinking Water Program, April, 2009. Central Arizona Salinity Study, Phase II - Concentrate Management (2006). Prepared in partnership with the City
of Glendale, City of Mesa, City of Phoenix, City of Scottsdale, City of Tempe, Arizona-American Water Company, City of Chandler, City of Goodyear, City of Peoria, City of Surprise, City of Tucson, Town of

FINAL REPORT June, 2011References Page 124
Copyright © 2011 American Water Works Association. All Rights Reserved.
Buckeye, Town of Gilbert, Queen Creek Water Company, Brown and Caldwell, and the Bureau of Reclamation. Accessed October 28, 2010 via <http://phoenix.gov/WATER/ph2concen.pdf>.
Cevaal, J.N., Suratt, W.B., and Burke, J.E. (1995). “Nitrate removal and water quality improvements with reverse osmosis for Brighton, Colorado.” Desalination, 103, 101-111.
Chabani, M, Amran, A. and Bensmaili, A. (2006). “Kinetic modeling of the adsorption of nitrates by ion exchange resin.” Chemical Engineering Journal, 125, 111-117.
Chaplin, B.P., Shapley, J.R., and Werth, C.J. (2007). “Regeneration of sulfur-fouled bimetallic Pd-based catalysts.” Environ. Sci. Technol., 41, 5491-5497.
Chen, Y., Zhang, Y. and Chen, G. (2003). “Appropriate conditions or maximizing catalytic reduction efficiency of nitrate into nitrogen gas in groundwater.” Water Research, 37, 2489-2495.
Chen, W.H., Haunschild, Kand Lund, J.R. (2008). “Delta Drinking Water Quality and Treatment Costs: Technical Appendix H.” Appendix to Comparing Futures for the Sacramento-San Joaquin Delta, Public Policy Institute of California.
Chen, B., Nam, S., Westerhoff, P.K., Krasner, S.W., and Amy, G. (2009). “Fate of effluent organic matter and DBP precursors in an effluent dominated river: A case study of wastewater impact on downstream water quality.” Water Research, 43, 1755-1765.
Choe, S., Liljestrand, H.M. and Khim, J. (2004). “Nitrate reduction by zero-valent iron under different pH regimes.” Applied Geochemistry, 19, 335-342.
Chui, P. (2009). Presentation: “Simultaneous removal of viruses and DBP precursors (NOM) from drinking water using Zero-Valent Iron.” Department of Civil & Environmental Engineering, University of Delaware. Accessed May 9, 2010 via http://www.csawwa.org/pdf_Files/CSAWWASeminar2009_2.pdf
Chung, J., Nerenberg, R., and Rittmann, B.E. (2007). “Evaluation for Biological Reduction of Nitrate and Perchlorate in Brine Water Using the Hydrogen-Based Membrane Biofilm Reactor.” Journal of Environmental Engineering, 133(2), 157-164.
City of Fresno (2008). “Report to the City Council.” Accessed October 28, 2010 via <http://www.fresno.gov/CouncilDocs/Agenda9.30.2008/1k.pdf>.
City of Thornton. (2010). “Biological Nitrate Removal Pre-treatment System for a Drinking Water Application # 4202.” Water Research Foundation Final Project Update.
Clifford, D. and Weber, W.J. Jr. (1978). Nitrate Removal from Water Supplies by Ion Exchange. Cincinnati, OH: USEPA.
Clifford, D. and Weber, W.J. Jr. (1983). “The Determinants of Divalent/Monovalent Selectivity in Anion Exchangers.” Reactive Polymers, 1, 77-89.
Clifford, D., Lin, C-C., Horng, L-L., and Boegel, J. (1987). “Nitrate Removal from Drinking Water in Glendale, Arizona.” USEPA, EPA-600/S2-86/107.
Clifford, D. and Liu, X. (1993). “Biological Denitrification of Spent Regenerant Brine Using a Sequencing Batch Reactor.” Water Research, 27 (9), 1477-84.
Clifford, D. (2007). “Nitrate Ion Exchange with and without Brine Reuse.” Presentation at EPA Workshop on Inorganic Contaminant Issues.
Clifford, D. A., Sorg, T. and Ghurye, G. (2010). “Ion Exchange and Adsorption of Inorganic Contaminants.”Chapter Twelve in Water Quality and Treatment Sixth Edition, pp. 12.1-12.97, James K. Edzwald, ed.,AWWA and McGraw Hill, Inc., New York, 2010.
Conlon, W.J., Blandon, F.A. and Moody, J. (1995). “Cost comparison of treatment alternatives for the removal of nitrates and DBCP from Southern California groundwater.” Desalination, 103, 89-100.
Constantinou, C., Costa, C., and Efstathiou, A. (2007). “The Remarkable Effect of Oxygen on the N2 Selectivity of Water Catalytic Denitrification by Hydrogen.” Environmental Science and Technology, 41(3), 950-956.
Contaminant Removal News (2007). “Regulator Lifts Eight-Year Old Administrative Order Against City, Eight Months After Installation of Ion Exchange Treatment Plant.” Contaminant Removal News, 1 (1), August, 2007. Accessed online August 20, 2010 via http://www.purolite.com/RelId/606350/ISvars/default/customized/uploads/pdfs/McCook%20print.pdf.
Davie, M.G., Cheng, H., Hopkins, G.D., LeBron, C.A., and Reinhard, M. (2008). “Implementing heterogeneous catalytic dechlorination technology for remediating TCE-contaminated groundwater.” Environ. Sci. Technol., 42, 8908–8915.
Della Rocca, C., Belgiorno, V., Meric, S. (2006). “An heterotrophic/autotrophic denitrification (HAD) approach for nitrate removal from drinking water.” Process Biochemistry, 41, 1022-1028.

FINAL REPORT June, 2011References Page 125
Copyright © 2011 American Water Works Association. All Rights Reserved.
Dördelmann, O., Panglisch, S., Klegraf, F., Hell, F., Moshiri, A., Emami, A. and Höll, W. (UNKNOWN). “Nitrate Removal from Drinking Water in Iran – An Assessment of Three Different Treatment Processes Based on Pilot-Scale Investigations.”
Dördelmann, O., Buchta, P. Panglisch, S., Klegraf, F., Moshiri, A., and Emami, A. (2006). “Heterotrophic Denitrification in Drinking Water Treatment – Results from Pilot Plant Experiments in Mashhad/Iran.” In: Recent Progress in Slow Sand and Alternative Biofiltration Processes. Rolf Gimbel (Ed). ISBN: 9781843391203 IWA Publishing, London, UK. 433 – 442.
Dördelmann, O. (2009). “Full-scale Biological Denitrification plants in Germany, Austria and Poland.” AWWA Water Quality Technology Conference (WQTC). Seattle, WA, November 2009.
Dortsiou, M, Katsounaros, I., Polatides, C., and Kyriacou, G. (2009). “Electrochemical removal of nitrate from the spent regenerant solution of the ion exchange.” Desalination, 248, 923-930.
Dow Chemical Company, (2010). “How to Design an Ion Exchange System.” Accessed July 17, 2010 via <http://www.dow.com/liquidseps/design/ixdesign_regen.htm and http://www.dow.com/liquidseps/design/ixdesign_efficiencies.htm.>
Dow Chemical Company (2010b). “CADIX Software.” Accessed July 17, 2010 via <http://www.dow.com/liquidseps/design/cadix.htm>
Dow Chemical Company (2010c). “DOW Ion Exchange Resins – Removal of Nitrate.” Accessed July 17, 2010 via <http://dow-answer.custhelp.com>.
Dow Chemical Company (2010d). “DOWEX Ion Exchange Resins.” Accessed August 21, 2010 via<http://www.inaqua.de/Prod/ion/pdf_en/204_Dowex_en.pdf >
Dow Water and Process Solutions. See Goltz, Robert.Drewes, J.E., Bellona, C.L., Xu, P., Amy, G.L., Filteau, G., Oelker, G. (2008). “Comparing Nanofiltration and
Reverse Osmosis for Treating Recycled Water.” Water Research Foundation Final Report, # 91212.Drewry, C. (2010). Representative from Calgon Carbon. Personal communication.DSWA (Damon S. Williams Associates) and City of Ripon, California (2010). “City of Ripon, California
Proposition 50 Project – Integrated Nitrate and Arsenic Treatment Demonstration.” ID No. P50-3910007-055. Dvorak, B.I. and Skipton, S.O. (2008). “Drinking Water Treatment: Reverse Osmosis.” NebGuide, University of
Nebraska, Lincoln. Accessed April 25, 2011 via <http://www.ianrpubs.unl.edu/epublic/live/g1490/build/g1490.pdf>
Edwards, M., Jacobs, S. and Dodrill, D.M. (1999). “Desktop guidance for mitigating Pb and Cu corrosion by-products.” Journal AWWA, 91 (5), 66-77.
Edwards, M. and Triantafyllidou, S. (2007). “Chloride-to-sulfate mass ratio and lead leaching to water.” Journal AWWA, 99 (7), 96-109.
EET Corporation (2008), “How Does HEEPMTM Work?” Accessed August 21, 2010 via http://www.eetcorp.com/heepm/heepmworkcont.htm
Elyanow, D. and Persechino, J. (2005). “Advances in Nitrate Removal.” GE – General Electric Company, Water & Process Technologies. Accessed June 11, 2010 via < http://www.gewater.com/pdf/Technical%20Papers_Cust/Americas/English/TP1033EN.pdf>.
Engle, D. (2007). “The HERO Treatment.” Onsite Water Treatment: The Journal for Decentralized Wastewater Treatment Systems, November/December 2007. Accessed October 27, 2010 via <http://www.foresterpress.com/ow_0711_ultra.html>.
Envirogen Technologies, Inc. (N.D.). “Case Study: City of Pomona, California.”Envirogen Technologies, Inc. (N.D.a). “High Efficiency Ion Exchange for Arsenic and Nitrate.”Envirogen Technologies, Inc. (N.D.b). “Case Study: Hi-Desert Water District, California.”Envirogen Technologies, Inc. (2010). “Envirogen Technologies Starts Up Uranium and Nitrate Removal System for
East Valley Water District of San Bernardino County.” Ergas, S.J. and Rheinheimer, D.E. (2004). “Drinking water denitrification using membrane bioreactor.” Water
Research, 38, 3225-3232.Excel Water Technologies, Inc. (2007). “Reverse Osmosis Membrane Applications.” Accessed October 28, 2010
via < http://www.excelwater.com/eng/b2c/our_product_membrane.php>.Gabelich, C.J., Gerringer, F.W., Franklin, J.C., Gao, J., Cohen, Y. and Suffet, I.H. (2004). “Reverse Osmosis
Pretreatment: Challenges with Conventional Treatment,” in Proceedings of the 2004 AWWA ACE Meeting,Orlando, Florida.

FINAL REPORT June, 2011References Page 126
Copyright © 2011 American Water Works Association. All Rights Reserved.
Gavagnin, R., Biasetto, L., Pinna, F. and Strukul, G. (2002). “Nitrate removal in drinking waters: the effect of tin oxides in the catalytic hydrogenation of nitrate by Pd/SnO2 catalysts.” Applied Catalysis B: Environmental, 38, 91-99.
GE – General Electric Company (N.D.). “GE and Public Water Supplies: Representative Installations (RO, NF, EDR).” GE Water & Process Technologies.
GE – General Electric Company (2008). “GE 2020 EDR Systems: Electrodialysis Reversal Technology.” GE Water & Process Technologies.
GE – General Electric Company (2010). “Electrodialysis Reversal (EDR).” Accessed June 11, 2010 via <http://ge.ecomagination.com/products/electro-dialysis-reversal.html>.
GE – General Electric Company (2010b). “HERO: High-efficiency RO process boosts recovery ratios, cuts cleaning frequency.” GE Power & Water, Water & Process Technologies. Accessed October 28, 2010 via <http://www.gewater.com/products/equipment/spiral_membrane/HERO.jsp>.
Ghafari, S., Hasan, M. and Aroua, M.K. (2008). “Bio-electrochemical removal of nitrate from water and wastewater – A review.” Bioresource Technology, 99, 3965-3974.
Goltz, R. and Parker, G.R. (2010/2011). Abstract submittal for 2011 AWWA Annual Conference and Exposition. “An Integrated Selective Ion Exchange Electrochemical Destruct Process for Nitrate in Ground water.”
Goltz, R. (2010). Personal Communication with Robert Goltz from Dow Water and Process Solutions on November 2, 2010.
Gormly, S. and Borg, C. (N.D.). Presentation: “Introducing an Advanced Technology for Sustainable Nitrate Removal for Ground Water Treatment.” Accessed October 28, 2010 via <http://www.c3p.org/Workshop%202007%20Documents/Sherwin%20Gormly_APT%20Sustainable%20Water%20Hab.pdf>.
Guter, G.A. (1982). “Removal of Nitrate from Contaminated Water Supplies for Public Use: Final Report.” Cincinnati, OH: USEPA, EPA-600/2-82-042.
Guter, G.A. (1983). United States Patent No. 4479877. “Removal of nitrate from water supplies using a tributyl amine strong base anion exchange resin.” Accessed December 14, 2010 via <http://www.freepatentsonline.com/4479877.html>
Guter, G.A. (1995). Chapter: “Nitrate Removal from Contaminated Groundwater by Anion Exchange.” In Ion Exchange Technology: Advances in Pollution Control. Sengupta, A.K., ed. Lancaster, PA: Technomic Publishing Company.
Hao, Z. Xu, X. and Wang, D. (2005). “Reductive denitrification of nitrate by scrap iron filings.” Journal of Zhejiang University SCIENCE, 6B (3), 182-186.
Haugen, K.S., Semmens, M.J. and Novak, P.J. (2002). “A novel in situ technology for the treatment of nitrate contaminated groundwater.” Water Research, 36, 3497-3506.
Hell, F., Lahnsteiner, J., Frischherz, H. and Baumgartner, G. (1998). “Experience with full-scale electrodialysis for nitrate and hardness removal.” Desalination, 117, 173-180.
Helfferich, F.G. (1995). Ion Exchange. Dover Publications, Inc., New York.Hilkert, E.J., Young, T.M., Green, P.G. and Darby, J.L. (2010). “Costs of arsenic treatment for potable water in
California and comparison to USEPA affordability metrics.” Journal of American Water Resources Association, 46 (6), 1238-1254.
Holl, W. (1995). “CARIX Process--A Novel Approach to Desalination by Ion Exchange.” In Ion Exchange Technology: Advances in Pollution Control. Sengupta, A.K., ed. Lancaster, PA: Technomic Publishing Company.
Holló, J. and Czakó, L. (1987). “Nitrate Removal from Drinking Water in a Fluidized-Bed Biological Denitrification Bioreactor.” Acta Biotechnol., 7 (5), 417-423.
Howe, K.J. (2004). “Technical Challenges to Concentrate Disposal from Inland Desalination.” The University of New Mexico, Department of Civil Engineering. In: Proceedings Identifying Technologies to Improve Regional Water Stewardship: A Conference Series Featuring Intersections of Technology and Water Management North – Middle Rio Grande Corridor.
Huang, C.-P., Wang, H.-W. and Chiu, P.-C. (1998). “Nitrate reduction by metallic iron.” Water Research, 32 (8), 2257-2264.
Hunter, W.J. (2001). “Use of vegetable oil in a pilot-scale denitrifying barrier.” Journal of Contaminant Hydrology, 53 (2), 119–131.
Humbert, H., Gallard, H., Suty, H., and Croue, J. (2005). “Performance of selected anion exchange resins for the treatment of high DOC content surface water.” Water Research, 39, 1699-1708.

FINAL REPORT June, 2011References Page 127
Copyright © 2011 American Water Works Association. All Rights Reserved.
Hydranautics (2001). “Commercial RO Technology.” Accessed August 21, 2010 via http://www.es.flinders.edu.au/~mattom/Utilities/salcon.html.
Johnston, R. and Heijnen, H. (N.D.). “Safe Water Technology for Arsenic Removal.” Technologies for Arsenic Removal from Drinking Water.
Kabay, N., Yuksel, M., Samatya, S., Arar, O. and Yuksel, U. (2007). “Removal of Nitrate from Ground Water by a Hybrid Process Combining Electrodialysis and Ion Exchange Processes.” Separation Science and Technology, 42(12), 2615-2627.
Kapoor, A. and Viraraghavan, T. (1997). “Nitrate Removal from Drinking Water – Review.” Journal of Environmental Engineering, 123(4), 371-380.
Keller, M. (2000). “Removing Nitrate by Ion Exchange.” Water Technology, 23 (11).Kemper, J.M., Westerhoff, P., Dotson, A. and Mitch, W.A. (2009). “Nitrosamine, dimethylnitramine, and
chloropicrin formation during strong base anion-exchange treatment.” Environ. Sci. Technol., 32 (2), 466-472. Khan, I.A. and Spalding, R.F. (2004). “Enhanced in situ denitrification for a municipal well.” Water Research, 38,
3382-3388.Killingstad, M.W., Widdowson, M.A., and Smith, R.L. (2002). “Modeling Enhanced In Situ Denitrification in
Groundwater.” Journal of Environmental Engineering, 128 (6), 491-504.Kim, J. and Benjamin, M.M. (2004). “Modeling a novel ion exchange process for arsenic and nitrate removal.”
Water Research, 38, 2053-2062.Kneifel, K., Luhrs, G., and Wagner, H. (1988). “Nitrate Removal by Electrodialysis for Brewing Water.”
Desalination, 68, 203-209.Koch Membrane Systems, Inc. (2008). “Reverse Osmosis – Filtration Overview, A KMS Leadership Category.”
Accessed October 28, 2010 via < http://www.kochmembrane.com/sep_ro.html>.Koparal, A.S. and Ogutveren, U.B. (2002). “Removal of Nitrate From Aqueous Solutions By Electrodialysis.”
Intern. J. Environ. Studies, 59 (3), 323-329.Kurt M., Dunn, I.J., and Bourne, J.R. (1987). “Biological Denitrification of Drinking Water Using Autotrophic
Organisms with H2 in a Fluidized-Bed Biofilm Reactor.” Biotechnology and Bioengineering, 29, 493-501.Lavis, T. (2010). “Cleanit®-LC – Water Treatment Media.” Höganäs.Lawrence Livermore National Laboratory, LLNL Nitrate Working Group (2002). “Nitrate Contamination in
California Groundwater: An Integrated Approach to Basin Assessment and Resource Protection: Draft.” Lemaignen, L., Tong, C., Begon, V., Burch, R., and Chadwick, D. (2002). “Catalytic denitrification of water with
palladium-based catalysts supported on activated carbons.” Catalysis Today, 75, 43-48. Lenntech Water Treatment and Purification Holding B.V. (2009). “History of Water Treatment.” Accessed June
28, 2010 via < http://www.lenntech.com/history-water-treatment.htm>Lenntech Water Treatment and Purification Holding B.V. (2009b). “Ion Exchange calculator.” Accessed July 17,
2010 via <http://www.lenntech.com/calculators/exchange/ion-exchange.htm>.Lenntech Water Treatment and Purification Holding B.V. (2009c). “Scaling and Anti-scalants.” Accessed July 17,
2010 via <http://www.lenntech.com/antiscalants.htm>.Lenntech Water Treatment and Purification Holding B.V. (2009d). “Reverse Osmosis.” Accessed July 17, 2010 via
<http://www.lenntech.com/library/reverse-osmosis/whatisro.htm>Lenntech Water Treatment and Purification Holding B.V. (2009e). “SDI – Silt Density Index.” Accessed July 17,
2010 via <http://www.lenntech.com/sdi.htm>Lenntech Water Treatment and Purification Holding B.V. (2009f). “Reverse Osmosis Post-treatment:
Neutralization/Remineralization.” Accessed August 21, 2010 via <http://www.lenntech.com/ro/bwro-remineralization.htm>
Lewandowski, A.M. (2008). “Costs of groundwater nitrate contamination.” Tech Transfer Briefing. Journal of Soil and Water Conservation , 63 (3):92A.
L iou, Y.H., Lo, S.L., Lin, C.J., Hu, C.Y., Kuan, W.H. and Weng, S.C. (2005). “Methods for accelerating nitrate reduction using zerovalent iron at near-neutral pH: Effects of H2-reducing pretreatment and copper deposition.” Environ. Sci. Technol., 39, 9643-9648.
Liu, X. and Clifford, D.A. (1996). “Ion Exchange with Denitrified Brine Reuse.” Journal AWWA, 88 (11), November 1996, 88-99.
Lozier, J.C., Erdal, U.G., Lynch, A.F., and Schindler, S. (N.D.). “Evaluating Traditional and Innovative Concentrate Treatment and Disposal Methods for Water Recycling at Big Bear Valley, California.” CH2M HILL and Big Bear Area Regional Wastewater Agency (BBARWA). Accessed October 2, 2010 via <http://www.vsep.com/pdf/articles/Big-Bear-RO-Reject-Report.pdf>.

FINAL REPORT June, 2011References Page 128
Copyright © 2011 American Water Works Association. All Rights Reserved.
Mahler, R.L., Colter, A., and Hirnyck, R. (2007). “Quality Water for Idaho – Nitrate and Groundwater.” University of Idaho, College of Agricultural and Life Sciences.
Mansell, B.O. and Schroeder, E.D. (2002). “Hydrogenotrophic denitrification in a microporous membrane bioreactor.” Water Research, 36 (19), 4683-4690.
Mateju, V., Cizinska, S., Krejci, J. and Janoch, T. (1992). “Biological water denitrification – A review.” Enzyme Microb. Technol., 14, 170-183.
Matos, C., Velizarov, S., Crespo, J. and Reis, M. (2006). “Simultaneous removal of perchlorate and nitrate from drinking water using the ion exchange membrane bioreactor concept.” Water Research, 40, 231-240.
McAdam, E.J. and Judd, S.J. (2006). “A review of membrane bioreactor potential for nitrate removal from drinking water.” Desalination, 196, 135-148.
McAdam, E.J. and Judd, S.J. (2008). “Immersed membrane bioreactors for nitrate removal from drinking water: Cost and feasibility.” Desalination, 231, 52-60.
Meyer, Kerry (N.D.). “Full-scale Biological Denitrification Installations.” City of Glendale.Meyer, K.J., Swaim, P.D., Bellamy, W.D., Rittmann, B.E., Tang, Y., and Scott, R., CH2M Hill (2010). “Biological
and Ion Exchange Nitrate Removal: Performance and Sustainability Evaluation.” Water Research Foundation.MicroNose™ Technology, Inc. (2010). Accessed July 20, 2010 via <http://www.micronose.com/mnose-
b1.30.html>Midaoui, A.E., Elhannouni, F., Taky, M., Chay, L., Sahli, M.A.M., Echihabi, L., and Hafsi, M. (2002).
“Optimization of nitrate removal operation from groundwater by electrodialysis.” Separation and Purification Technology, 29, 235-244.
Minnesota Department of Agriculture (N.D.). “Drinking Water Protection Series: Nitrate Contamination – What is the Cost?” Accessed June 11, 2010 via <http://www.mda.state.mn.us/protecting/waterprotection/~/media/Files/protecting/waterprotection/dwps2.ashx>
Moore, A.M. and Young, T.M. (2005). “Chloride interactions with iron surfaces: Implications for perchlorate and nitrate remediation using permeable reactive barriers.” Journal of Environmental Engineering, 131 (6), 924-933.
Nataraj, S.K., Hosamani, K.M. and Aminabhavi, T.M. (2006). “Electrodialytic Removal of Nitrates and Hardness from Simulated Mixtures Using Ion-Exchange Membranes.” Journal of Applied Polymer Science, 99, 1788-1794.
National Academy of Engineering (2008). Frontiers of Engineering: Reports on Leading–Edge Engineering from the 2007 Symposium. National Academies Press, Washington DC.
Nerenberg, R. and Rittmann, B.E. (2004). “Hydrogen-based, hollow-fiber membrane biofilm reactor for reduction of perchlorate and other oxidized contaminants.” Water Science and Technology, 49 (11-12), 223-230.
Newkirk, D. (2010). “Guidance Manual for Evaluation of SRF Capital and O&M Costs – Small Water Systems.” Prepared for the California Department of Public Health.
NHDES – New Hampshire Department of Environmental Services (2006). “Environmental Fact Sheet: Nitrate/Nitrite in Drinking Water.” Accessed June 11, 2010 via <http://des.nh.gov/organization/commissioner/pip/factsheets/dwgb/documents/dwgb-3-9.pdf >.
Nitron, Ltd. (2009). “Nitron – SED Nitrate Removal Technology.” Accessed August 8, 2010 via <http://www.nitron.co.il/Technology.php#ben>
Nitron, Ltd. (2010). Presentation: “Nitrate removal plants for ground and surface water. A cost-effective and environmentally-friendly solution: Nitrate Removal with SED.”
Nitron, Ltd. (2009b). “The Use of Selective Electro-Dialysis for Nitrate Removal from Ground and Surface Water.” White Paper, September 2009.
Nolan, B.T., Hitt, K.J., and Ruddy, B.C. (2002). “Probability of Nitrate Contamination of Recently Recharged Ground Waters in the Conterminous United States,” Environmental Science and Technology, 36 (10), 2138-2145.
North American Höganäs, brochure (N.D.). “Cleanit®-LC – 100% Green Solution for Nitrate Removal.” Cleanit®-LC Brochure. North American Höganäs, Environment/Water Division, Tom Lavis.
North American Höganäs, data (N.D.). “Cleanit®-LC for Nitrate Removal from Groundwater.” Cleanit®-LC Data. North American Höganäs.
NSF/ANSI (2009). “Standard 58: Reverse osmosis drinking water treatment systems.” NSF International and American National Standards Institute.
Orica Watercare (N.D.). “Application Bulletin: Nitrate Removal with MIEX® Treatment.”

FINAL REPORT June, 2011References Page 129
Copyright © 2011 American Water Works Association. All Rights Reserved.
Orica Watercare (N.D.b). “Technical Note: Counter Current MIEX® Treatment System for High Capacity Ion Exchange Applications.”
Pacific Institute (2011). “The Human costs of Nitrate-contaminated Drinking Water in the San Joaquin Valley.”Oakland, CA.
Palomares, A.E., Prato, J.G., Marquez, F., and Corma, A. (2003). “Denitrification of natural water on supported Pd/Cu catalysts.” Applied Catalysis B: Environmental, 41, 3-13.
Panglisch, S., Dördelmann, O., Buchta, P., Klegraf, F., Moshiri, A., Emami, A., Fakhraei, M.R. and Höll, W. (2005). “Nitrate Elimination from Raw waters – an Iranian-German Joint Co-operation Project.” In: Proceedings BMBF & UNESCO-RCUWM Workshop in Berlin. “Innovations in Water and Wastewater Technology.”
Pintar, A., Batista, J., and Levec, J. (2001). “Integrated ion exchange/catalytic process for efficient removal of nitrates from drinking water.” Chemical Engineering Science, 56, 1551-1559.
Pintar, A., Batista, J. and Levec, J. (2001). “Catalytic denitrification: direct and indirect removal of nitrates from potable water.” Catalysis Today, 66, 503-510.
Pintar, A. (2003). “Catalytic processes for the purification of drinking water and industrial effluents.” Catalysis Today, 77, 451-465.
Pirkanniemi, K. and Sillanpaa, M. (2002). “Heterogeneous water phase catalysis as an environmental application: a review.” Chemosphere, 48, 1047-1060.
Prato, T. and Parent, R.G. (1993). “Nitrate and Nitrite Removal from Drinking Water Supplies with Electrodialysis Reversal.” GE Power & Water, Water & Process Technologies. Accessed July 5, 2010 via < http://www.gewater.com/pdf/Technical%20Papers_Cust/Americas/English/TP1072EN.pdf>.
Prima Environmental. “Innovative and Emerging Remediation Technologies.” Accessed July 25, 2010 via <http://www.primaenvironmental.com/emerging.html>
Rash, V.D. (1992). “Nitrate Removal at Des Moines Water Works.” AWWA Annual Conference Proceedings, June 18-22, 1992, Vancouver, B.C., 155-178.
Reahl, E.R. (2006). “Half a Century of Desalination with Electrodialysis.” GE – General Electric Company, Water & Process Technologies. Accessed June 11, 2010 via <http://www.gewater.com/pdf/Technical%20Papers_Cust/Americas/English/TP1038EN.pdf>.
Reddy, K. and Lin, J. (2000). “Nitrate removal from groundwater using catalytic reduction.” Water Research, 34(3), 995-1001.
Remco Engineering. “Water Systems and Controls.” Accessed July 9, 2010 via < http://www.remco.com/ro_quest.htm>.
Rohm and Haas Company (2007). “Municipal Potable Water Systems: Low waste Nitrate removal for Potable Water Systems.”
Rudolph, D. (2010). Presentation “Quantifying performance of regional scale reductions in nutrient applications for source water protection through vadose zone monitoring.” Toward Sustainable Groundwater in Agriculture Conference. June 15-17, 2010, Burlingame, CA. University of Waterloo, Department of Earth and Environmental Sciences.
Sahli, M.A.M., Annouar, S., Mountadar, M/, Soufiane, A., and Elmidaoui, A. (2008). “Nitrate removal of brackish underground water by chemical adsorption and by electrodialysis.” Desalination, 227, 327-333.
Samatya, S., Kabay, N., Yüksel, Ü., Arda, M., and Yüksel, M. (2006). “Removal of nitrate from aqueous solution by nitrate selective ion exchange resins.” Reactive & Functional Polymers, 66, 1206-1214.
Sargent-Michaud, J., K. Boyle, K., and A. Smith (2006). “Cost Effective Arsenic Reductions in Private Well Water in Maine.” Jour. AWRA, 1237-1245.
Schnobrich, M.R., Chaplin, B.P., Semmens, M.J. and Novak, P.J. (2007). “Stimulating hydrogenotrophic denitrification in simulated groundwater containing high dissolved oxygen and nitrate concentrations.” Water Research, 41, 1869-1876.
Scott, J. (May 14, 2010). “Remedies for nitrate contamination anything but quick, cheap.” California Watch. Access June 12, 2010 via http://californiawatch.org/remedies-nitrate-contamination-anything-quick-cheap.
Seidel, C., Summers, R.S., Landi, N., Zachman, B. and Frey, M. (2004). “The MIEX® Process: A Technology for Removing Inorganic Contaminants.” In Proceedings of the American Water Works Association Annual Conference, Orlando, FL. Denver, CO: American Water Works Association.
Severn Trent Services. Personal Communication with Dennis Bitter on Brine Destruction, September 29, 2010.Shrimali, M. and Singh, K.P. (2001). “New methods of nitrate removal from water.” Environmental Pollution, 112,
351-359.

FINAL REPORT June, 2011References Page 130
Copyright © 2011 American Water Works Association. All Rights Reserved.
Silverstein, J. (2010). Presentation: “Anaerobic biological treatment for removal of inorganic contaminants from drinking water.” Workshop on Biological Drinking Water Treatment, IWA Leading Edge Technology Conference, June 1, 2010. Civil, Environmental, and Architectural Engineering, University of Colorado, Boulder.
SMI-PS, Inc. (2009). “Sulfur Modified Iron (SMI III®) New Technology – Nitrate Destruction/Arsenic Removal.” Accessed June 28, 2010 via <http://www.stancounty.com/publicworks/pdf/water-summit/sulfur-modified-iron-12-16-2008.pdf>
Soares, M.I.M. (2002). “Denitrification of groundwater with elemental sulfur.” Water Research, 36, 1392-1395.Soares, M.I.M. (2000). “Biological Denitrification of Groundwater.” Water, Air, and Soil Pollution, 123, 183-193.State Water Resources Control Board, Division of Water Quality, GAMA Program (2010). “Groundwater
Information Sheet: Nitrate/Nitrite.” Accessed June 30, 2010 via <http://www.swrcb.ca.gov/gama/docs/coc_nitrate.pdf>.
Sun, D., Yang, J., Li, J., Yu, J., Xu, X., and Yang, X. (2010). “Novel Pd-Cu/bacterial cellulose nanofibers: Preparation and excellent performance in catalytic denitrification.” Applied Surface Science, 256, 2241-2244.
Tarabara, V. (2007). “Coupled Effects of Scaling and Colloidal Deposition on the performance of Reverse Osmosis Membrane Filters.” National Water Research Institute.
Thomson, J., Slunjski, M., Fabig, M., and Crisp, G. (2009). “Potable Water HERO Process at Yalgoo.” Water Practice and Technology, 4 (2).
Upadhyaya, G., Jackson, J., Clancy, T.M., Hyun, S.P., Brown, J., Hayes, K.F., and Raskin, L. (2010). “Simultaneous removal of nitrate and arsenic from drinking water sources utilizing a fixed-bed bioreactor system.” Water Research, 44 (17), 4958-4969.
USEPA - United States Environmental Protection Agency (N.D.). “National Primary Drinking Water Regulations: Consumer Factsheet on: NITRATES/NITRITES.” Accessed June 30, 2010 via <http://www.epa.gov/safewater/pdfs/factsheets/ioc/nitrates.pdf>.
USEPA – United States Environmental Protection Agency (1998). “Small System Compliance Technology List for the Non-Microbial Contaminants Regulated Before 1996.” Office of Water, September 1998; EPA 815-R-98-002. Accessed December 10, 2010 via <http://www.epa.gov/safewater/standard/tlstnm.pdf >.
USEPA – United States Environmental Protection Agency (1994). “Drinking Water Treatment for Small Communities: A Focus on EPA’s Research.” Accessed October 11, 2010 via <http://www.p2pays.org/ref/02/01998.pdf>.
USEPA – United States Environmental Protection Agency (2010). “Basic Information about Nitrate in Drinking Water.” Accessed December 14, 2010 via <http://water.epa.gov/drink/contaminants/basicinformation/nitrate.cfm>
University of Hawaii (2006). “UH researcher introduces breakthrough technology for arsenic-free drinking water.” The University of Hawaii System. Accessed July 25, 2010 via < http://www.hawaii.edu/news/article.php?aId=1358.>
Van der Hoek, J.P. and Klapwijk, A. (1987). “Nitrate removal from ground water.” Water Research, 21, (8), 989-997.
Van Ginkel, S.W., Ahn, C.H., Badruzzaman, M., Roberts, D.J., Lehman, S.G., Adham, S.S.,and Rittmann, B.E. (2008). “Kinetics of nitrate and perchlorate reduction in ion-exchange brine using the membrane biofilm reactor (MBfR).” Water Research, 42(15), 4197-4205.
Velizarov, S., Crespo, J. and Reis, M. (2002). “Ion Exchange Membrane Bioreactor for Selective Removal of Nitrate from Drinking Water: Control of Ion Fluxes and Process Performance.” Biotechnol. Prog., 18(2), 296-302.
Volokita, M., Balkin, S., Abeliovich, A. and Soares, M.I.M. (1996). “Biological Denitrification of Drinking Water Using Newspaper.” Water Research, 30 (4), 965-971.
Walker, L.G., (N.D.). Presentation: “Nitrate Effects on Public Water System Wells.” California Department of Public Health, Drinking Water Technical Programs Branch. Accessed August 12, 2010 via http://www.swrcb.ca.gov/rwqcb5/water_issues/irrigated_lands/long_term_program_development/15mar09_advisory_wrkgp_infosession/nitrate_effects_pws_wells.pdf.
Wang, F. and Tarabara, V.V. (2007). “Coupled effects of colloidal deposition and salt concentration polarization on reverse osmosis membrane performance.” Journal of Membrane Science, 293, 111-123.
Washington State Department of Health (WA DOH) (2005). “Guidance Document: Nitrate Treatment Alternatives for Small Water Systems.” DOH PUB. #331-309.

FINAL REPORT June, 2011References Page 131
Copyright © 2011 American Water Works Association. All Rights Reserved.
Waskom, R., Carlson, K., and Brauer, R. (N.D.). Presentation: “Innovative Systems for Treating Impaired Waters: Natural and Enhanced Purification Processes to Remove Organics and Nutrients.” Colorado State University.
Water Corporation (September, 2007). Quarterly e-newsletter: “Mainstream.” Accessed June 11, 2010 via <http://www.watercorporation.com.au/_files/PublicationsRegister/6/Mainstream_September07.pdf>.
Water Corporation (2009). “Desalination in Western Australia.” Accessed June 11, 2010 via <www.watercorporation.com.au>.
Water Quality Association (2011). “Gold Seal Certified Product Listings.” Accessed April 25, 2011 via <http://www.wqa.org/sitelogic.cfm?id=1165§ion=3>.Water Quality Products (2003). “Nitrate Removal by Ion Exchange.” Water Quality Products, 8 (4).Webster, T.S., Guarini. W.J. and Wong, H.S. (May, 2009). “Fluidized bed bioreactor treatment of perchlorate-laden
groundwater to potable standards.” Journal of the American Water Works Association, 101 (5).Webster, T.S. and Togna, P. (January, 2009). “Final Report: Demonstration of a Full-Scale Fluidized Bed
Bioreactor for the Treatment of Perchlorate at Low Concentrations in Groundwater.” ESTCP Project ER-0543.Weir, L. and Roberson, J.A. (2010). “Nitrate Occurrence Survey.” Accessed online August 20, 2010via
<http://www.surveymonkey.com>. Weir, L. and Roberson, J.A. (2011). “National Compliance Costs from a Potential Revision to the Nitrate
Regualtion.” Journal AWWA, 103 (3), March 2011 (44-54). Werner, T.E. and von Gottberg, A.J.M. (2005). “Five Billion Gallons Later – Operating Experience at City of
Suffolk EDR.” GE – General Electric Company, Water & Process Technologies. Accessed July 5, 2010 via < http://www.gewater.com/pdf/Technical%20Papers_Cust/Americas/English/TP1031EN.pdf>.
Werth, C. (2010). Personal communication.WHO - World Health Organization (2004). “Nutrient minerals in drinking-water and the potential health
consequences of consumption of demineralized and remineralized and altered mineral content drinking-water: Consensus of the meeting.” Access August 21, 2010 via <http://www.who.int/water_sanitation_health/dwq/nutconsensus/en/>
Wisniewski, C., Persin, F., Cherif, T., Sandeaux, R., Grasmick, A. and Gavach, C. (2001). “Denitrification of drinking water by the association of an electrodialysis process and a membrane bioreactor: feasibility and application.” Desalination, 139, 199-205.
Xiong, Z, Zhao, Z. and Pan, G. (2009). “Rapid and controlled transformation of nitrate in water and brine by stabilized iron nanoparticles.” Journal of Nanoparticle Research, 11, 807-819.
Yoon, T, Shon, Z.H., Lee, G., Moon, B., Noh, B. and Sung, N. (2001). “Parametric studies on the performance of anion exchange for nitrate removal.” Korean J. Chem. Eng., 18 (2), 170-177.
Yu, J. and Kupferle, M.J. (2008). “Two-stage Sequential Electrochemical Treatment of Nitrate Brine Wastes.” Water Air Soil Pollut: Focus, 8, 379-385.


FINAL REPORT June, 2011Appendix Page 133
Copyright © 2011 American Water Works Association. All Rights Reserved.
5.0 Appendix
5.1 Tables of Selected Research
Table A.1: Selected Research on the use of Ion Exchange (IX) for nitrate removal.IX nitrate selective resin Dosing and sorption kinetics of Purolite A 520E (SBA resin). Influent nitrate concentration of 21.54 mg/L as N
(100 mg NO3-/L). With no sulfate and chloride the treated bed volumes before breakthrough (BV) and resin
capacity were 451 BV and 126.4 mg NO3-/g resin, respectively. With sulfate and chloride concentrations 10x
that of nitrate, BV and resin capacity were 120 BV and 33.6 mg NO3-/g resin, respectively.
Samatya et al. (2006)
IX adsorption kinetics Amberlite IRA 400 resin was found to be a suitable choice for nitrate removal with influent nitrate concentration of 0.22-3.88 mg/L as N (1-18 mg NO3
-/L) and a 96% removal efficiency.Chabani et al. (2006)
IX sulfate competition Competition between sulfate and nitrate ions was explored. For the sulfate specific resin examined, findings indicate that sulfate selectivity increased with ionic strength.
Kim & Benjamin (2004)
IX co-contaminants Compared two different anion exchange resins and studied the influence of other ions on nitrate removal. Yoon et al. (2001)IX resin residuals and DBPs
Quaternary amine groups and nitrosamines carcinogenic DBPs, 3 resins examined. With no disinfectants (chlorine and chloramine) “release 2-10 ng/L”, max of 20 ng/L nitrosamine. “The lack of significant nitrosamine release in full-scale anion-exchange treatment system after multiple regeneration cycles indicates that releases may eventually subside.” Precursors can be a problem with downstream chloramine use. Upstream disinfection releases of 20-100 ng/L (type 1) and 400 ng/L (type 2). Possible problem with IX in POU with influent containing chlorine/chloramines.
Kemper et al. (2009)
IX Pilot study 3-year pilot examined RO, IX and biological denitrification in Mashhad, Iran. Treatment goal was a decrease in nitrate concentration from 24.77 mg/L as N (115 mg/L as nitrate) to 8.62 mg/L as N (40 mg/L as nitrate). Raw water with electrical conductivity of 1550 uS/cm, pH of 7.2. Optimal treatment options were deemed to be biological denitrification and RO. In the IX pilot plant pre-treatment consisted of cartridge filtration. Two IX columns containing ~200 L of nitrate selective resins were run in parallel with counter-current regeneration. System characteristics:Column diameter: 0.4 m, Bed Volume (BV): 200 L, Bed Depth: 1.6 m, Flow Rate: 1.0 to 3.0 m3/h, Specific Flow Rate: 5 to 15 BV/h, Resin replacement every 5 years.
Dördelmann et al. (2006, and N.D.) Dördelmann (2009)Panglisch et al. (2005)
See Also Clifford (2007), Clifford (1987), Guter (1982), Clifford & Weber (1978), Johnston & Heijnen (N.D.), and Rash (1992).

FINAL REPORT June, 2011Appendix Page 134
Copyright © 2011 American Water Works Association. All Rights Reserved.
Table A.2: Selected research on the use of Reverse Osmosis (RO) for nitrate removal.RO – Pilot Study and Full scale Installation
Brighton, CO: Use of RO in Brighton, CO, for potable water treatment including nitrate removal began operating in 1993 (11000 sq ft., 4 MGD, total cost of $8,253,000) after the performance of preliminary pilot study (4 membranes were tested). Source water nitrate concentration of 13 to 23 mg/L nitrate-N (TDS 800-1140 mg/L, hardness 370-480 mg/L as CaCO3). Problems with biofouling of membrane and cartridge filters (slime forming Pseudomonas) minimized with anti-scalant use. Pretreatment: acid, anti-scalant and filtration. Post-treatment: CO2 stripping (degasifier), disinfecton, caustic and zinc orthophosphate (ZOP) addition. Blending ratio (untreated%:treated%) 20:80(winter) and 60:40 (summer). Waste discharge to surface water. Additional characteristics: Flux rate < 14.2 gal/sq. ft./day (helps control fouling), 2 stages: 32 :16 vessels, pressure of 231 psi, each vessel with 6 8” diameter membranes. Cleaning required every 2 months.
Cevaal et al. (1995)
RO – HERO in Australia
Yalgoo, Australia: RO plant, online in 2007 using high-efficiency reverse osmosis (HERO). Water recovery rates as high as 95%. More than 85% waste reduction (a low as 10% the waste of conventional RO.) Removes both nitrate and silica from brackish water.
Water Corporation
(2009)RO – Full scale uses methane
Inland Empire, CA: Cow Power in Inland Empire, CA: $80 mil. effort is powered by methane gas produced from the high population of cows in that region. Online since 2002, this plant provides 1/5th of regional demand.
Black (2003)
RO – Pilot study comparing IX, RO and BD
Mashhad, Iran: 3-year pilot examined RO, IX and BD in Mashhad, Iran. Treatment goal of 8.62 mg/L as N (40 mg/L as nitrate) (influent nitrate of 24.77 mg/L as N, 115 mg/L as nitrate). Results indicate BR and RO were best choices. Automated RO pilot plant with a “capacity [of] 3 m3/h (RO permeate).” Pre-treatment: acid, anti-scalant, automated filtration (50 um), and cartridge filtration (1um). 2 stages: in the first stage, 2 parallel membranes, second stage, concentrate from stage one to second membrane before mixing with stage 1 permeate. Post-treatment: Blending, CO2 removal. New membranes every 5 years. RO was least expensive despite having highest energy demands (0.6 kWh/m3 of DW), due to low cost of electricity. Lower operator demand than BD. RO produced better quality water (lower TDS, Ca, Mg, Na, K, Cl, nitrate, sulfate and bicarbonate), but the greatest percentage of waste.
Dördelmann et al. (2006, and N.D.) Dördelmann (2009)Panglisch et al. (2005)
RO – Full scale installations
Milan, Italy: Influent of 10.77 – 12.92 mg/L as N (50 – 60 mg/L as nitrate), target of 8.62 mg/L as N (40 mg/L as nitrate) with waste concentrate < 28.43 mg/L as N (132 mg/L as nitrate) (for sewer disposal). Series of 13 1-stage RO plants (7 to 58 m3/hr permeate), with blending 77-88% water recovery (note the disposal limitation). Pretreatment: anti-scalant (2.0-3.5 mg/L). Cleaning only every year and a half (SDI<1) and requires only 3 techs.
Elyanow & Persechino,
(2005)
RO – Alternative disposal options
Alternatives to conventional disposal measures of RO waste brine, including reuse for industrial processes, processing (e.g., for salt production), or use in energy generation (“solar brine pond”).
Howe (2004)
RO – Membrane scaling and fouling, colloidal interaction
Analysis of complex source water, membrane fouling and ways of anticipating changes in flux and rejection rates. Relationship between constituents and how RO treatment is affected by colloids, silica, concentration polarization (higher salt concentration near membrane surface), back diffusion, and scaling. Typical colloidal constituents: “sulfur, silica, and ferric and aluminum hydroxides.” Results indicate colloidal fouling may amplify other scaling/fouling factors. “By recognizing possible interferences between rejected salts and colloids deposited on the membrane surface, the work explored the phenomenon of coupling between colloidal fouling, concentration polarization, and scaling as main factors limiting the application of RO membranes” (Tarabara, 2007).
Tarabara (2007)
Wang & Tarabara (2007)
RO – Influence of upstream processes
Investigation of the interaction of upstream residuals on RO treatment (membrane and additive chemicals). Influence of coagulant residuals on colloidal fouling, and disinfectants on membrane oxidation.
Gabelich et al. (2004)

FINAL REPORT June, 2011Appendix Page 135
Copyright © 2011 American Water Works Association. All Rights Reserved.
Table A.3: Selected research on the use of Electrodialysis/Electrodialysis Reversal for nitrate removal.ED – Pilot study and Full scale installation
Austria: 2-year pilot starting in 1990 with 1 m3/h capacity. Influent nitrate concentration 17.23 – 21.54 mg/L as N (80-100 mg/L as nitrate), design for 34.46 mg/L as N (160 mg/L as nitrate). Planning began in 1996 for full scale installation with seasonal operation commencing in 1997. Disposal options: sewer or irrigation reuse. “Monovalent selective anion exchange membranes.” 3 stacks in parallel – 3 stages offer capacity from 48 to 144 m3/h. Complete automation. Effluent nitrate of 8.62 mg/L as N (40 mg/L as nitrate) (capable of product water nitrate of 5.38 mg/L as N, 25 mg/L as nitrate) and 23% hardness reduction. Nitrate selectivity: 66% nitrate removal with 25% desalination.
Hell et al. (1998)
ED – Pilot study –Optimization
Morocco: Pilot study using a nitrate selective membrane for nitrate removal from an influent level of 19.38 mg/L as N (90 mg/L as nitrate) to acceptable levels, in water with a TDS concentration of 800 mg/L. Analysis of operating parameters to minimize precipitation, scaling and associated chemical use. Variation of voltage, flow rate and temperature. Ion removal increased with increasing temperature.
Midaoui et al. (2002)
EDR – Full scale installation
Delaware: EDR has been successfully employed for the removal of nitrate from potable water in Delaware. The nitrate concentration in treated potable water was 0.97 mg/L as N (4.5 mg/L as nitrate), just 7.5% of the 12.92 mg/L as N (60 mg/L as nitrate) influent nitrate concentration. 3 stage system, 88% demineralization (TDS reduction), 90% water recovery, and pH decrease from 6.2 to 5.4.
Prato & Parent (1993)
EDR – Full scale installation
Barcelona, Spain: GE EDR plant with 50 MGD capacity (260,000 households), not specifically for nitrate. Limited to no anti-scalant use. “Compared to a typical RO treatment facility producing 3.8 million gallons of water per day, GE’s EDR technology, operating at 83% efficiency, is designed to eliminate the need for over 28,000 pounds of anti-scalant, reducing operating costs by > $100,000 per year at typical 2008 chemical prices.” *Previous EDR systems for nitrate removal were installed in Arizona, Delaware, Japan, Italy, Bermuda, and Israel.
GE (2010), GE (N.D.)
EDR – Full scale installations
Europe: As of ~2005, Ameridia/Eurodia full scale EDR plants in Italy, France, Switzerland, Netherlands, and Austria. Capacity ranging from 0.032 – 0.925 MGD and water recovery from 93-98%. Information on full scale installations, pilot studies and costs.
Ameridia/Eurodia
ED – Multiple contaminant removal, role of organic matter
Research investigation using synthetic waters to determine the impact of organic matter in the removal of nitrate, fluoride and boron. Fouling led to decreased flux, although nitrate removal was the least affected, due to smaller “hydrated ionic radius.” Removal of boron and fluoride was enhanced by the presence of organic matter, while nitrate removal was not enhanced and simply decreased over time with the decrease in membrane flux.
Banasiak & Schäfer (2009)
ED – Pilot study Research investigation using synthetic waters to assess nitrate removal under different operating conditions. The impact of different voltage (from 40 to 50 V) was examined across several ionic species, including nitrate. Alternating anion and cation exchange membranes were used. Results indicate 94% nitrate removal, with a reduction in the removal rate at 50 V due to back diffusion and fouling.
Nataraj et al. (2006)
ED – Pilot study comparison with adsorption
Morocco: Nitrate removal from brackish water. Comparison of ED using a monovalent membrane and adsorption on chitosan. ED successfully removed nitrate. Adsorption can remove nitrate, but not likely feasible. Adsorption can be used to remove nitrate from ED waste concentrate. Highlights concerns regarding waste concentrate disposal from ED.
Sahli et al. (2008)
Mashhad, Iran: Comparison of IX, RO, BD, and ED. ED pilot study was started in 2007. Dördelmann (2009)

FINAL REPORT June, 2011Appendix Page 136
Copyright © 2011 American Water Works Association. All Rights Reserved.
Table A.4: Selected research on the use of Biological Denitrification for nitrate removal from potable water.Pilot Testing - Multiple Biological ConfigurationsThe City of Glendale, AZ has investigated three configurations of biological treatment to address high nitrate levels in groundwater wells (Meyer et al., 2010).An autotrophic MBfR using was compared with two heterotrophic fixed bed bioreactors each with different media (plastic versus granular activated carbon). Hydrogen gas and ethanol were used as electron donor for the autotrophic system and the heterotrophic systems, respectively. Post-treatment included filtration using biologically activated carbon and ozonation. The fixed bed bioreactor with plastic media and the MBfR performed well, with product water meeting or exceeding potable water standards. Multi-criteria analysis found the MBfR to be most favorable regarding benefits, but the least favorable regarding costs. Including comparison with IX, the fixed bed bioreactor with plastic media had the lowest life cycle cost. The MBfR costs were greatest.An investigation of biological treatment options in the City of Thornton, CO, funded by the WaterRF, examined two packed bed bioreactors and a moving bed biofilm reactor (MBBR™) (City of Thornton, 2010, Project # 4202) to address nitrate impacted source water. Nitrate levels were successfully decreased by each of the three pilot systems from an influent concentration of 10 mg/L nitrate as N to an effluent concentration of < 2 mg/L nitrate as N. Operation at high and low temperatures was tested with examination of seeding for low temperatures. The study highlights the need for nutrient and substrate dose optimization in biological treatment systems.SubstratesNumerous alternative substrate options have been explored in the literature including newspapers, vegetable oil, cotton, and formate (Volokita et al., 1996;Hunter, 2001;Della Rocca et al., 2006; Killingstad et al., 2002.)Fixed BedSee Riverside, CA Case Study (Carollo Engineers, 2008).A fixed bed heterotrophic denitrification pilot study was implemented in Mashhad, Iran by Dördelmann et al. (2006) using two parallel fixed beds containing expanded clay media. Acetic acid and ferrous sulfate served as the electron donor and nutrient supply, respectively. Post treatment consisted of “aeration, dual media and activated carbon filtration” (Dördelmann et al., 2006). Influent nitrate levels of 24.77 mg/L as N (115 mg/L as nitrate) were decreased to < 8.62 mg/L as N (40 mg/L as nitrate) with a nitrate reduction rate of ~7 kg NO3/m
3 d (0.43 lb NO3/ft3d) (Dördelmann et al., 2006 and Panglisch et al., 2005). Used for
flushing and backwashing, 7% of influent volume was wasted. In practice, a final disinfection step would be required (Dördelmann et al., N.D).An up-flow, fixed-bed, autotrophic, lab-scale system, using granular sulfur as both substrate and growth surface was explored by Soares (2002). Operated over a 5 month period, a maximum denitrification rate of 0.2 kg N/m3d (0.012 lb N/ft3d) was achieved with a one hour hydraulic retention time and a loading rate of 0.24 kg N/m3d (0.015 lb N/ft3d). Sulfur based autotrophic systems would not be appropriate for the treatment of feed waters high in sulfate.Aslan (2005) examined a lab-scale packed sand bed system, with ethanol as substrate for the simultaneous removal of nitrate and several pesticides. After 3 days for biofilm development, 93-98% nitrate removal was achieved requiring at least a 2 hour residence time. Pesticide removal required longer residence times (up to 12 hours) for efficient removal.Upadhyaya et al. (2010) investigated the use of a fixed-bed biological reactor with granular activated carbon media for the removal of nitrate and arsenic at the same time. The media was biologically activated from use in a separate bioreactor for the removal of nitrate and perchlorate. Reactors were thus biologically active carbon (BAC) reactors. With acetic acid as the substrate, two in series BAC reactors were used to treat synthetic groundwater. Arsenic levels were reduced from 200 μg/L arsenic in the influent to 20 μg/L in the effluent (still above the arsenic MCL of 10 μg/L) while nitrate levels were decreased from 10.77 mg/L as N (50 mg/L as nitrate) in the influent to less than 0.043 mg/L as N (0.2 mg/L as nitrate) in the effluent. Used as an electron acceptor by microbes in the oxidation of substrate, nitrate was reduced to nitrogen gas. Arsenic was removed from solution with the formation of arsenic sulfide (solids) and also with adsorption and “surface precipitation on iron sulfides (p. 4958).” Fluidized Bed

FINAL REPORT June, 2011Appendix Page 137
Copyright © 2011 American Water Works Association. All Rights Reserved.
See Rialto, CA Case Study (Webster & Togna, 2009).Kurt et al. (1987) investigated an autotrophic fluidized sand bed reactor using hydrogen gas as substrate. With an influent nitrate concentration of 25 mg/L nitrate-nitrogen, a maximum nitrate reduction rate of 5 mg/L per hour was attained using a mixed culture. The authors propose multiple stage reactors to address the problem of partial denitrification.Using a mix of propionic acid and ethanol in a heterotrophic fluidized sand bed reactor, Holló & Czakó (1987) examined denitrification at the lab and pilot scale. Post-treatment consisted of cartridge filtration, gas exchange, sand filtration, carbon filtration and disinfection. “Nitrate removal capacity of the reactor was 50-60 kg NO3
-/m3/day (3.1-3.7 lb NO3-/gal/d), which could be maintained permanently at temperatures as low as 8-10oC as well” (Holló & Czakó, 1987).
MBR - Diffusive Extraction and Microporous Membranes (See also Pilot Testing above)Mansell & Schroeder (2002) assessed hydrogenotrophic denitrification at the lab-scale using a membrane bioreactor (MBR) with a 0.02 micron microporous membrane through which nitrate diffuses to the biological compartment. The membrane prevents mixing of microbes with the water being treated and no carbon substrate was necessary because hydrogen gas was supplied as the electron donor for autotrophic denitrification. Previous issues regarding the transfer of hydrogen gas to the water and safety concerns due to explosive nature of hydrogen gas have been addressed with the development of “membrane dissolution systems” (Mansell & Schroeder, 2002). Hydrogen gas was delivered to the biomass with silicone tubing. Results indicated reduction of nitrate levels from a maximum of 40 mg/L NO3
−-N in the feed water to 3.2 mg/L NO3−-N in the treated water, with 92-96% removal. Measured HPC indicated minimal biomass
transfer to the treated water compartment.Ergas & Rheinheimer (2004) studied denitrification of potable water using a membrane bioreactor (MBR) in which feed water is passed through tubular acrylonitrile membranes, nitrate diffuses through the membrane and denitrification occurs on the exterior membrane surface. The mean transfer to the biofilm was 6.1 g NO3-N/m2 d (0.6 g NO3-N/ft2). The ultimate methanol (substrate) loading rate of 1.1 g/d resulted in a mean concentration of nitrate in the treated potable water of 5.2 mg NO3
--N/L. A mathematical model of nitrate mass transfer was developed. A removal efficiency of 99% was achieved with a starting concentration of 200 mg NO3
--N/L. Use of the MBR allows for denitrification with separation of the water to be treated and biological treatment, thereby avoiding post treatment removal of biomass and dissolved organics. The effluent would require additional treatment, because 8% (30 mg/L) of the methanol crossed the membrane; the authors suggest that further development of the biomass could minimize methanol transfer to the effluent stream.MBR - Gaseous Substrate Delivery – Hollow Fiber MembranesChung et al. (2007) explored the use of autotrophic denitrification for the treatment of highly concentrated waste from nitrate removal via anion exchange. Using a hydrogen-based, hollow fiber membrane biofilm reactor, the impact of brine concentration (up to 15%) on nitrate reduction was found to be significant due to microbial inhibition. In the reduction of nitrate, use of hydrogen gas rather than an organic substrate offers an inexpensive alternative for potable water treatment systems. Biomass production is decreased and there is no need to remove substrate residual, as there would be with the use of carbon substrates. Using nitrate as the primary electron acceptor, hollow fiber MBfRs with hydrogen gas as electron donor can effectively decrease the levels of multiple contaminants including perchlorate, chromate and arsenate (Nerenberg & Rittman, 2004). Low levels of these oxidized species without a primary electron acceptor can limit biological reduction; however, in the presence of nitrate, reduction can occur. When the concentrations of nitrate and the oxidized species of interest were 1.08 mg/L as N (5 mg/L as nitrate) and 1 mg/L, respectively, 99% nitrate removal was achieved while removal of perchlorate, chromate and arsenate reached 36%, >75%, and >50%, respectively.Bioelectrochemical DenitrificationGhafari et al. (2008) provide a review of biological denitrification with a focus on bioelectrical reactors (BERs). In a BER, hydrogenotrophic denitrification occurs as hydrogen gas is produced at the cathode and utilized as the electron donor by denitrifiers, while nitrate is reduced to nitrogen gas. Previous BER research is discussed including autotrophic and heterotrophic examples across a range of nitrate levels and generally in synthetic waters. With additional research, BERs may become a feasible alternative for nitrate removal from drinking water.In situ Denitrification Permeable reactive barriers (PRBs) can be used to directly treat nitrate contaminated groundwater. Hunter (2001) examined the use of vegetable oil as an electron

FINAL REPORT June, 2011Appendix Page 138
Copyright © 2011 American Water Works Association. All Rights Reserved.
donor in biological denitrification. The use of an insoluble substrate minimized biomass blockage, a problem common with the use of soluble substrates like ethanol, methanol and acetate. The barrier was composed of soybean oil-coated sand and effectively decreased the nitrate levels from a starting concentration of 20 mg/L nitrate-N to below the MCL for a period of 15 weeks, with a flow rate 1100 L/week. After 15 weeks, insufficient oil remained for denitrification. High chemical oxygen demand, TSS and turbidity in the effluent of the reactor indicate a longer sand bed was needed; however, the author suggests that in situapplication of this type of biological reactor would decrease these factors naturally. With a withdrawal point far enough from the barrier, subsequent potable water treatment requirements would be limited to disinfection. The most significant problem encountered in this study was the exhaustion of substrate. An effective means of substrate addition must be found (injection for example), but this was not explored. The estimated life of the PRB was 2.5-12.5 years depending on several key factors including flow, nitrate concentration and dissolved oxygen concentration.With hydrogen gas as the substrate in autotrophic denitrification, Haugen et al. (2002) examined hydrogenotrophic denitrification in a lab scale experiment intended to imitate in situ treatment. Denitrification kinetics, the feasibility and longevity of substrate delivery via tubular membranes and post-treatment water quality were investigated. Delivery of hydrogen gas through tubular membranes minimized the risks associated with utilization of this flammable/explosive gas. The reactor was tested over 155 days. An initial influent nitrate concentration of 8.2 mg NO3
- -N/L was doubled to 16.4 mg NO3- -N/L. After adjustment of
parameters, complete nitrate removal was achieved using the tubular membrane bioreactor. A denitrification rate of 169 mg N/h/m2 (membrane surface area) was attained with a hydrogen gas pressure of 1.44 atm (lower pressures resulted in incomplete reduction. The greatest hydrogen gas transfer across the membrane (flux) was 1.79 x 10⁻² mg H2/m
2s. The simulated groundwater velocity was 0.3 m/d resulting in 14 minutes of membrane contact time. Additional considerations for application of this treatment method include: the lower temperature of groundwater, the need for buffer in the current study, the depth limitation, nutrient requirements, and the difference between aquarium rocks and subsurface porous media. Intermediate denitrification products and end products (ammonia and nitrogen gas) were not measured in this study; however, the authors suggest the high nitrate to substrate ratio would result in reduction to nitrogen gas.Schnobrich et al. (2007) simulated in situ nitrate removal via hydrogenotrophic Denitrification. With hydrogen gas delivery through a membrane module consisting of a fiberglass membrane wound in a spiral fashion and attached to polyethylene membranes. The study examined the influence of pH, nutrient requirements and the feasibility of appropriate levels of hydrogen gas delivery. To simulate in situ conditions, the porous media was extracted from an aquifer and the system was operated at 10oC. Two upflow columns were operated in series, only the first of which included a membrane fed with hydrogen gas. Including that required for the reduction of dissolved oxygen, the total concentration of hydrogen gas required for complete denitrification was 11.2 mg H2/L. Overall, this study demonstrated effective substrate delivery and nitrate removal under conditions more similar to what would be expected naturally.

FINAL REPORT June, 2011Appendix Page 139
Copyright © 2011 American Water Works Association. All Rights Reserved.
Table A.5: Selected research on the use of Chemical Denitrification (CD) for nitrate removal.CD using ZVI Reduction of nitrate to ammonia using ZVI powder was highly pH dependent with optimal kinetics below a pH of
4. The minimum ratio of iron to nitrate was 120 m2/mol NO3- for complete reduction within 1 hour. 50 mg NO3
-/L,100% removal.
Huang et al. (1998)
CD - ZVI Found that the end product of denitrification (nitrogen gas versus ammonium) could be controlled by the iron to nitrate ratio and the use of catalysts.
Xiong et al. (2009)
CD - ZVI In the corrosion of ZVI, the formation of “green rusts” and “suspended green particles” is associated with stabilization of pH and steady decrease in nitrate.
Choe et al. (2004)
CD - ZVI Examined the nitrate reduction rates of three types of iron. Findings indicate that rate increases with decreasing pH. Alowitz & Scherer (2002)
CD - ZVI Nitrate reduction by ZVI can be optimized through pretreatment of iron particles. High temperature exposure to hydrogen gas and deposition of copper were explored separately as options for pretreatment of the iron surface.
Liou et al. (2005)
CD - ZVI Examined chloride as a potential competitor. Results indicate a minimal impact on nitrate removal; however, other competing ions could be important regarding both competition for adsorption sites and reduction.
Moore & Young (2005)
CD - SMI “SMI-III® is a patented, iron-based granular media that has been commercially developed for the removal of nitrate, co-contaminants including uranium, vanadium and chromium, and other compounds from water. It is foreseen that the greatest benefit of this technology is that it does not produce a costly brine stream as do the currently accepted nitrate removal technologies of ion exchange and reverse osmosis.”
DSWA and City of Ripon
(2010)
CD – Catalytic Denitrification
Reddy & Lin, 2000; Chen et al., 2003; Constantinou et al., 2007; Gavagnin et al., 2002; Lemaignen et al., 2002; Palomares et al., 2003; Pintar et al., 2001; Pintar, 2003; Pirkanniemi & Sillanpaa, 2002; and Sun et al., 2010.

FINAL REPORT June, 2011Appendix Page 140
Copyright © 2011 American Water Works Association. All Rights Reserved.
Table A.6 Advantages and Disadvantages of the Five Major Treatment Options for Nitrate Removal.Advantages Disadvantages
Ion Exchange Years of industry experience, Multiple contaminant removal, Selective nitrate removal, Financial feasibility, Use in small and large
systems, and The ability to automate.
The disposal of waste brine, The potential for nitrate dumping specifically for non-
selective resin use for high sulfate waters, The need to address resin susceptibility to hardness, iron,
manganese, suspended solids, organic matter, and chlorine, and
The possible role of resin residuals in DBP formation.Reverse Osmosis
High quality product water, Multiple contaminant removal, Desalination (TDS removal), Feasible automation, Small footprint, and Application for small and
POU applications.
The disposal of waste concentrate, Typically high capital and O&M costs, The need to address membrane susceptibility to hardness,
iron, manganese, suspended solids, silica, organic matter, and chlorine,
High energy demands, and The lack of control over target constituents (complete
demineralization).Electrodialysis/Electrodialysis Reversal
Limited to no chemical usage, Long lasting membranes, Selective removal of target
species, Flexibility in removal rate
through voltage control, Better water recovery (lower
waster volume), Feasible automation, and Multiple contaminant removal.
The disposal of waste concentrate, The need to address membrane susceptibility to hardness,
iron, manganese, and suspended solids, High maintenance demands, Costs (comparable to RO systems), The need to vent gaseous by-products, The potential for precipitation with high recovery, High system complexity, and Dependence on conductivity.
Biological Denitrification
High water recovery, No brine or concentrate waste
stream (nitrate reduction rather than removal to waste stream),
Low sludge waste, Less expensive operation, Limited chemical input, Increased sustainability, and Multiple contaminant removal.
The need for substrate and nutrient addition, High monitoring needs, Significant post-treatment requirements, High capital costs, Sensitivity to environmental conditions (sometimes), Large system footprint (sometimes), High system complexity (sometimes, can be comparable
to RO), Lack of full scale systems in the U.S., The possibility of partial denitrification, Permitting and piloting requirements, and Slower initial start-up, which could cause challenges for
wells with intermittent run time.Chemical Denitrification
Conversion of nitrate to other nitrogen species (no brine or concentrate waste stream),
The potential for more sustainable treatment,
High water recovery (higher than RO according to Cleanit®-LC), and
Multiple contaminant removal.
The potential reduction of nitrate beyond nitrogen gas to ammonia,
The possibility of partial denitrification, The possible dependence of performance on pH and
temperature, The possible need for iron removal, and The lack of full-scale chemical denitrification systems
resulting in:o Unknown reliability,o Unknown costs, ando Unknown operational complications.