Embed Size (px)
Citation preview

Scholars' Mine Scholars' Mine
Masters Theses Student Theses and Dissertations
Fall 1987
An assessment of large scale battery energy storage for industrial An assessment of large scale battery energy storage for industrial
loads loads
Brent Edward McKinney
Follow this and additional works at: https://scholarsmine.mst.edu/masters_theses
Part of the Electrical and Computer Engineering Commons
Department: Department:
Recommended Citation Recommended Citation McKinney, Brent Edward, "An assessment of large scale battery energy storage for industrial loads" (1987). Masters Theses. 675. https://scholarsmine.mst.edu/masters_theses/675
This thesis is brought to you by Scholars' Mine, a service of the Missouri S&T Library and Learning Resources. This work is protected by U. S. Copyright Law. Unauthorized use including reproduction for redistribution requires the permission of the copyright holder. For more information, please contact [email protected].

AN ASSESSMENT OF LARGE SCALE BATTERY ENERGY STORAGE
FOR INDUSTRIAL LOADS
BY
BRENT EDWARD MCKINNEY, 1964-
A THESIS
Presented to the Faculty of the Graduate School of the
UNIVERSITY OF MISSOURI-ROLLA
In Partia l Fulfillment of the Requirements for the Degree
MASTER OF SCIENCE
i n
ELECTRICAL ENGINEERING
1987

ABSTRACT
Reduction of peak demand on ut i l i ty systems can be beneficial to
both u t i l i t ie s and customers. One means of achieving peak demand
reduction is by the use of l oad-leveling batteries. This thesis
describes the technical and economic factors for demand side,
customer-owned battery energy storage systems. The thesis has taken
into account battery costs, converter and balance of plant costs,
current u t i l i ty rates, and customer load profiles typical of those for
which battery storage may be feasible. Battery storage system designs
and costs were described and quantified by using the results of EPRI
project 1275-12. Ut i l i t ies in the midwest were selected and contacted
to obtain the most current rates and customer load profiles.
Using the data for a range of applications, an economic analysis
was conducted. A base application was described and evaluated using
after tax internal rate of return and net present worth methods. Cost
and performance parameters were varied parametrical ly in order to
determine the sensit iv ity of the parameters. An analysis of 23
specific customer applications was also made.
Results of this thesis indicate that the battery, converter and
balance of plant technology make construction of customer-owned
battery energy storage systems technically feasible. However,
economic fea s ib i l i ty was found for only a few applications. Major
equipment costs were found to be battery and converter costs. Battery
system size and balance of plant costs also have an effect on the
economic feas ib i l i ty . Other cost and battery system design factors,

i i i
including maintenance costs and battery efficiency, were found to have
l i t t le influence on the net present worth. The non-equipment factors
found to be important included the u t i l i t y demand charge and the shape
of the customer load profile.

ACKNOWLEDGEMENT
The author would like to thank Union Electric, American Electric
Power, Kansas City Power and Light, Arkansas Power and Light, The
Empire District Electric Company, Springfield CU, and Central I l l i n o i s
Public Service Company for the load profile information provided for
th is paper. Very special thanks from the author goes to Union
Electric for their input to the paper and for their fellowship funding
during his graduate program.
The author would like to express his sincere gratitude to his
advisor, Dr. Max Anderson, for his advice and guidance during the
course of th is paper. The author also appreciates the help and
guidance given to him by Dr. Raymond Kluczney and Dr. Earl Richards.
Lastly, the author would like to thank his family whose support
and encouragement made this paper possible.

V
TABLE OF CONTENTS
PAGE
ABSTRACT .............................................................. . . . . . ii
ACKNOWLEDGEMENTS ................................................................. iv
LIST OF ILLUSTRATIONS........................................................ vii
LIST OF TABLES.................................................................... v i i i
I. INTRODUCTION .............................................................. 1
I I . LITERATURE REVIEW ................................................. 3
I I I . LARGE SCALE BATTERY ENERGY STORAGE JUSTIFICATION . . . . 5
IV. LARGE SCALE BATTERY ENERGY STORAGE SPECIFICATIONS . . . 17
A. BATTERY DESIGN...................................................... 17
6. CONVERTER DESIGN .................................................. 19
C. BALANCE OF PLANT D E S IG N ....................................... 23
V. ECONOMIC ANALYSIS OF BES SYSTEMS FOR INDUSTRIAL LOADS . 24
A. GENERAL BENEFIT/COST ANALYSIS METHODS ................... 24
B. APPLICATION TO INDUSTRIAL LOADS ........................... 37
C. RESULTS FOR ACTUAL INDUSTRIAL LOADS ....................... 40
1. Case Number 1: Customer A .............................. 43
2. Case Number 2: Customer B .............................. 4o
3. Case Number 3: Customer C .............................. 50
4. Case Number 4: Customer D .............................. 53
D. SENSITIVITY ANALYSIS ............................................ 55
VI. SUMMARY AND CONCLUSIONS............................................ 60
BIBLIOGRAPHY ....................................................................... b3
VITA 65

VI
TABLE OF CONTENTS (CONTINUED)
PAGE
APPENDICES
A. ASSESSMENT OF BOP CONFIGURATIONS........................... 66
B. ECONOMIC COMPUTER MODEL ...................................... 72
C. DESCRIPTION OF VARIABLES IN ECONOMIC MODEL ............ 74
D. EXAMPLE OF COMPUTER MODEL OUTPUT ........................... 83
E. MODEL AND OUTPUT FOR CASE NUMBER O NE..................... 87
F. MODEL AND OUTPUT FOR CASE NUMBER TWO...................... 93
G. MODEL AND OUTPUT FOR CASE NUMBER THREE.................. 99
H. MODEL AND OUTPUT FOR CASE NUMBER F O U R .................. 105

vn
LIST OF ILLUSTRATIONS
FIGURES PAGE
1. LOAD PROFILE FOR FACTORY WORKING ONE SHIFT .............. 8
2. LOAD PROFILE FOR FACTORY WORKING THREE SHIFTS . . . . 9
3. EXAMPLE OF LOAD PROFILE FOR A STEEL P L A N T ............... 10
4. LOAD PROFILE FOR PROFILE FACTOR EXAMPLE ................. 12
5. EXAMPLE OF BUILDING PEAK LOAD P R O F IL E .................... 13
6. LOAD PROFILE FOR CUSTOMER 1 ........... ....................... 15
7. BATTERY DIRECT COST VERSUS DISCHARGE DURATION . . . . 27
8. BATTERY DISCOUNT FACTOR VERSUS MWhr CAPACITY.............. 28
9. BATTERY COST FROM MANUFACTURER................................. 29
10. CONVERTER DIRECT COST VERSUS OUTPUT CONVERTER POWER . 31
11. BALANCE OF PLANT COST VERSUS MWhr CAPACITY............... 32
12. EXAMPLE LOAD PROFILE............................................... 38
13. PEAK WINTER LOAD PROFILE FOR CUSTOMER A .................. 44
14. PEAK SUMMER LOAD PROFILE FOR CUSTOMER A .................. 45
15. PEAK WINTER LOAD PROFILE FOR CUSTOMER B ................. 47
16. PEAK SUMMER LOAD PROFILE FOR CUSTOMER B ................. 48
17. LOAD PROFILE OF REPRESENTIVE WEEK FOR CUSTOMER C . . . 51
18. LOAD PROFILE OF REPRESENTIVE WEEK FOR CUSTOMER D . . . 54

v m
LIST OF TABLES
TABLE PAGE
I. SPECIFICATION FOR LEAD ACID BATTERY C t L L ............. 18
I I . CONVERIER SPECIFICATIONS FOR A 600 VOLT CONVERTER . . 21
I I I . SUMMARY OF BOP CONFIGURATIONS............................ 23
IV. ANNUAL OPERATING AND MAINTENANCE EXPENSE .................. 35
V. VALUES OF INDEPENDENT VARIABLES FOR FIGURE 12 . . . . 39
VI. ASSESSMENT OF LOAD PROFILES AND CORRESPONDING MODEL
R O R .................................................................. 41
V I I . SUMMARY OF POSITIVE ROR C A S E S ............................ 56
V I I I . SENSITIVITY ANALYSIS ................................................ 57

1
I. INTRODUCTION
With escalating energy costs, there is an increasing interest in
storing offpeak energy from electric power plants for use during hours
of peak demand. Large scale battery energy storage (BES) systems may
be used in the future for 1oad-leve1ing purposes. When used for
industrial load leveling applications, BES systems will convert
offpeak electrical energy into chemical energy for storage. This
energy will then be reconverted and used at times of peak energy
demand. Therefore, the industry will avoid paying a higher electrical
demand b i l l .
The goal of th is report is to determine the economic feas ib i l i ty
of a BES system for industrial loads. The report will also attempt to
identify the key parameters, such as BES system cost and u t i l i t y
rates, which will make such an application economically feasible. The
report is presented in the following manner:
1. Literature Review
2. BES Justif ication
3. BES Specifications
4. Economic Analysis of BES Systems for Industrial Loads
A. BES System Costs
B. BES Application Savings
5. Examples of Economic Analysis for Industrial Loads
6. Summary and Conclusions

2
The literature review identifies the studies that are available
concerning BES systems and the technology of battery storage. The
literature concerning BES systems consists entirely of studies
conducted by Bechtel and EPRI and the results of the research. The
literature review also identifies the books and manuals on which the
economic analysis was based.
The section on BES just if icat ion describes the benefits that a BES
system can provide to an industrial load. The benefits to generating
and non-generating u t i l i t i e s are also br ief ly discussed.
The section on BES specifications gives a technical description of
the battery, converter and balance of plant systems. Some technical
interface problems are also discussed.
Economic analysis section describes the cost and benefits of a BES
system for industrial applications. The cost is broken down into
several areas. A method of determining the benefits is also described
in this section. An economic computer model is produced and used to
assess the economic fea s ib i l i t y of BES systems for various industrial
loads.
The economic analysis examples are for industrial load profi les
which have been provided by several electric u t i l i t ie s . The analysis
produces the rate of return which would have resulted i f a BES system
would have been installed.
The summary and conclusions will attempt to decide i f BES systems
are economically feasible for industrial loads. This section will
also attempt to identify why or why not the systems are feasible.

3
I I . LITERATURE REVIEW
Large Scale Battery Energy Storage is a f a i r ly new technology, but
the technology of battery storage has been around for many decades.
There are several publications which present the theory of small scale
battery energy storage [1,2,3,4] and describe the physics of lead acid
and zinc chloride batteries. Lead acid storage technology has been
developed into a very specialized technology L3].
The development of large scale battery energy storage is primarily
due to EPRI project 1275-12. The goal of this ongoing project is to
develop a 10MW, lOhr battery energy storage system. This project is
currently being assisted by several battery manufacturers and has been
documented by EPRI [5,6,7,8,9,10,11].
Energy Development Associates has produced an interim report on
the development of the zinc chloride battery for EPRI [6J. This paper
was published by EPRI in 1983 and documents the research effort in the
area of zinc chloride battery development. The development of zinc
chloride batteries has centered mainly on the efficiency and control
of the system. The cell efficiency of a zinc chloride system was
found to be fa i r ly low and the control system very expensive. The
system must also be extensively monitored and the climate control of
the cells is very important.
The development of lead acid batteries has been conducted by EPRI,
Bechtel Inc. and several battery manufacturers. EPRI has designated a
project for the development of large scale lead acid batteries; this

4
project is designated 1275-12 [5,7,8,10,11]. The design and cost of
some of these BES systems was documented by Bechtel in 1985 [5].
Investigators from Bechtel describe the advances in battery technology
and also the advances in the converter technology. This research has
been able to develop a battery capable of 1MW of power storage with a
lOMWhr storage rating. Several plant systems are also described in
this paper. In addition the paper alludes to the previous paper
Bechtel developed which was published by EPRI in 1981 [9J. This paper
describes some of the environmental concerns which are assessed for
five different BES systems.
The economic feas ib i l i ty of a BES system has also been the subject
of several EPRI publications [7,8,10,11] and was analyzed for
generating u t i l i t ie s and for customer side metering. The publications,
in general, used projected equipment costs and produced cost estimates
without tax considerations.
Tax laws applicable to a BES system were taken into account from
the government publication of the 1986 tax reform act [12].
The theory behind the economic analysis for this report was taken
from an engineering economy text [13].
Overall, the literature available for a BES system comes mainly
from the EPRI publications. These publications were released during
the 1980's and have been regularly updated.

5
I I I . LARGE SCALE BATTERY ENERGY STORAGE JUSTIFICA1ION
Since 1979 the Department of Energy, EPRI and several mineral
producing companies have embarked on a project to develop batteries
which could store up to 10MW of power for several hours. EPRI has
constructed a test f a c i l i t y in New Jersey, called the Battery Energy
Storage Test (BEST) Facil ity, in order to advance the research on
large scale battery energy storage. This fac i l i ty has been the site
of many tests, both on lead-acid and zinc-chloride batteries. The
fa c i l i t y is also used to test high power ac-dc converters which would
be used to connect the batteries to a u t i l i t y system. EPRI has also
contracted with Bechtel Inc. to help with the physical research and to
perform economic and environmental impact studies related to battery
energy storage. Bechtel and EPRI have published several papers on
these subjects [5,6,7,8,9,10,11]. Bechtel has written a series of
papers on the economic feas ib i l i ty of battery energy storage which is
part of EPRI project 1275-12 [5,7,8,10,11]. The studies have been
mainly on the impact to large customers.
Battery research is ongoing, and according to Bechtel and EPRI, it
has promise for the future. The 10MW battery would be useful to a
generating u t i l i t y as a peaking source of power. The battery system
could be placed on a feeder system during a peak period and supply the
system for the duration of the peak. However, since the feeders are
usually set up to carry 10MW of power the generating u t i l i t i e s are not
interested in any battery system which is less than 10MW.

6
Currently, whenever a generating u t i l i t y is reaching a stage where
peak units such as combustion turbines must be used, the u t i l i t y
starts the turbines and uses them during the peak. The turbines
therefore provide enough power for the u t i l i t y to supply their
customers during a peak period. Therefore, i f a generating u t i l i t y
could use a battery to store energy during off-peak times and
discharge the battery during peak periods the u t i l i t y may not have to
build or use combustion turbines. This would raise the load factor
during off-peak times and all of the energy absorbed by the battery
during the off-peak period would be released during the peak period,
provided that the battery is 100% efficient. This type of system
would be ideal since most u t i l i t ie s set up their feeders to handle
10MW; the battery could be connected to one feeder and many stab i l i ty
problems could be avoided. However, the current research by EPRI has
developed only a 1 MW battery and this battery is considered to be of
l i t t le value to a generating u t i l i t y . The u t i l i t i e s are s t i l l waiting
for the development of a 10MW battery.
The non-generating u t i l i t i e s do have some use for a 1MW battery on
the demand side. These u t i l i t ie s , such as municipalities and rural
electric cooperatives, pay a demand charge to the generating u t i l i t y
from which they buy their power. I f a municipality were to install a
battery system they could lower their peak demand by 1MW. This would
be true i f the battery was able to produce 1MW for the duration of the
peak. Many battery systems have an in it ia l capital outlay of s l igh t ly
over a million dollars and a 5-10 year payback period. Therefore, a
BES system would be profitable for many municipalities.

7
The current technology in battery energy storage seems to indicate
that a market may be availalbe in the industrial area. Industrial
customers pay a demand and energy charge to the u t i l i ty which provides
them with electric ity. Therefore, the electrical cost for an industry
depends on the demand charge, energy charge, and load profile of that
industry. The load profile of industrial customers is very
diversif ied, depending on how many shifts the plant works and what the
product is. For example, i f factory A works one shift i t s load
profile may be something like Figure 1. I f the same factory works 3
sh i ft s the load profile would probably look something l ike Figure 2.
Therefore, while the load in Figure 2 is f a i r ly constant the load in
Figure 1 is constant only over an 8 hour period and then only uses a
small amount of power usually for maintenance purposes. The process
of an industry wil l also affect the load profile. For example, i f a
company produces fiberglass the load profile will look something like
Figure 2. The production of fiberglass requires a f a i r l y constant
amount of power. The motors which turn the power and feedback ro l lers
are constantly on and there is no machine in the process which draws a
great amount of power. If the company produces steel the load profi le
can look something like Figure 3. In a steel plant arc furnaces are
usually used and these furnaces draw a great amount of power for a
short time. These furnaces can pull up to 50MW each for a short
period of time. Therefore, the product and number of sh ift s has a
great impact on the load profi le of an industry.

AN
D I
N K
W
tous
onds
)PEAK DEMAND PR O FILE
Figure 1. Load P ro f i le for Factory Working One Shift. OD

PEAK DEM AND P R O FILE
Fiaure 2. Load P ro f i le for Factory Working Three Sh i f t s .

200
1BO
180
170
160
150
140
130
120
110
100
90
00
70
PEAK DEM AND P R O FILE
TIME OF DAY (HOURS)
Figure 3. Example of Load Profile for a Steel Plant.

11
Many industries, such as the steel industry, have a poor load
factor. This load factor is due to the sharp peaks in their load
profile. A good measure of the sharpness of a peak is the profile
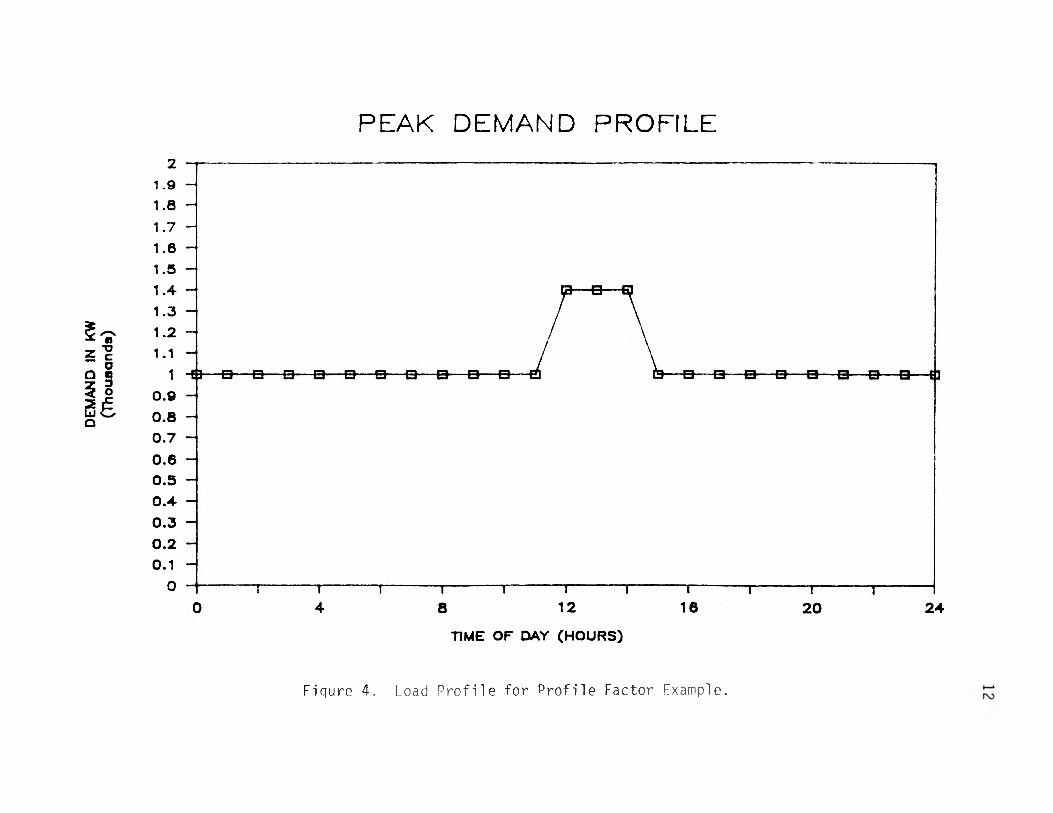
factor. The profi le factor i s defined as:
PROFILE FACTOR = P/T %/Hr
Where
P = THE PERCENTAGE OF EXTRA POWER DEMANDED FOR THE PEAK
T = THE DURATION OF THE PEAK
For example, the load profi le in Figure 4 has a profile factor of 8%.
The profile factor for Figure 4 is determined by the 5 hour duration
of the peak and the 40% extra power needed for the peak. Whenever an
industry has a high profile factor their load factor is usually low.
They are directly correlated because a high profile factor produces a
high demand for a short time and this substantially increases the peak
demand while doing very l i t t le for the average demand. Many
industrial loads have reoccurring peaks. These are peaks which occur
several times in a work week. They may occur every time a certain
machine is used or they may be the result of a building peak. An
example of a building peak is shown in Figure 5. Overall, the load
profi le of an industrial customer depends on the machinery used to
manufacture and what type of product is being manufactured.
The economic value for a 1MW battery may be found by using the
battery to offset a peak demand. Whenever an industrial load is
nearing their peak demand period they could discharge the 1MW battery
AN
D I
N KW
PEAK DEMAND PR OFILE
Fiqure 4. Load P ro f i le for P ro f i le Factor Example.

DEM
AND
IN K
W
(Tho
usan
d*)
PEAK DEM AND P R O F ILE
Piqure 5, Example of Building Peak Load Profile. GO

14
and possibly reduce their peak demand by 1MW. However, the use of
batteries to reduce peak demand is not quite that simple. The peak
demand may last 15 minutes, several hours, or in stages. I f the peak
lasts in stages, the battery may be required to discharge and then a
short time later it may be required to discharge again. This can be a
problem i f the battery does not have time to recharge. I f the battery
does have time to recharge, the constant cycling of the battery may
render it useless after a few years because of the 2000-cycle l ife of
a battery. The battery system which EPRI has developed wil l
completely recharge in 7 hours. Many times a load will gradually
build over a day or a period of time. Whenever the load builds in
this way the peak demand occurs gradually. This gradual peak may
result in the battery needing to discharge for several hours in order
to remove 1MW from the peak. This means that the MWhr rating for the
battery must be increased in order to shave the peak. The increase in
the MWhr rating wil l greatly increase the cost of the battery and it
may become economically feasible to only shave off 500KW in order to
dramatically reduce the MWhr rating of the battery. The choice of the
discharge time of the battery is also very important. For example,
Figure 6 shows the load profile of Customer 1. The most economical
way to shave off demand would be to shave 300KW from the load. I f any
more than 300KW was shaved off, the MWhr rating of the battery would
become very high. Since the peak lasts for one hour the battery will
have to produce only 300KWhr of energy and 300 KW of power for one
hour. Therefore, Customer 1 would only want to purchase a battery
capable of producing enough power and energy to shave the peak. The

DEM
AND
IN K
W
(Tho
usan
d*)
PEAK DEM AND P R O FILE
TIME OF DAY (HOURS)
Figure 6. Load P ro f i l e for Customer 1.c_n

customer would not want to buy a 1000KW, lOOOKWhr battery to shave
this low energy low power peak. However, the smallest battery that
can be bought for large scale power storage is a 500KW, 500KWhr
battery. Therefore, the discharge duration time would be 500/300 =
1.67 hours. Any discharge time higher than this would not allow th
battery to discharge its energy fast enough. However, it w i l l be
shown later that the longer the battery discharges the cheaper the
battery will become.

17
IV. LARGE SCALE BATTERY ENERGY STORAGE SPECIFICATIONS
A. BATTERY DESIGN
There are currently two types of lead-acid battery cells
available. These are the flooded electrolyte cell in a six cell
module and the absolyte absorbed elecrolyte sealed cell in a 12-cell
module. These cells are manufactured by GNB Batteries Inc. A surrmary
of the specifications for these cells are shown in Table I.
The s ix -ce l l 160-XL module has been used for several Bechtel
projects. The module is commercially available and meets EPRI
specifications for customer-side applications. The positive and
negative sides have an antimony plate and each cell has an a i r l i f t
pump, electrolyte level indicator and a flash arrestor. The six cells
are series connected in a fiberglass reinforced plastic tray. All
intercell connections are soldered and welded. The connection cable
is 4/0 AWG and has terminal plates. The cells discharge at a rate of
1.6 volts per cell or 9.6 volts per module. The cells charge at 2.33
volts per cell or 13.98 volts per module. This low voltage allows for
no emission of stibine or arsine. The flash arrestors also limit acid
mist emissions. These cells are not sealed and therefore cause some
concern about possible spillage of hazardous materials.
The absolyte cell has an absorbed electrolyte cell and is sealed
in order to prevent spillage. The GNB cell model 12-75A-27 is
commercially available and is used in many battery experiments. This
model consists of a 12 cell module which is factory welded or bolted.

18
Table I
SPECIFICATION FOR LEAD-ACID BATTERY CELL
Standard Cell 160-XL
Number of Cells
Per Module 6
End of Life Capacity
For a One-Hour Discharge
Rate in KWhr 9.84
Dimensions (inches) 37x55x12
Weight (pounds) 2200
Energy Density (KWhr/FT 3) .70
100% Recharging Time (hours) 7
Cycle Life
Sealed Cell 75A-27
12
13.8
19x42x23
1865
1.3
7
2000 2000

19
B. CONVERTER DESIGN
In order for a battery to be connected to an ac system an ac-dc
converter must be installed. This is especially true when considering
large scale battery energy storage. The converter developed for a
large scale battery has been designed by Firing Circuits Inc. (FCI).
This converter, for a 1MW battery, consists of two 500KW converters
ganged together to form one unit. The unit would be approximately 28
feet long, 8 feet wide and 16 feet high. A small control cabinet
would also be installed. The factory designed control cabinet would
consist of a microprocessor system capable of monitoring part of the
battery's performance. A more optimal control solution would be to
use some type of dig ital control system capable of feedback, such as
the 530-TI programmable controller.
The FCI converter uses a 12-pulse, line commutated
con verter/i nverter which ut i l izes high power thyristor circuitry,
phase shift ing transformers and harmonic f i l te rs . The converter also
has an electrical isolation system which isolates the converter from
the ground currents and noise produced from other parts of the battery
system. The isolation also helps to prevent any transfer of noise and
harmonics from the converter to the power system in which the battery
system is attached. The isolation barrier is also useful in the
synchronization of the converter output to the u t i l i t y grid.
The converter is e lectr ica l ly protected by a high-speed ac c ircuit
breaker between the power system of the u t i l i t y and the battery
storage system. The breaker is designed to clear all faults on either
side of the breaker and to have the appropriate interrupting capacity.
The current design by FCI has a 480 vac, 1000 A breaker with a 35000 A

20
symmetrical short c ircu it current interrupting rating. The voltage
and current ratings can be increased by special design but this is
usually very expensive.
The two phase shift ing transformers are custom made and have an
individual rating of 690 KVA and a 5% impedance. This unit has been
supplied to EPRI by FCI for their BEST fac i l i ty and has a nominal 480
vac delta-connected winding on the primary side. This unit can also
be obtained with 600 vac winding on the primary side. The converter
specifications for the 600 vac winding are shown in Table I I .
The FCI converter control system uses a microprocessor-based
control system to provide thyristor gating signals, actuate current-
reversing contactors, and regulate battery response to customer load
requirements. The control system monitors the customer's load with
approximately 18 data channels. The microprocessor can be factory
programmed to perform al l of the calculations needed to run a battery
energy storage system from the converter point of view. FCI also
provides a RS232C serial data port which may be used with a customer
supplied portable CRT/printer for the display of battery performance
variables. All of the control system that was just described is not
included in the baseline system design.
FCI does not publish any re l iab i l i t y or repair time information on
the 1 MW converter. However, FCI has said that it has tested similar
converters and have found that they are usually maintenance free for
eight years [7]. Therefore, using the information supplied from the
similiar converters, a mean time to repair of 21000 hours and a mean
time to repair of 1 to 4 hours can be expected.

21
Table I I
CONVERTER SPECIFICATIONS FOR A 600 VOLT CONVERTER
ac Voltage
ac Current
Battery Voltage
Converter Specifications
600v +/- 10%, 3 phase, 60 Hz
650 amps
755 Vdc max charge voltage
518 Vdc min charge voltage
Battery Current
Maximum Charge 600 amps
Maximum Discharge 965 amps
Harmonic Distortion 5%
Round Trip Efficiency 82%
End of Discharge Power Factor .85

As with a l l electrical devices there are specifications included
for the converter in the Uniform Building Code, OSHA, and the National
Electric Code. In addition, there may be some state electrical codes
which apply to the converter system. This would have to be reviewed
on a state by state basis.
C. BALANCE OF PLANT DESIGN
One the battery and converter system have been specified a plant
or substation system must be designed in order to contain the battery
and converter and provide a control monitoring system. This plant is
referred to as the balance of plant (BOP) for the battery energy
storage system.
Bechtel has conducted many tests to find the most economical and
technologically efficient means of providing a plant for the battery,
converter and control system. In these studies Bechtel attempted to
develop an optimized plant layout for a modular battery plant. The
approach considered plant size, horizontal and vertical equipment
arrangements, indoor and outdoor installations, practicality of
battery maintenance and the f le x ib i l i t y for expansion to larger plant
s izes.
An assessment of the configurations designed by Bechtel in EPRI
project 1 275- 12 is found in Appendix A. A surrmary of the BOP
configuration is found in Table I I I .
22

23
Table I I I
SUMMARY OF BOP CONFIGURATIONS
Balance of Plant Configurations
Confi g. Number
Type of Cell
No. of Ti er s
Building Area FT**2
Energy Footprint KWhr/FT**2
1 Standard 4 1320 1 .2
2 Standard 4 1000 1 .6
3 Standard 4 840 1 .9
4 Standard 1 1650 0.9
5 Standard 1 2560 0.6
6 Sealed 4 720 1 .8
7 Seal ed 4 392 3.4

24
V. ECONOMIC ANALYSIS OF BES SYSTEMS FOR INDUSTRIAL LOADS
A. GENERAL BENEFIT/CQST ANALYSIS METHOD
The economic benefit of a battery energy storage (BES) system is
found in three parts. These parts are:
1. Ab i l i ty to shave KW's off of an industria l customer's peak
demand,
2. Allow an industrial customer to be e l ig ib le for an
interruptible load rate program, and
3. Provide an emergency power supply.
Whenever the BES system is used to shave off a peak for a given month
an electrical demand saving is acrued for that month. Therefore,
since the BES system has the capabil ity to shave off the same amount
of demand every month, the annual savings w il l be:
Annual Demand Savings = (Amount of KW Shaved)*
(Monthly Demand Charge)*(12) $/year
The load level at which the control system is set wil l determine
how many KW's will be shaved off. Since this will depend on the
industrial customer's field setting of the control system, it will be
assumed that the KW's shaved off will equal the battery capacity. The
battery can also benefit a company by allowing the company to be
e l ig ib le for an interruptible load rate program. This program
provides a lower demand rate or monthly incentives to companies who
agree to reduce their load by a given amount whenever the u t i l i t y that
is serving them reaches a peak demand period. For example, i ri the

25
Empire District Electric Company (EDEC) system, EDEC wil l pay an
incentive of $ 1.75/KW/Month to any industrial load which w il l allow
their power to be interrupted. With a BES system an industrial
customer could contract to reduce their load by an amount equal to the
battery capacity. When the u t i l i t y requests the customer to reduce
their load the customer could simply engage the BES system.
Therefore, by using the BES system the customer could qualify for the
interruptible load rate program. Most of the u t i l i t ie s who provide
interruptible rates do not interrupt more than 10 times a year.
Therefore, the interruptible rate could result in a large amount of
savings for a minimum of inconvenience.
The BES could also be used for an emergency power supply.
Whenever an electrical outage affects an industrial customer, the BES
could be engaged to produce power until the outage is alleviated.
The economic cost of a BES system is found in its in i t ia l cost and
annual maintenance. The in i t ia l cost of the BES system can be broken
down into four parts:
BATTERY COST: Cost of the battery is dependent on the power size,
energy size and the discharge duration. The discharge duration is the
amount of time which the battery should totally discharge. For
example, if a 500KWhr battery were used to shave 300KW off of a peak
for one hour the discharge duration would be 500KWhr/300KW = 1.67
hours. The battery direct cost is an expression for an in it ia l
battery purchase of 1 MW lOMWhr and also includes shipping and
installation. The battery direct cost as quoted from EPRI project
1275-12 [7] is:

26
Battery Direct Cost = 211/(log 10(T) + .767) $/KWhr
where T = the discharge duration in hours
In order to adjust the battery direct cost for a smaller than lOMWhr
purchase, the battery direct cost must be multiplied by the battery
discount factor. The battery discount factor as quoted from EPRI
project 1275-12[7] is:
Battery Discount Factor = 1 . 1 l* logl0(Battery MWhr Capacity)
Therefore, the cost of the battery from the manufacturer wil l be:
Battery Cost From Manufacturer = Battery Direct Cost*
Battery Discount Factor
Graphs of the battery direct cost, the battery discount factor and
the battery cost from manufacturer are shown in Fiyures 7, 8, and 9
respectively. Figure '/ shows that the battery direct cost is
s ign if icantly affected by the discharge duration. Figure 8 shows that
the battery discount factor is moderately affected by the MWhr
capacity of tne battery. Figure 9 shows the overall effect of
discharge duration and MWhr size on the battery cost from
manufacturer. Tne quotes for these batteries were mace by GNB
Batteries Inc. and were made on a 1MW, lGhr base [7 J. Therefore, any
quoted cost above the 1MW level i s an estimate. The derivation of tne
cost equations was not provided D y Becntel or GNB oatteries, but it is
based on a price of $.30/1o for lead.

280
270
280
250
240
230
220
210
200
100
160
170
180
150
140
130
120
Battery D irect C o s t per MW HR
DJ*charg« Duration tn Hour*
Figure 7. Battery D irect Cost Versus Discharge Duration. r\3

BATT
ERY
DISC
OUNT
FAC
TOR
B ATTER Y D IS C O U N T FACTOR
MWHR CAPACITY
Figure 8. Battery Discount Factor Versus MWhr Capacity. ^CO

BATT
ERY
COST
FRO
M M
ANUF
ACTU
RER
(Mill
ion*
)
BATTERY C O ST FRO M M A N U FA C TU RER
DISCHARGE DURATION IN HOURSWhere n = MWhr Capacity
Figure 9. Battery Cost From Manufacturer. rv>UD

30
CONVERTER COST: The cost of the converter is dependent upon the
amount of energy which the converter must convert and the amount of
time in which the converter must operate. The cost equation for the
converter was again taken from EPRI project 1 275-12 and was provided
to EPRI by Firing Circuits Inc [7J. The converter cost is given by
the following equation:
Converter Cost = 240000 x (P)** -.32 $
Where P = The ac Output Power of the Converter in MW
The graph of the converter cost curve is shown in Figure 10. The
figure shows that the cost of the converter is very dependent on the
MW size.
BALANCE OF PLANT COST: The plant cost is dependent on the size of
the battery and converter. Obviously, there are several different
plant designs and a different cost for each plant design. However,
there are certain s im ilar it ies in all of the plant configurations and
control systems for the plants. Therefore, a generic equation for the
cost of the plant should be able to model the actual cost f a i r l y
accurately. This is the approach that Bechtel took in EPRI study
1275-12 [7], Bechtel took quotes for building several plant
configurations and from these quotes derived a generic equation for
the plant cost. The graph of the equation is shown in Figure 11 and
the equation is as follows:

CONV
ERTE
R DI
RECT
COS
T
C O N V ER T ER D IRECT C O ST IN $ /K W
OUTPUT POWER IN MW
Figure 10. Converter Direct Cost Versus Output Converter Power. CO

BALA
NCE
OF P
LANT
COS
T (M
illio
ns)
B ALAN CE O F PLAvNT C O S T
Figure 11. Balance of Plant Cost Versus MWhr Capacity. GOrv>

33
BOP Cost = 28600+127000(E/(1 .321ogl0(T)+l)EXP.765
+ 17300(E)EXP.941(T)EXP-.677 $
Where E = the system size in MWhr
T = the discharge duration in hours
The f i r s t term in the equation denotes the average fixed cost of the
plant. The second term provides the building area cost and the third
term provides the cost for the switchgear and dc bus equipment.
Therefore, the balance of plant cost will vary depending on the type
of plant which is built. This design is left up to the industrial
customer. However, the generic equation provided by Bechtel for the
balance of plant provides a good estimate of the plant cost and will
be used for the economic analysis.
ENGINEERING COST: The engineering cost, like the BOP cost, will
vary depending on the size of the plant. However, Bechtel has found
that the engineering cost is near $161,000 for a plant cost of
$860,000 or less and is governed by the following equation for a plant
cost above $860,000 [7].
Engineering Cost = 188,000(PC)EXP( -PC/857) $
Where PC = The Total Plant Cost in Mill ions
Therefore, the engineering cost is fa i r ly well fixed for a BES system.
OPERATION AND MAINTENANCE COST: The operating and maintenance
costs of the BES system have been determined by the BES system
manufacturers. The expense w il l follow a seven year cycle. For

34
example, the annual maintenance cost for a 1MW system is shown in
Table IV. These costs are directly proportional for a system less
than or greater than 1MW. This cycle of maintenance cost encompasses
periodic cell repair and replacement and is valid up to twenty years.
INSURANCE AND TAXES: The battery, converter and plant cost are
subject to sales or user taxes and have to be insured. The industrial
standard for project insurance cost is 7% of total project cost over
the l i fe of the project. This is also the rate which was quoted to
Bechtel in its investigation into BES and this rate will be used for
the economic analysis in this paper.
The battery, converter and plant are also subject to sales or user
taxes which are dependent on the location of the main office of the
company involved. Sales or user tax is only assessed on the taxable
items in the battery, converter and plant cost. For example, labor
cost are not taxable by sales tax. Therefore, a variable "K" is
defined as the ratio of taxable equipment cost to total direct cost.
The maximum possible error when determining a K is called the
contingency rate. The contingency rate for the insurance quote was 5%
and therefore it wil l be assumed that the contingency rate of the
project will be 5%. In order to make an equivalent cost out of the
insurance, sales tax and contingency rate, an accounting factor will
be defined as:
Accounting Factor = ((1+ 1nsurance Rate)*(1+K*(Sales Tax Rate))+
Contingency Rate)

35
Table IV
ANNUAL OPERATING AND MAINTENANCE EXPENSE
Year Cost
n+1 $ 1700
n+2 $ 3600
n + 3 $ 3600
n+4 $ 5100
n+5 $ 5900
n+6 $15300
n + 7 $ 2500
Where n = 1, 2, 3, etc.

36
This accounting factor should be multiplied by the battery, converter
and plant cost in order to obtain a final cost. The "K" in the
equation is usually different for each part of the project.
Manufacturers of the equipment have provided the following "K" for
each phase of the BES system.
Battery K = 0.8
Converter K = 0.95
BOP K = 0.4
Therefore the battery, converter and BOP costs multiplied by the
accounting factor and added to the engineering cost will give an
assessment of the in i t ia l cost of a BES system.
Battery and converter in a BES system can be depreciated out under
the five-year modified accelerated cost recovery system (ACRS)
program, but the plant must be depreciated out in 15 years. The
taxable income for the project wil l be the overall savings minus the
overall cost with allowances made for depreciation and the amount of
state tax paid. The 34% federal tax rate and the 5% state tax rate
will usually apply to the BES system. During the f i r s t year the
capital outlay wil l usually be larger than the overall savings and a
tax credit can be taken. During the rest of the l ife of the battery
it is expected that the savings will be greater than the costs and a
tax l ia b i l i t y wil l occur.

37
B. APPLICATION TO INDUSTRIAL LOADS
In order to accurately determine if an industrial load can benefit
from a BES system an economic model must be constructed. The
Interactive Financial Planning System (IFPS) [4] model that was
constructed for th is paper is found in Appendix B. The assumptions
for the model are listed below:
1. The discount rate is 8%.
2. The project contingency rate is 5%.
3. The average inflation rate for the next twenty years is 4.5%.
4. The energy and demand charge wil l increase in direct
proportion to the inflation rate.
5. The salvage price for the battery wil l be 11% of the battery
direct cost.
6. The state and federal tax codes will not change for the next
twenty years.
The model begins by gathering data on the economic climate in the
area in which the BES system is to be installed. The model then
determines the overall benefits, overall costs and taxes assessed for
the BES system. An after tax net present worth and rate of return
(ROR) for each year is then produced. Note: The ROR is defined as
the discount rate which produces a net present worth of zero [13].
Appendix C contains a brief description of the dependent and
independent variables used in the program.
An example of the models output is shown in Appendix D. This
output is for the load profile shown in Figure 12. The independent
variables for th is particular model are l isted in Table V. The output

PEAK DEM AND PR O FILE
O
Figure 12. Example Load Profile. CO00

39
Table V
VALUES OF INDEPENDENT VARIABLES FOR FIGURE 12
Battery KW Capacity = 5U0
Inflation Rate - 0.045
Discount Rate = 0.08
Contingency Rate = 0.05
Sales Tax - 0.055
Demand Charge - 15.00
Energy Charge = 0.02
Discharge Duration Hours - 3
Battery KWH Capacity - 1500
KW Shaved Off Peak = 400

40
of the model shows that th is load profile has a positive rate of
return of 6.8% and an in i t ia l expenditure "plant cost plus engineering
cost" of $843,900.
C. RESULTS FOR ACTUAL INDUSTRIAL LOADS
Seven u t i l i t ie s were contacted for this study and asked to provide
load profile information for their industrial customers who have a
high profile factor. The seven u t i l i t ie s , a l l from the midwest area,
submitted a total of 23 industrial load profi les along with a copy of
their respective electric rates. These profi les included
manufacturing plants, steel plants, education service buildings and
builders of tra nsport at ion equipment. The 23 load profiles were then
examined and a BES system was modeled for each profi le. In all the
cases energy and demand cost escalation and other economic parameters
used were specified by the customer's u t i l i t y company. Equipment,
balance of plant, and operating costs were developed using the cost
equations presented in the general benefit/cost analysis method
section. Out of the 23 profi les only 4 of the profi les produced a
positive rate of return. This was due to either a low demand charge
in the load profile area or a low profile factor. An assessment of
the load profiles and the corresponding model ROR is shown in Table
VI. A further assessment of the load profi les which produced a
positive ROR is as follows:

41
Table VI
ASSESSMENT OF LOAD PROFILES AND CORRESPONDING MODEL ROR
CaseNo.
1987 Demand Charge/KW in $
Description of Peak
Model ROR in %
1 13.59 sharp, duration of 30 minutes 11.80
2 13.59 sharp, duration of 1 hour 10.77
3 10.58 moderately sharp, duration of 1 hour
6.32
4 10.58 extremely sharp, duration of 30 minutes
12.26
5 5.83 8 hour flat peak -17.83
6 5.83 2 hour f lat peak, repeats every 4 hours
-14.43
7 5.83 moderately sharp, duration of 1 1/2 hours
-10.65
8 5.83 extremely sharp, duration of - 2.00
9 9.42 3 hour flat peak -13.83
10 9.42 3 1/2 hour flat peak -14.12
11 4.79 8 hour flat peak -21.32
12 10.58 moderately sharp, duration of 2 hours
- .87
13 10.58 moderately sharp, duration of 3 hours
- 3.98
14 10.58 moderately sharp, duration of 30 minutes, repeats every 2 hours
-12.76
15 10.58 moderately sharp, duration of 1 hour, repeats every 2 hours
-15.75
16 10.58 moderately sharp, duration of 3 hours
- 3.98

42
Table VI
ASSESSMENT OF LOAD PROFILES AND CORRESPONDING MODEL ROR (Continued)
Case 1987 Demand Description Mode 1No. Charge/KW in $ of Peak ROR in %
17 8.79 2 hour f lat peak -10.76
18 8.79 2 hour f lat peak -10.76
19 13.59 3 hour f lat peak -10.83
20 13.59 moderately sharp, duration of 3 hours
- 2.31
21 13.59 moderately sharp, duration of 1 hour, repeats every 4 hours
-12.53
22 13.59 moderately sharp, duration of 3 hours, repeats every 24 hours
-18.97
23 13.59 moderately sharp, duration of 1 hour, repeats every 24 hours
-11.12

43
1. Case Number 1: Customer A. This customer is a manufacturer
of transportation equipment. The peak winter load profile i s shown in
Figure 13 and the peak summer load profile is shown in Figure 14.
These figures show that the load peaks are very short in duration but
occur continuously. The manufacturer is not e l ig ib le for an
interruptible load rate program in the u t i l i t y area where it is
located.
Several different methods of economic analysis were pursued with
the load profile of Customer A. These methods included varyiny the
amount of peak shaved from 250-1000KW and correspondingly varying the
KWhr capacity of the battery. After several t r ia l s it was determined
that the best analysis would be for shaving 1000KW off the peak with a
2000KWhr battery. The assumptions of the analysis are as follows:
1. The average inflation rate for the next twenty years will be
4.5%.
2. The project wil l have a contingency rate of 5%.
3. The demand charge will increase in direct proportion to the
inflation rate.
4. The energy charge will increase in direct proportion to the
inflation rate.
5. The state and federal tax codes wil l remain the same for the
next twenty years.
6. The insurance rate on the project will remain at 7%.
7. The discount rate is 8%.
8. No unexpected DNR or EPA maintenance expenses will occur.

KW D
EMAN
D
PEAK W INTER LOAD P R O FILE FOR C U STO M ER A
?
I
HOURS
Figure 13. Peak Winter Load P ro f i le for Customer A. -p *

KW D
EMAN
D (T
houa
cndt
)
PEAK SUM M ER LOAD P R O F ILE FOR C U S TO M E R A
HOURS
Figure 14. Peak Summer Load P ro f i l e for Customer A. cn

46
The program used and results of the economic analysis for Customer
A is found in Appendix E.
The analysis shows that the project wil l have a 13 year payback
period using an 8% discount rate. The analysis also shows that the
project at the end of its l i fe has an after tax rate of return of
11.80% and a net present worth of $415,965.
The in it ia l investment in this project would be the plant cost
plus the engineering cost and would equal $1,275,994.
As seen in the program results, the taxes taken from the profits
of the project are substantial. For example, in year 1987 the
effective tax rate was 36.47%.
Overall the analysis shows that for an in i t ia l investment of
$1,275,994, Customer A would get an 11.80% rate of return for twenty
years.
2. Case Number 2: Customer B. This customer is a manufacturer
of primary metals. The peak winter load profi le is shown in Figure 15
and the peak summer load profile is shown in Figure 16. These graphs
show that the load peaks are very short in duration but occur
continuously. This manufacturer is not e l ig ib le for an interruptible
load rate program in the u t i l i t y area where it is located.
Several different methods of economic analysis were pursued with
the load profile of Customer B. These methods included varying the
amount of peak shaved from 250-1000KW and correspondingly varying the

KW D
EMAN
D(T
hou«
md«
)
PEAK W INTER LOAD P R O F ILE FOR C U STO M ER B
a -
4 -
3 -
2 -
T~20
”,__ > u u_ _ r -
80----- 1---
80
HOURS
-~1— 100
~T-------1-------1-------1------1—120 140 180
I40
Figure 15. Peak Winter Load P ro f i le fo r Customer B. - - j

KW D
EMA
ND
(T
hou
san
ds)
PEAK SUMMER LOAD PR O FILE FOR C U STOM ER B
Figure 16. Peak Summer Load P ro f i le for Customer B. CO

49
KWhr capacity of the battery. After several t r ia l s it was determined
that the best analysis would be for shaving 500KW off the peak with a
500KWhr battery. The assumptions of the analysis are as follows:
1. The average inflation rate for the next twenty years will be
4.5%.
2. The project wil l have a contingency rate of 5%.
3. The demand charge will increase in direct proportion to the
inflation rate.
4. The energy charge will increase in direct proportion to the
inflation rate.
5. The state and federal tax codes will remain the same for the
next twenty years.
6. The insurance rate on the project wil l remain at 7%.
7. The discount rate is 8%.
8. No unexpected DNR and EPA maintenance expenses wil l occur.
The program used and results of the economic analysis for Customer
B is found in Appendix F.
The analysis shows that the project wil l have a 14 year payback
period using an 8% discount rate. The analysis shows that the project
at the end of its l i fe has an after tax rate of return of 10.77% and a
net present worth of $159,994.
The in it ia l investment in th is project would be the plant cost
plus the engineering cost and would equal $649,400.

50
As seen in the program results the taxes taken from the profits of
the project are substancial. For example, in the year 1987 the
effective tax rate was 36.49%.
Overall, the analysis shows that for an in i t ia l investment of
$649,000 Customer B would be a 10.77% rate of return for twenty years.
3. Case Number 3: Customer C. This customer is a manufacturer.
The load profile has a definite peak every week and a representative
week is shown in Figure 17. This graph shows that the load peaks
occur continuously for the f i r s t four days of the week and then fall
off during the last three days of the week.
Several different methods of economic analysis were pursued with
the load profile of Customer C. These methods included varying the
amount of peak shaved from 250-1000KW and correspondingly varying KWhr
capacity of the battery. After several t r ia l s it was determined that
the best analysis would be for shaving 1000KW off the peak with a
.5MWhr battery. The demand and energy rates are annualized for the
economic analysis. The assumptions of the analysis are as follows:
1. The average inflation rate for the next five years w il l be 0%
and the rate will be 4.5% for the following 15 years.
2. The project will have a contingency rate of 5%.
3. The demand charge will increase in direct proportion to the
inflation rate.

KW D
EMAN
D (T
hous
and*
)
C U ST O M E R C LOAD PR O F ILE7
6
5
4*
3
2
1
HOURS
Fiaure 17. Load P ro f i le of Representive Week for Customer C.

52
4. The energy charge wil l increase in direct proportion to the
inflation rate.
5. The state and federal tax codes wil l remain the same for the
next twenty years.
6. The insurance rate on the project wil l remain at 7%.
7. The discount rate is 8%.
8. No unexpected DNR or EPA maintenance expenses will occur.
The program used and results of the economic analysis for Customer
C is found in Appendix G.
Analysis shows that the project will have a 20 year payback period
using an 8% discount rate. The analysis also shows that the project
at the end of its l i fe has an after tax rate of return of 5.32% and a
net present worth of $-168,486.
The in it ia l investment in this project would be the plant cost
plus the engineering cost and would equal $1,311,971.
As seen in the program results, the taxes taken from the profits
of the project are substantial. For example, in year 1987 the
effective tax rate was 36.21%.
Overall, the analysis shows that for an in it ia l investment of
$1,311,971, Customer C would get a 6.32% after tax rate of return for
twenty years.

53
4. Case Number 4: Customer D. This customer is a manufacturer
of primary metals. The load profi le has a definite 30 minute peak at
least once a week. The load profile for a representative week is
found in Figure 18. The graph of the load profile of the metal
manufacturer shows many times in which the load quickly increases and
then just as quickly decreases. The BES system designed for this
manufacturer would be too small to allow Customer D to be e l ig ib le for
an interruptible load rate program.
Several different methods of economic analysis were pursued with
the load profile of Customer D. These methods included varying the
amount of peak shaved from 250-1000KW and correspondingly varying KWhr
capacity of the battery. After several t r ia l s it was determined that
the best analysis would be for shaving 1000KW off of the peak with a
.5MWhr battery. The demand and energy rates are annualized for the
economic analysis. The assumptions of the analysis are as follows:
1. The average inflation rate for the next f ive years w il l be 0%
and the rate will be 4.5% for the following 15 years.
2. The project wil l have a contingency rate of 5%.
3. The demand charge will increase in direct proportion to the
inflation rate.
4. The energy charge will increase in direct proportion to the
inflation rate.
5. The state and federal tax codes will remain the same for the
next twenty years.

200190
180
170
160
150
140
130
120110100
90
80
70
60
50
40
30
2010
0
CU STOM ER D LOAD PR O FILE
HOURS
Figure 18. Load P ro f i le of Representive Week for Customer D. cn

55
6. The insurance rate on the project w il l remain at 7%.
7. The discount rate is 8%.
8. No unexpected DNR or EPA maintenance expenses wil l occur.
The program used and results of the economic analysis for Customer
D is found in Appendix H.
The analysis shows that the project wil l have a 12 year payback
period using an 8% discount rate. Analysis also shows that the
project at the end of its l ife has an after tax rate of return of
12.26% and a net present worth of $281,600.
The in it ia l investment in th i s project would be the plant cost
plus the engineering cost and would equal $755,500.
As seen in the program results, the taxes taken from the profits
of the project are a considerable amount. For example, in the year
1987 the effective tax rate was 36.21%.
Overall the analys is shows that for an in i t ia l investment of
$755,500 Customer D would get a 12.26% after tax rate of return for
twenty years.
A summary of the four cases i s shown in Table VII.
D. SENSITIVITY ANALYSIS
A sens i t iv ity analysis was run on the economic model and the
results and sens i t iv i ty ranking are shown in Table V I I I . The
sens i t iv ity analysis is done by increasing certain variables by a
percentage and calculating the percent change in present worth. The
sens i t iv ity analysis shows that the demand charge and the amount of

56
Table VII
SUMMARY OF POSITIVE ROR CASES
Case No.
In i t ia l Cost in $
Effective Tax Rate in %
Payback Period at 8% Discount Rate
After TaxROR in %
1 1,275,994 36.47 13 years 11.80
2 649,900 36.49 14 years 10. 77
3 1,311,971 36.09 20+ years 6.32
4 755,500 36.21 12 years 12.26
Note: These are Cases 1-4 shown in Table VI

57
Table V I I I
SENSITIVITY ANALYSIS
Var iable% Change i n Net
Present Worth
10% Increase in Variable
KW Shaved Off Peak 395.4
On Peak Demand Charge 395.4
Battery KWH Capacity -135.9
Battery KW Capacity -104.9
Federal Tax Rate -102.6
Discharge Duration Hours 74.0
Inflation Rate 17.7
State Tax Rate - 17.5
Contingency Rate - 14.3
Sales Tax
20% Increase in Variable
- 12.6
KW Shaved Off Peak 790.9
On Peak Demand Charge 790.9
Battery KWH Capacity -270.5
Battery KW Capacity -209.8
Federal Tax Rate -205.3
Discharge Duration Hours 135.5
I n f l a t i on Rate 36.3

Table V I I I
SENSITIVITY ANALYSIS (Continued)
58
%Var iable
Change in Net Present Worth
20% Increase in Variable (Continued)
State Tax Rate - 35.0
Contingency Rate - 28.6
Sales Tax
30% Increase in Variable
- 25.2
KW Shaved Off Peak 1186.0
On Peak Demand Charge 1186.0
Battery KWH Capacity -404.0
Battery KW Capacity -314.7
Federal Tax Rate -307.9
Discharge Duration Hours 187.6
Inflation Rate 56.0
State Tax Rate - 52.5
Contingency Rate - 42.9
Sales Tax - 37.7

59
KW's shaved off of the peak are the key factors in the economic
feas ib i l i ty of a BES system. The analysis also shows that the battery
KW capacity, battery KWhr capacity and the federal tax rate have a
significant effect on the net present worth. Overall, the sen s i t iv i ty
analysis shows that a small change in any of the f i r s t six variables
listed in Table V I I I wil l produce a substantial change in the net
present worth of a project.

60
VI. SUMMARY AND CONCLUSIONS
The development of a 10MW, lOhr battery energy system is an
ongoing research project. The project is being headed by EPRI and
assisted by Bechtel Inc. and several other organizations. However,
the current technology can provide only a 1MW, lOhr BES system. This
is done by combining the base 500KW units and updating the converter
design. Although the 1MW BES system has l i t t le value to a u t i l i t y
system there is a use for it in the industrial area and for wholesale
customers such as municipal u t i l i t ie s . The battery system can be used
for load leveling purposes on the industrial or municipal level.
Economic analysis of a BES system must include the overall
benefits, overall costs, federal and state taxes, and insurance.
Overall benefits of the system are found in the peak demand savings
and the possible e l i g ib i l i t y for an interruptible load rate, with
emergency power supply being a side benefit. The overall costs of the
system is found in the in i t ia l cost and the yearly operating and
maintenance costs. The federal tax rate for the project is considered
to be 34% and the state tax rate is 5%. Equipment can be depreciated
in a 5-year modified ACRS plan and the plant can be depreciated in a
15-year modified ACRS plan. An economic model was used to analyze the
BES system for various industrial loads. The results of the model
showed that the rate of return for a BES system, when applied to an
industrial load, is very low and many times negative. Twenty-three
industrial load profi les were analyzed and

61
only four of the profiles had a positive rate of return when a BES
system was installed. The highest rate of return for al l of the
profi les was only s l ight ly below 13% for a twenty year investment.
A sens i t iv ity analysis was run on the economic model and it was
determined that the dominant elements were the demand charge and the
amount of KW's shaved off of the peak. This was not totally
unexpected since the savings is directly proportional to both of these
elements. However, since a high demand charge and high profi le factor
would create an extremely high customer electric b i l l i t was expected
at the start of the research that the areas which have a high demand
charge would have a relative low profile factor. Just the opposite
was discovered. There is a correlation between demand charge and
profile factor. The correlation was that for the 23 profi les which
were studied the demand charge was always higher in an area which had
a high profi le factor. However, there are a couple of reasons why the
correlation may hold true:
1. The u t i l i t i e s may be using a high demand rate to recover their
costs from the customers which have a low load factor.
2. Normally u t i l i t ie s who have a high demand rate offer many
services to an industrial customer, such as engineering
advice, economic analysis of new production systems and
analysis of alternate energy sources. It may be more
advantageous for the industrial customer to locate in an area
which offers these services than in an area with low demand
rates and a low amount of service.

62
Overall, the fea s ib i l i t y of a BES system for an industrial load is
very low at the present time. The in i t ia l cost of the system is
extremely high in comparison to the amount of capital saved by the
system. The system wil l undoubtly become cheaper as the technology
advances and as the system can be mass produced. Bechtel has
estimates which predict that the in i t ia l cost of the system w il l halve
whenever a production f a c i l i t y is built, but until that happens the
system is s t i l l very expensive. During discussions with several
u t i l i t y personnel it was learned that there is considerable interest
in systems which can reduce the peak load by load-leveling or peak
shaving. Therefore, there is considerable industrial interest in a
BES system and i f the in i t ia l cost of the system decreases in the
future the economic fea s ib i l i t y of a BES system wil l be greatly
i ncreased.

63
BIBLIOGRAPHY
1. G. Beghi, Energy Storage and Transportation, D. Reidel Publishing
Company, 1979, pp. 115-119, 238-277, 438-440.
2. W. V. Hassenzahl, Electrochemical, Electrical, and Magnetic
Storage of Energy, Hutchinson Ross Publishing Company, 1981, pp.
38-47.
3. Hans Bode, Lead-Acid Batteries, John Wiley and Sons Publishing
Company, 1977, pp. 1-5.
4. Louis F. Martin, Storage Batteries and Rechargable Cell
Technology, Noyes Data Corporation, 1974, pp. 30-37.
5. Bechtel Group Inc., Design and Cost of Standardized Lead-Acid
Battery Systems for U t i l i t y Energy Management, Project 1275-12,
Report EM-4200, Electric Power Research Institute, August 1985,
pp. Sl-5.3.
6. Bechtel Group Inc., Development of the Zinc Chloride Battery for
Ut i l i ty Applications, Project 226-5, Report EM-3136, Electric
Power Research Institute, June 1983, pp. 1.1-35.7.
7. Bechtel Group Inc., Updated Cost Estimate and Benefit Analysis of
Customer-owned Battery Energy Storage, Project 1275-12, Report EM
3872, Electric Power Research Institute, January 1985, pp. s 1-C33.
8. Bechtel Group Inc., Economic Analysis of Specific Customer-Side-
of-the Meter Applications for Battery Energy Storage, Volume 1,
Project 1275-12, Report EM-3535, Electric Power Research
Institute, May 1984, pp. S1-B6.

64
9. Bechtel Group Inc., Generic Environmental and Safety Assessment of
Five Battery Energy Storage Systems, Project 1371-1, Report EA-
2157, Electrical Power Research Institute, December 1981, pp. Sl-
Bl.
10. Bechtel Group Inc., Feas ib i l i ty Assessment of Customer-Side-of-
the-Meter Applicatins for Battery Energy Storage, Project 1275-12,
Report EM-2769, Electrical Power Research Institute, December
1982, pp. S1-A9.
11. Bechtel Group Inc., Economic Analysis of Specific Customer-Side-
of-the-Meter Applications for Battery Energy Storage, Volume 2,
Project 1275-12, Report EM-3535, Electrical Power Research
institute, May 1984, pp. C1-C135.
12. Commerce Clearing House Tax Law Editors, Explanation of Tax Reform
Act of 1986, Commerce Clearing House Inc., 1986, pp. 303-334, 101-
148.
13. H. G. Thuesen, W. J. Fabrycky, G. J. Thuesen, Engineering Economy,
Prentice-Hall, 1977, pp. 1-373.
14. Execucom, IFPS/PLU5 User's Manual Release 3.0, Volume 1, Execucom
Systems Corporation, 1986, pp. 1.1-B51.

65
VITA
Brent Edward Mckinney was born on February 28, 1964 in
Springfield, Missouri. He received his primary and secondary
education from Cabool Schools at Cabool, Missouri. During high school
he attended Mountain Grove Technical School and in 1982 received a
two-year degree in electrical technology. In August 1982 he began his
work at the University of Missouri-Rolla. In December 1986 he
received a Bachelor of Science degree in Electrical Engineering from
the University of Missouri-Rolla in Rol la, Missouri.
He has been enrolled in the Graduate School at the University of
Missouri-Rolla since January 1987. He also is the receipient of the
Union Electric Power Fellowship.

6 6
APPENDIX A
ASSESSMENT OF BOP CONFIGURATIONS
Tiering the battery modules is regarded as the most promising
space-saving approach. Reinforced concrete or structural steel is
considered to be the only practical materials for rack construction.
Battery racks for smaller station power systems are typ ica lly of free
standing steel construction and are bolted together in the field. The
racks are not more than three t iers high, which results in a rack of
about s ix or seven feet in height. The rack is anchored to the
building floor by using a reinforced concrete stanchion. The
stanchions support reinforced concrete shelves. The shelves are used
to support the lead-acid batteries and can support any battery modules
up to s ix cell. This rack is being constantly modified but i s s t i l l
considered more cost ly than prefabricated steel racks. Steel racks
can be supplied as either custom designed welded units or as
prefabricated snap together units such as are used for pallet racks in
warehouses. In many cases, i f the application is not in a seismic
zone, commercially available pallet racks can be modified to support
battery modules. I f the application is in a seismic zone some bracing
should be added to the pallet racks in order to reinforce the rack.
The structural integrity of the battery rack either through the
foundation or through the bu ild ing 's frame structure should be
considered. For a pre-engineered steel building the foundation size
is governed by the wind-induced uplift forces. Therefore, no space
saving can be accomplished with a pre-engineered steel building.

67
Standard length battery racks parallel to the building truss can
also be used. This approach would provide a flexible means of
increasing battery plant size without having to redesign the building
and building foundation. The evaluation of th i s design by Bechtel
proved that although theoretically this idea had promise, as an
engineering function this design was not feasible.
The overall assessment evaluation of the tiered configuration was
that the battery racks should be as many t iers as was safely possible.
This wil l decrease the amount of floor space needed for the battery
modules. The previous assessment had used a three tier model but the
final assessment proved that a four-t ier model was more feasible.
There are some drawbacks to the four-tier model; in order to perform
maintenance on the battery a fo rk l i f t will have to be used on the
fourth tier. The ce l ls also must be only racked two deep instead of
three deep. The sealed cell would have to be used with the four-t ier
model. This is due to maintenance requirements for the cel ls in the
fourth tier. These cel ls, whenever maintenance is performed, provide
a hazard if they are not sealed. Therefore, with a sealed cel l the
chances of a chemical sp i l l or accident is greatly diminished. There
are also many National Electric Code rules which must be adhered to
with this configuration. For example, for system voltages between 600
and 2500 volts the National E lectric Code specifies a minimum aisle
space of five feet if there are l ive parts on both sides of the aisle.
A four foot aisle must be provided between the battery modules and the
walls. Since the a is le requirements for an average fo rk l i f t is 7.5
feet the aisle requirements by the NEC will be met by default.

6 8
Note:
con sidered
The maximum working height of available fo rk l i f t s should
when deciding how high to stack the battery modules.
be
A. ASSESSMENT OF SINGLE-LAYER CONFIGURATIONS
The single layer configuration is used to reduce the cost and
operational d i f f icu lt ie s associated with racks and the maintenance
thereof. In a single layer configuration the battery modules would be
pushed together and only a limited amount of ais les would be provided.
The modules would have a two inch spacing between them within a row
and a six inch spacing between the rows. A four inch support would
also have to be added to each module for cooling purposes. There are
two major concepts for single layer configurations. The f i r s t one
consists of the spacing dimensions discussed above and a few 5.5 foot
a is les for maintenance purposes. The second concept eliminates all
a is les and spaces in between modules. The maintenance for the battery
would be performed with an electric hoist. The hoist could also be
used for cell removal and replacement.
B. ASSESSMENT OF OUTDOOR CONFIGURATIONS
The outdoor configuration can only be used for a sealed cel l.
This is due to the d if f icu lty of providing maintenance to a standard
cell during inclimate weather. However, a tiered approach of
positioning the modules outside an enclosure can be an effective way
of reducing the space requirements for the battery system. The
modules can be stacked in a four-t ier arrangement that greatly
decreases the space requirements.

69
After reviewing all of the configurations for a BES system Bechtel
has designed 7 BOP configurations. These configurations can be found
in EPRI project 1275-12 and the configuration summaries are as
follows:
1. Standard Cell, Three Aisle, Tiered Configuration. In this
configuration two rows of battery racks support 160 6-cell modules.
These modules are in a four-t ier rack and each rack is 26Lx4.5Dxl9H
"feet." The building used wil l measure 40Lx33Wx24H "feet." There
will be three a is les, each being 7.5 feet in width. This wil l provide
adequate space for the fo rk l i f t s which are used in maintenance
procedures. An adjustable height-platform should also be installed as
a uackup system for maintenance procedures. The building should be
equipped with a heavy equipment door and should also have a control
room for the converter and the control equipment.
2. Standard Cell, Two Aisle, Tiered Configuration. This is the
same as configuration 1 except that the two racks closest to the walls
will be only 2.25 feet deep. The center rack wil l remain 4.5 feet
deep. This allows the elimination of one of the a is les which allows
the building dimensions to become 40Lx25Wx24H "feet." This
configuration will also accommodate 160 battery modules.
3. Standard Cell, Ultra Narrow Aisle, Tiered Configuration. This
configuration is the same as configuration 2 except that the ais le
width is decreased to 5 feet. By decreasing the a is le width the
building size can be decreased but a different method of maintenance
must be used since a fo rk l i f t cannot operate in a 5 foot aisle.

70
Therefore, in order to perform maintenance a tro l ley system should be
installed to repair and replace damaged cells. An adjustable-height
platform may also be used for some maintenance jobs.
4. Standard Cell, Single Layer, No Aisle Configuration. In tnis
configuration eight rows of modules are installed in a block
configuration. This configuration is 21 feet long and has 6 inches of
spacing in between the rows. Each row contains 18 modules which are
placed parallel to each other. All maintenance is performed by a
hoist system and the building measures 55Lx30Wxl2H "feet." It should
be noted tnat th is configuration is only for 144 modules and the
previous configurations have accommodated 160 modules.
5. Standard Cell, S ing le Layer, Narrow Ai sle Configuration. This
configuration uses 5 rows of battery modules, each 1-tier high. Each
row is 50 feet long and is separated from the next row by a 5.5 foot
aisle. The three center rows are in groups of four modules and are
placed end to end. The outside rows are in groups of two modules and
are places end to end. Certain fo rk l i f t s can be used for maintenance
but with the 5.5 foot a is les maintenance is not done easi ly by the
fo rk l i f t s . The configuration also allows for maintenance to be done
from the ais les by maintenance personnel. This is much easier and
more favorable than attempting to do maintenance with a fo rk l i f t .
6. Sealed Cell, Indoor, Two Ai s l e , T iered Configuration. This is
the same as configuration 2 except that the racxs are only nine feet
high and a 12 cell module is used. There are 56 12-cell modules in
this configuration and the building dimensions are 36Lx20Wxl0H "feet."

71
7. Sealed Cell, Outdoor Enclosures, Tiered Configuration. In this
configuration two fu l l battery racks are used. The battery racks are
one-tier high and each rack contains 48 12-cell modules. An eight
foot aisle is placed between the racks and the building dimensions are
28Lx7WxllH "feet." This allows room for the auxil iary equipment and
the converter in the building.
Overall, whenever a BOP configuration is chosen, consideration
must be given to plant size, module size and quantity, and the seismic
zone properties of the region.

72
APPENDIX B
ECONOMIC COMPUTER MODEL
MODEL THESIS READY FOR E O I T , LAST L I N E IS 1020 INPU T: L I S T 1MODEL THESIS VERSION Of 0 9 / 2 3 / 8 7 2 0 : 6 110 COLUMNS 1 9 8 6 - 2 0 0 6
BALANCE OF PLANT F IX E D COST = 2 8 6 0 0 . 0 BATTERY KW C A PA CITY =CONVERTER BASE COS T - 2 6 0 . 0 SALVAGE RATE = .1 1IN FLA TIO N RATE -
DISCOUNT RATE =CONTINGENCY R A H - SALES TAX -
. 8= . 9 66
RATE -
20 30 60 60 60 70 80 90100 BATTERY k I 10 CONVERTER 120 BOP K 130 INSURANCE 160 FEDERAL TAX RATE =160 STATE TAX RATE =160 ON PEAK DEMAND CHARGE =170 OFF PEAK ENERGY CHARCE =180 0 ISCHARCE DURATION HRS =190 BATTERY KWH C A PA CITY =2 0 0 NOMINAL OUTPUT POWER IN MW =2 1 0 SLOPE OF CONVERTER COST CURVE - - . 3 2 2 2 0 ANNUAL BATTERY CYCLES =2 3 0 ANNUAL INTERRUPTIBLE LOAO SA VIN C S =2 6 0 BATTERY E F F IC IE N C Y .82 6 0 ROUNO TR IP CONVERTER E F F IC IE N C Y = . 9 2 " . 9 22 6 0 M A I N T = 1 7 0 0 . 3 6 0 0 , 3 6 0 0 . 5 1 0 0 , 5 9 0 0 . 1 6 3 0 0 , 2 6 0 0 . 1 7 0 0 , 3 6 0 0 . 3 6 0 0 . '2 7 0 6 1 0 0 . 5 9 0 0 . 1 5 3 0 0 . 2 5 0 0 , 1 7 0 0 . 3 6 0 0 . 3 6 0 0 , 5 1 0 0 . 5 9 0 0 , 1 5 3 0 02 8 0 ANNUAL OPERATING AND MAINTENENCE EXPENSE = ( BATTERY KW C A P A C I T Y / '29 0 1 0 0 0 ) “ MAI NT300 CYCLE L I F E OF BATTERY = 2 0 0 0 310 KW SHAVED OFF PEAK =32 0 BATTERY MWH CA PA CITY = BATTERY KWH CAPAC I T Y / 1 00 0330 BATTERY DIRECT COST = 2 1 1 / ( LOG 1 0 ( DISCHARCE DURATION H R S ) * . 7 5 7 ) , 0 360 BATTERY OISCOUNT FACTOR = 1 . 1 - . 1 * L O C 1 0 ( BATTERY MWH C A P A C I T Y ) , 0 350 BATTERY ACCOUNTING FA CTO R=(INSURANCE R A T E * ( 1"B ATTERY K " (S A L E S T A X) ) 360 ♦CONTIN GENCY RATE)3 7 0 CONVERTER ACCOUNTING FA CTO R=(INS URA NC E RATE• ( 1 "CONVERTER K * '380 (S A L E S T A X ) ) * C 0 N T I N C E N C Y RATE)390 BOP ACCOUNTING FACTOR= ( INSURANCE R A T E * ( 1 * B 0 P K * ( S A L E S T A X ) ) '6 0 0 *C 0 N T IN C E N C Y RATE)6 1 0 BATTERY COST = BATTERY D IRE CT COST "BATTERY ACCOUNTING FACTOR'6 2 0 "BATTERY OISCOUNT FA C TO R ,06 3 0 CONV COST - CONVERTER ACCOUNTING FAC TO R"( CONVERTER BASE C O S T " '6 6 0 XPOWERY( NOMINAL OUTPUT POWER IN M W , '6 5 0 SLOPE OF CONVERTER COST CU RVE))6 6 0 B U 'L D IN C FACTOR = BATTERY MWH CA PA G ' T Y / ( 1 . 3 2 * ’6 7 0 LO C10(O IS CH ARC E DURATION H R S ) * 1 ) . 06 8 0 B U IL D IN G COST = 1 2 7 "XPOWERY ( 8 U I L O I N C FAC TOR. . 7 6 5 ) * 1 0 0 0 . 06 9 0 OC EQUIPMENT COST ̂ 1 7 . 3"XPOWERY(BATTERY MWH CAPACI TY . . 9 6 1 ) * '50 0 XPOWERY( o I SCHARCE DURATI ON H R S . - . 6 7 7 ) • 1 0 0 0 , 051 0 BOP COST - BOP ACCOUNTING F AC T OR • ( BALANCE OF PLANT F I X E D C O S T * '62 0 B U I l 0 1NG COST+OC EQUI PMENT COST J . O53 0 PLANT COST IN M I L L I O N S - (B OP COST " ( B A T T E R Y COST '56 0 "B ATTERY KWH CAPAC I TY ) ♦ ( CONV C O S T " '55 0 BATTERY KW C A P A C I T Y ) ) / 1 0 0 0 0 0 0 . 056 0 ENGI NEERI NG C O S T ^ I f PLANT COST IN M I L L I O N S . C E . . 8 6 THEN'570 ( 188*XPOWERY(PL ANT COST IN M I L L I O N S . '580 p l a n t COST IN M I L L I O N S / - 8 5 7 ) ) * 1 00 0 ELSE 1 6 1 0 0 0 . 0590 BATTERY ANO CONVERTER E F F I C I E N C Y - BATTERY E F F I C I E N C Y " '60 0 ROUND T R I P CONVERTER E T f l C I E N C Y6 1 0 ANN'JAl ENERGY LOST - CYCLE L I F E OF B A T T ER Y " B A T T E R Y KWH CAP AC I T Y " ( 1 - ' 6 2 0 B A I T E RY AND CONVERTER E F F I C I E N C Y ) / '63 0 ANNUAL BATTERY CYCLES6 6 0 ANNUAL 0! h a n d S A VI NG BEFORE TAX = KW SHAVED OFF P E A K * '6 5 0 ON PEAK DEMAND CHARCE* 1 26 6 0 STATI TAX (ANNUAL OEMAND S A V I NG BEFORE TAX'6 7 0 - ANNUAL OPE RAI ING AND MAI NTENENCE E X P E N S E - '6 8 0 (ANNUAL ENERCY L OST* OFF PEAK ENERCY C H A R C E ) ) '6 9 0 " STATE TAX RATE700 FEDERAL t a x - (ANNUAL DEMAND SA V I NG BEFORE T A X - STATE T A X ’710 - ANNUAL OPERATI NG ANO MAI NTENENCE E X P E N S E - '720 (ANNUAL ENERGY LOST" OFF PEAK ENERCY C H A R C E ) ) '7 ) 0 "EE DEPAL TAX RA T E760 ANNUAl DEMAND SAVI NG AT TER TAX ANNUAL DEMANO S A V I N C BEFORE T A X - ' 750 ( STATE TAX ♦ FEDERAL TAX)760 SALVAGf VALUE SALVAGE R A T E * P R f. V I OUS 20 BATTERY DI RECT COST * '

770 BATTERY KWH CAPACITY780 ACRS DEPR( CATECORY.START,BC DEPR COST,ACRS PER PERIOD)790 CATECORY = 5 800 START - 198681 0 BATT AND CONV COST - BATTERY DIRECT COST "BATTERY KWH CAPACITY ♦ '82 0 ( (CONVERTER BASE COST"XPOWERY('830 NOMINAL OUTPUT POWER IN MW.'860 SLOPE OE CONVERTER COST C U R V E ) ) '850 "BATTERY KW C A P A C ITY )860 BC DEPR COS I - ( BA T T E R > OIRECT COS T"BAT TCRY KWH C A P A C I T Y * ) '8 7 0 1-SALVACE R A T E ) ) ♦ ( (CONVERTER BASE COST"XPOWERY( '880 NOMINAL OUTPUT POWER IN M W . '890 SLOPE OF CONVERTER COST CU RVE) ) "BAT TERY KW CAPACITY)900 BOP DEPR = BOP COST/BOP ACCOUNTING FACTOR91 0 ACRS DEPRIBOP CATECORY. S T A R T , BOP DEPR.ACRS BOP)920 BOP CATECORY = 159 3 0 DEPRECIAT IO N TAX S A V IN G - ACRS PER PER IOD"EEOERAL TAX R A T E * '9 6 0 ACRS BOP *E EOERAL TAX RATE9 5 0 OVERALL COST= (PLANT COST IN M I L L I O N S " 1 0 0 0 0 0 0 ) ♦ EN CINE ERINC COST ♦ ' 96 0 (ANNUAL ENERCY L O S T " '97 0 OFF PEAK ENERCY CHARCE) ♦ ( ANNUAL OPERATING AND MAINTENENCE EXPENSE)9 8 0 OVERALL BENEFIT = ANNUAL OEMANO SAVINC AFTER TAX ♦ SALVACE VALUE ♦ ' 99 0 ANNUAL INTERRUPTIBLE LOAO SAVINCS ♦ '1000 D E PR ECIAT IO N TAX SAVINC1010 NET PRESENT WORTH = NPVC(OVERALL BENEF I T , 0 1SCOUNT RATE,OVERALL COST) 1020 AFTER TAX RATE OF RETURN = I R R ( OVERALL B E N E F IT , OVERALL COST)END OF MODEL INPUT: NORECORO

74
APPENDIX C
DESCRIPTION OF VARIABLES IN ECONOMIC MODEL
After Tax Rate of Return: The variable is f a i r l y self-
explanatory. This is the project 's overall rate of return after taxes
have been considered.
Annual Battery Cycles: This variable is an estimate of how many
times the battery w il l be completely cycled in a year. The estimate
is determined by the character, shape and profile factor of the
previous load profi les in which the battery is being considered for
use.
Annual Demand Saving After Tax: This variable is the yearly
demand savings of a battery energy storage system and is corrected for
taxes. The variable is calculated by taking the monthly KW demand
savings for 12 months and multiplying them by the demand rate charged
by the consumer's u t i l i t y . The monthly savings is then annualized and
the federal and state taxes are subtracted from the total savings.
This procedure produces the overall annual profit of a battery energy
system corrected for taxes.
Annual Demand Saving Before Tax: This is the same as the annual
demand saving after tax except that the federal and state taxes are
not subtracted.

75
Annual Energy Lost: This is the yearly energy "measured in KWhr"
that is lost due to the inefficiencies of the battery and converter
design. The energy is estimated by using the estimate for annual
battery cycles and the battery and converter efficiencies.
Annual Interruptible Load Savings: This is the yearly incentive
payment that the u t i l i t y is w i l l ing to make to an industrial customer
i f the customer agrees to reduce their load by a certain amount
whenever the u t i l i t y reaches a peak demand situation. This incentive
payment i s usually expressed in $KW/month but the variable is based on
a annual payment.
Annual Operating and Maintenance Cost: This is the yearly cost of
operating and maintaining all phases of the battery energy storage
system. The figures used for th is variable are the estimates provided
by Bechtel in project 1 275-12 .
Balance of Plant Fixed Cost: This is an estimate of the cost
required to connect a large scale battery energy storage system to a
customer's power distribution system and to provide the control
instrumentation for such a connection.
Batt and Conv Cost: This is the cost of the battery and converter
being used without allowances for taxes and insurance.

76
Battery Accounting Factor: This is the factor which is used to
account for sales tax, insurance and contingency for the battery.
Battery and Converter Efficiency: This is the product of the
battery efficiency and the round trip converter efficiency.
Battery Cost: This is the actual cost of the battery after the
accounting factor has been applied. The cost also includes the
battery discount factor provided by Bechtel.
Battery Direct Cost: This is the base lOMWhr cost of the battery
before the accounting or battery discount factor is applied.
Battery Discount Factor: This factor is used to provide a cost
for a battery lOMWhr and smaller. The factor is a variable dependent
on the energy size of the battery. The factor is multiplied by the
base lOMWhr cost of the battery "battery direct cost" and the result
is the actual cost of the battery.
Battery Efficiency: This is the deep cycle efficiency of the
battery which is provided by the battery manufacturer.
Battery K: The ratio of taxable battery equipment cost to the
battery direct cost.

77
Battery KW Capacity: This i s the amount of power " i n KW" which
can be stored in the battery. This may vary from year to year but
this variable will be the manufacturer's capacity specifications.
Battery KWi Capacity: This i s the amount of energy " in KWr"
which can be stored in the battery. The energy which is stored is not
totally put back into the system because of battery and converter
efficiencies, but the energy used for this variable will be the actual
amount of energy which can be stored in the battery. This is not the
same as the energy which can be released from the battery.
Battery MWH Capacity: This i s the battery KWhr capacity divided
by 1000.
BC Depr Cost: The amount of capital which can be depreciated for
the battery and converter.
BOP Accounting Factor: This is the factor which accounts for
sales tax, insurance rate and contingency for the BOP.
BOP Category: This is the depreciation c la ss which i s used for
the Balance of Plant cost.
BOP Cost: This i s the total Balance of Plant cost corrected for
insurance and sales tax by the accounting factor.

78
Bop Depr: This is the total Balance of Plant cost before it is
multiplied by the accounting factor.
BOP K: The ratio of taxable equipment cost to BOP direct cost.
Building Cost: Dummy variable used to calculate building cost.
Building Factor: This is the building area-related cost.
Category: This is the depreciation class which is used for the
battery and converter cost.
Contingency Rate: This is the "sureness" variable which is
incorporated into the accounting factor. This variable allows for a
margin of error in the ratio of taxable/non-taxable cost. The margin
is then figured into the overall cost for insurance purposes. A
smaller error in the ratio of taxable/non-taxable cost leads to a
smaller contingency rate.
Conv Cost: This is the total cost of a 1MW converter which has
been adjusted by the accounting factor.
Converter Accounting Factor: This is the factor which accounts
for the sales tax, insurance rate and the contingency for the
converter.

79
Converter Base Cost: This is the base cost for the 1 MW converter.
Converter K: The rat io of converter equipment cost to the
converter direct cost.
Cycle Life of Battery: This is the number of complete deep
battery cycles which the battery manufacturer guarantees the battery
will operate within distortion, harmonic and a l l engineering
specif ica t ions.
DC Equipment Cost: This is the Balance of Plant cost for the dc
bus and the switching equipment.
Depreciation Tax Savings: This is the annual tax savings using
the MACRS depreciation allowances.
Discharge Duration Hrs: This i s the amount of time, in hrs,
during which the battery will be expected to discharge energy at a
given rate.
Discount Rate: The Marginal Attractive Rate of Return of the
company in which battery energy storage is being considered.
Engineering Cost: The total cost of the engineering for the
battery energy storage project including battery, converter and
balance o f plant.

80
Federal Tax: The annual amount of federal tax which is owed due
to the savings of the BES system.
Federal Tax Rate: The highest tax level for corporations.
Inflation Rate: The average expected inflation rate for the next
20 years.
Insurance Rate: The percentage rate used to calculate the
insurance cost of the project. This rate is merely for l i a b i l i t y and
equipment replacement and was provided to Bechtel in project 1275-12.
KW Shaved Off Peak: The total amount of power demand, in KW,
which is shaved off the peak demand of the industrial profi le being
considered.
Maint: Dummy variable for maintenance purposes.
Net Present Worth: The net present value of the battery energy
storage project as applied to a given load profile.
Nominal Output Power in MW: The manufacturer's specification for
the output power of a battery in MW.

81
Off Peak Energy Charge: The energy cost, in $/KWhr, of the
u t i l i ty which serves the industry to which the BES system is being
applied.
On Peak Demand Charge: The power demand cost, in $/KW, o f the
u t i l i ty which serves the industry to which the BES system is being
appl ied .
Overall Benefit: The annual capital savings provided by the BES
system. These savings are after tax and include peak demand and
depreciation tax savings.
Overall Cost: The annual cap ita l expenditures of the BES system.
Plant Cost in M i l l ions: Combined cost of the battery, converter
and balance of plant. This includes the accounting factor and is
given in millions.
Round Trip Converter Efficiency: The overall efficiency of ac-dc
converter given the conversion from ac to dc and then back to ac.
Sa les Tax: The applicable sa le s tax or user rate in the area in
which the BES system is to be used.

82
Salvage rate: The percent of the battery direct cost which can be
recovered from the battery after the cycle l i fe of the battery. This
rate comes from the lead in the battery.
Salvage value: The salvage rate multiplied by the battery direct
cost.

83
APPENDIX D
EXAMPLE OF COMPUTER MODEL OUTPUT
MODEL THESIS REAOY TOR E D I T , LAST L IN E IS 1020 INPUT: SOLVEMODEL THESIS VERSION Or 0 9 / 2 3 / 8 7 2 0 : 6 5 - - 21 COLUMNS 6 2 VAR IABLCSENTER SOLVE OPTIONS INPUT: ALL
198 6 1987 1988 198 9 1990 199 1
BALANCE OE PLANT F IX E D C 2 8 6 0 0 0 0 0 0 0BAT TERY KW CAPAC 1 TY 6 0 0 600 60 0 6 0 0 500 5 0 0CONVERTER BASE COST 2 6 0 0 0 0 0 0SALVACE RATE . 1 1 0 0 . 1 100 . 1 100 . 1 1 0 0 . 1100 . 1 100INFLAT ION RATE . 0 9 6 0 .0*460 . 0U60 .0*450 .0*450 . 0 6 50DISCOUNT RATE . 0 8 0 0 .0 8 0 0 . 0 8 0 0 . 0 8 0 0 . 0 8 0 0 . 0 8 0 0CONTINGENCY RATE . 0 6 0 0 .0 6 0 0 . 0 6 0 0 . 0 5 0 0 . 0 5 0 0 . 0 6 0 0SALES TAX . 0 6 6 0 .0 6 6 0 . 0 6 6 0 . 0 5 5 0 . 0 5 5 0 . 0 5 6 0BATTERY K . 8 0 0 0 .8 0 0 0 . 8 0 0 0 . 8 0 0 0 . 800 0 . 8 0 0 0CONVERTER K . 9 6 0 0 .9 6 0 0 . 9 6 0 0 . 9 5 0 0 .9 5 0 0 . 9 5 0 0BOP K . 6 0 0 0 .*4000 .*4000 *4000 . *4000 . 6 0 0 0INSURANCE RATE 1 . 0 7 0 1 . 0 7 0 1 . 0 7 0 1 . 0 7 0 1 .0 7 0 1 . 0 7 0FEDERAL TAX RATE . 3 9 0 0 . 3*400 . 3*400 . 3*400 . 3 ** 00 . 3 60 0STATE TAX RATE . 0 6 0 0 .0 6 0 0 . 0 5 0 0 . 0 5 0 0 . 0 5 0 0 . 0 5 0 0ON PEAK DEMAND CHARCE 16 1 6 .6 8 1 6 . 3 8 1 7 . 1 2 1 7 . 8 9 1 8 . 6 9OFF PEAK ENERCY CHARCE . 0 2 0 0 .0 2 0 9 . 0 2 1 8 . 0 2 2 8 .0 2 3 9 . 0 2 6 9DISCHARCE OURATION HRS 3 3 3 3 3 3BATTERY KWH CAPACITY 1600 1600 1500 1500 1500 150 0NOMINAL OUTPUT POWER IN . 6 0 0 0 .5 0 0 0 . 5 0 0 0 . 5 0 0 0 . 5000 . 5 0 0 0SLOPE OF CONVERTER COST - . 3 2 0 0 - . 3 2 0 0 - . 3 2 0 0 - . 3 2 0 0 - . 3 2 0 0 - . 3 2 0 0ANNUAL BATTERY CYCLES 100 100 100 100 100 100ANNUAL INTERRUPTIBLE LOA 0 0 0 0 0 0BATTERY E F F 1C 1ENCY . 8 0 0 0 .8 0 0 0 . 8 0 0 0 . 8 0 0 0 .8 0 0 0 . 8 0 0 0ROUNO TRIP CONVERTER EFF . 8*46*4 . 8*46*4 . 8*46*4 .8*46*4 . 8*46*4 . 8 6 6 6MAI NT 170 0 3600 3 6 0 0 5 1 0 0 5900 15300ANNUAL OPERATING AND MAI 8 6 0 1800 1800 2 5 5 0 2950 7 6 5 0CYCLE L I F E OF BATTERY 2 0 0 0 200 0 2 0 0 0 2 0 0 0 2000 2 0 0 0KW SHAVEO OFF PEAK *400 *400 *400 *400 *400 >400BATTERY MWH CAPACITY 1 . 6 0 0 1 .5 0 0 1 . 5 0 0 1 . 5 0 0 1 . 5 0 0 1 . 5 0 0BATTERY OIRECT COST 1 7 1 . 0 0 0 0 0 0BATTERY OISCOUNT FACTOR 1 . 0 8 2 0 0 0 0 0BATTERY ACCOUNTING FACTO 1 . 167 1 . 167 1 . 167 1 . 167 1 . 167 1 . 167CONVERTER ACCOUNTING FAC 1 . 1 7 6 1 .1 7 6 1 . 1 7 6 1 . 1 7 6 1 . 1 7 6 1 . 1 7 6BOP ACCOUNTING FACTOR 1 . 1*4*4 1 . 1*4*4 1 . 1*4*4 1 . 1*4*4 1 . 1*4*4 1 . 1 6 6BATTERY COST 2 1 6 . 0 0 0 0 0 0CONV COST 3 6 2 . 3 0 0 0 0 0B U IL D IN C FACTOR .920*4 0 0 0 0 0B U IL O IN C COST 1 1 9 1 8 8 0 0 0 0 0DC EQUIPMENT COST 120*4 3 0 0 0 0 0BOP COST 182 7 7 3 0 0 0 0 0PLANT COST IN M IL L IO N S . 6 8 2 9 0 0 0 0 0ENCINEERINC COST 1 6 1 0 0 0 0 0 0 0 0BATTERY AND CONVERTER EF . 6 7 7 1 .6 7 7 1 .6 7 7 1 . 6 7 7 1 .6 7 7 1 . 6 7 / 1ANNUAL ENERCY LOST 9 6 8 6 9 68 6 9 6 8 6 9 6 8 6 9686 9 6 8 6ANNUAL DEMAND SAVING BEF 7 2 0 0 0 752UO 78 6 2 6 82 16*4 8 5 8 6 1 8 9 7 2 5s ta : e TAX 36*48 3662 383 1 3 9 7 0 *4 1 3*4 6 0 9 2FEDERAL TAX 2 2 9 19 2 3 6 6 6 2*47*46 256*4*4 26 7 0 6 2 6 6 3 2ANNUAL DEMANO SAVI NG A f T *4663 3 *47922 500*49 5 2 5 5 0 5 50 22 5 9 2 0 1SAl VACE VALUE 0 0 0 0 0 0ACRS PER PFRl OD 6 6 7 0 7 83 170 79 3 9 0 79 390 79390 *)CATECORY 6 6 5 6 5 5START 198 6 1986 1986 198 6 1986 1986BATT AND CONV COST *406267 0 0 0 0 0BC DEPR COST 3 780*4 7 0 0 0 0 0BOP DEPR 16983 1 0 0 0 0 0ACRS BOP 799 2 16983 1*4385 127 86 11188 11188BOP CATECORY 16 16 15 15 15 15DEPRECI ATI ON TAX SAVI NG 2 199 8 3 3 7 12 3 1883 3 1 3*40 30797 3806OVERALL COST 8*4*493*4 2002 2 0 12 2 7 7 1 3181 789 1OVERALL BENEFI T 6 7 6 3 1 8 1636 8 1 9 3 2 8 3 8 9 0 858 18 6 3 0 0 5NET PRESENT WORTH - 7 82*406 - 7 1 *427 1 - 6 5 0 9 5 5 - 5 9 1*493 -536*425 - 5 0 1 0 9 2AT TER TAX RATE OF RETURN
199 2 1993 199*4 1996 1996 199 7
BALANCE OF PLANT f I XLD C 0 0 0 0 0 0BATTERY KW CAPACI TY 6 0 0 600 50 0 50 0 500 5 0 0CONVERTER BASE COST 0 0 0 0 0 0SALVACE RATE . 1 100 . 1 100 . 1 100 . 1 1 0 0 . 1 100 . 1 100i n f l a t i o n r a t e .0*460 . 0*460 .0*450 .0*450 .0*450 . 0 6 5 0OISCOUNT RATE . 0 8 0 0 .0 8 0 0 . 0 8 0 0 . 0 8 0 0 . 0800 . 0 8 0 0

84
CONTINGENCY RATE SALES TAX BATTERY K CONVERTER K BOP KINSURANCE RATEf e d e r a l t a x RATESTATE TAX RATE ON PEAK DEMAND CHARCE Of E PEAK ENERCY CHARCE 0 ISCHARCE OURATI ON HRS BATTERY KWH CAPACITY NOMINAL OUTPUT POWER IN SLOPE Of CONVERTER COST ANNUAL BATTERY CYCLES ANNUAL INTERRUPTIBLE LOA BATTERY E F f I C I E N C Y ROUND TRIP CONVERTER EFF MAI NTANNUAL OPERATINC ANO MAI CYCLE L I F E OF BATTERY KW SHAVED OFF PEAK BATTERY MWH CAPACITY BATTERY DIRECT COST BATTERY OISCOUNT FACTOR BATTERY ACCOUNTING FACTO CONVERTER ACCOUNTING FAC BOP ACCOUNTING FACTOR BATTERY COST CONV COST B U IL D IN G FACTOR 8 U IL D IN C COST DC EQUIPMENT COST BOP COSTPLANT COST IN M IL L IO N S EN CINE ERINC COST BATTERY ANO CONVERTER EF ANNUAL ENERCY LOST ANNUAL DEMAND S A VINC BEF STATE TAX FEOERAL TAXANNUAL DEMANO SA VINC AFTSALVACE VALUEACRS PER PER IOOCATECORYSTARTBATT ANO CONV COST8C OEPR COSTBOP OEPRACRS BOPBOP CATECORYDEPR ECIAT IO N TAX S A V IN COVERALL COSTOVERALL B E NE FITNET PRESENT WORTHAFTER TAX RATE Of RETURN
BALANCE Of PLANT F I X E O CBATTERY KW CAPACI TYCONVERTER BASE COSTSALVACE RATEI NF L A T I O N RATEDISCOUNT RATECONTINCENCY RATESALES TAXBATTERY KCONVERTER KBOP KINSURANCE RATE FEDERAL TAX RATE STATE TAX RATE ON PEAK OEMANO CHARCE O f f PEAK ENERCY CHARCE OlSCHARCE DURATION HRS BATTERY KWH CA PA CI TY NOMINAL OUTPUT POWER IN SLOPE OF CONVERTER COST
. 0 5 0 0 . 0 5 0 0 . 0 5 0 0
. 0 5 5 0 . 0 5 5 0 . 0 5 5 0
. 8 0 0 0 . 8 0 0 0 . 8 0 0 0
. 9 5 0 0 . 9 5 0 0 . 9 5 0 0
.*4000 . 9 0 0 0 . 9 0 0 0T . 0 7 0 1 . 0 7 0 1 . 0 7 0. 3 9 0 0 . 3 9 0 0 . 3 9 0 0. 0 5 0 0 . 0 5 0 0 . 0 5 0 01 9 . 5 3 2 0 . 9 1 2 1 . 3 3. 0 2 6 0 . 0 2 7 2 . 0 2 8 9
3 3 31500 1500 1500
. 5 0 0 0 . 5 0 0 0 . 5 0 0 0- . 3 2 0 0 - . 3 2 0 0 - . 3 2 0 0
TOO 100 1000 0 0
. 8 0 0 0 . 8 0 0 0 . 8 0 0 0
. 8 9 6 9 . 8 9 6 9 . 8 9 6 92 5 0 0 1700 3 6 0 0125 0 8 5 0 1 8 0 02 0 0 0 2 0 0 0 2 0 0 0
9 0 0 9 0 0 9 0 0T . 5 0 0 1 . 5 0 0 1 . 5 0 0
0 0 00 0 0
1 . T67 1. 167 1 . 1671. 176 1 . 1 7 6 1 . 1 7 61 . 199 1 . 1 9 9 1 . 1 9 9
0 0 00 0 00 0 00 0 00 0 00 0 00 0 00 0 0
. 6 7 7 1 . 6 7 7 1 . 6 7 7 19 6 8 6 9 6 8 6 9 6 8 6
9 3 7 6 3 9 7 9 8 2 1 0 2 3 9 1U613 9 8 9 3 5 0 1 6
2 9 8 0 0 3 1 2 8 8 3 2 9 0 25 9 3 5 0 6 1 8 5 0 6 9 9 7 3
0 0 00 0 05 5 5
1986 198 6 1 98 60 0 00 0 00 0 0
9 5 9 0 9 5 9 0 9 5 9 015 15 15
3261 3261 3 2 6 11502 111 9 2 0 7 6
6 2 6 10 6 5 1 1 1 6 8 2 3 9- 9 6 5 5 0 6 - 9 3 0 9 7 8 - 3 9 7 9 6 6
1998 1999 2 0 0 0
0 0 05 0 0 5 0 0 5 0 0
0 0 0. 1 100 . 1 100 . 1 1 0 00 9 5 0 . 0 9 5 0 . 0 9 5 0
. 0 8 0 0 . 0 8 0 0 . 0 8 0 0
. 0 5 0 0 . 0 5 0 0 . 0 5 0 0
. 0 5 5 0 . 0 5 5 0 . 0 5 5 0
. 8 0 0 0 . 8 0 0 0 . 8 0 0 0
. 9 5 0 0 . 9 5 0 0 . 9 5 0 0
. 9 0 0 0 . 9 0 0 0 . 9 0 0 01 . 0 7 0 1 . 0 7 0 1 . 0 7 0. 3 9 0 0 . 3 9 0 0 . 3 9 0 0. 0 5 0 0 . 0 5 0 0 . 0 5 0 02 5 . 9 9 2 6 . 5 8 2 7 . 7 8. 0 3 3 9 . 0 3 5 9 . 0 3 7 0
3 3 31500 150 0 1 50 0
. 5 0 0 0 . 5 0 0 0 . 5 0 0 0- . 3 2 0 0 - . 3 2 0 0 - . 3 2 0 0
.0 50 0 .0500 . 0 5 0 0
.0 550 .0550 . 0 5 5 0
.8 000 .8000 . 8 0 0 0
.9 50 0 .9 500 . 9 5 0 0
. 9000 . 9000 . 9 0 0 01 .070 1.070 1 . 0 7 0. 3900 . 3900 . 39 0 0.0 500 .0500 . 0 5 0 02 2 . 2 9 2 3 . 2 9 2 9 . 3 9.0297 .0311 .0 3 2 5
3 3 31500 1500 1500
.5 000 .5000 . 50 0 0- . 3 2 0 0 - . 3 2 0 0 - . 3 2 0 0
100 100 1000 0 0
. 8000 .8 000 . 8 0 0 0
.8969 .8969 . 8 9 6 93600 5100 5 9 0 01800 2550 2 9 5 02000 2000 2 0 0 0
900 900 90 01 .500 1.500 1 . 5 0 0
0 0 00 0 0
1 . 167 1 . 167 1 . 1671 .176 1.176 1 . 1 7 61.199 1.199 1 . 1 9 9
0 0 00 0 00 0 00 0 00 0 00 0 00 0 00 0 0
.6771 .6771 .6 7 7 19686 9686 9 6 8 6
106999 111819 1 168955296 5998 56 7 9
3 3886 35195 36 6 8 767867 71171 7 9 9 8 0
0 0 00 0 05 5 5
1986 1986 19860 0 00 0 00 0 0
9590 9590 9 5 9 015 15 15
3261 326 1 32612088 2851 3269
7 1 128 7993 1 77 79 0- 366069 -3 3 5 9 6 3 -3 0 5 9 9 1
.0 0 1 9
200 1 2002 2003
0 0 0500 500 500
0 0 0.1 100 . 1 100 . 1 1 0 0. 0950 .0950 . 0 9 5 0. 0800 .0800 . 0 8 0 0.0500 .0500 . 0 5 0 0.0 550 .0550 . 0 5 5 0. 8000 .8000 . 8 0 0 0. 9500 .9500 . 9 5 0 0. 9000 .9000 . 9 0 0 01 .070 1.070 1 . 0 7 0. 3900 . 3900 . 3900.0 50 0 .0500 . 0 5 0 02 9 . 0 3 30 .39 3 1 . 7 0.0 387 .0909 . 09 23
3 3 31500 1500 1500
.5000 .5000 . 50 00- . 3 2 0 0 - . 3 2 0 0 - . 3 2 0 0

85
ANNUAL BATTERY CYCLES ANNUAL INTERRUPTIBLE LOA BATTERY E r f l C I C N C Y ROUND TR IP CONVERTER EFF MAI NTANNUAL OPERATING ANO MAI CYCLE L I T E OF BATTERY KW SHAVED OFF PEAK BATTERY MWH CAPACITY BATTERY DIRECT COST BATTERY DISCOUNT FACTOR BATTERY ACCOUNTING FACTO CONVERTER ACCOUNTING FAC BOP ACCOUNTING FACTOR BATTERY COST CONV COST B U IL D IN G FACTOR B U IL O IN C COST OC EQUIPMENT COST BOP COSTPLANT COST IN M ILL IO N S ENCINEERINC COST BATTERY ANO CONVERTER EF ANNUAL CNERCY LOST ANNUAL DEMANO SAVING BEE STATE TAX FEDERAL TAXANNUAL DEMANO SAVING AFTSALVACE VALUEACRS PER PERIODCATECORYSTARTBATT ANO CONV COST8C OEPR COSTBOP OEPRACRS BOPBOP CATECORYDEPRECIATIO N TAX SAVINGOVERALL COSTOVERALL BENEFITNET PRESENT WORTHAFTER TAX RATE OF RETURN
BALANCE OF PLANT FIXED C BATTERY KW CAPACITY CONVERTER BASE COST SALVAGE RATE INFLA TION RATE
DISCOUNT RATE CONTINGENCY RATE SALES TAX BATTERY K CONVERTER K BOP KINSURANCE RATE FEOCRAL TAX RATE STATE TAX RAfE ON PEAK DEMAND CHARGE OFF PEAK ENERCY CHARGE DISCHARGE OUR A T ION HRS BATTERY KWH CAPACI TY NOMINAL OUTPUT POWER IN SLOPE OF CONVERTER COST ANNUAL BATTERY CYCLES ANNUAL I NTERRUPTI BLE LOA BATTERY EF F I C I ENCY ROUND TRI P CONVERTER EFF MA I NTANNUAL OPFRATI NC AND MAI CYCLE L I F E OF BATTERY KW SHAVED OFF PEAK BATTERY MWH CAPACI TY BATTERY OIRECT COST BATTERY OISCOUNT FACTOR BATTERY ACCOUNTING FACTO CONVERTER ACCOUNTING FAC b o p a c c o u n t i n g f a c t o r
100 100 1000 0 0
. 8 0 0 0 . 8 0 0 0 . 8 0 0 0
. 8 L 6 L . 8 L6 L . 8 L6 LIS 300 2 5 0 0 1 700
7650 1250 8502 0 0 0 2 0 0 0 2 0 0 0
LOO LOO LOO1 . 5 0 0 1 . 500 1 . 5 0 0
0 0 00 0 0
1 . 167 1 . 167 1 . 1671 . 1 7 6 1 . 1 7 6 1 . 1 7 61 . I LL 1 . I LL 1 . I LL
0 0 00 0 00 0 00 0 00 0 00 0 00 0 00 0 0
. 6 7 7 1 . 6 7 7 1 . 6 7 7 19 6 8 6 9 6 8 6 9 6 8 6
122103 127598 133 3 L 05 70 6 6 3 0 0 6 6 0 7
36862 L 0 7 0 0 L 2 6 7 87 95 35 8 0 5 9 8 8 L 0 5 5
0 0 00 0 05 5 5
1986 1986 19860 0 00 0 00 0 0
9 5 9 0 9 5 9 0 9 5 9 015 15 15
3261 3261 32617979 1593 1209
8 2 7 9 5 8 3 8 5 9 8 7 3 1 6- 2 7 8 7 1 6 - 2 5 0 7 5 1 - 2 2 3 6 3 7
. 0 1 3 6 . 0 2 L 6 . 0 3 3 9
2 0 0 L 2 0 0 5 2 0 0 6
0 0 0500 500 500
0 0 0. 1100 . 1 IOC . 1 100. CL50 . OL50 . 0 L 5 0. 0 8 0 0 . 0 8 0 0 . 0 8 0 0. 0 5 0 0 . 0 5 0 0 . 0 5 0 0. 0 5 5 0 . 0 5 5 0 . 0 5 5 0. 8 0 0 0 . 8 0 0 0 . 8 0 0 0. 9 5 0 0 . 95 0 0 . 9 5 0 0. L 0 0 0 . L 00 0 . LOOO1 . 0 7 0 1 . 0 7 0 1 . 0 7 0. 3LOO . 3L00 . 3 LOO. 0 5 0 0 . 0 5 0 0 . 0 5 0 03 3 . 1 3 3L . 62 36 . 18. 0 L L 2 . 0 L 6 2 . 0 L 8 2
3 3 31500 1500 1500
. 5 00 0 . 5 00 0 . 5 0 0 0- . 3 2 0 0 - . 3 2 0 0 - . 3 2 0 0
100 100 1000 0 0
. 8 0 0 0 . 8 0 0 0 . 8 0 0 0
. 8 L6 L . 8 L6 L . 8 L 6 L5900 15300 153002 9 5 0 7650 76502 00 0 2 0 0 0 2 0 0 0
LOO LOO LOO1 . 500 1 . 500 1 . 500
0 0 00 0 0
1 . 1 6 7 1 . 167 1 . 1671 . 1 7 6 1 . 1 7 6 1 . 1 7 61 . I LL 1 . I LL 1 . I LL
100 100 1000 0 0
.8 000 .8 000 .8000
. 8L6 L . 8L6L . 8L6L3600 3600 51001800 1800 25502000 2000 2000
LOO LOO LOO1 . 500 1 .500 1.500
0 0 00 0 0
1 . 167 1.167 1 . 1671 .176 1.176 1.1761 . I L L 1 . I L L 1 . ILL
0 0 00 0 00 0 00 0 00 0 00 0 00 0 00 0 0
.677 1 .6771 .677 19686 9686 9686
1393LO 1 L 5 6 1 1 1521636858 7171 7L60
LL 30 L L 63 2L L819388 1 78 92 1 15 96510
0 0 00 0 05 5 5
1986 1986 19860 0 00 0 00 0 00 0 0
15 15 150 0 0
21 75 2192 295988178 92115 96510
- 19858L - 17L328 - 150976.OL 15 . 0L82 .0539

BATTERY COST 0 0CONV COST 0 0B U I I O IN C FACTOR 0 0B U I I O IN C COST 0 0OC EQUIPMENT COST 0 0BOP COST 0 0PLANT COST IN M IL L IO N S 0 0ENCINEERINC COST 0 0BATTERY ANO CONVERTER Ef . 6 7 7 1 .6 7 7 1ANNUAL ENERCY LOST 9 6 8 6 9 68 6ANNUAL DEMANO S A V 1NC BEE 1 5 9 0 1 0 166 166STATE TAX 7782 7903FEDERAL TAX 5 0 2 6 9 5 1066ANNUAL DEMAND SAVINC AFT 1 0 0 960 107206SALVACE VALUE 0 0ACRS PER PERlOO 0 0CATECORY 5 5START 1986 1986BAT T ANO CONV COST 0 0BC OEPR COST 0 0BOP DEPR 0 0ACRS BOP 0 0BOP CATECORY 15 15DEPRECIATION TAX SAVINC 0 0OVERALL COST 3 37 8 6 09 7OVERALL BENEFIT 1 0 0 9 6 0 107206NET PRESENT WORTH - 126U28 - 107 303AFTER TAX RATE OF RETURN . 0 5 8 9 . 0 6 3 2
ENTER SOLVE OPTIONS INPUT: NORECORD
8 6
00000000
.677 19 6 8 6
1 73614 3627663*465
1 119022 8 2 10
051986
0000
1506117
1U01 12- 6 1 2 1 1
. 0 6 8 0

APPENDIX E
MODEL AND OUTPUT FOR CASE NUMBER ONE
MOOEL T H E S IS REAOY TOR E D I T . LAST L I N E IS 1 0 2 0 IN P U T : L I S T 1MOOEL T H E S IS VERSIO N OF 0 9 / 2 3 / 8 7 1 5 : 5 810 COLUMNS 1 9 8 6 - 2 0 0 62 0 BALANCE OF PLANT F I X E D COST - 2 8 6 0 0 , 030 BATTERY KW C A P A C IT Y = 1 00 01*0 CONVERTER BASE COST= 2 6 0 . 05 0 SALVACE RATE = .1 16 0 IN F L A T I O N RATE = . 0 6 570 OISCOUNT RATE = . 0 88 0 CO NTIN GENCY RATE = . 0 59 0 SALES TAX = . 0 5 5100 BATTERY K = . 81 10 CONVERTER K = . 9 5120 BOP K = . 6130 INSURANCE RATE = 1 . 0 7160 FEDERAL TAX RATE = . 3 6150 STATE TAX RATE * . 0 5160 ON PEAK OEMAND CHARCE = 1 3 . 6 9 . PREV IO U S * ( 1 ♦ INFLAT I ON RATE)170 OFF PEAK ENERCY CHARCE = . 0 1 2 6 5 . P R E V I O U S * ( 1 ♦ IN F L A T I ON RATE)180 DISCHARGE DURATION HRS = 2190 BATTERY KWH C A P A C IT Y = 2 0 0 02 0 0 NOMINAL OUTPUT POWER IN MW = 1 . 02 1 0 SLOPE Of CONVERTER COST CURVE = - . 3 22 2 0 ANNUAL BATTERY CYCLES = 1002 3 0 ANNUAL IN T E R R U P T IB L E LOAD SA V IN C S = 02 6 0 BATTERY E F F I C I E N C Y = . 82 5 0 ROUNO TR IP CONVERTER E F F I C I E N C Y = . 9 2 * . 9 22 6 0 M A IN T = 1 7 0 0 . 3 6 0 0 . 3 6 0 0 . 5 1 0 0 . 5 9 0 0 . 1 5 3 0 0 , 2 5 0 0 , 1 7 0 0 . 3 6 0 0 . 3 6 0 0 . '2 7 0 5 1 0 0 . 5 9 0 0 . 1 5 3 0 0 2 5 0 0 . 1 7 0 0 . 3 6 0 0 . 3 6 0 0 . 5 1 0 0 . 5 9 0 0 . 1 5 3 0 02 8 0 ANNUAL OPERATING ANO M AINTENENCE EXPENSE = ( BATTERY KW C A P A C I T Y / '2 9 0 1 0 0 0 ) *MAIN T3 0 0 CYCLE L I F E OF BATTERY = 2 0 0 0 3 1 0 KW SHAVED OFF PEAK = 10003 2 0 BATTERY MWH C A P A C IT Y * BATTERY KWH C A P A C I T Y / 10003 3 0 BATTERY O IR E C T COST = 2 1 1 / ( L O C 1 0 ( 0 ISCHARCE DURATION M R S ) * . 757 ) . 0 3 6 0 BATTERY OISCOUNT FACTOR * 1 . 1 - . 1 * L O C 1 0 ( BATTERY MWH C A P A C I T Y ) , 03 5 0 BATTERY ACCOUNTING FAC TOR = ( INSURANCE R A T E * ( 1 *BATTERY K * ( S \ L E S T A X ) ) 3 6 0 *CO N TIN C EN C Y RATE)3 7 0 CONVERTER ACCOUNTING FACTOR = ( INSURANCE RA TE• ( 1 *CONVERTER K * '3 8 0 (S A L E S T A X ) ) *CONTINCENCY RATE)3 9 0 BOP ACCOUNTING FACTOR= ( INSURANCE RATE“ ( l * B O P K * (S A L E S T A X ) ) '6 0 0 *C O N T IN C E N C Y RATE)6 1 0 BATTERY COST = BATTERY O IR E C T COST ‘ BATTERY ACCOUNTING FACTOR'6 2 0 ‘ BATTERY O ISCOUNT FA CTO R. 06 3 0 CONV COST * CONVERTER ACCOUNTING F A C T O R * ( CONVERTER BASE C O S T * '6 6 0 XPOWERY(NOMINAL OUTPUT POWER IN M W,'6 5 0 SLOPE OF CONVERTER COST C U R V E ) )6 6 0 8 U I L D I N C FACTOR = BATTERY MWH CAPAC I T Y / ( 1 . 3 2 * '6 7 0 L O C IO IO IS C M A R C E DURATION H R S ) * 1 ) , 06 8 0 B U I L D I N C COST = 1 2 7 "XPOWERY( B U IL O I N C F A C T O R . . 7 6 5 ) * 1 0 0 0 . 06 9 0 OC EQUIPMENT COST = I 7 . 3 "XPOWERY( BAT TERY MWH C A P A C IT Y . . 9 6 1 ) • '5 0 0 XPOWERY! 01 SCHARCE O'JRATION HRS. - . 6 7 7 ) * 1 0 0 0 . C5 1 0 BOP COST = BOP ACCOUNTING FAC TOR• ( BALANCE OF PLANT F I X E D COST*6 2 0 B U IL O I N C COS T *0 C EQUIPMENT C O S T ) , 05 3 0 PLANT COST IN M IL L IO N S - ( BOP COST ♦ ( BAT T £ RY COST'^ 6 0 ‘ BATTERY KWH C A P A C I T Y ) * (C O N V C O S T * '5 5 0 8 A IT E R Y KW C A P A C I T Y ) ) / 1 0 0 0 0 0 0 . 05 6 0 E N C IN E E R IN C C O S T = IF PLANT COST IN M IL L IO N S . C E . .8 6 TH EN’5 7 0 ( 1 8 8 *X P 0 W E R Y (P L A N T COST IN M I L L I O N S , '5 8 0 PLANT COST IN M I L L I O N S / - 8 5 7 ) ) * 1000 ELSE 1 6 1 0 0 0 . 05 9 0 BATTERY ANO CONVERTER E F F I C I E N C Y = BATTERY E F F I C I E N C Y * ’6 0 0 ROUNO TR IP CONVERTER E F F IC IE N C Y6 1 0 ANNUAL ENERCY LOST = CYCLE L I F E OF BATTERY*BAT TERY KWH C A P A C I T Y * ( 1 - 6 2 0 BATTERY AND CONVERTER EFF I C IE N C Y ) / '6 3 0 ANNUAL BATTERY CYCLES6 6 0 ANNUAL DEMANO S A V I NC BEf ORE TAX = KW SHAVED OFF PE A K * '6 5 0 ON PEAK OEMANO CHARCE*126 6 0 STATE TAX - ( ANNUAL DEMAND S A V I N C BEf ORE TAX'6 7 0 - a n n u a l OPERATI NG ANO MAI NTENENCE EXPENSE - '6 8 0 (ANNUAL ENERCY LOST* OFF PEAK ENERCY C H A R C E ) ) '6 9 0 ‘ STATE TAX RATE7 0 0 FEDERAL TAX = ( ANNUAL DEMAND S A V I NC 6E F0RE TAX- STATE TAX'7 1 0 -ANNUAL O PER A TIN C ANO MAINTENENCE E X P E N S E - '7 2 0 (ANNUAL ENERCY L O S T ‘ OFF PEAK ENERCY C H A R G E ) ) '7 3 0 ‘ FEDERAL Ta x RATE7 6 0 ANNUAL DEMAND S A V I NC Af TER TAX - ANNUAL DEMANO SAVI NC BEFORE T A X - ' 7 5 0 ( STATE TAX ♦ FEDERAL TAX)7 6 0 SALVACE VALUE = SALVACE R A 1E " P R E V IOUS 2 0 BATTERY DI RECT COST • '

7 7 0 BATTERY KWH CAPACITY7 8 0 ACRS D E P R (C A TE C O R Y .S T A R T .B C OEPR COST.ACRS PER PERIOO)7 9 0 CATECORY = 5 8 0 0 START = 19868 1 0 BATT AND CONV COST = BATTERY D IRE CT COST ‘ BATTERY KWH CAPACITY ♦ '8 2 0 ( (CONVERTER BASE COST‘ XPOWERY( '8 3 0 NOMINAL OUTPUT POWER IN M W , '8 6 0 SLOPE OE CONVERTER COST C U R V E ) ) '8 5 0 ‘ BATTERY KW C A P A C IT Y )8 6 0 BC OEPR COST ^ (BA TTE RY OIRECT COST‘ BATTERY KWH C A P A C IT Y ‘ ( '8 7 0 1-SALVACE R A T E ) ) ♦ ( (CONVERTER BASE COS T‘ XPOWERY( ’8 8 0 NOMINAL OUTPUT POWER IN M W ,'8 9 0 SLOPE OF CONVERTER COST CU R V E ) ) ‘ BATTERY KW CA P A C ITY )9 0 0 BOP OEPR = BOP COST/BOP ACCOUNTING FACTOR 9 1 0 ACRS OE PR( BOP CATECORY, S T A R T , BOP DEPR,A CRS BOP)9 2 0 BOP CATECORY r 159 3 0 DE P R E C IA T IO N TAX SA VING ^ ACRS PER PER 10D*FEOERAL TAX R A T E * '9 6 0 ACRS BOP‘ FEDERAL Ta x RATE9 5 0 OVERALL COS T- (PLANT COST IN M ILL IONS* 1 0 0 0 0 0 0 ) ♦ EN CINE ERINC COST ♦ ' 9 6 0 (ANNUAL ENERCY L O S T * ’9 7 0 O f f PEAK ENERCY CHARCE) ♦ ( ANNUAL OPERATING AND MAINTENENCE EXPENSE)9 8 0 OVERALL B E N C FIT r ANNUAL DEMANO S A V IN C AFTER TAX ♦ SALVACE VALUE ♦ ' 9 9 0 ANNUAL INTE R R U P TIB L E LOAO S A V IN C S ♦ '1 0 0 0 D E P R E C IA T IO N TAX S A VINC1 0 1 0 NET PRESENT WORTH = NPVC(0VERALL BENEF I T . 0 ISCOUNT RATE.OVERALL COST) 1 0 2 0 AFTER TAX RATE OF RETURN = I R R ( OVERALL BENEF I T , OVERALL COST)ENO OF MOOEL INPU T: NORECORD

89
MODEL THESI S READY TOR ED I NPUT: SOLVEMODEL THESI S VERSION OE ENTER SOLVE OPT IONS INPUT: ALL
BALANCE OF PLANT F I XED CBATTERY KW CAPACITYCONVERTER BASE COSTSALVACE RATEI NFLATI ON RATEDISCOUNT RATECONTINCENCY RATESALES TAXBATTERY KCONVERTER KBOP KINSURANCE RATE FEOERAL TAX RATE STATE TAX RATE ON PEAK DEMAND CHARCE OFF PEAK ENERCY CHARCE 0 ISCHARCE OURATI ON HRS BATTERY KWH CAPACITY NOMINAL OUTPUT POWER IN SLOPE OF CONVERTER COST ANNUAL BATTERY CYCLES ANNUAL I NTERRUPTIBLE LOA BATTERY EFF 1C IENCY ROUNO TRIP CONVERTER EFF MAINTANNUAL OPERATINC AND MAI CYCLE L I F E OF 8ATTERY KW SHAVED OFF PEAK BATTERY MWH CAPACITY BATTERY DI RECT COST BATTERY OISCOUNT FACTOR BATTERY ACCOUNTING FACTO CONVERTER ACCOUNTING FAC BOP ACCOUNTING FACTOR BATTERY COST CONV COST BUILD INC FACTOR BUI LOI NC COST DC EQUIPMENT COST BOP COSTPLANT COST IN MILL IONS FNCI NEERI NC COST BATTERY ANO CONVERTER EF ANNUAL ENERCY LOST ANNUAL DEMANO SAVINC BEF STATE TAX FEDERAL TAXANNUAL OEMANO SAVING AFTSALVACC VALUEACRS PER PERIODCATECORYSTARTBATT ANO CONV COST BC DEPR COST BOP OEPRACRS BOPBOP CAI f CORYDEPRECI ATI ON TAX SAVI NCOVERALL COSTOVLRALL BENEFITNET P R t S f N T WORTHAl TER TAX RATE OF RE TURN
BALANCE OF PLANT F I XED C BAT I ERY KW CAPACI TY CONVERTER BASE COST SALVACE RATE I NT L A TI ON RATE OISCOUNT RATE
T , LAST L I NE IS 1020
0 9 / 2 3 / 0 7 1 6 : 03 - - 21 COLUMNS 6 2 VARI ABLES
1986 1987 1988
2 8 6 0 0 0 01000 1000 10002 4 0 0 0
. 1 100 . 1 100 . 1 100
. 0 4 6 0 . 0 4 6 0 . 0 4 5 0
. 0 8 0 0 . 0 8 0 0 . 0 8 0 0
. 0 6 0 0 . 0 6 0 0 . 0 5 0 0
. 0 6 6 0 . 0 6 6 0 . 0 5 5 0
. 8 0 0 0 . 80 0 0 . 8 0 0 0
. 9 6 0 0 . 9 5 0 0 . 9 5 0 0
. 4 0 0 0 . 40 0 0 . 4 0 0 01 . 0 7 0 1 . 07 0 1 . 0 7 0. 3 4 0 0 . 3400 . 3400. 0 6 0 0 . 0 5 0 0 . 0 5 0 01 3 . 6 9 1 4 . 2 0 1 4 . 8 4. 0 127 . 0 1 3 2 . 0 1 3 8
2 2 22 0 0 0 2000 2 0 0 0
]- . 3 2 0 0 - . 3 2 0 0 - . 3 2 0 0
100 100 1000 0 0
. 8 0 0 0 . 8000 . 8 0 0 0
. 8 4 6 4 . 8464 . 8 46 41700 3600 36001 700 3600 36002 0 0 0 2000 2 0 0 01000 1000 1000
2 2 21 9 9 . 4 0 01 . 0 7 0 0 01 . 167 1 . 167 1 . 1671 . 1 7 6 1 . 17 6 1 . 1 7 61 . 1 4 4 1 . 1 4 4 1 . 1 4 42 4 9 . 0 0 02 8 2 . 2 0 01 . 4 3 1 0 0
167 082 0 02 0 7 7 4 0 0
2 4 7 6 2 7 0 01 . 0 2 8 0 0
187 994 0 0. 6 7 7 1 . 677 1 . 6 7 7 112916 12915 12915
163 0 8 0 170419 1780878061 8 33 2 87 15
6 2 0 7 3 63827 56 3 0 2102 9 4 6 108259 113070
0 0 08 9 2 4 7 1 30896 124946
6 6 61986 1986 1986
6 3 8 8 6 4 0 06 9 4 9 8 0 0 02 1 6 4 6 6 0 0
10823 2 1646 1948116 15 15
340 24 6 1864 49 105121 7633 3 77 1 3 7 78
136970 160123 162 1 751 0 9 0 8 0 9 - 9 6 7 0 2 1 - 8 3 1 5 2 0
1992 1993 1994
0 0 01000 1000 1000
0 0 01 100 . 1 1 0 0 . 1 1000 4 5 0 . 0 4 5 0 . 04 6 00 8 0 0 . 0 8 0 0 . 0 8 0 0
1989 1990 1991
0 0 01000 1000 1000
0 0 0. 1 1 0 0 . 1 100 . 11 0 0. 0 4 5 0 . 0 4 5 0 . 0 45 0. 0 8 0 0 . 08 0 0 . 0 8 0 0. 0 6 0 0 . 05 0 0 . 0 5 0 0. 0 5 5 0 . 0 5 5 0 . 0 5 5 0. 8 0 0 0 . 8 0 0 0 . 80 0 0. 9 5 0 0 . 9 5 0 0 . 95 0 0. 4 0 0 0 . 4 0 0 0 . 4 0 0 01 . 0 7 0 1 . 0 7 0 1 . 07 0. 3 40 0 . 3400 . 3400. 0 5 0 0 . 0 5 0 0 . 0 5 0 01 5 . 5 1 16 . 21 1 6 . 99. 0 1 4 4 . 0151 . 0 1 5 8
2 2 22 0 0 0 2000 2000
]- . 3 2 0 0 - . 3 2 0 0 - . 3 2 0 0
100 100 1000 0 0
. 8 0 0 0 . 8 0 0 0 . 8000
. 8 4 6 4 . 8464 . 84645 100 5900 153005 100 5900 153002 00 0 2000 20001000 1000 1000
2 2 20 0 00 0 0
1 . 167 1 . 16 7 . 1 . 1671 . 1 7 6 1 . 17 6 1 . 1 7 61 . 1 4 4 1 . 144 1 . 1 4 4
0 0 00 0 00 0 00 0 00 0 00 0 00 0 00 0 0
. 6 7 7 1 . 6771 . 677112915 12915 129 15
186101 194476 2 0 3 2 2 79 0 4 1 94 19 9 38 5
58 4 0 3 60847 6 0 6 3 51 18657 1242 10 133206
0 0 0124946 124946 0
5 5 51986 1986 1986
0 0 00 0 00 0 0
173 17 15152 15 15215 15 15
48 3 6 9 4 763 3 51526286 6 09 5 15504
167027 171843 138368- 7 12947 - 6 0 0 4 74 - 6 2 3 8 3 6
1995 1996 1997
0 0 01000 1000 1000
0 0 01 100 . 1 100 . 1 1 0 00 4 5 0 . 0 4 5 0 . 04 5 00 8 0 0 . 0 8 0 0 . 08 0 0

90
CONT1NCENCY RATE . 0 5 0 0 . 0 5 0 0 . 0 5 0 0 . 0 5 0 0 . 0 5 0 0 . 0 5 0 0SALES TAX . 0 5 5 0 . 0 5 5 0 . 0 5 5 0 . 0 5 5 0 . 0 5 5 0 . 0 5 5 0BATTERY K . 8 0 0 0 . 8 0 0 0 . 8 0 0 0 . 8 0 0 0 . 8 0 0 0 . 8 0 0 0CONVERTER K . 9 5 0 0 . 9 5 0 0 . 9 5 0 0 . 9 5 0 0 . 9 5 0 0 . 9 5 0 0BOP K .UOOO . LOOO . *4000 . *4000 . UOOO . UOOOINSURANCE RATE 1 . 0 7 0 1 . 0 7 0 1 . 0 7 0 1 *07n 1 . 0 7 0 1 . 0 7 0FEDERAL TAX RATE . 3U00 . 3*400 . 3 U 0 0 . 3U00 . 3U00 . 3U00STATE TAX RATE . 0 5 0 0 . 0 5 0 0 . 0 5 0 0 . 0 5 0 0 . 0 5 0 0 . 0 5 0 0ON PEAK DEMAND CHARCE 1 7 . 7 0 18.<49 1 9 . 3 3 2 0 . 2 0 2 1 . 1 0 2 2 . 0 5OFT PEAK ENERCY CHARCE . 0 165 . 0 1 7 2 . 0 1 8 0 . 0 188 . 0 196 . 0 2 0 5DISCHARGE DURATI ON HRS 2 2 2 2 2 2BATTERY KWH CAPACI TY 2 0 0 0 2 0 0 0 2 0 0 0 2 0 0 0 2 0 0 0 2 0 0 0NOMINAL OUTPUT POWER IN 1 1 1 1 1 1SLOPE Of CONVERTER COST - . 3 2 0 0 - . 3 2 0 0 - . 3 2 0 0 - . 3 2 0 0 - . 3 2 0 0 - . 3 2 0 0ANNUAL BATTERY CYCLES 100 100 10 0 100 100 100ANNUAL I NTERRUPTI BLE LOA 0 0 0 0 0 0BATTERY EFT 1C 1ENCY . 8 0 0 0 . 8 0 0 0 . 8 0 0 0 . 8 0 0 0 . 8 0 0 0 . 8 0 0 0ROUND T R I P CONVERTER EFF .8*46*4 .8*46*4 .8*46*4 .8*46*4 . 8U6U . 8U6UMAI NT 2 5 0 0 1700 3 6 0 0 3600 5 1 0 0 5 9 0 0ANNUAL OPERATI NG AND MAI 2 5 0 0 1700 3 6 0 0 3 60 0 5 1 0 0 5 9 0 0CYCLE L I F E OF BATTERY 2 0 0 0 2 0 0 0 2 0 0 0 2 0 0 0 2 0 0 0 2 0 0 0KW SHAVED OFF PEAK 1000 1000 1 0 0 0 1000 1000 1000BATTERY MWH CAPACI TY 2 2 2 2 2 2BATTERY D I RE C T COST 0 0 0 0 0 0BATTERY OI SCOUNT FACTOR 0 0 0 0 0 0BATTERY ACCOUNTI NG FACTO 1 . 167 1 . 167 1 . 167 1 . 167 1 . 167 1 . 167CONVERTER ACCOUNTING FAC 1 . 1 7 6 1 . 1 7 6 1 . 1 7 6 1 . 1 7 6 1 . 1 7 6 1 . 1 7 6BOP ACCOUNTI NG FACTOR 1 . 1*4*4 1 . 1 *4 *4 1 . 1*4*4 1 . 1*4*4 1 . 1U*4 1 . 1UUBATTERY COST 0 0 0 0 0 0CONV COST 0 0 0 0 0 0BU1L O 1NC FACTOR 0 0 0 0 0 0B U I L OI NC COST 0 0 0 0 0 0DC EQUI PMENT COST 0 0 0 0 0 0BOP COST 0 0 0 0 0 0PLANT COST I N MI LL I ONS 0 0 0 0 0 0ENCI NEERI NC COST 0 0 0 0 0 0BATTERY ANO CONVERTER EF . 6 7 7 1 . 6 7 7 1 . 6 7 7 1 . 67 7 1 . 6 7 7 1 . 6 7 7 1ANNUAL ENERCY LOST 12 9 1 5 12915 1 2 9 1 5 12915 12 9 1 5 129 15ANNUAL DEMAND SAVI NC 8EF 2 1 2 3 7 3 2 2 1 9 2 9 2 3 1 9 16 2*42352 2 5 3 2 5 8 2 6 U 6 5 5STATE TAX 10*48 3 1 1000 1 1*40*4 1 1925 123 95 1292UFEDERAL TAX 6 7 7 2 0 7 1062 7 3 6 7 1 7 7 0 3 9 8 0 0 7 3 8 3 U 9 2ANNUAL OEMAND SAVI NC AFT 13*4169 139 867 1 *468*4 1 153 3 8 8 1 6 0 7 9 0 1 6 8 2 3 8SALVACE VALUE 0 0 0 0 0 0ACRS PER PER 1OO 0 0 0 0 0 0CATECORY 5 5 5 5 5 5START 1986 1986 1 9 8 6 1986 1986 1986BATE AND CONV COST 0 0 0 0 0 0BC DEPR COST 0 0 0 0 0 0BOP DEPR 0 0 0 0 0 0ACRS BOP 1 2 9 8 7 12987 1 2 9 8 7 12987 12987 12 9 8 7BOP CATECORY I S IS I S 15 15 15DEPRECI AT I ON TAX SAVI NC *4*4 16 *4*416 *4*4 16 *4*4 16 UU 16 UU 16OVERALL COST 2 7 1 3 1922 3 8 3 2 38*43 535U 6 165OVERALL BE NE F IT 1 3 8 5 8 5 1 *4*4282 1 5 1 2 5 7 15 7 80*4 1 6 5 2 0 6 1 726 5UNET PRESENT WORTH -*4*4*468 3 - 3 6 7 8 5 3 - 29 * 4 2 5 7 - 2 2 3 0 8 6 - 15U7 12 - 8 8 7 9 3AFTER TAX RATE OF RETURN
1998 1999
. 0 178
2 0 0 0
.037*4
2 0 0 1
. 0 5 3 1
2 0 0 2
. 0 6 5 8
2 0 0 3
BALANCE OF PLANT F I XED C 0 0 0 0 0 0BATTERY KW CAPACI TY 1000 1000 1 0 0 0 1000 1000 1000CONVERTER BASE COST 0 0 0 0 0 0SALVACE RATE . 1 1 0 0 . 1 1 0 0 . 1 1 0 0 . 1 100 . 1 100 . 1 1 0 01 Nl L AT 1 ON RATE . 0*450 .0*450 . 0*450 . 0*450 . 0U50 . 0 U 5 0DISCOUNT RATE . 0 8 0 0 . 0 8 0 0 . 0 8 0 0 . 0 8 0 0 . 0 8 0 0 . 0 8 0 0CONT1NCENCY RATE . 0 5 0 0 . 0 5 0 0 . 0 5 0 0 . 0 5 0 0 . 0 5 0 0 . 0 5 0 0s a l e s t a x . 0 5 5 0 . 0 5 5 0 . 0 5 5 0 . 0 5 5 0 . 0 5 5 0 . 0 5 5 0BATTERY K . 8 0 0 0 . 8 0 0 0 . 8 0 0 0 . 8 0 0 0 . 8 0 0 0 . 8 0 0 0CONVERTER K . 9 5 0 0 . 9 5 0 0 . 9 5 0 0 . 9 5 0 0 . 9 5 0 0 . 9 5 0 0BOP K . *4000 . *4000 . *4000 . UOOO UOOO .UOOOINSURANCE RATE 1 . 0 7 0 1 . 0 7 0 1 . 0 7 0 1 . 0 7 0 1 . 0 7 0 1 . 0 7 0FEDERAL TAX RATE . 3*400 . 3*400 . 3*400 . 3 UOO . 3 UOO . 3 UOOSTATE TAX RATE . 0 5 0 0 . 0 5 0 0 . 0 5 0 0 . 0 5 0 0 . 0 5 0 0 . 0 5 0 0ON PEAK OEMAND CHARCE 2 3 . 0 5 2*4. 08 2 5 . 1 7 2 6 . 3 0 27 , U8 28 . 72OFF PEAK ENERCY CHARCE . 0 2 15 .022*4 . 023*4 . 02U5 . 0 2 5 6 . 0 2 6 7DISCHARGE DURATI ON HRS 2 2 2 2 2 2BATTERY KWH CAPACI TY 2 0 0 0 2 0 0 0 2 0 0 0 2 0 0 0 2 0 0 0 2 0 0 0NOMINAL OUTPUT POWER IN 1 1 1 1 1 1SLOPE OF CONVERTER COST - . 3 2 0 0 - . 3 2 0 0 - . 3 2 0 0 f'J O o - . 3 2 0 0 - . 3 2 0 0

91
ANNUAL B A T T E R Y CY CL E S ANNUAL I N T E R R U P T I B L E LOA B A T T E R Y E E r I C I E N C Y ROUND T R I P CONV E RT E R EEE M A I N EANNUAL O P E R A T I N G AND MAI C Y C L E L I T E OE B A T T E R Y kw sh a v e o orr p e a kB A T T E R Y MWH C A P A C I T Y B A T T E R Y O I R E C T COST B A T T E R Y O I S C O U N T EACTOR B A T T E R Y A C C O U N T I N G FACTO CONV E RTE R A C C O U N T I N G r A C BOP A C C O U N T I N G FACTOR B A T T E R Y COST CONV COST B U I L D I N G FACT OR B U I L D I N C COST DC E Q U I P M E N T COST BOP COSTP L A N T COST I N M I L L I ONS E N C I N E E R I N C COST B A T T E R Y ANO CONV E RT E R EF ANNUAL E NE RCY L O S T ANNUAL OEMAND S A V I N C BEE S T A T E TAX FE OERAL TAXANNUAL OEMAND S A V I N C AFTSALV ACE V ALUEACRS PER P E R I O OCAT ECO RYS T ARTB A T T AND CONV COSTBC DEPR COS TBOP OEPRACR S BOPBOP CAT ECORYD E P R E C I A T I O N TAX S A V I N CO VE RA LL CO S TOV E RA L L B E N E F I TNE T P R E S E N T WORTHA F T E R TAX RATE OF RETURN
BALANCE OF P L ANT F I X E D CB A T T E R Y KW C A P A C I T YC O NV E RT E R BASE COSTS ALV ACE RATEI N F L A T I O N RATE
D I S C O U N T RATEC O N T I N C E N C Y RATES A L E S TAXB A T T E R Y KC O NV E RT E R KBOP KINSURANCE RATE TEDERAL TAX RATE STATE TAX RATE ON PEAK OEMAND CHARCE OFF PEAK ENERCY CHARCE 0 ISCHARCE DURATI ON HRS BATTERY KWH C A PA CI TY NOMINAL OUTPUT POWER IN SLOPE OF CONVERTER COST ANNUAL BATTERY CYCLES ANNUAL I NT E RRU PT I BL E LOA BATTERY E F F I C I E N C Y ROUNO TRI P CONVERTER EFF MA I NTANNUAL OPERATI NG AND MAI CYCLE L I F E OF BATTERY KW SHAVED OFF PEAK BATTERY MWH C A PA CI TY BATTERY DI RE CT COST BATTERY DI SCOUNT (ACTOR BATTERY ACCOUNTI NG EACTO CONVERTER ACCOUNTING FAC BOP ACCOUNTING FACTOR
100 100 1000 0 0
. 8 0 0 0 . 8 0 0 0 . 8 0 0 0
. 8U6U . 8U6U . 8U6U15300 2 5 0 0 170015 300 2 5 0 0 1 7002 0 0 0 2 0 0 0 2 0 0 01000 1000 1000
2 2 20 0 00 0 0
1 . 167 1 . 167 1 . 1671 . 1 7 6 1 . 1 7 6 1 . 1 7 61 . 1UU 1 . 1UU 1 . 1UU
0 0 00 0 00 0 00 0 00 0 00 0 00 0 00 0 0
. 67 7 1 . 6 7 7 1 . 6 7 7 1129 15 129 15 12 9 1 5
276 5 6 U 2 8 9 0 1 0 3 0 2 0 1 51 3 09 9 1 U 3 1 1 150016 9 2 9 9 92UU9 9 6 9 0 U
179 216 1 8 2 2 5 0 1 9 0 1 1 00 0 00 0 06 5 5
1986 1986 19860 0 00 0 00 0 0
12967 12987 12 9 8 7IS 15 15
UU 16 UU 16 UU 16155 7 7 2 7 9 0 2 0 0 3
183 632 1 8 6 6 6 5 19U526- 2 7 U 5 8 3 5 0 6 9 9 5 7 1 0
. 0 7 6 0 . 06U8 . 0 9 2 2
200U 2 0 0 5 2 0 0 6
0 0 01000 1000 1000
0 0 0. 1 100 . 1 100 . 1 1 0 0. 0U5O . 0U50 . OU50. 0 8 0 0 . 0 8 0 0 . 0 8 0 0. 0 5 0 0 . 0 5 0 0 . 0 5 0 0. 0 5 5 0 . 0 5 5 0 . 0 5 5 0. 8 0 0 0 . 8 0 0 0 . 8 0 0 0. 9 5 0 0 . 9 5 0 0 . 9 5 0 0. UOOO . UOOO . UOOO1 . 0 7 0 1 . 0 7 0 1 . 0 7 0. 3U00 . 3U00 . 3U00. 0 5 0 0 . 0 5 0 0 . 0 5 0 03 0 . 0 1 3 1 . 3 6 3 2 . 7 8. 0 2 7 9 . 0 2 9 2 . 0 3 0 5
2 2 22 0 0 0 2 0 0 0 2 0 0 0
1- . 3 2 0 0 - . 3 2 0 0 - . 3 2 0 0
100 100 1000 0 0
. 8 0 0 0 . 8 0 0 0 . 8 0 0 0
. 8U6U . 8U6U . 8U6U5 9 0 0 15300 15 3 0 05 9 0 0 15300 15 3 0 02 0 0 0 2 0 0 0 2 0 0 01000 1000 1000
2 2 20 0 00 0 0
1 . 167 1 . 167 1 . 1 6 71 . 1 7 6 1 . 1 7 6 1 . 1 7 61 . 1UU 1 . 1UU 1 . 1UU
100 100 1000 0 0
. 8 0 0 0 . 8 0 0 0 . 8 0 0 0
. 8U6U . 8U6U . 8U6 U3 60 0 3 6 0 0 5 1 0 03600 3 6 0 0 5 1 0 02 0 0 0 2 0 0 0 2 0 0 01000 1000 1 0 0 0
2 2 20 0 00 0 0
1 . 167 1 . 1 6 7 1 . 1671 . 1 7 6 1 . 1 7 6 1 . 1 7 61 . 1UU 1 . 1UU 1 . 1UU
0 0 00 0 00 0 00 0 00 0 00 0 00 0 00 0 0
. 6 7 7 1 . 6 7 7 1 . 6 7 7 112915 129 15 1 2 9 1 5
3 1 5 6 0 6 3 2 9 8 0 8 3UU6U91558U 1629U 1 6 9 6 0
100 6 7 6 1 0 5 2 5 9 1 0 9 5 6 31993U6 2 0 8 2 5 6 2 1 8 1 2 6
0 0 00 0 05 5 5
1986 1986 1 98 60 0 00 0 00 0 00 0 0
15 15 150 0 0
3 91 6 3 9 3 0 5UU51993U6 2 0 8 2 5 6 2 1 8 1 2 6152 6 6 2 2 0 7 8 0 0 2 6 0 9 1U
. 0 9 8 3 . 103U . 1 07 8

92
BATTERY COST CONV COST B U I L O I N C TACTOR B U I L O I N C COST OC EQUIPMENT COST BOP COSTPLANT COST IN M I L L I O N S E NGI NE ERI NG COST BATTERY AND CONVERTER EF ANNUAL ENERGY LOST ANNUAL OEMAND SAVI NC BEF STATE TAX FEDERAL TAXANNUAL OEMAND SAVI NC AFTSALVACE VALUEACRS PER PERI OOCATECORYSTARTBATT AND CONV COSTBC DEPR COSTBOP DEPRACRS BOPBOP CATECORYD E PR ECI AT I O N TAX SAVI NCOVERALL COSTOVERALL BE NE FI TNET PRESENT WORTHAFTER TAX RATE OF RETURN
ENTER SOLVE OPT IONS I NPUT: NORECORO
0 0 00 0 00 0 00 0 00 0 00 0 00 0 00 0 0
. 6 7 7 1 . 6 7 7 1 . 6 7 7 11 2 9 1 5 129 IS 129 1S
3 6 0 1 5 9 3 7 6 3 6 6 3 9 3 3 0 21 7 6 9 5 18039 1 88 80
1 14 309 1 16S02 1 2 1 9 6 72 2 8 155 2 9 1 8 2 9 2 S 2 9 S9
0 0 9 3 8 7 90 0 05 s S
1986 1986 19860 0 00 0 00 0 00 0 0
IS IS 150 0 0
6 2 6 1 1S 6 7 7 15 6 9 92 2 8 155 2 9 1829 2 9 6 3 2 83 1 2 2 19 3 6 0 9 6 5 9 15965
. 1 1 1 6 . 1 1 9 7 . 1 180

APPENDIX F
MODEL AND OUTPUT FOR CASE NUMBER TWO
MODEL THESI S READY f OR E D I T . t AS T l I NE IS 1()?0 INPU t : L I S T 1MODEL THESI S VERSI ON OE 09/ 23/87 16: ??I I) COLUMNS 19 8 6 - 2 0 0 620 BALANCE Of PLANT F I XE D COST = 28600.030 BATTERY KW CA PA CI TY = 6 0 09 0 CONVERTER BASE COS T = 2 9 0 . 06 0 SALVACE RATE - . 116 0 I NEL ATI ON RATE - . 0 9 670 DI SCOUNT RATE - .088 0 CONTINGENCY RATE. - . 0690 SAl ES TAX - .066100 BAT TERY K - .81 10 CONVERTER K - .95120 BOP K = . 91 30 lNSURANCE RATE - 1 . 0 7190 FEDERAL TAX RATE = . 39 160 STATE TAX RATE = . 0 5160 ON PEAK OEMAND CHARCE = 1 3 . 5 9 . PREV I OUS* ( 1 ♦ I NELAT I ON RATE)170 OFF PEAK ENERCY CHARCE - . 0 1 2 6 5 . PREV I OU S* ( 1 ♦ I NFLATI ON RATE)180 DISCHARGE DURATI ON HRS - 1190 BATTERY KWH CA P A CI TY = 50 02 0 0 NOMINAL OUTPUT POWER IN MW = . 5 02 1 0 SLOPE OF CONVERTER COST CURVE - - . 3 22 2 0 ANNUAL BATTERY CYCLES - 1002 3 0 ANNUAL I NTE RRUPTI BL E LOAD SAVI NCS = 02 9 0 BATTERY E F F I C I E N C Y - . 82 5 0 ROUND TRIP CONVERTER E F F I C I E N C Y = . 9 2 * . 9 22 6 0 M A I N T = 1 7 0 0 . 3 6 0 0 . 3 6 0 0 . 5 1 0 0 , 5 9 0 0 . 1 5 3 0 0 . 2 5 0 0 . 1 7 0 0 . 3 6 0 0 , 3 6 0 0 . '2 70 5 1 0 0 . 5 9 0 0 . 15 3 0 0 , 2 5 0 0 . 1 7 0 0 . 3 6 0 0 . 3 6 0 0 . 5 1 0 0 . 5 9 0 0 . 1 5 3 0 02 8 0 ANNUAL OPERATI NG AND MAINTENENCE EXPENSE - ( BAT TERY KW C A P A C I T Y / '2 9 0 1 0 0 0 ) * MAI N T300 CYCLE L I F E OF BATTERY - 2 0 0 0 310 KW SHAVEO OFF PEAK = 5 0 0320 BATTERY MWH CA PA CI TY = BATTERY KWH CAPAC I T Y / 1000330 BATTERY DI RECT COST - 21 1 / ( L O C 1 0 ( DI SCHARCE DURATION H R S ) * . 757 ) . 0 390 BATTERY DI SCOUNT FACTOR = 1 . 1 - . 1* L O C 1 0 ( BATTFRY MWH C A P A C I T Y ) . 0350 BATTERY ACCOUNTI NG FACTOR^) INSURANCE RA TE" ! 1 *BA T T E R Y K ’ ( SALES TAX) ) 360 ♦CONTINGENCY RATE)370 CONVERTER ACCOUNTI NG FACTOR-1 INSURANCE RATE# ( 1 »CONVERTER K• '380 ( SALES T A X ) ) +CONTINCENCY RATE)390 BOP ACCOUNTING FAC TOR = ( INSURANCE R A T E * ( 1 + B 0 P K’ (SALES T A X ) ) '9 0 0 ♦CONTINGENCY RATE)9 1 0 BATTERY COST = BATTERY OI RECT COST ’ BATTERY ACCOUNTING FACTOR'9 2 0 ’ BATTERY DI SCOUNT FA CT O R. 09 3 0 CONV COST - CONVERTER ACCOUNTI NG FACTOR* ( CONVERTER BASE C O S T * '9 9 0 XPOWERY( NOMINAL OUTPUT POWER IN MW. '9 6 0 SLOPE OF CONVERTER COST C U RV E) )9 6 0 B U I L D I N G FACTOR = BATTERY MWH CAPAC I TY / ( 1 . 3 2 * '9 7 0 L OG1 0 ( 0 1 SCHARCE DURATI ON HRS) + 1 ) . 09 8 0 B U I L D I N C COST - 1 2 7 * XPOWERY( B U I L 0 INC FACTOR, . 7 6 5 1 * 1 0 0 0 . 09 9 0 DC ( QUI PMENT COST = 1 7 . 3 ’ XPOWERY( BATTERY MWH CAPAC I T Y , . 9 9 1 ) • '5 0 0 XPOWERY(DISCHARCE DURATI ON MRS. - . 6 7 7 ) ’ 1 0 0 0 06 1 0 BOP COST BOP ACCOUNTI NG FACTOR * ( BALANCE OF PI ANT F I X E D C O S T + f 6 2 0 B U I L D I N C COST’ DC EQUI PMF nt C O S T ) . 06 3 0 PI ANT COST IN M I L L I O N S - ( BOP COST ♦ ( BATTERY COST'990 ’ BATTERY KWH CAPAC I T Y ) ♦ ( CONV C O S T * '9«,0 BATTERY KW CAPACI TY) ) / 11)00000,0660 E N C I N T f R I N C COST- IF PLANT COST IN M I L L I O N S . CL . 86 T I U N '6 70 ( 188’ XPOWFRY(PLANT COST IN M I L L I O N S . '580 PLANT COST IN MI L L I ONS/-86 7 ) ) • 1000 ELSE 161000,0590 BATTERY ANO CONVERTER E F F I C I E N C Y = BATTERY E F F I C I E N C Y * '500 ROUND TRIP CONVERTER E F F I C I E N C Y610 ANNUAL LNERCY LOST = CYCLE L I F E OF BA T TERY* BA 1TERY KWH CAPACI T Y * ( 1- 020 BATTERY ANO CONVERTER EM I C I E N C Y ) / '630 ANNUAL BATTERY CYCLES690 ANNUAL OEMAND S A V I NC Bi FORE TAX KW SHAVED OFf P E A K * '650 ON PEAK OEMAND CHARCE* 1?660 STATE T A X - ( ANNUAL DEMAND SAVI NG BEFORE TAX'670 - ANNUAL OPERATI NG ANO MAI NTENENCE T X PEN SE- '680 (ANNUAL ENERCY L O S T ’ OEF PEAK ENERGY C H A R C E ) ) '6 9 0 ’ STATE TAX RATE700 EEDERAl TAX - (ANNUAL DEMAND SAVI NC BEFORE TAX- STATE TAX'7 1 0 -ANNUAL OPERATI NG AND MAINTENENCE E X P E N S E - '720 (ANNUAL ENERGY L O S T ’ OEF PEAK ENERCY C H A R G E ) ) '7 30 * f E Df RAL TAX RATE790 ANNUAI DEMAND S A VI NG AETER TAX ANNUAL DEMAND SAVI NC BEFORE T A X- ' 760 (STATE TAX ♦ EEDERAL TAX)77,0 SALVAGE VALUE SALVAGE R A T E * P R E V I OUS 20 BATTERY DI RECT COST • '

7 70/no7908008 10 820 830 890 860 8608 70 880 890 90 09 10 920 930 990 950 960 9 7 0 980
B A I 1 I H Y KWH CAPAC I I YACRS DE PR( CA1EG0HY. STAR I ,BC 01 PR COST, ACRS PER PERI OD)CATEGORY - 6START 1986B A I T AND CONV COST - BATTERY DI RECT COST ’ BATTERY KWH CA PA CI TY ♦ '
( (CONVERT! R BASE COST’ XPOWERY( 'NOMINAL OUTPUT POWER IN M V , 'SLOPE OT CONVLRTER COST C U R V E ) ) '• BATTERY KW C A P A C I TY )
BC Of PR COST - ( B A T T E R Y DI RECT COST*BATTERY KWH CA P A CI TY ’ ) ’I - SAL VACE RA T E) ) ♦ ( (CONVERTER BASE COST’ XPOWERY( ' NOMINAL OUTPUT POWER IN MW. 'SLOPE Of CONVERTER COST CURVE) ) *BATTERY KW CA P A CI TY )
BOP DEPR - BOP COST/ BOP ACCOUNTING fACTOR ACRS DE P R ( BOP CATECORY . S T A R T , BOP DEPR, ACRS BOP)BOP CATEGORY = 15DE P R E C I AT I O N TAX S A V I NG ^ ACRS PER PER I OO’ EEOERAL TAX K A T E * '
ACRS BOP’ EEDERAL TAX RATEOVERALL COST ̂ ( PLANT COST IN M I L L I O N S ’ 1 0 0 0 0 0 0 ) ♦ E NCI NE ERI NC COST ♦ '
(ANNUAL ENERCY L O S T * 'OFF PEAK ENERCY C H AR CE ) ♦ ( ANNUAL OPERATI NG ANO MAINTENENCE EXPENSE) OVERALL BENEFI T = ANNUAL DEMANO SAVI NC AFTER TAX ♦ SALVACE VALUE ♦'
9 9 0 ANNUAL I NTERRUPTI BLE LOAD SAVI NCS ♦ '1000 D E P R E CI AT I O N TAX SAVI NG1010 NET PRESENT WORTH - NPVC(OVERALL BENEF I T . 0 I SCOUNT RA T E . OV E R A L L COST) 1020 AFTER TAX RATE OF RETURN = I RR( OVE RAL L BE NEE I T . OVERAEL COST)ENO Or MOOEL INPUT: NORECORD

95
MOM 1 I NPU I MODEL i n i r rINPUT
I Ml S I S K l AO Y I OR ( O i l , L AS I 1. I NE IS SOL VE
THESI S VERSI ON OE 0 9 / 2 3 / 8 7 16: 11SOLVE OPTI ONS
Al L
1020
- - 21 COLUMNS 6 2 VA RI A0 L 1 S
BALANCE OE PLANT F I X E D CBATTERY KW CAPACI TYCONVERTER BASE COSTSALVACE RATEINELA I I ON RATEDI SCOUNT RATECONTINGENCY RATESALES TAXHAT TERY KCONVERTER KBOP KINSURANCE RATE FEDERAL TAX RATE STATE TAX RATE ON PEAK DEMANO CHARCE OFF PEAK ENERCY CHARCE DISCHARCE DURATI ON HRS BATTERY KWH CAPACI TY NOMINAL OUTPUT POWER IN SLOPE OE CONVERTER COST ANNUAL BATTERY CYCLES ANNUAL I NTERRUPTI BLE LOA BATTERY E E E I CI EN C Y ROUND TRIP CONVERTER EFf MAINEANNUAL OPERATI NG AND MAI CYCLE L I F E OF BATTERY KW SHAVED OFF PEAK BATTERY MWH CAPACI TY BATTERY OI RECT COST BATTERY DI SCOUNT FACTOR BATTERY ACCOUNTI NG FACTO CONVERTER ACCOUNTI NG FAC BOP ACCOUNTI NG FACTOR BATTERY COST CONV COST B U I L O I N C FACTOR BUI LD INC COST DC EQUI PMENT COST BOP COSTPLANT COST IN M I L L I O N S ENCI NEERI NC COST BATTERY AND CONVERTER f F ANNUAL ENERCY LOST ANNUAL DEMAND SAVI NC BEF STATE TAX FEDERAL TAXANNUAL DEMANO SAVI NC ATTSAL VACE VAI UtACRS PI R PI R I 00CATECORYSTARTBATT ANO CONV COSTBC OEPR COSTHOP DEPRACRS BOPHOP CATl CORYDEPRECI AT I ON TAX SAVI NCOVERALL. COSTOVE RALL BE NE I I TNE T PRt St NT WOR THAl TER TAX RATE 01 HI TURN
BAI ANCE 01 PL ANT f I XED C BAT TERY KW CAPACI TY CONVERTER BASE COST SALVACE RATE I NFLAT ION RATE DI SCOUNT RATE
T 9 8 6 1987 1 98 8
2 8 6 0 0 0 06 0 0 6 0 0 6 0 02 9 0 0 0
. 1 TOO . 1 100 . 1 100
. 0 9 6 0 . 0 9 6 0 .0 9 60
. 0 8 0 0 . 0 8 0 0 . 0 8 0 0
. 0 6 0 0 . 0 6 0 0 . 0 6 0 0
. 0 6 6 0 . 0 6 6 0 . 0 6 6 0
. 8 0 0 0 . 8 0 0 0 . 8 0 0 0
. 9 6 0 0 . 9 6 0 0 . 9 6 0 0
. 9 0 0 0 . 9 0 0 0 . 9 0 0 01 . 0 7 0 1 . 0 7 0 1 . 0 7 0. 3 9 0 0 . 3 9 0 0 . 3 9 0 0. 0 6 0 0 . 0 6 0 0 . 0 6 0 01 3 . 6 9 1 9 . 2 0 1 9 . 8 9. 0 1 2 7 . 0 1 3 2 . 0 1 3 8
1 I 16 0 0 6 0 0 6 0 0
. 6 0 0 0 . 6 0 0 0 . 6 0 0 0- . 3 2 0 0 - . 3 2 0 0 - . 3 2 0 0
100 too 1000 0 0
. 8 0 0 0 . 8 0 0 0 . 8 0 0 0
. 8 9 6 9 . 8 9 6 9 . 8 9 6 91 700 3 60 0 3 6 0 08 6 0 1800 1800
2 0 0 0 2 0 0 0 2 0 0 06 0 0 6 0 0 6 0 0
. 6 0 0 0 . 6 0 0 0 . 6 0 0 02 7 8 . 7 0 01 . 1 3 0 0 01 . 1 6 7 1 . 1 6 7 1 . 1 6 71 . 1 7 6 1 . 1 7 6 1 . 1 7 61 . 1 9 9 1 . 1 9 9 1 . 1 9 93 6 7 . 6 0 03 6 2 . 3 0 0. 6 0 0 0 0 079 7 39 ') 09 0 1 1 0 0
1289 7 1 0 0. 9 8 8 9 0 0
1 6 1 0 0 0 0 0. 0 7 7 1 . 6 7 7 1 . 6 7 7 1
3 2 2 9 3229 3 2 2 98 1690 8 6 2 0 9 8 9 0 9 9
9 0 3 2 9 168 9 3602 6 0 6 0 2 6 9 2 7 28 1666 1968 69 1 1 9 66 6 18
0 0 0•» 10 76 6 0 2 9 9 6 7 6 0 6
6 6 61986 1986 1986
2 8 9 166 0 02 7 3 8 3 6 0 01 1 2 3 9 6 0 0
66 1 7 11239 10 11116 l 6 1 6
168 76 29 30 3 2 2 9 9 06 6 0 3 2 6 189 3 189 6
67 3 3 3 789 16 7 9 6 0 868 79 79 - 6 2 2 9 6 6 - 9 6 0 9 2 1
1992 1993 1999
0 0 06 0 0 60 0 6 0 0
0 0 01 100 . 1 1 0 0 . 1 100
0 9 6 0 . 0 9 6 0 . 0 9 6 00 8 0 0 . 0 8 0 0 0 8 0 0
1989 1990 1991
0 0 06 0 0 600 60 0
0 0 0. 1 1 0 0 . 1 100 . 1 1 0 0. 0 9 6 0 . 0 9 6 0 . 0 9 6 0. 0 8 0 0 . 0 8 0 0 . 0 8 0 0. 0 6 0 0 . 0 6 0 0 . 0 6 0 0. 0 6 6 0 . 0 6 6 0 . 0 6 6 0. 8 0 0 0 . 8 0 0 0 . 8 0 0 0. 9 6 0 0 . 9 6 0 0 . 9 6 0 0. 9 0 0 0 . 9 0 0 0 . 9 0 0 01 . 0 7 0 1 . 0 7 0 1 . 0 7 0. 3 9 0 0 . 3900 . 3 9 0 0. 0 6 0 0 . 0 6 0 0 . 0 6 0 01 6 . 6 1 1 6 . 2 1 1 6 . 9 9. 0 199 . 0 1 6 1 . 0 168
6 0 0 600 6 0 0. 6 0 0 0 . 6 00 0 . 6 0 0 0
- . 3 2 0 0 - . 3 2 0 0 - . 3 2 0 0100 100 100
0 0 0. 8 0 0 0 . 8 0 0 0 . 8 0 0 0. 8 9 6 9 . 8969 . 8 9 6 9
6 100 6 90 0 16 3002 6 6 0 2 9 6 0 7 66 02 0 0 0 2 0 0 0 2 0 0 0
60 0 600 6 0 0. 6 0 0 0 . 6 00 0 . 6 0 0 0
0 0 00 0 0
1 . 167 1 . 167 1 . 1671 . 176 1 . 1 7 6 1 . 1 7 61 . 199 1 . 1 9 9 1 . 1 9 9
0 0 00 0 00 0 00 0 00 0 00 0 00 0 00 0 0
. 6 7 7 1 . 6 77 1 , 67 7 T3 22 9 3229 3 22 9
9 30 6 1 9 72 38 101 6 1 99 6 2 3 9 7 12 9 6 9 6
2 9 2 1 7 309 39 30 3 396 9 3 1 1 6 2 0 8 7 6 6 6 8 9
II 0 06 7606 6 7606 0
6 6 61986 1986 1986
0 0 00 0 00 0 0
8 9 8 8 7869 786916 16 1 6
2 2 6 0 8 2 2 2 2 6 26 7 92 6 9 ' 2 9 9 9 7 70 1
8 19 19 89 3 12 6 9 2 6 89 0 2 7 70 - 39 7692 - 309 189
1996 1996 199 7
0 0 06 0 0 600 6 0 0
0 0 01 100 . 1 100 . 1 1 0 0
0 9 60 . 0 9 6 0 . 0 9 6 00 8 0 0 . 0 8 0 0 . 0 8 0 0

96
CONI I NCI NCY HA I !SALES TAX BATTERY K CONVERI r R K BOP KINSURANCE RATE EEDERAL T AX HATE STATE TAX RATE ON PEAK OEMAND CHARCE OFf PEAK ENERCY CHARCE 0 I SCHARCE DURATI ON HRS BATTERY KWH CAPACI TY NOMINAL OUTPUT POWER IN SLOPE OF CONVERTER COST ANNUAL BATTERY CYCLES ANNUAL I NTERRUPTI BLE LOA BA I TERY EF F I C I ENC Y ROUND T R I P CONVERTER EFT MAINEANNUAL OPERATI NG AND MAI CYCLE l IFE OF BATTERY KW SHAVED OFF PEAK BATTERY MWH CAPACI TY BATTERY DI RECT COST BATTERY DI SCOUNT FACTOR BATTERY ACCOUNTING FACTO CONVERTER ACCOUNTING FAC BOP ACCOUNTI NG FACTOR BATTERY COST CONV COST B U I L D I N C FACTOk BU I L D I NG COST DC EQUIPMENT COST BOP COSTPLANT COST IN M I L L I O N S ENCI NEERI NC COST BATTERY AND CONVERTER EF ANNUAL ENERCY LOST ANNUAL DEMAND SAVI NC BEF STATE TAX FEDERAL TAXANNUAL DEMAND SAVI NC AFTSALVACE VALUEACRS PER PER I 0 0CATECORYSTARTBATT AND CONV COSTBC DEPR COSTBOP DEPRACRS BOPBOP CATECORYDEPRECI AT I ON TAX SAVI NGOVERAl L COSTOVERALL BE NE F I TNET PRESENT WORTHAFTER TAX KATE OF RETURN
BALANCE OF PLANT f I XED CBATTERY KW CAPACI TYCONVERTER BASE COSTSALVACE RATEINFl AT ION RATEOISCOUNT HA IECON! I NCENCY R A I fSALES TAXBATTERY KCONVERTER KBOP KINSURANCE HATE FEDERAL TAX RATE STATE TAX RATE ON PEAK DEMANO CHARCE OE F PEAK ENERCY CHARCE DISCHARCE DURATI ON HRS BATTERY KWH CAPACI TY NOMINAL OUTPUT POWER IN SLOPE OF CONVERTER COST
. 0 6 0 0 . 0 6 0 0 . 0 6 0 0
. 0 6 6 0 . 0 6 6 0 . 0 6 6 0
. 8 0 0 0 . 8 0 0 0 . 8 0 0 0
. 9 6 0 0 . 9 6 0 0 . 9 6 0 0
. ROOT) . 9U00 . 9 0 0 01 . 0 70 1 . 0 7 0 1 . 0 7 0. 3900 . 3 9 0 0 . 3 9 0 0. 0 6 0 0 . 0 6 0 0 . 0 6 0 01 7 . /O 1 8 . 9 9 1 9 . 3 3. 0 1 6 6 . 0 172 . 0 180
600 6 0 0 6 0 0. 6 00 0 6 0 0 0 . 6 0 0 0
- . 3 2 0 0 - . 3 20 0 - . 3 2 0 0100 100 100
0 0 08 00 0 . 8 0 0 0 . 8 0 0 0
. 8961* . 8 9 6 9 . 8 9 6 92 6 0 0 I 700 3 6 0 01260 8 6 0 1 8 0 02 0 0 0 2 0 0 0 2 0 0 0
600 6 0 0 6 0 0. 6 0 0 0 . 6 0 0 0 . 6 0 0 0
0 0 00 0 0
1 . 1 6 7 1 . 1 6 7 1 . 1 6 71 . 1 7 6 1 . 1 7 6 1 . 1 7 61 . 1 9 9 1 . 1 9 9 1 . 1 9 9
0 0 00 0 00 0 00 0 00 O 00 0 00 0 00 0 0
. 6 7 7 1 . 6 7 7 1 . 6 7 7 13229 1229 3 2 2 9
106 1 8 6 l 10966 1 1 6 9 6 66299 6 6 0 3 6 7 0 6
3 38 77 3 6 6 9 9 3 6 8 6 m6 7 0 6 6 69 9 1 3 7 3 3 9 9
0 0 00 0 06 6 6
1986 1986 19860 0 00 0 00 0 0
679 1 6 7 9 1 6 7 9 116 16 16
2 2 9 2 2 2 9 2 2 2 9 21 303 9 0 6 . 6 1868
6 9 3 6 7 72209 7 6 6 9 1- 2 6 9 6 9 1 - 2 3 1 0 6 0 - 1 9 9 2 0 0
. 0 0 2 0
1998 1999 2 0 0 0
0 0 0600 6 0 0 6 0 0
0 0 0. 1 100 . 1 100 . 1 100. 0 9 6 0 . 0 9 6 0 , 0 9 6 0. 0 8 0 0 1)800 . 0 8 0 0. 0 6 0 0 . 0 6 0 0 . 0 6 0 0. 0 6 6 0 . 0 6 6 0 . 0 6 6 0. 8 0 0 0 . 8 0 0 0 . 8 0 0 0. 9 6 0 0 9 6 0 0 . 9 6 0 0. 9 0 0 0 . 9 0 0 0 . 9 0 0 01 . 0 7 0 1 . 0 7 0 1 . 0 7 0. 3900 3900 , 3 9 0 0. 0 6 0 0 . 0 6 0 0 . 0 6 0 02 3 . 0 6 2 9 . 0 8 2 6 . 1 7. 0 2 1 6 . 0 2 2 9 . 0 2 3 9
]600 60 0 6 0 0
. 6 0 0 0 . 6 0 0 0 6 0 0 0- . 3 2 0 0 - 3200 - . 3 2 0 0
. 0 6 0 0 . 0 6 0 0 . 0 6 0 0
. 0 6 6 0 . 0 6 6 0 . 0 6 6 0
. 8 0 0 0 . 8 0 0 0 . 8 0 0 0
. 9 6 0 0 . 9 6 0 0 . 9600 .
. 9 0 0 0 . 9 0 0 0 . 9 0 0 01 . 0 7 0 1 . 0 7 0 1 . 0 70. 3 90 0 . 3 9 0 0 . 3 9 0 0. 0 6 0 0 . 0 6 0 0 . 0 6 0 0Oc(\l 2 1 . 1 0 2 2 . 0 6. 0 1 8 8 . 0 1 9 6 . 0 2 0 61 1 1
6 0 0 600 6 0 0. 6 0 0 0 . 6 0 0 0 . 6 0 0 0
- . 3 2 0 0 - . 3 2 0 0 - . 3 2 0 0100 too TOO
0 0 0. 8 0 0 0 . 8 0 0 0 . 8 0 0 0. 8 9 6 9 . 8 9 6 9 . 8 9 6 9
3600 6 100 6 9 0 01800 2 6 6 0 2 9 6 02 0 0 0 2 0 0 0 2 0 0 0
6 0 0 600 6 0 0. 6 0 0 0 . 6 0 0 0 . 6 0 0 0
0 0 00 0 0
1 . 1 6 7 1 . 1 6 7 1 . 1 6 71 . 1 7 6 1 . 1 7 6 1 . 1 7 61 . 199 1 . 199 1 . 1 9 9
0 0 00 0 00 0 00 0 00 0 00 0 O0 0 00 0 0
. 6 7 7 1 . 6 7 7 1 . 6 7 7 13 22 9 3229 3229
1 2 1 1 7 6 1 2 6 6 2 9 1 3 2 3 2 76 9 6 6 6 2 0 1 6 9 6 6
3 8 6 3 9 9 0 0 6 7 9 1 76876 6 7 2 8 0 3 7 1 8 9 0 9 9
0 0 00 0 06 6 6
1986 1986 19860 0 00 0 00 0 0
6 7 9 1 6 7 9 1 6 7 9 116 16 16
2 2 9 2 2 2 9 2 2 2 9 21861 2 6 1 3 30 16
78963 8 2 6 6 3 8 6 3 8 6- 168 666 - 129 3 1 3 - 9 1 3 0 1
. 0 2 2 6 . 0 3 9 0 . 0 6 2 9
2 0 0 1 2 0 0 2 2 0 0 3
0 0 060 0 600 6 0 0
0 0 01 100 . 1 100 . 1100
. 0 9 6 0 . 0 9 6 0 . 0 9 6 0
. 0 8 0 0 . 0 8 0 0 . 0 8 0 0
. 0 6 0 0 . 0 6 0 0 . 0 6 0 0
. 0 6 6 0 . 0 6 6 0 . 0 6 6 0
. 8 0 0 0 . 8 0 0 0 . 8 0 0 0
. 9 6 0 0 . 9 6 0 0 . 9 6 0 0
. 9 0 0 0 . 9 0 0 0 . 9 0 0 01 . 0 7 0 1 . 0 70 1 . 0 70. 3 90 0 . 3 90 0 . 3 9 0 0. 0 6 0 0 . 0 6 0 0 . 0 6 0 02 6 . 3 0 2 7 . 9 8 28 . 72. 0 2 9 6 . 0 2 6 6 . 0 2 6 7
]6 0 0 600 6 0 0
. 6 0 0 0 . 6 0 0 0 . 6 0 0 0- . 3 2 0 0 - . 3 2 0 0 - . 3 2 0 0

97
ANNUAL B A T T E R Y CYCLES ANNUAL I N T E R R U P T I B L E L O A B A T T E R Y E F F I CI ENCY ROUNO T R I P CONVERTER E F F MAI NEANNUAL O P E R A T I N C ANO M A I CYCLE L I F E OF BATTERY KW S H A V E D OFF PEAK B A T T E R Y M W H CAPACI TY B A T T E R Y D I RECT COST B A T T E R Y D I S C O U N T FACTOR B A T T E R Y A C C O U N T I NG F A C T O C O N V E R T E R ACCOUNTI NG F A C BOP A C C O U N T I N G FACTOR B A T T E R Y C O S T CONV C O S T B U I L D I N G FACTOR B U I L O I N G COST OC E Q U I P M E N T COST BOP C O S TPLANT C O S T IN M I L L I O N S ENCI N E E R I N C COST B A T T E R Y A N O CONVERTER EF ANNUAL E N E R C Y LOST ANNUAL D E M A N O SAVI NG B E F STATE T A X F E D E R A L t a xANNUAL D E M A N O SAVI NC A F T S A L V A G E v a l u e ACRS P E R P E R 100 C A T E C O R Ys t a r tBATT A N O CONV COSTBC D E P R C O S TBOP O E P RACRS B O PBOP C A T E G O R YD E P R E C I A T I O N TAX S A V I N GO V E R A L L C O S TO V E R A L L B E N E F I TNET P R E S E N T WORTHAFTER T A X RATE OF RE T U R N
B A L A N C E O F PLANT F I X E D CBATTERY KW CAPACITYCO NV E R T E R BASE COSTS A L V A C E R A T EI N F L A T I O N RATEO I S C O U N T RATECONT I N C E N C Y RATESALES T A XBATTERY KCO NV E R T E R KBOP KI N S U R A N C E RATE FEDERAL T AX RATE STATE T A X RATE ON P E AK OEMAND CHARCE OFF P E A K ENERCY CHARCE D I S C H A R G E DURATION HRS BATTERY KWH CAPACITY NOMI NAL OUTPUT POWER i n SLOPE OF CONVERTER COST ANNUAL BA T T E R Y CYCLES ANNUAL I NTERRUPTI BLE LOA BAT T E R Y E F F ICIENCY ROUNO T R I P CONVERTER EFF MAI NTANNUAL OPERATI NC ANO MAI CYCLE L I F E OF BAT1LRY KW S H A V E D OFF PEAK BA TTE RY MWH CAPACITY RAT TC R Y O I RECT COST BATTERY DISCOUNT FACTOR B A T T E RY ACCOUNTING FACTO C O N V E R T E R ACCOUNTING F AC BOP A C C O U N T I N G FACTOR
100 100 1000 0 0
. 8 0 0 0 . 8 0 0 0 . 8 0 0 0
.8*4614 .8*46*4 .8*46*415300 2 5 0 0 1700
7650 1 2 5 0 8502 0 0 0 2 0 0 0 2000
500 5 0 0 500. 5 00 0 . 5 0 0 0 . 5 0 0 0
0 0 00 0 0
1 . 16 V 1 . 167 1. 1671 . 1 7 6 1 . 1 7 6 1 . 1 7 61 . 1Ul» 1 . 1*4*4 1 . 1*4*4
0 0 00 0 00 0 00 0 00 0 00 0 00 0 00 0 0
. 67 7 1 . 6 7 7 1 . 67713229 3 2 2 9 3229
1 3 8 2 8 2 1*4*4505 1510086 5 2 8 7 159 750*4
W2172 *462*48 *48*4 768 9 5 8 2 9 1 0 9 8 95027
0 0 00 0 05 5 5
1986 1 9 8 6 19860 0 00 0 00 0 0
67*41 67*4 1 67*4115 15 15
2 2 9 2 2 2 9 2 22927719 1 3 2 2 9 2 5 . 6
9 187*4 9 3 3 9 0 973 19- 6 0 5 8 5 - 2 9 2 7 6 1088
. 0 6 3 1 . 072*4 . 0803
200*4 2 0 0 5 2006
0 0 0500 5 0 0 500
0 0 0. 1100 . 1 10 0 . 1 100.0*4 50 . 0*4 5 0 .0*450. 0 8 0 0 . 0 8 0 0 . 0 8 0 0. 0 5 0 0 . 0 5 0 0 . 0 5 0 0. 0 5 5 0 . 0 5 5 0 . 05 5 0. 8 0 0 0 . 8 0 0 0 . 8 0 0 0. 9 5 0 0 . 9 5 0 0 . 9 5 0 0. *4000 . 6 0 0 0 .UOOO1 . 0 7 0 1 . 0 7 0 1 . 07 0. 3*400 . 3*400 . 3*400. 0 5 0 0 . 0 5 0 0 . 05 0 03 0 . 0 1 3 1 . 3 6 3 2 . 78. 0 2 7 9 . 0 2 9 2 . 0305
500 5 0 0 500. 5 00 0 . 5 0 0 0 . 50 0 0
- . 3 2 0 0 - . 3 2 0 0 - . 3200100 100 100
0 0 0. 8 00 0 . 8 0 0 0 . 8 0 0 0. 8*46*4 . 8*46*4 .8*46*45 90 0 1 5 3 0 0 153002 95 0 7 6 5 0 76502 00 0 2 0 0 0 2000
500 5 0 0 500. 5 00 0 . 5 0 0 0 . 50 0 0
0 0 00 0 0
1 . 167 1 . 167 1 . 1 6 71 . 1 7 6 1 . 1 7 6 1 . 1 7 61 . 1*4*4 1 . 1*4*4 1 . 1*4*4
1 0 0 1 0 0 1 0 0
0 0 0
. 8 0 0 0 . 8 0 0 0 . 8 0 0 0
. 8 * 4 6 * 4 . 8 * 4 6 * 4 . 8 * 4 6 * 4
3 6 0 0 3 6 0 0 5 1 0 0
1 8 0 0 1 8 0 0 2 5 5 0
2 0 0 0 2 0 0 0 2 0 0 05 0 0 5 0 0 5 0 0
. 5 0 0 0 . 5 0 0 0 . 5 0 0 0
0 0 0
0 0 0
1 . 1 6 7 1 . 1 6 7 1 . 1 6 7
1 . 1 7 6 1 . 1 7 6 1 . 1 7 61 . 1 *4*4 1 . 1 * 4 * 4 1 . 1*4*4
0 0 00 0 00 0 00 0 00 0 00 0 00 0 00 0 0
. 6 7 7 1 . 6 7 7 1 . 6 7 7 13 2 2 9 3 2 2 9 3 2 2 9
1 5 7 8 0 3 1 6 * 4 9 0 * 4 1 7 2 3 2 57 7 9 6 8 1 5 1 8 * 4 8 * 4
5 0 3 6 3 5 2 6 5 6 5 * 4 8 0 99 9 6 * 4 3 1 0 * 4 0 9 7 1 0 9 0 3 1
0 0 00 0 05 5 5
1 9 8 6 1 9 8 6 1 9 8 60 0 00 0 00 0 00 0 0
1 5 1 5 1 50 0 0
1 8 7 9 1 8 8 3 2 6 3 69 9 6 * 4 3 1 0 U 0 9 7 1 0 9 0 3 12 9 5 8 1 5 7 1 6 6 8 3 7 3 8. 0 8 6 7 . 0 9 2 2 . 0 9 6 9

98
(3A [ TERY COST CONV COST UU I LOI NC EACTOR B U I L D I N C COST DC EQUIPMENT COST BOP COSTPLANT COST IN M I L L IONS E NGI NE ERI NG COST BATTERY AND CONVERTER EE ANNUAL ENERCY LOST ANNUAL DEMAND SAVI NC BEE STATE TAX E E OERAL TAXANNUAL DEMANO SAVI NC ATTSALVACE VALUEACRS PER PERI OOCATECORYSTARTBATT ANO CONV COSTBC DEPR COSTBOP DEPRACRS BOPBOP CATECORYDE PR E C I AT I O N TAX SAVI NCOVERALL COSTOVERALL BE NE F I TNET PRESENT WORTHAFTER TAX RATE OF RETURN
ENTER SOLVE OPT IONS I NPUT: NORECORO
0 0 00 0 00 0 00 0 00 0 00 0 00 0 00 0 0
. 6 7 7 1 . 6 7 7 1 . 6 7 7 13 2 2 9 1 2 2 9 3 2 2 9
1 8 0 0 7 9 1 8 8 1 8 3 1 9 6 6 8 18 8 8 ? 9 0 ? ? 9 9 9 8
87 189 8 8 ? 8 ? 6 10 161 190914 1 2 0 8 79 1 2 6 1 9 0
0 0 183 300 0 08 8 8
1 98 6 1986 19860 0 00 0 00 0 00 0 0
18 18 180 0 0
3 0 9 0 7 7 9 9 7 7 9 91 1 9 0 9 9 1 2 0 8 7 9 1 9 1 8 2 11 0 9 9 0 ? 1 3 3 8 9 2 1 8 9 9 9 9
. 1 0 0 9 . 109 3 . 1077

APPENDIX G
MODEL AND OUTPUT FOR CASE NUMBER THREE
MOOEL T HESI S READY TOR E D I T . LAST L I N E IS 10?0 I NPUT: L I S T 1MOOEL THESI S VERSI ON OE 0 9 / 2 3 / 8 7 1 6 : 3 310 COLUMNS 1 9 8 6 - 2 0 0 62 0 BALANCE OF PLANT F I X E D COST r 2 8 6 0 0 . 0 30 BATTERY KW CAPACI TY = 1000 9 0 CONVERTER BASE COST= 2 9 0 , 0 80 SALVACE RATE = . 116 0 I NFLATI ON RATE = . 0 9 8 . 0 , 0 , 0 . 0 . 0 . . 0 9 870 DISCOUNT RATE - . 0 88 0 CONTINGENCY RATE = . 0 89 0 SALES TAX - 0 8 8100 BATTERY K - . 81 10 CONVERTER K = . 98120 BOP K = . 9130 INSURANCE RATE = 1 . 0 7190 FEDERAL. TAX RATE = . 3 9180 STATE TAX RATE = . 0 8160 ON PEAK DEMAND CHARCE - I 0 . 8 8 . P R E V I O U S * ( 1 ♦ I NF L A TI ON RATE)170 OFF PEAK ENERCY CHARCE = . 0 2 8 2 0 , PREV I OUS* ( 1 *1 NFLATI ON RATE)180 DISCHARCE DURATI ON HRS = 9190 BATTERY KWH CAPACI TY = 3 00 02 0 0 NOMINAL OUTPUT POWER IN MW - 1 . 02 1 0 SLOPE OF CONVERTER COST CURVE = - . 3 22 2 0 ANNUAL BATTERY CYCLES = 1002 3 0 ANNUAL I NTERRUPTI BLE LOAO S AVI NCS - 02 9 0 BATTERY E F F I C I E N C Y = . 82 8 0 ROUNO TRIP CONVERTER E F F I C I E N C Y = . 9 2 * . 9 22 6 0 M A I N T = 1 7 0 0 , 3 6 0 0 , 3 6 0 0 . 8 1 0 0 . 8 9 0 0 . 1 8 3 0 0 . 2 8 0 0 . 1 7 0 0 . 3 6 0 0 . 3 6 0 0 . '2 7 0 8 1 0 0 . 8 9 0 0 . 1 8 3 0 0 . 2 8 0 0 . 1 7 0 0 . 3 6 0 0 , 3 6 0 0 . 8 1 0 0 . 8 9 0 0 . 1 8 30 02 8 0 ANNUAL OPERATI NC ANO MAI NTENENCE EXPENSE - ( BAT TERY KW C A P A C I T Y / ’2 9 0 1 0 0 0 ) * MA I N T300 CYCLE L I F E OF BATTERY = 2 0 0 0 3 1 0 KW SHAVED OFF PEAK = 1000320 BATTERY MWH CAPACI TY = BATTERY KWH C A P A C I T Y / 100033 0 BATTERY D I RE CT COST - 2 1 1 / ( L O C 1 0 ( 0 ISCHARCE DURATI ON H R S ) * . 787 ) 0 390 BATTERY OI SCOUNT FACTOR = 1 . 1 - . 1 * L O C 1 0 ( BATTERY MWH C A P A C I TY J . O38 0 BATTERY ACCOUNTI NG FACTOR= ( I NSURANCE RATE* ( 1 * 8 AT T E R Y K * ( S A L E S T A X ) ) ' 360 - CONTI NGENCY RATE)3 7 0 CONVERTER ACCOUNTI NG FACTOR=( I NSURANCE RATE* ( 1 - CONVERTER K * '3 8 0 ( SAL ES T A X ) ) - CONTI NCENCY RATE)3 9 0 BOP ACCOUNTI NG FACTOR= ( INSURANCE R A T E - ( 1 - B O P K * ( S A L E S T A X ) ) '9 0 0 ♦CONTI NGENCY RATE)9 1 0 BATTERY COST = BATTERY DI RECT COST - BATTERY ACCOUNTI NG FACTOR'9 2 0 - BATTERY OI SCOUNT FA C T O R . 09 3 0 CONV COST - CONVERTER ACCOUNTI NG FAC TOR- ( CONVERTER BASE CO S T * '9 9 0 XPOWERY( NOMI NAL OUTPUT POWER IN M W . ’9 8 0 SLOPE OF CONVERTER COST CURVE) )9 6 0 B U I L D I N C f ACTOR = BATTERY MWH C A P A C I T Y / ( 1 . 3 2 * '9 7 0 L O C 1 0 ( 0 ISCHARCE DURATI ON H R S ) - 1 ) , 09 8 0 B U I L D I N G COST - 12 7 -XPOWERY ( B U I L D I N C FAC TOR, . 7 6 8 ) * TOOC. 09 9 0 DC EQUI PMENT COST r 1 7 . 3-XPOWERY ( BATTERY MWH CAPAC I TY . .’ 99 I ) * '8 0 0 XPOWERYf DI SCHARCE DURATI ON H R S . - . 6 7 7 ) • 1000 08 1 0 BOP COST = BOP ACCOUNTING FAC TOR• ( BALANCE OF PLANT F I XE D C O S T * '8 2 0 B U I L D I N G COST-DC EQUI PMENT C O S T J . U8 3 0 PLANT COST I N M I L L I O N S - ( B OP COST - ( B AT T E R Y COST '8 9 0 - BA T T E R Y KWH CAPAC I T Y ) ♦ ( CONV C O S T * '8 8 0 BATTERY KW CAPAC I T Y ) ) / 1 0 0 0 0 0 0 . 08 6 0 ENGI NEERI NG C O S T ^ I f PLANT COST I N M I L L I O N S . G E . . 8 6 THEN'8 7 0 ( 1 8 8 - X P 0 WE R Y ( P L A N T COST IN M I L L I O N S , '8 8 0 P L ANT COST I N M I L L I O N S / - 8 8 7 ) ) * 1000 ELSE 1 6 1 0 0 0 . 08 9 0 BATTERY AND CONVERTER E F F I C I E N C Y = 8ATTERY E F F I C I E N C Y - '6 0 0 ROUNO TRI P CONVERTER E F F I C I E N C Y6 1 0 ANNUAL ENERCY LOST = CYCLE L I F E OF BA T TERY- BATTERY KWH CAPAC I T Y - ( 1 - ' 6 2 0 BATTERY ANO CONVERTER E F F I C I E N C Y ) / '6 3 0 ANNUAL BATTERY CYCLES6 9 0 ANNUAL DEMANO SAVI NG BEFORE TAX - KW SHAVED OFF P E A K * '6 8 0 ON PEAK DEMAND C H A R C E * 126 6 0 STATE TAX (ANNUAL DEMANO SA V I NC BEFORE TAX'
- ANNUAL OPERATI NC ANO MAI NTENENCE E X P E N S E - '(ANNUAL ENERGY LOST- OF F PEAK ENERCY C H A R C E ) ) '• STATE TAX RATE
- (ANNUAL DEMANO S A V I N C BEFORE TAX- STATE T A X '- ANNUAL OPERATI NC AND MAI NTENENCE E X P E N S E - '(ANNUAL ENERCY LOST- OF F PEAK ENERGY C H A R G E ) ) '• EEDERAl TAX RATE
790 ANNUAL DEMANO SAVI NC AFTER TAX ANNUAL DEMAND SA VI NC BEFORE T A X - ’ 780 ( STATE TAX ♦ FEDERAL TAX)760 SALVACE VALUE - SAI VACE RA T E - PR E V I O U S 20 BATTERY DI RECT COST • '
67 06 8 06 9 0700 FEDERAL TAX710720730

770 BATTERY KWH CAPACI TY780 ACRS OEPR( CATEGORY. START. BC OEPR COST.ACRS PER PERI OD)790 CATECORY = 8 800 START - 1986810 BATT ANO CONV COST - BATTERY DI RECT COST ‘ BATTERY KWH CAPACI 1Y ♦ '820 ( (CONVERTER BASE COST‘ XPOWERY( '830 NOMINAL OUTPUT POWER I N MW. '890 SLOPE OE CONVERTER COST C U R V E ) ) '880 ‘ BATTERY KW CAPACI TY)860 BC DEPR COST - ( BATT ERY DI RECT COS T‘ BAT TERY KWH C A P A C I T Y * ! '870 1-SALVACE R A I E ) ) ♦ ( (CONVERTER BASE COST‘ XPOWI R Y ( '88 0 NOMINAL OUTPUT POWER IN MW. '890 SLOPE Of CONVERTER COST CURVE) ) * BA 1 TERY KW C A P A C I TY )900 BOP DEPR = BOP COST/BOP ACCOUNTING FACTOR91 0 ACRS OEPR( BOP CATECORY. S T A R T . BOP DEPR.ACRS BOP)920 BOP CATECORY = 18930 DE PR E C I AT I O N TAX SAVI NC^ ACRS PER PER 1 0 0 ‘ FEOERAL TAX R A T E * '990 ACRS BOP*F EDERAL TAX RATE980 OVERALL COST= ( PLANT COST IN M I L L I O N S * 1 0 0 0 0 0 0 ) ♦ ENCI NEERI NC COST ♦ ' 9 6 0 (ANNUAL ENERCY L O S T * '970 OFF PEAK ENERCY CHARCE) ♦ ( ANNUAL OPERATI NC AND MAINTENENCE EXPENSE)9 8 0 OVERALL BENEFI T = ANNUAL DEMANO SAVI NC AFTER TAX ♦ SALVACE VALUE ♦ ' 990 ANNUAL I NTERRUPTI BLE LOAD SAVI NCS ♦ '1000 DE PRECI AT I ON TAX SAVI NC1010 NET PRESENT WORTH = NPVC( OVERALL B E N E F I T . D I SCOUNT RATE. OVERALL COST) 1020 AFTER TAX RATE OF RETURN - I R R ( OVERALL BENEF I T . OVERALL COST)END OF MOOFL INPUT; NORtCORD

MODEL THESI S REAOY FOR ED I T . LAST L I NE IS 10201 N P U l :: SOLVEMOOEL THESI S VERSI ON Of 0 9 / 2 3 / 8 7 16:: 6 7 - - 2 1ENTER SOLVE OP TIONSI NPUT: : ALL
COLUMNS 62 V A R I AB L L S
BALANCE Of PLANT F I X E D CBAT I f RY KW CAPACI TYCONVERTER BASE COSTSALVACC RATEI NE L A T I ON RATEDI SCOUNT RATECONTI NCENCY RATESALES TAXBATTERY KCONVERTER KBOP KINSURANCE RATE FEDERAL TAX RATE STATE TAX RATE ON PEAK DEMANO CHARCE O f f PEAK ENERCY CHARCE 0 1 SCHARCE DURATI ON HRS BATTERY KWH CAPACI TY NOMINAL OUTPUT POWER IN SLOPE OE CONVERTER COST ANNUAL BATTERY CYCLES ANNUAL I NTERRUPTI BL E LOA BATTERY E E E I C I E N C Y ROUND T R I P CONVERTER EEE M A I N !ANNUAL OPERATI NC ANO MAI CYCLE L I F E OE BATTERY KW SHAVED OFF PEAK BATTERY MWH CAPACI TY BATTERY D I RE CT COST BATTERY OI SCOUNT FACTOR BATTERY ACCOUNTI NG FACTO CONVERTER ACCOUNTI NG FAC BOP ACCOUNTI NG FACTOR BATTERY COST CONV COST B U I L D I N C FACTOR B U I L O I N C COST DC EQUI PMENT COST BOP COSTPLANT COST IN M I L L I O N S E N C I NE E R I NC COST BATTERY ANO CONVERTER EE ANNUAL ENERCY LOST ANNUAL OEMANO SAVI NC RTF STATE TAX FEDERAL TAXANNUAL DEMANO SAVI NC Af TSAl VACE VAl UEACRS PER PERI ODCA T ECOR YSTARTBATT AND CONV COSTBC OEPR COSTBOP DEPRACRS BOPBOP CATEGORYD E P R E C I AT I O N TAX SAVI NGOVERALL COSTOVE RALL BE NEE I TNE T PRESENT WOR TMAE TER TAX RATE Of RETURN
BALANCE OF PLANT f I XE D C BA T TE Ry KW CAPACI TY CONVERTER BASE COST SALVACE RATE I NE l A I I ON RATE DI SCOUN1 RATE
1986 1987 1 98 8
2 8 6 0 0 0 01000 1000 1 00 02 9 0 0 0
. 1 t o o . 1100 . 1 100
. 0 9 6 0 0 0
. 0 8 0 0 . 0 8 0 0 . 0 8 0 0
. 0 6 0 0 . 0 6 0 0 . 0 6 0 0
. 0 6 6 0 . 0 6 6 0 . 0 6 6 0
. 8 0 0 0 . 8 0 0 0 . 8 0 0 0
. 9 6 0 0 . 9 6 0 0 . 9 6 0 0
. 9 0 0 0 . 9 0 0 0 . 9 0 0 01 . 0 7 0 1 . 0 7 0 1 . 0 7 0. 3 9 0 0 . 3 9 0 0 . 3 9 0 0. 0 6 0 0 . 0 6 0 0 . 0 6 0 01 0 . 6 8 1 0 . 6 8 1 0 . 6 8. 0 2 8 2 . 0 2 8 2 . 0 2 8 2
9 9 93 00 0 3 0 0 0 3 0 0 0
- . 3 2 0 0 - . 3 2 0 0 - . 3 2 0 0100 100 100
0 0 0. 8 0 0 0 . 8 0 0 0 . 8 0 0 0. 8 9 6 9 . 8 9 6 9 . 8 9 6 9
1 700 3600 3 6 0 01 700 3 60 0 3 6 0 02 0 0 0 2 0 0 0 2 0 0 01000 1000 1 00 0
3 3 31 6 6 . 3 0 01 . 0 6 2 0 01 . 1 6 7 1 . 1 6 7 1 . 1 6 71 . 1 7 6 1 . 1 7 6 1 . 1 761 . 1 9 9 1 . 1 9 9 1 . 1991 9 0 . 7 0 0
2 8 2 . 2 0 01 . 6 7 2 0 0
1 8 8 1 9 6 0 0190 29 0 0
2 6 9 6 1 8 0 01 . 1 2 9 0 0
187 971 0 0. 6 7 7 1 . 6 7 7 1 . 6 7 7 119 3 7 3 19 3 7 3 193 73
1 2 6 9 6 0 126 9 6 0 1 2 6 9 6 06 2 3 6 6 19 1 6 19 1
9 0 2 8 3 39669 3 9 6 6 98 0 9 9 2 8 1160 8 1 160
0 0 098 1 79 193 996 1 3 7 9 6 1
6 6 61986 1986 1986
7 0 6 7 6 3 0 06 6 9 6 2 9 0 02 3 6 7 7 6 0 0
1 1 789 2 3 6 7 7 2 1 2 2 016 16 16
373 89 6 6 9 7 6 6 3 9 9 81 3 1 90 69 9 196 9 196
1 1 78 3 1 1 38 126 1 3 6 0 9 9' 2 0 9 9 6 6 - 10903 76 - 9 8 6 6 8 9
1992 1993 1999
0 0 01000 1000 1000
0 0 01 100 . 1 1 0 0 . 11000 9 6 0 . 09 60 . 0 9 6 00 8 0 0 . 0 8 0 0 . 0 8 0 0
1989 1990 199 1
0 0 01000 1000 101)0
0 0 0. 11 0 0 . 1 1 0 0 . 1 100
0 0 0. 0 8 0 0 . 0 8 0 0 . 0 8 0 0. 0 6 0 0 . 0 6 0 0 . 0 6 0 0. 0 6 6 0 . 0 6 6 0 . 0 6 6 0. 8 0 0 0 . 8 0 0 0 . 8 0 0 0. 9 6 0 0 . 9 6 0 0 . 9 6 0 0. 9 0 0 0 . 9 0 0 0 . 9 0 0 01 . 0 7 0 1 . 0 7 0 1 . 0 70. 3900 . 3 9 0 0 . 3 9 0 0. 0 6 0 0 . 0 6 0 0 . 0 6 0 01 0 . 68 1 0 . 6 8 1 0 . 6 8. 02 8 2 . 0 2 8 2 . 0 2 8 2
9 9 93000 3 0 0 0 3 0 0 01 1 1
- . 3 2 0 0 - . 3 2 0 0 - . 3 2 0 0100 100 100
0 0 0. 8 0 0 0 . 8 0 0 0 . 8 0 0 0. 89 6 9 . 8 9 6 9 . 8 9 6 96 10 0 6 9 0 0 16 30 06 10 0 6 9 0 0 1 6 3 0 02 00 0 2 0 0 0 2 0 0 01000 1000 1000
3 3 30 0 00 0 0
1 . 167 1 . 1 6 7 1 . 1 6 71 . 1 7 6 1 . 1 7 6 1 . 1 7 61 . 19 9 1 . 1 9 9 1 . 1 9 9
0 0 00 0 00 0 I)0 0 00 O 00 0 00 (' 00 0 0
. 677 1 . 6 7 7 1 . 6 7 7 1193 73 193 7 3 193 73
126960 1 2 6 9 6 0 1 2 6 9 6 06 0 6 6 6 0 2 6 6 6 6 6
39 189 3 8 9 2 6 3 6 8 9 08 1 / 10 8 2 0 0 8 8 6 6 16
0 0 01 3 796 1 137 961 0
6 6 61986 1986 1986
0 0 00 0 00 0 0
18862 1 6 6 0 9 16 6 0 916 16 1 6
6 3 196 6 2 3 9 6 6 6 1 16696 6 9 9 6 1 6 8 9 6
1 39866 1 39 363 9 112 6- 8 9 2 0 9 3 - 8 0 6 3 9 3 - 768 702
1996 1996 199 7
0 (3 01000 1000 1000
0 0 0i i oo . 1 100 . 1100
0 9 6 0 . 0 9 6 0 . 0 9 6 00 8 0 0 . 0 8 0 0 . 0 8 0 0

102
C O N I 1 NCENCY RATE . 1)600 . 0 6 0 0 . 0 6 0 0 . 0 6 0 0 . 0 6 0 0 . 0 6 0 0s a l e s rAX . 0 6 6 0 . 0 6 6 0 . 0 6 6 0 . 0 6 6 0 . 0 6 6 0 . 0 6 6 0BATTERY K . 8 0 0 0 . 8 0 0 0 . 8 0 0 0 . 8 0 0 0 . 8 0 0 0 . 8 0 0 0CONVERTER K . 9 6 0 0 . 9 6 0 0 . 9 6 0 0 . 9 6 0 0 . 9 6 0 0 . 9 6 0 0BOP K . UOOO . UOOO . UOOO . UOOO . UOOO . UOOOINSURANCE RATE 1 . 0 7 0 1 . 0 7 0 1 . 0 7 0 1 . 0 70 1 . 0 70 1 . 0 7 0EEDERAL TAX RATE . 3U00 . 3U00 . 3U00 . 3 UOO . 3**00 . 3UOOSTATE TAX RATE . 0 6 0 0 . 0 6 0 0 . 0 6 0 0 . 0 6 0 0 . 0 6 0 0 0 6 0 0ON PTAK OEMAND CHARCE 1 T . 0 6 H . 6 6 1 2 . 0 7 1 2 . 6 2 1 3 . 1 8 1 3 . 7 8OE E PEAK ENERGY CHARCE . 0 2 9 6 . 0 3 0 8 . 0 3 2 2 . 0 3 3 6 . 0 3 6 1 . 0 3 6 7DI SCHARGE DURATION HRS U U U U U UBATTERY KWH CAPACI TY 3 0 0 0 3000 3 0 0 0 3 0 0 0 3000 3 00 0NOMINAL OUTPUT POWER IN 1 1 1 1 1 1SLOPE OE CONVERTER COST - . 3 2 0 0 - . 3 2 0 0 - . 3 2 0 0 - . 3 2 0 0 - . 3 2 0 0 - . 3 2 0 0ANNUAL BATTERY CYCLES TOO 100 100 100 100 100ANNUAL I NTERRUPTI BLE LOA 0 0 0 0 0 0BATTERY EF E I CI ENCY . 8 0 0 0 . 8 0 0 0 . 8 0 0 0 . 8 0 0 0 . 8 0 0 0 . 8 0 0 0ROUND T R I P CONVERTER EEf . 8U6U . 8U6U . 8U6U . 8U6U . 8U6U . 8U6UMAI NT 2 6 0 0 1 700 3 6 0 0 3 6 0 0 6 100 6 9 0 0ANNUAL OPERATI NC AND MAI 2 6 0 0 1 700 3 6 0 0 3 60 0 6 100 6 9 0 0CYCLE L I T E OE BATTERY 2 0 0 0 2 0 0 0 2 0 0 0 2 0 0 0 2 0 0 0 2 0 0 0KW SHAVED OEE PEAK 1000 1000 1000 1000 1000 1000BATTERY MWH CAPACI TY 3 3 3 3 3 3BATTERY DI RECT COST 0 0 0 0 0 0BATTERY DI SCOUNT EACTOR 0 0 0 0 0 0BATTERY ACCOUNTING FACTO 1 . 167 1 . 167 1 . 1 6 7 1 . 167 1 . 167 1 . 1 6 7CONVERTER ACCOUNTING EAC 1 . 1 7 6 1 . 1 7 6 1 . 1 7 6 1 . 1 7 6 1 . 1 7 6 1 . 1 7 6BOP ACCOUNTING EACTOR 1 . 1UU 1 . 1 UU 1 . 1 UU 1 . 1UU 1 . 1 UU 1 . 1UUBATTERY COST 0 0 0 0 0 0CONV COST 0 0 0 0 0 0B U I L D I N C EACTOR 0 0 0 0 0 0B U I L D I N C COST 0 0 0 0 0 0DC EQUI PMENT COST 0 0 0 0 0 0BOP COST 0 0 0 0 0 0PLANT COST IN M I L L I O N S 0 0 0 0 0 0ENGI NEER INC COST 0 0 0 0 0 0BATTERY AND CONVERTER EE . 6 7 7 1 . 6 7 7 1 . 6 7 7 1 . 6 7 7 1 . 6 7 7 1 . 6 7 7 1ANNUAL ENERCY LOST 19373 193 73 193 73 19373 1 93 73 19373ANNUAL DEMANO SAVI NC BEE 132 673 1386 U3 1UU882 16 1U02 1 6 8 2 1 6 1 6 6 3 3 6STATE TAX 6U80 6 8 1 7 7 03 3 7 3 6 8 7622 79 36EEDERAL TAX U 1862 UUOUO U6U33 U 76 30 U 9 2 3 6 6 1268ANNUAL OEMAND SAVI NC AET 8 U 3 3 2 8 7 7 8 6 92U 1 7 9 6 6 16 1 0 1 3 6 7 106131SALVACE VALUE 0 0 0 0 0 0ACRS PER PER 100 0 0 0 0 0 0CATECORY 6 6 6 6 6 6START 1986 1986 1986 1986 1986 1986BATT ANO CONV COST 0 0 0 0 0 0BC OEPR COST 0 0 0 0 0 0BOP DEPR 0 0 0 0 0 0ACRS BOP IU IU6 1U 1U6 IU 1U6 1U 1U6 1U 1U6 IU 1U6BOP CATECORY 16 16 16 16 16 16D E PR ECI AT I O N TAX SAVI NG U8 10 U8 10 U8 10 U8 10 U8 10 U8 10OVERALL COST 307 1 2 2 9 7 U22 3 U26 1 6 7 8 1 6 6 1 1OVERALL BENEf ' T 89 IU 1 9 2 6 9 6 9 7 2 2 6 1 0 1 3 2 6 1 0 6 1 6 7 1 109U 1NET PRESENT WORTH - 70862U - 6 6 9 9 3 8 - 6 1 3 6 8 2 - 6 6 8 7 7 6 - 6 2 6 9 2 0 - U 8 U 7 0 0AFTER TAX RATE OE RETURN
1998 1999 2 0 0 0 2 0 0 1 2 0 0 2 2 0 0 3
BALANCE OE PLANT F I XE D C 0 0 0 0 0 0BATTERY KW CAPAC1TY 1000 1000 1000 1000 1000 1000CONVERTER BASE COST 0 0 0 0 0 0SALVACE RATE . 1 1 0 0 . 1 100 . 1 100 . 1 1 0 0 . 1 1 0 0 . 1 100I NF L A T I ON RATE . 0 9 6 0 . 0U6 0 . 0 U 6 0 . 0U6 0 . 0 U 6 0 . OU 60DI SCOUNT RATE . 0 8 0 0 . 0 8 0 0 . 0 8 0 0 . 0 8 0 0 . 0 8 0 0 . 0 8 0 0CON T 1NCENCY RA TE . 0 6 0 0 . 0 6 0 0 . 0 6 0 0 . 0 6 0 0 . 0 6 0 0 . 0 6 0 0SALES TAX . 0 6 6 0 . 0 6 6 0 . 0 6 6 0 . 0 6 6 0 . 0 6 6 0 . 0 6 6 0BATTERY K . 8 0 0 0 8 0 0 0 . 8 0 0 0 . 8 0 0 0 8 0 0 0 . 8 0 0 0CONVERTER X . 9 6 0 0 . 9 6 0 0 . 9 6 0 0 . 9 6 0 0 . 9 6 0 0 9 6 0 0BOP K . UOOO . UOOO . UOOO . UOOO . UOOO UOOOINSURANCE RATE 1 . 0 7 0 1 . 0 7 0 1 . 0 7 0 1 . 0 7 0 1 . 0 70 1 . 0 70F EOERAL TAX RATE . 3U00 . 3 UOO . 3U00 . 3U00 . 3**00 . 3U00STATE TAX RATE . 0 6 0 0 . 0 6 0 0 . 0 6 0 0 . 0 6 0 0 . 0 6 0 0 . 0 6 0 0ON PEAK DEMANO CHARCE 1U . UO 1 6 . 0 6 1 6 . 7 2 1 6 . U3 1 7 . 1 / 1 7 . 9UOFF PEAK ENERCY CHARCE . 038U . DUO 1 .OU 19 . OU 38 . 0 U 6 8 . OU 78DI SCHARCE DURATION HRS U u U U U I*BATTERY KWH CAPAC1TY 3000 3 0 0 0 3 0 0 0 3 00 0 3 0 0 0 3 0 0 0NOMINAl OUTPUT POWER IN 1 1 1 1 1 1SLOPE OE CONVERTER COST - . 3 2 0 0 O c - . 3 2 0 0 O o - . 3 2 0 0 - . 3 2 0 0

103
A N N U A I H A I 11 H Y C Y C l I S A N N U A I I N K R K U P I I 111 I I OA H A I I ! H Y I I I I C M N C Y H O U N D I K I P C O N V I H I I K ( I I MA I N 1A N N U A I 01*1 H A I I N C A NO M A IC Y C l I I I I I Ol H A I I I H YKW S I I A V I O Ol I H I AKHA I I I H Y MWH C A C A O I I YH A I I I H Y 0 1 H I C l C O S IH A I I I H Y O I S C O U N t I AC I OHH A I I I K Y A C C O U N I I N G 1 A C I 0C O N V I H I I K A C C O U N I I N C I ACH O C A C C O U N T I N G I A C T OHHAT I I K Y C O S TC O N V C O S TH U H 0 1 N C T A C T OHH U H 0 I N C C O S TOC I Q U I H M F N T C O S IHOC C O S TP I ANT C O S T I N M I L L I O N Sf N C I N C C R I N C C O S TB A T T l R Y A N D C O N V E R T E R £ fA N N U A L E N E R C Y L O S TA N N U A L D E M A N D S A V I N C BEES T A T E T A Xf E O E R A L T A XA N N U A L O E M A N O S A V I N C A F TS A L V A C E V A L U EA C R S P E R P E R I O OC A T E C O R YS T A R TB A T T A N D C O N V C O S TBC O E P R C O S TBO P O E P RA C R S B O PBO P C A T E C O R YD E P R E C I A T I O N T A X S A V I N CO V E R A L L C O S TO V E R A L L B E N E F I TN E T P R E S E N T W O R T HA F T E R T A X R A T E OF R E T U R N
B A L A N C E OF P L A N T F I X E O CB A T T E R Y KW C A P A C I T YC O N V E R T E R B A S E C O S TS A L V A C E R A T EI N F L A T I O N R A T E
O I S C O U N T R A T EC O N T I N G E N C Y R A T ES A L E S t a x
B A T T E R Y KC O N V E R T E R KBOP KI N S U R A N C E R A T E F E D E R A L T A X R A T E S T A T E T A X R A T E ON P E A K D E M A N O C H A R C E O F F P E A K E N E R C Y C H A R C E D 1S C H A R C E D U R A T I O N H R S B A T T E R Y KWH C A P A C I T Y N O M I N A L O U T P U T PO W E R I N S L O P E OF C O N V E R T E R C O S T A N N U A L B A T T E R Y C Y C L E S A N N U A L I N T E R R U P T I B L E L O A B A T T E R Y E F F I C I E N C Y R O U N D T R I P C O N V E R T E R E F F M A I NTA N N U A L O P E R A T I N C A NO M A I C Y C L E L I F E OF B A T T E R Y KW S H A V E D O F F P E A K B A T T E R Y MWH C A P A C I T Y B A T T E R Y O I R E C T C O S T B A T T E R Y D I S C O U N T F A C T O R B A T T E R Y A C C O U N T I N G F A C T O C O N V E R T E R A C C O U N T I N G F A C BO P A C C O U N T I N G F A C T O R
t o i l 1(10 10(10 (1 I I. B O O K . 8 0 0 0 . 8 0 0 0. 8*46*4 . 8*16*4 . 8*16*4I S 3 0 0 2 S O O 1 7 0 0I S 3 0 0 2 5 0 1 1 1 7 0 0
2 0 0 0 2000 2000I O O O IO O O IO O O
3 3 3o 0 Oo 0 O
1 . I F . / l . l F) / 1 . 1 6 /1 . 1 /F. 1.1 /F. 1. 1 / 01 . I N N 1 . 1*4*4 1 1*4*40 0 o0 O oO 0 oO 0 o0 o 00 0 00 0 00 0 0
. 6 7 7 1 . 6 7 7 1 . 6 7 7 11 9 3 7 3 1 9 3 7 3 1 9 3 7 3
1 7 2 7 7 5 1 8 0 5 5 0 1 8 8 6 7 57 8 3 7 8 8 6 * 4 9 3 0 8
5 0 6 2 * 1 5 7 2 5 9 6 0 1 3 11 1 6 3 I U 1 1*4*427 1 1 9 2 3 60 0 00 0 0
5 5 51 9 8 6 1 9 8 6 1 9 8 60 0 00 0 00 0 0
1*4 1*46 1*4 1*46 1*4 1*461 5 1 5 1 5
* 4 8 1 0 * 4 8 1 0 * 4 8 1 01 6 0 * 4 3 3 2 7 7 2 5 1 2
1 1 9 1 2 * 4 1 1 9 2 3 7 1 2 * 4 0 * 4 6- * 4 * 4 7 2 6 9 - * 4 0 7 8 7 9 - 3 6 9 6 2 9
. 0 0 8 * 4 . 0 1 9 * 4 . 0 2 8 7
2 0 0 * 4 2 0 0 5 2 0 0 6
0 0 01000 1000 10000 0 0. T 1 0 0 . 1 1 0 0 . 1 1 0 0. 0 * 4 5 0 . 0 * 4 5 0 . 0 * 4 5 0. 0 8 0 0 . 0 8 0 0 . 0 8 0 0. 0 5 0 0 . 0 5 0 0 . 0 5 0 0. 0 5 5 0 . 0 5 5 0 . 0 5 5 0. 8 0 0 0 . 8 0 0 0 . 8 0 0 0. 9 5 0 0 . 9 5 0 0 . 9 5 0 0. * 4 0 0 0 . * 4 0 0 0 . * 4 0 0 01 . 0 7 0 1 . 0 7 0 1 . 0 7 0. 3 * 4 0 0 . 3 * 4 0 0 . 3 * 4 0 0. 0 5 0 0 . 0 5 0 0 . 0 5 0 01 8 . 7 5 1 9 . 5 9 2 0 . *48. 0 5 0 0 . 0 5 2 2 . 0 5 * 4 6
*4 *4 *43 0 0 0 3 0 0 0
J3 0 0 0
]
- . 3 2 0 0 - . 3 2 0 0 - . 3 2 0 0100 100 1000 0 0. 8 0 0 0 . 8 0 0 0 . 8 0 0 0.8* 4 6 *4 . 8*46*4 .8 *4 6 *4
S 9 0 C I S 3 0 0 1 5 3 U C5 9 0 0 1 5 3 0 0 1 5 3 0 02000 2000 20001000 IO O O 1000
3 3 30 0 00 0 01 . 1 6 7 1 . 1 6 7 1 . 1 6 71 . 1 7F. 1 . 1 7 6 1 . 1 7 61 . 1 <4 '4 1 . 1*4*4 1 . 1*4*4
10(1 too 10(1(1 o O
. 800(1 . 8000 . 8 0 0 0
. 8*46*1 . 8*16*4 . 8*46*43600 3600 S IOO3600 3600 S IOO2 0 0 0 2000 2 0 0 010(10 IOOO IOOO
. 0 0 II0 0 ()
1 . 1 6 / 1 . 16/ 1 . IF./1 . 1/6 1 . 1 / 6 1 . 1 / 61 . 1*4*4 1 1*4*4 1 . 1*4*4
0 0 O0 0 1)0 0 O0 0 00 0 O0 0 O0 0 O0 0 O
. 6 7 7 1 . 6 7 / 1 .677 1193 73 19373 19373
197165 20 6 0 3 7 2 1 5 3 0 99 6 3 6 10078 10*46*4
622*47 65101 6 7 5 9 8125282 130859 1372*4 7
0 0 00 0 05 5 5
1986 1986 19860 0 00 0 00 0 00 0 0
15 15 150 0 0
<4*4*46 *4*487 60 2 6125282 130859 1 372*47
-33*4*463 -300*406 - 2 6 7 6 8 9.0 3 6 3 .0*430 .0*488

104
B A T T E R Y C O S T C O N V CO ST B U I L D I N C F A C T O R B U I L D I N C C O S T OC E Q U I P M E N T C O S T B O P C O S TP L A N T C O S T I N M I L L I O N S E N G I N E E R I N G C O S T B A T T E R Y A N O C O N V E R T E R EF A N N U A L E N E R G Y L O S T A N N U A L D E M A N O S A V I N G BEE S T A T E TAX F E O E R A L T A XA N N U A L D E M A N O S A V I N C A F TS A L V A C E V A L U EA C R S PE R P E R I O OC A T E C O R YS T A R TB A T T AND C O N V C O S TB C O E P R C O S TB O P O EP RA C R S BOPB O P C A T E C O R YD E P R E C I A T I O N TAX S A V I N CO V E R A L L C O S TO V E R A L L B E N E F I TN E T P R E S E N T WOR THA F T E R T A X R A T E OF R E T U R N
0 0 00 0 00 0 00 0 00 0 00 0 00 0 00 0 0
. 6 7 7 1 . 6 7 7 1 . 6 7 7 119 3 7 3 1 9 3 7 3 1 9 3 7 3
2 2 4 9 9 8 2 3 6 123 2 4 6 7 0 31 0 9 0 6 1 0 9 4 1 1 14677 0 4 6 6 7 0 6 7 6 7 4 0 7 9
1 4 3 6 3 6 1 6 3 6 0 6 1 6 0 1 6 70 0 6 1 2 3 40 0 06 5 5
19 8 6 1 9 8 6 19 860 0 00 0 00 0 00 0 0
16 16 160 0 0
6 8 6 8 1 6 3 12 1 6 3 6 71 4 3 6 3 6 1 6 3 6 0 6 2 1 1 3 9 1
- 2 3 6 1 2 6 - 2 0 6 9 7 0 - 1 6 8 4 8 6. 0 6 3 9 . 0 6 8 1 . 0 6 3 2
E N T E R S O L V E O P T I O N S I N P U T : N O R E C O R O

105
APPENDIX H
MODEL AND OUTPUT FOR CASE NUMBER FOUR
M O D E L T H E S I S R E A D Y F O R E D I T , L A S T L I N E I S 1 0 2 0
I N P U T : L I S T 1M O D E L T H E S I S V E R S I O N OF 0 9 / 2 3 / 8 7 1 7 : 0 61 0 COLUMNS 1 9 8 6 - 2 0 0 62 0 B A L A N C E OF P L A N T F I X E D C O S T - 2 8 6 0 0 , 0 3 0 B A T T E R Y KW C A P A C I T Y = 1 0 0 0U O C O N V E R T E R B A S E C 0 S T = 2 6 0 , 0 S O S A L V A C E R A T E - . 1 16 0 I NF L A T I ON RATE = . 0 6 5 , 0 , 0 , 0 , 0 , 0 , . 0 6 57 0 DI SCOUNT RATC = . 0 88 0 C O N T I N G E N C Y R A T E = . 0 59 0 S A L E S T A X = . 0 5 51 0 0 B A T T E R Y K = . 81 1 0 C O N V E R T E R K = . 9 51 2 0 B O P K = . 61 3 0 I N S U R A N C E R A T E = 1 . 0 71 6 0 F E D E R A L T A X R A T E = . 3 61 5 0 S T A T E T A X R A T E = . 0 5 „1 6 0 ON P E A K D E M A N O C H A R C E = 1 0 . 5 8 . P R E V I O U S * ( 1 ♦ I N F L A T I O N R A T E )1 7 0 O F F P E A K E N E R C Y C H A R C E = . 0 2 8 2 0 . P R E V I O U S - ( 1 ♦ I N F L A T I ON R A T E )1 8 0 D I S C H A R C E OURA T I O N H R S = 11 9 0 BATTERY KWH C A P A C I T Y = 5 0 02 0 0 N O M I N A L O U T P U T P O W E R I N MW = 1 . 02 1 0 S L O P E OF C O N V E R T E R C O S T C U R V E = - . 3 22 2 0 A N N U A L . B A T T E R Y C Y C L E S = 1 0 02 3 0 A N N U A L I N T E R R U P T I B L E L O A D S A V I N C S = 02 6 0 B A T T E R Y E F F I C I E N C Y = . 82 5 0 R O U N D T R I P C O N V E R T E R E F F I C I E N C Y = . 9 2 * . 9 22 6 0 MA I N T = 1 7 0 0 , 3 6 0 0 . 3 6 0 0 , 5 1 0 0 , 5 9 0 0 . 1 5 3 0 0 . 2 5 0 0 , 1 7 0 0 . 3 6 0 0 . 3 6 0 02 7 0 5 1 0 0 . 5 9 0 0 , 1 5 3 0 0 , 2 5 0 0 , 1 7 0 0 , 3 6 0 0 , 3 6 0 0 . 5 1 0 0 , 5 9 0 0 , 1 5 3 0 02 8 0 A N N U A L O P E R A T I N C A N O M A I N T E N E N C E E X P E N S E = ( B A T T E R Y KW C A P A C I T Y /2 < j Q 1 0 0 0 ) * M A I N T
3 0 0 C Y C L E L I F E OF B A T T E R Y = 2 0 0 0J 1 0 KW S H A V E D O F F P E A K = 1 0 0 0 ,3 2 0 BATTERY MWH C A P A C I T Y * B A T T E R Y KW H C A P A C I T Y / 1 0 0 0_> 3 0 B A T T E R Y D I R E C T C O S T = 2 1 1 / ( L O C 1 0 ( D I S C H A R C E O U R A T I O N H R S ) * 7 5 7 . 03 6 0 B A T T E R Y D I S C O U N T F A C T O R = 1 . 1 - . 1 " L O C 1 0 ( B A T T E R Y MWH C A P A C t T Y ) 0 3 5 0 B A T T E R Y A C C O U N T I N G F A C T O R = ( I N S U R A N C E R A T E * ( 1 ♦ B A T T E R Y K - ( S A L E S T A X ) ) 3 (S 0 ♦ C O N T I N G E N C Y R A T E )3 7 0 C O N V E R T E R A C C O U N T I N G F A C T O R = ( I N S U R A N C E R A T E “ ( 1 ♦ C O N V E R T E R K *3 8 0 ( S A L E S T A X ) ) * C O N T I N G E N C Y R A T E )3 9 0 B O P A C C O U N T I N G F A C T O R = ( I N S U R A N C E R A T £ - ( 1 » B 0 P K * ( S A L E S T A X ) ) '( . 0 0 ♦ C O N T I N G E N C Y R A T E )6 1 0 B A T T E R Y C O S T = B A T T E R Y O I R E C T C O S T “ B A T T E R Y A C C O U N T I N G F A C T O R ( 4 ? 0 “ B A T T E R Y O I S C O U N T F A C T O R , 06 3 0 C O N V C O S T = C O N V E R T E R A C C O U N T I N G F A C T O R - ( C O N V E R T E R B A S E C O S T - (4(40 XPOWER Y ( N O M I N A L O U T P U T P O W E R I N M W ,U 5 0 S L O P E OF C O N V E R T E R C O S T C U R V E ) )6 6 0 B U I L O I N C F A C T O R = B A T T E R Y MWH C A P A C I T Y / { 1 . 3 2 *(47 0 L 0 G 1 0 ( D I S C H A R C E O U R A T I O N H R S ) - 1 ) , 0(4 « 0 B U I L D I N C C O S T = 1 2 7 - X P O W E R Y < B U I L O I N C F A C T O R , . 7 6 5 ) * 1 0 0 0 . 06 9 0 OC E Q U I P M E N T C O S T = 1 7 . 3 * X P 0 W E R Y ( B A T T E R Y MWH C A P A C I T Y , . 9 6 1 ) -5 0 0 L U U ' r n L " X P O W E R Y ( 0 I S C H A R C E D U R A T I O N H R S . - . 6 7 7 ) - 1 0 0 0 05 1 0 B O P C O S T = B O P A C C O U N T I N G F A C T O R - ( B A L A N C E OF P L A N T F I X E D C O S T -5 2 0 B U I L O I N C C O S T + O C E Q U I P M E N T C 0 S T ) , 05 3 0 P L A N T C O S T IN M I L L I O N S = ( B 0 P C O S T - ( B A T T E R Y C O S Ts u o - B A T T E R Y KWH C A P A C I T Y ) ♦ ( C O N V C O S T -5 5 0 B A T T E R Y KW C A P A C I T Y ) J / 1 0 0 0 0 0 0 . 05 6 0 E N C I N E E R I N C C 0 S T = I F P L A N T C O S T I N M I L L I O N S . C E . . 8 6 T H E N 's 7 f ) ( 188 " XPOWERY( P L A N T C O S T I N M I L L I O N S ,5 8 0 P L A N T C O S T I N M i L L I O N S / - 8 5 7 ) ) * 1 0 0 0 E L S E 1 6 1 0 0 0 , 06 9 0 B A T T E R Y AND C O N V E R T E R E F F I C I E N C Y = B A T T E R Y E F F I C I E N C Y - '6 9 0 u a i i l k y a * u R O U n o T R | p C C N V t R T E R E F r I C I E N C Y
6 1 0 A N N U A L E N E R C Y L O S T = C Y C L E L I F E O F B A T T E R Y - B A T T E R Y KWH C A P A C I T Y * ( 1 - 6 2 0 B A T T E R Y ANO C O N V E R T E R E F F I C I E N C Y ) /6 3 0 A N N U A L B A T T E R Y C Y C L E S6 6 0 ANNUAL DEMAND SAVINC B E F O R E TAX = KW S H A V E D O F F P E A K -6 ^ 0 ON P E A K D E M A N O C H A R C E - 1 2
6 6 0 S T A T E T A X - ( A N N U A L O E M A N D S A V I N C B E F O R E T A X '6 7 0 - A N N U A I O P E R A T I N C A N O M A I N T E N E N C E E X P E N S E -6 a o ( A N N U A L E N E R C Y L O S T - O F F P E A K E N E R C Y C H A R C E ) )6 9 0 - S T A T E T A X R A T E7 0 0 F E D E R A L T A X = ( A N N U A L D E M A N D S A V I N C B E F O R E T A X - S T A T E T A X
- A N N U A L O P E R A T I N C A N O M A I N T E N E N C E E X P E N S E - ( A N N U A L E N E R C Y L O S T * O F F P E A K E N E R C Y C H A R C E ) ) • F E D E R A L T A X R A T E
7 1 0 7 2 0 7 3 07 l Q I fc. LJ L FA ML 1 r v ' "' -a I 4.7 6 0 A N N U A L D E M A N D S A V I N C A F T E R T A X = A N N U A L O E M A N D S A V I N C B E F O R E
U ( S T A T E T A X ♦ F E D E R A L T A X )TAX- '
7 6 0 S A L V A C E V A L U E = S A L V A C E R A T E • P R E V I O U S 2 0 B A T T E R Y D I R E C T C O S T -

106
7 7 0 B A T T E R Y KW H C A P A C I T Y7 8 0 A C R S D E P R ( C A T E C 0 R Y . S T A R T , B C D E P R C O S T , A C R S P E R P E R I O D )7 9 0 CATECORY = 5 8 0 0 START = 1 9 8 68 1 0 BAI T AND CONV COST = BATTERY D I RE C T COST “ BATTERY KWH CA P A C I TY ♦ '8 2 0 ( ( C O N V E R T E R B A S E C O S T “ X P O W E R Y ( ’8 3 0 N O M I N A L O U T P U T P O W E R I N M W , ’8 9 0 S L O P E OF C O N V E R T E R C O S T C U R V E ) ) '8 5 0 “ B A T T E R Y KW C A P A C I T Y )8 6 0 B C O E P R C O S T = ( B A T T E R Y O I R E C T C O S T “ B A T T E R Y KWH C A P A C I T Y “ ( '8 7 0 1 - S A L V A C E R A T E ) ) ♦ ( ( C O N V E R T E R B A S E C O S T “ X P O W E R Y ( '8 8 0 N O M I N A L O U T P U T P O W E R I N M W , '8 9 0 SLOPE OE CONVERTER COST CU RV E ) ) “ BATTERY KW CA P A CI TY )9 0 0 B O P O E P R = B O P C O S T / B O P A C C O U N T I N G T A C T O R9 1 0 A C R S O E P R ( B O P C A T E C O R Y , S T A R T , B O P O E P R , A C R S B O P )9 2 0 B O P C A T E C O R Y = 159 3 0 D E P R E C I A T I O N T A X S A V I N C = A C R S P E R P E R 1 0 0 “ E E O E R A L T A X R A T E - * - '9 9 0 A C R S B O P T E O E R A L T A X R A T E9 5 0 O V E R A L L C O S T = ( P L A N T C O S T I N M I L L I O N S “ 1 0 0 0 0 0 0 ) ♦ E N G I N E E R I N G C O S T ♦ ' 9 6 0 ( A N N U A L E N E R C Y L O S T * '9 7 0 O F F P E A K E N E R C Y C H A R C E ) ♦ ( A N N U A L O P E R A T I N C A N D M A I N T E N E N C E E X P E N S E )9 8 0 O V E R A L L B E N E F I T = A N N U A L D E M A N O S A V I N C A F T E R T A X ♦ S A L V A C E V A L U E ♦ ' 9 9 0 A N N U A L I N T E R R U P T I S L E L O A D S A V I N C S ♦ '1 0 0 0 D E P R E C I A T I O N T A X S A V I N C1 0 1 0 N E T P R E S E N T W O R T H = N P V C ( O V E R A L L B E N E F I T , 0 1 S C O U N T R A T E O V E R A L L C O S T ) 1 0 2 0 A F T E R T A X R A T E OF R E T U R N = I R R ( O V E R A L L B E N E F I T . O V E R A L L C O S T )
E N O OF M O O E L I N P U T : N O R E C O R O

107
M O O E L T H E S I S R E A D Y F O R E D I T . L A S T L I N E I S 1 0 2 0 I N P U T : S O L V E
MO O EL T H E S I S V E R S I O N OF 0 9 / 2 3 / 8 7 1 7 : 0 2 - - 2 1 C O L U M N S 6 2 V A R I A B L E SE N T E R S O L V E O P T I O N S I N P U T : A L L
1 9 8 6 1 9 8 7 1 9 8 8 1 9 8 9 1 9 9 0 1 9 9 1
B A L A N C E OF P L A N T F I X E D C 2 8 6 0 0 0 0 0 0 0B A T T E R Y KW C A P A C 1 TY 1 0 0 0 1 0 0 0 1 0 0 0 1 0 0 0 1 0 0 0 I O O OC O N V E R T E R B A S E C O S T 2 9 0 0 0 0 0 0S A L V A C E R A T E . 1 1 0 0 . 1 1 0 0 . 1 1 0 0 . 1 IO O . 1 1 0 0 . 1 1 0 0I N F L A T I O N R A T E . 0 9 5 0 0 0 0 0 0
O I S C O U N T R A T E . 0 8 0 0 . 0 8 0 0 . 0 8 0 0 . 0 8 0 0 . 0 8 0 0 . 0 8 0 0C O N T I N G E N C Y R A T E . 0 5 0 0 . 0 5 0 0 . 0 5 0 0 . 0 5 0 0 . 0 5 0 0 . 0 5 0 0S A L E S T A X . 0 5 5 0 . 0 5 5 0 . 0 5 5 0 . 0 5 5 0 . 0 5 5 0 . 0 5 5 0B A T T E R Y K . 8 0 0 0 . 8 0 0 0 . 8 0 0 0 . 8 0 0 0 . 8 0 0 0 . 8 0 0 0C O N V E R T E R K . 9 5 0 0 . 9 5 0 0 . 9 5 0 0 . 9 5 0 0 . 9 5 0 0 . 9 5 0 0BO P K . 6 0 0 0 . U O O O . U O O O . 9 0 0 0 . 9 0 0 0 . 9 0 0 0I N S U R A N C E R A T E 1 . 0 7 0 1 . 0 7 0 1 . 0 7 0 1 . 0 7 0 1 . 0 7 0 1 . 0 7 0
F E D E R A L T A X R A T E . 3 9 0 0 . 3 * 4 0 0 . 3 U 0 0 . 3 9 0 0 . 3 9 0 0 . 3 9 0 0S T A T E T A X R A T E . 0 5 0 0 . 0 5 0 0 . 0 5 0 0 . 0 5 0 0 . 0 5 0 0 . 0 5 0 0ON P E A K D E M A N O C H A R C E 1 0 . 5 8 1 0 . 5 8 1 0 . 5 8 1 0 . 5 8 1 0 . 5 8 1 0 . 5 8O F F P E A K E N E R C Y C H A R C E . 0 2 8 2 . 0 2 8 2 . 0 2 8 2 . 0 2 8 2 . 0 2 8 2 . 0 2 8 20 1 S C H A R C E D U R A T I O N H R S 1 1 1 1 1 1B A T T E R Y KWH C A P A C I T Y 5 0 0 5 0 0 5 0 0 5 0 0 5 0 0 5 0 0N O M I N A L O U T P U T PO W ER I N 1 1 1 1 1 1S L O P E OF C O N V E R T E R C O S T - . 3 2 0 0 - . 3 2 0 0 - . 3 2 0 0 - . 3 2 0 0 - . 3 2 0 0 - . 3 2 0 0A N N U A L B A T T E R Y C Y C L E S 1 0 0 1 0 0 1 0 0 1 0 0 I O O 1 0 0A N N U A L I N T E R R U P T I B L E L O A 0 0 0 0 0 0B A T T E R Y E F F I C I E N C Y . 8 0 0 0 . 8 0 0 0 . 8 0 0 0 . 8 0 0 0 . 8 0 0 0 . 8 0 0 0R O U N D T R I P C O N V E R T E R E F F . 8 9 6 9 .8 * 4 6 *4 . 8*46*4 . 8 9 6 9 . 8 9 6 9 . 8 9 6 9M A I N T 1 7 0 0 3 6 0 0 3 6 0 0 5 1 0 0 5 9 0 0 1 5 3 0 0A N N U A L O P E R A T I N C ANO M A I 1 7 0 0 3 6 0 0 3 6 0 0 5 1 0 0 5 9 0 0 1 5 3 0 0C Y C L E L I F E OF B A T T E R Y 2 0 0 0 2 0 0 0 2 0 0 0 2 0 0 0 2 0 0 0 2 0 0 0KW S H A V E D O F F P E A K 1 0 0 0 1 0 0 0 1 0 0 0 1 0 0 0 1 0 0 0 1 0 0 0B A T T E R Y MWH C A P A C I T Y . 5 0 0 0 . 5 0 0 0 . 5 0 0 0 . 5 0 0 0 . 5 0 0 0 . 5 0 0 0B A T T E R Y D I R E C T C O S T 2 7 8 . 7 0 0 0 0 0B A T T E R Y D I S C O U N T F A C T O R 1 . 1 3 0 0 0 • 0 0 0B A T T E R Y A C C O U N T I N G F A C T O 1 . 1 6 7 1 . 1 6 7 1 . 1 6 7 1 . 1 6 7 1 . 1 6 7 1 . 1 6 7C O N V E R T E R A C C O U N T I N G F A C 1 . 1 7 6 1 . 1 7 6 1 . 1 7 6 1 . 1 7 6 1 . 1 7 6 1 . 1 7 6BO P A C C O U N T I N G F A C T O R 1 . 1 9 9 1 . 1 *4*4 1 . 1 *4 *4 1 . 1 9 9 1 . 1 9 9 1 . 1 9 9B A T T E R Y C O S T 3 6 7 . 6 0 0 0 0 0C O N V C O S T 2 8 2 . 2 0 0 0 0 0B U I L D I N C F A C T O R . 5 0 0 0 0 0 0 0 0B U 1L O 1 N C C O S T 7*4 7 3*4 0 0 0 0 0OC E Q U I P M E N T C O S T 9 0 1 1 0 0 0 0 0BOP C O S T 1 2 8 * 4 7 1 0 0 0 0 0P L A N T C O S T I N M I L L I O N S . 5 9 * 4 5 0 0 0 0 0E N G I N E E R I N G C O S T 1 6 1 0 0 0 0 0 0 0 0B A T T E R Y A N D C O N V E R T E R E F . 6 7 7 * . 6 7 7 1 . 6 7 7 1 . 6 7 7 1 . 6 7 7 1 . 6 7 7 1A N N U A L E N E R C Y L O S T 3 2 2 9 3 2 2 9 3 2 2 9 3 2 2 9 3 2 2 9 3 2 2 9A N N U A L O E M A N D S A V I N C B E F 1 2 6 9 6 0 1 2 6 9 6 0 1 2 6 9 6 0 1 2 6 9 6 0 1 2 6 9 6 0 1 2 6 9 6 0S T A T E T A X 6 2 5 8 6 1 6 3 6 1 6 3 6 0 8 8 6 0 9 8 5 5 7 8F E D E R A L T A X *4 0* 4 30 3 9 8 1 6 3 9 8 1 6 3 9 3 3 1 3 9 0 7 3 3 6 0 3 7A N N U A L D E M A N D S A V I N C A r T 8 0 2 7 2 8 0 9 8 1 8 0 9 8 1 8 1 5 9 0 8 1 8 3 9 8 5 3 9 5S A L V A C E V A L U E 0 0 0 0 0 0A C R S P E R P E R I O D 5 * 4 6 0 5 8 0 0 8 8 7 6 U U 7 7 6 9 9 7 7 6 9 9 7 0C A T E C O R Y 5 5 5 5 5 5S T A R T 1 9 8 6 1 9 8 6 1 9 8 6 1 9 8 6 1 9 8 6 1 9 8 6B A I T A N D C O N V C O S T 3 7 9 3 6 6 0 0 0 0 0B C O E P R C O S T 3 6 * 4 0 3 6 0 0 0 0 0B O P D E P R 1 1 2 3 * 4 5 0 0 0 0 0A C R S B O P 5 6 1 7 1 1 23 *4 1 0 1 1 1 8 9 8 8 7 8 6 9 7 8 6 9B O P C A T E C O R Y 15 15 1 5 15 15 1 5D E P R E C I A T I O N T A X S A V I N C 2 0 * 4 7 6 3 1 0 5 0 2 9 U 3 0 2 9 0 9 8 2 8 6 6 6 2 6 7 9O V E R A L L C O S T 7 5 7 2 9 2 3 6 9 1 3 6 9 1 5 1 9 1 5 9 9 1 1 5 3 9 1O V E R A L L BC NE F I T 1 0 0 7 * 4 8 1 1 2 0 3 0 n o u 1 1 1 1 0 5 8 8 1 1 0 5 0 5 8 8 0 1 9N E T P R E S E N T WORTH - 6 6 * 4 0 0 7 - 5 7 1 3 7 7 - U 8 6 8 9 * * - 9 0 9 7 2 9 - 3 3 8 9 2 5 - 2 9 3 9 3 9a f t e r t a x R A T E OF R E T U R N
1 9 9 2 1 9 9 3 1 9 9 U 1 9 9 5 1 9 9 6 1 9 9 7
B A L A N C E OF P L A N T f I X E D C 0 0 0 0 0 0B A T T E R Y KW C A P A C 1 TY 1 0 0 0 1 0 0 0 1 0 0 0 1 0 0 0 1 0 0 0 1 0 0 0C O N V E R T E R B A S E C O S T 0 0 0 0 0 0S A L V A C E R A T E . 1 1 0 0 . 1 1 0 0 . 1 1 0 0 . 1 1 0 0 . 1 1 0 0 . 1 1 0 01 N f L A T I O N R A T E . 0 * 4 5 0 . 0 * 4 5 0 . 0 9 5 0 . 0 9 5 0 . 0 9 5 0 . 0 9 5 0
D I S C O U N T R A T E . 0 8 0 0 . 0 8 0 0 . 0 8 0 0 . 0 8 0 0 . 0 8 0 0 . 0 8 0 0

1 0 8
C O N T I N C E N C Y R A T E S A L E S T A X B A T T E R Y K C O N V E R T E R K B O P KI N S U R A N C E R A T E F E D E R A L T A X R A T E S T A T E T A X R A T E ON P E A K D E M A N D C H A R C E O f F P E A K E N E R G Y C H A R C E D I S C H A R G E D U R A T I O N H R S B A T T E R Y KWH C A P A C I T Y N O M I N A L O U T P U T PO W ER I N S L O P E OF C O N V E R T E R C O S T A N N U A L B A T T E R Y C Y C L E S A N N U A L I N T E R R U P T I B L E L O A B A T T E R Y E F F I C I E N C Y R O U N D T R I P C O N V E R T E R E F F MA I N TA N N U A L O P E R A T I N C A N D M A I C Y C L E L I F E O F B A T T E R Y KW S H A V E D O F F P E A K B A T T E R Y MWH C A P A C I T Y B A T T E R Y D I R E C T C O S T B A T T E R Y O I S C O U N T F A C T O R B A T T E R Y A C C O U N T I N G F A C T O C O N V E R T E R A C C O U N T I N G F A C B O P A C C O U N T I N G F A C T O R B A T T E R Y C O S T C O N V C O S T B U I L O I N C F A C T O R B U I L D I N C C O S T D C E Q U I P M E N T C O S T B O P C O S TP L A N T C O S T I N M I L L I O N S E N C I N E E R I N C C O S T B A T T E R Y A N D C O N V E R T E R EF A N N U A L E N E R G Y L O S T A N N U A L O E M A N D S A V I N C B E F S T A T E T A X F E D E R A L T A XA N N U A L O E M A N D S A V I N C A F TS A L V A C E V A L U EA C R S P E R P E R I O OC A T E C O R YS T A R TB A T T ANO C O N V C O S TB C O E P R C O S TB O P D E P RA C R S BOPB O P C A T E C O R YD E P R E C I A T I O N T A X S A V I N CO V E R A L L C O S TO V E R A L L B E N E F I TN E T P R E S E N T W O RTHA F T E R T A X R A T E OF RC T URN
B A L A N C E OF P L A N T F I X E D CB A T T E R Y KW C A P A C I T YC O N V E R TE R BAS E COSTS A L V A G E RA TEI N F L A T I O N RA TE
O I S C O U N T RA TECONT IN C E N C Y RATES A L C S TAXB A T T E R Y KC O N V E R TE R KBOP KIN S U R A N C E RATE F E D E R A L TAX RATE S T A T E TA X RA TE ON PEA K DEMAND CHARCE OFF PEAK E N ERCY CHARCE 0 IS C H A R C E O U R A T IO N HRS B A T T E R Y KWH C A P A C I T Y N O M I N A L OUTPUT POWER IN S L O P E OF CONVERTER COST
. 0 5 0 0 . 0 5 0 0 . 0 5 0 0
. 0 5 5 0 . 0 5 5 0 . 0 5 5 0
. 8 0 0 0 . 8 0 0 0 . 8 0 0 0
. 9 5 0 0 . 9 5 0 0 . 9 5 0 0
.ROOO . * 4 0 0 0 . * 4 0 0 0I . 0 7 0 1 . 0 7 0 1 . 0 7 0. 3*400 .3 * 4 0 0 . 3*400. 0 5 0 0 . 0 5 0 0 . 0 5 0 01 1 . 0 6 1 1 . 5 5 1 2 . 0 7. 0 2 9 5 . 0 3 0 8 . 0 3 2 2
5 0 0 5 0 0j
5 0 01
- . 3 2 0 0 - . 3 2 0 0 - . 3 2 0 01 00 1 0 0 100
0 0 0. 8 0 0 0 . 8 0 0 0 . 8 0 0 0. 8*46*4 .8*46*4 . 8*46*4
2 5 0 0 1 7 0 0 3 6 0 02 5 0 0 1 7 0 0 3 6 0 02 0 0 0 2 0 0 0 2 0 0 01 0 0 0 1 0 0 0 1 0 0 0
. 5 0 0 0 . 5 0 0 0 . 5 0 0 00 0 00 0 0
1 . 167 1 . 1 6 7 1 . 1671 . 1 7 6 1 . 1 7 6 1 . 1 7 61 . 1*4*4 1 . 1 *4*4 1 . 1*4 *t
0 0 00 0 00 0 00 0 00 0 00 0 00 0 00 0 0
. 6 7 7 1 . 6 7 7 1 . 6 7 7 13 2 2 9 3 2 2 9 3 2 2 9
1 3 2 6 7 3 1 3 8 6 * 4 3 1 * 4*48 826 5 0 * 4 6 8 * 4 2 7 0 5 9
* 4 2 0 1 5 *4 *4 20 1 * 4 5 6 0 18*4 15*4 8 7 6 0 1 9 2 2 2 30 0 00 0 0
5 5 51 9 8 6 1 9 8 6 1 9 8 60 0 00 0 00 0 0
6 7 * 4 1 6 7 * 4 1 6 7 * 4 115 1 5 15
2 2 9 2 2 2 9 2 2 2 9 22 5 9 5 1 7 9 9 3 70*4
86* 4*46 8 9 8 9 2 9 * 4 5 1 5- 2 * 4 5 1 2 9 - 1 9 7 6 1 2 - 1 5 2 3 3 3
. 0 0 3 9 . 0 2 7 * 4
1 9 9 8 1 9 9 9 2000C 0 01000 1000 10000 0 0
. 1 1 0 0 . 1 1 0 0 . 1 1 0 0
. 0 * 4 5 0 . 0 * 4 5 0 . 0 * 4 5 0
. 0 8 0 0 . 0 8 0 0 . 0 8 0 0
. 0 5 0 0 . 0 5 0 0 . 0 5 0 0
. 0 5 5 0 . 0 5 5 0 . 0 5 5 0
. 8 0 0 0 . 8 0 0 0 . 8 0 0 0
. 9 5 0 0 . 9 5 0 0 . 9 5 0 0
. * 4 0 0 0 * 4 0 0 0 . UOOO1 . 0 7 0 1 . 0 7 0 1 . 0 7 0. 3 * 4 0 0 . 3 * 4 0 0 . 3 L O 0. 0 5 0 0 .0500 .05001*4 . *40 1 5 . 0 5 1 5 . 7 2. 0 3 8 * 4 . 0 * 4 0 1 . O U 19
]
5 0 0 5 0 0|
5 0 0J
- . 3 2 0 0 - . 3 2 0 0 - . 3 2 0 0
. 0 5 0 0 .0 * 5 0 0 . 0 5 0 0
. 0 5 5 0 - 0 5 5 0 . 0 5 5 0
. 8 0 0 0 . 8 0 0 0 . 8 0 0 0
. 9 5 0 0 . 9 5 0 0 . 9 5 0 0
.UOOO .*4 0 0 0 .UOOO1 . 0 7 0 1 . 0 7 0 1 . 0 7 0. 3*400 . 3*400 . 3U00. 0 5 0 0 . 0 5 0 0 . 0 5 0 01 2 . 6 2 1 3 . 1 8 1 3 . 7 8. 0 3 3 6 . 0 3 5 1 0 3 6 71 1 1
5 0 0 5 0 0 5 0 01 T 1
- . 3 2 0 0 - . 3 2 0 0 - . 3 2 0 0100 100 1000 0 0. 8 0 0 0 . 8 0 0 0 . 8 0 0 0. 8 U 6 U . 8 U 6 U . 8 U 6 U
3 6 0 0 5 1 0 0 5 9 0 03 6 0 0 5 1 0 0 5 9 0 02000 2000 20001000 1000 1000
. 5 0 0 0 . 5 0 0 0 . 5 0 0 00 0 00 0 01 . 1 6 7 1 . 1 6 7 1 . 1 6 71 . 1 7 6 1 . 1 7 6 1 . 1 7 61 . 1 UU 1 . 1UU 1 . 1UU
0 0 00 0 00 0 00 0 00 0 00 0 00 0 00 0 0. 6 7 7 1 . 6 7 7 1 . 6 7 7 1
3 2 2 9 3 2 2 9 3 2 2 91 5 1 U 0 2 1 5 8 2 1 5 1 6 5 3 3 5
7 3 8 5 7 6 5 0 7 9 6 6U 7 7 0 5 U 9 U 2 0 5 1 U 5 99 6 3 1 2 1 0 1 1 U 6 1 0 5 9 1 00 0 00 0 0
5 5 51 9 8 6 1 9 8 6 1 9 8 60 0 00 0 00 0 0
6 7 U 1 6 7 U 1 6 7 U 115 1 5 15
2 2 9 2 2 2 9 2 2 2 9 23 7 0 9 5 2 1 3 6 0 1 9
9 8 6 0 U 1 0 3 U 3 7 1 0 8 2 0 2- 1 0 8 5 1 5 - 6 6 5 6 7 - 2 6 1 3 0
. 0 U 6 1 . 0 6 1 0 . 0 7 3 2
2001 2002 2 0 0 3
0 0 01000 1000 10000 0 0. 1 1 0 0 . 1 1 0 0 . 1 1 0 0. O U S O . 0 U 5 0 . 0 U 5 0. 0 8 0 0 . 0 8 0 0 . 0 8 0 0. 0 5 0 0 . 0 5 0 0 . 0 5 0 0. 0 5 5 0 . 0 5 5 0 . 0 5 5 0. 8 0 0 0 . 8 0 0 0 . 8 0 0 0. 9 5 0 0 . 9 5 0 0 . 9 5 0 0.U O O O . UOOO . UOOO1 . 0 7 0 1 . 0 7 0 1 . 0 7 0. 3 U 0 0 . 3 U 0 0 . 3 U 0 0. 0 5 0 0 . 0 5 0 0 . 0 5 0 016 , U 3 1 7 . 1 7 1 7 , 9 U. OU 3 8 . O U 5 8 . OU 7 8
j
5 0 0 5 0 0J
5 0 0
- . 3 2 0 0 - . 3 2 0 0 - . 3 2 0 0

109
A N N U A L B A T T E R Y C Y C L E S TOO 1 0 0 1 0 0 1 0 0A N N U A L I N T E R R U P T I B L E L O A 0 0 0 0B A T T E R Y E F T I C I E N C Y . 8 0 0 0 . 8 0 0 0 . 8 0 0 0 . 8 0 0 0R O U N O T R I P C O N V E R T E R E F F • 8 L 6 L .8 1* 61 * . 8 U 6 1* . 8 L 6 LM A I N T 1 5 3 0 0 2 5 0 0 1 7 0 0 3 6 0 0A N N U A L O P E R A T I N C ANO M A I 1 5 3 0 0 2 5 0 0 1 7 0 0 3 6 0 0C Y C L E L I F E O F B A T T E R Y 2 0 0 0 2 0 0 0 2 0 0 0 2 0 0 0KW S H A V E O O F F P EA K 1 0 0 0 1 0 0 0 1 0 0 0 1 0 0 0B A T T E R Y MWH C A P A C I T Y . 5 0 0 0 . 5 0 0 0 . 5 0 0 0 . 5 0 0 0B A T T E R Y O I R E C T C O S T 0 0 0 0B A T T E R Y O I S C O U N T F A C T O R 0 0 0 0B A T T E R Y A C C O U N T I N G F A C T O 1 . 1 6 7 1 . 1 6 7 1 . 1 6 7 1 . 1 6 7C O N V E R T E R A C C O U N T I N G F A C 1 . 1 7 6 1 . 1 7 6 1 . 1 7 6 1 . 1 7 6B O P A C C O U N T I N G F A C T O R 1 . I L L 1 .1 1 *1 * 1 . I L L 1 . I L L
B A T T E R Y C O S T 0 0 0 0
C O N V C O S T 0 0 0 0
B U I L D I N C F A C T O R 0 0 0 0
8 U I L 0 I N C C O S T 0 0 0 0OC E Q U I P M E N T C O S T 0 0 0 0
B O P C O S T 0 0 0 0
P L A N T C O S T I N M I L L I O N S 0 0 0 0
E N C I N E E R I N C C O S T 0 0 0 0
B A T T E R Y A N O C O N V E R T E R E F . 6 7 7 1 . 6 7 7 1 . 6 7 7 1 . 6 7 7 1
A N N U A L E N E R C Y L O S T 3 2 2 9 3 2 2 9 3 2 2 9 3 2 2 9A N N U A L O E M A N O S A V I N G B E F 1 7 2 7 7 5 1 8 0 5 5 0 1 8 8 6 7 5 1 9 7 1 6 5S T A T E T A X 7 8 6 8 8 8 9 6 9 3 L 2 9 6 7 1
F E D E R A L T A X 5 0 8 2 L 5 7 1 * 6 8 6 0 3 * * 9 6 2 L 7 6A N N U A L D E M A N O S A V I N C A F T 1 1 L 0 8 3 1 1 1 * 1 8 6 1 1 8 9 8 * * 1 2 5 0 1 8
S A L V A C E V A L U E 0 0 0 0
A C R S P E R P E R I O D 0 0 0 0
C A T E C O R Y 5 5 5 5S T A R T 1 9 8 6 1 9 8 6 1 9 8 6 1 9 8 6B A T T A N O C O N V C O S T 0 0 0 0
BC O E P R C O S T 0 0 0 0
BO P O E P R 0 0 0 0
A C R S BOP 6 7 U 1 6 7 L 1 6 7 * 4 1 0
B O P C A T E C O R Y 1 5 1 5 1 5 15D E P R E C I A T I O N T A X S A V I N C 2 2 9 2 2 2 9 2 2 2 9 2 0
O V E R A L L C O S T 1 5 U 2 I4 2 6 2 9 1 8 3 5 3 7 L 1
O V E R A L L B E N E F I T 1 1 6 3 7 5 1 1 6 U 7 7 1 2 1 2 7 5 1 2 5 0 1 8N E T P R E S E N T W O R T H 1 0 L 8 6 1 * 9 1 7 5 8 6 7 8 1 1 2 2 0 9 3A F T E R T A X R A T E OF R E T U R N . 0 8 2 5 . 0 9 1 1 . 0 9 8 2 . 1 0 L 1
2 0 0 < * 2 0 0 5 2 0 0 6
B A L A N C E O F P L A N T F I X E O C 0 0 0B A T T E R Y KW C A P A C I T Y 1 0 0 0 1 0 0 0 1 0 0 0C O N V E R T E R B A S E C O S T 0 0 0
S A L V A C E R A T E . 1 1 0 0 . 1 1 0 0 . 1 1 0 0I N F L A T I O N R A T E . 0 U 5 0 . 0 1 * 5 0 . 0 * 4 5 0
D I S C O U N T R A T E . 0 8 0 0 . 0 8 0 0 . 0 8 0 0C O N T I N G E N C Y R A T E . 0 5 0 0 . 0 5 0 0 . 0 5 0 0
S A L E S T A X . 0 5 5 0 . 0 5 5 0 . 0 5 5 0B A T T E R Y K . 8 0 0 0 . 8 0 0 0 . 8 0 0 0
C O N V E R T E R K . 9 5 0 0 . 9 5 0 0 . 9 5 0 0
B O P K . 1 * 0 0 0 . 1 * 0 0 0 . L O O OI N S U R A N C E R A T E 1 . 0 7 0 1 . 0 7 0 1 . 0 7 0
F E D E R A L T A X R A T E . 3 L 0 0 . 3 9 0 0 . 3 L 0 0S T A T E T A X R A T E . 0 5 0 0 . 0 5 0 0 . 0 5 0 0ON P E A K D E M A N O C H A R C E 1 8 . 7 5 1 9 . 5 9 2 0 . L 8O F F P E A K E N E R C Y C H A R C E . 0 5 0 0 . 0 5 2 2 . 0 5 L 60 1 S C H A R C E D U R A T I O N H R S 1 1 1B A T T E R Y KWH C A P A C I T Y 5 0 0 5 0 0 5 0 0N O M I N A L O U T P U T PO W ER I N 1 1 1S L O P E OF C O N V E R T E R C O S T - . 3 2 0 0 - . 3 2 0 0 - . 3 2 0 0A N N U A L B A T T E R Y C Y C L E S 1 0 0 1 0 0 1 0 0A N N U A L I N T E R R U P T I B L E L O A 0 0 0B A T T E R Y E F F I C I E N C Y . 8 0 0 0 . 8 0 0 0 . 8 0 0 0R O U N O T R I P C O N V E R T E R E F F . 8 L 6 L .81 *6 1* . 8 L 6 L
M A I N T 5 9 0 0 1 5 3 0 0 1 5 3 0 0A N N U A L O P E R A T I N C A N D M A I 5 9 0 0 1 5 3 0 0 1 5 3 0 0C Y C L E L I F E OF B A T T E R Y 2 0 0 0 2 0 0 0 2 0 0 0KW S H A V E O O F F P EA K 1 0 0 0 1 0 0 0 1 0 0 0B A T T E R Y MWH C A P A C I T Y . 5 0 0 0 . 5 0 0 0 . 5 0 0 0B A T T F R Y O I R E C T C O S T 0 0 08 A T T C R Y D I S C O U N T F A C T O R 0 0 0B A T T E R Y A C C O U N T I N G F A C T O 1 . 1 6 7 1 . 1 6 7 1 . 1 6 7C O N V E R T E R A C C O U N T I N G F A C 1 . 1 7 6 1 . 1 7 6 1 . 1 7 6B O P A C C O U N T I N G F A C T O R 1 . 1 L I* 1 . l K i * 1 . I L L
100 1000 0
.8000 .8000
. 8L6L . 8L6L3600 5 1 0 03600 5 1 0 02000 20001000 1000
.5000 .50000 00 0
1. 167 1. 1671.176 1.1761. IL L 1. IL L
0 00 00 00 00 00 00 00 0
.6771 .67713229 3229
206037 2153091011L 10503653LO 678L8
130583 1369590 00 05 5
1986 19860 00 00 00 0
15 150 0
37L8 525L130583 136959156292 1891L6
. 1090 .1132

B A T T E R Y C O S T 0 0C O N V C O S T 0 0B U 1L 0 1 NC E A C T O R 0 0B U I L D I N C C O S T 0 0OC E Q U I P M E N T C O S T 0 0B O P COS T 0 0P L A N T C O S T I N M I L L l ^ r o C 0E N C I N E E R I N C C O S T 0 0B A T T E R Y A N D C O N V E R T E R EE . 6 7 7 1 . 6 7 7 1A N N U A L E N E R C Y L O S T 3 2 2 9 3 2 2 9A N N U A L D E M A N D S A V I N C B E E 2 2 4 9 9 8 2 3 5 1 2 3S T A T E T A X 1 0 9 4 7 1 0 9 8 3E E D E R A L T A X 7 0 7 1 7 7 0 9 4 8A N N U A L O E M A N D S A V I N C A E T 1 4 3 3 3 5 1 5 3 1 9 2S A L V A C E V A L U E 0 0A C R S P ER P E R I O O 0 0C A T E C O R Y 5 5S T A R T 1 9 8 6 1 9 8 6B A T T ANO C O N V C O S T 0 0B C O E P R C O S T 0 0B O P O EP R 0 0A C R S BOP 0 0B O P C A T E C O R Y 15 15D E P R E C I A T I O N T A X S A V I N C 0 0O V E R A L L C O S T 6 0 6 1 1 5 4 6 9O V E R A L L B E N E E I T 1 4 3 3 3 5 1 5 3 1 9 2N E T P R E S E N T W O R TH 2 2 0 8 4 1 2 5 0 1 2 4A E T E R T A X R A T E OE R E T U R N . 1 1 6 6 . 1 1 9 8
1 1 0
000000
0. 6 7 7 1
3 2 2 92 4 5 7 0 3
1 1 5 1 17 4 3 6 3
1 5 9 8 2 91 5 3 3 0
05
1 9 8 60000
1501 5 4 7 6
1 7 5 1 5 92 8 1 6 0 0
. 1 2 2 6
E N T E R S O L V E O P T I O N S I N P U T : N O R E C O R D