Embed Size (px)
Citation preview

An Approach to Quantify the Technical Impact of Power Quality in Medium Voltage Distribution
Systems
Author(s) Name(s) Author Affiliation(s)
Abstract—This paper provides a useful guidance in the interpretation and analyses of the technical impact of power factor correction in a power system. It is intended to raise awareness in order to achieve correct measurements, calculations and the key dynamics of the power system when quantifying the impact of power quality (PQ) in a non-linear power system. This paper is therefore targeting the power producing utilities, municipalities and the bulk end users of electricity.
Keywords— power factor correction; total harmonic distortion; resonance; losses
I. INTRODUCTION
The shortage of power in South Africa has led to an immediate and effective need for upgrading the efficiency of the system. It has been a norm for the industry to operate a system with low power factor and transfer the economic impact to the consumers. These charges are based on cosφ which does not take the effect of harmonics into consideration [1], [12]. Furthermore, the increase in the use of power electronics devices has also introduced added harmonics on the power network which aggravates the low power factor and losses in the system [2], [18]. However, this scenario can be redeemed by the appropriate employment of Power Factor Correction (PFC) applications in order to improve the efficiency of the system.
II. PROBLEM DISCUSSION
The problem proposed for discussion in this paper is one approach to quantify the impact of the power factor in medium voltage (MV) distribution system. This implies the analysis of technical losses of MV distribution system. There are several classifications of technical losses, namely: copper losses (I2R), dielectric losses, corona losses and iron losses. The I2R losses are directly affected by power factor (PF or λ) of the system [3].
Although nonlinear loads do not draw reactive power at the fundamental system frequency (50 Hz), they add more losses through harmonic distortion and also deteriorate PF in
the distribution system for a given load by virtue of drawing higher RMS currents [4]. This phenomenon has been augmented by the increase in consumers’ power electronic equipment. This equipment includes the non-linear devices such as direct current (DC) drives, variable speed drives, solid state or switched power supplies, etc. Although these devices are aimed to improve the efficiency of machinery operation, they, depending on the drivers’ front end, also result in low PF as the relationship is illustrated in Fig. 1 [5].
Fig.1: Relation between the losses and power factor.
The main factors that influence technical losses in any
distribution system are cables’ resistance, power factor of the load and harmonics injected by the loads. The dielectric losses, corona losses and iron losses are not included in this study.
A. Cable resistance The cable resistance is directly involved in I2R or copper
losses. The harmonics also add to the copper losses due to the increased temperature of the conductors. The resistance of the conductor increases with the increase in the temperature as it is illustrated in equation 1.
1 ( )ref refR R (1)
where: R is the resistance of the conductor at temperature “θ”, Rref is resistance of the conductor at the reference temperature θref, usually 20°C, α is specific temperature coefficient of resistance for a given conductor material, θ is conductor temperature in degrees Celsius, θref is the reference
F.M. Dlamini D.V. Nicolae Power Engineering Department University of Johannesburg, Department of Electric and Vaal University of Technology Electronic Engineering Technology Vanderbijlepark, South Africa Johannesburg, South Africa

temperature at a specified corresponding α for a given conductor material [6]. The presence of harmonics in the system increases the resistance due to skin effect.
B. Power Factor In linear systems, the displacement angle between the
voltage and current waveforms is termed power factor angle (φ) and the cosine of that angle is called power factor (λ) [7],[8], [11]. In nonlinear systems, λ is defined as the ratio of the total active power dissipated in an electric circuit to the total equivalent volt-amperes applied to that circuit. This power factor is referred to as a total or true power factor [4], [8], [11]. Furthermore, the true PF is a combination of two forms of PF, namely, the displacement power factor (λ1) and distortion power factor (λD). Thus true power factor [8], [11] can be represented by:
SP
Dtrue 1 (2)
where P is the total active power which is the sum of the fundamental component of active power (P1) and the harmonic component of power (PH), represented by [8], [11]:
Htotal PPP 1 (3)
And S is the total apparent power given by [8], [11]:
2 21 NS S S (4)
The two components of S, namely the fundamental component (S1) and the nonlinear component (SN) of the apparent power can be further formulated as [8], [11]:
11111 jQPIVS (5)
222HVIN SDDS (6)
where the subscripts V1, I1, Q1 are the fundamental voltage, current and reactive power, respectively; the DI, DV and SH are current distortion power, voltage distortion power and harmonic apparent power, respectively.
C. Harmonics From the formulae and definitions above it is evident that
power factor analysis cannot be done in isolation from the harmonics consideration. The IEEE 1159-2009 standard defines harmonics as sinusoidal voltages or currents having frequencies that are integer multiples of the frequency at which the supply system is designed to operate [8]. These harmonics are caused by loads drawing nonlinear currents thereby increasing the total current drawn from the system. Subsequently, they add to the system losses, reducing equipment lifespan and interfering with metering and protection equipment [8].
The impact and levels of harmonics can be measured and monitored by the individual harmonic distortions or total
harmonic distortions (THD). There are regulated limits and are set by NRS 048 as shown in Table I.
There is a severe stress impact on equipment and losses in the system if the limits in Table I are exceeded. The direct relation to λD is given by:
21/ 1D ITHD (7)
By substituting (7) into (2), the true power factor can be derived as:
21 / 1true ITHD (8)
TABLE I
COMPATIBLE LEVELS FOR HARMONIC CURRENTS [9]
D. Resonances Power factor can be corrected by applying reactive power
compensation through the use of capacitor banks (classic power factor). This method is most suitable for linear loads. However, the use of capacitor banks often creates resonance in the system. Resonance occurs when the capacitive reactance is equal to the inductive reactance for a given system at a given system frequency. This can be either series or parallel resonance (taking the harmonic load as the source) as illustrated in Fig. 2 below.
Fig. 2: Series and parallel resonance [3]
At resonance critical harmonic currents are amplified adding more losses to the system. In order to avoid resonance at critical harmonic orders, equation (9) can be used to

determine the resonance frequency to be considered when designing or tuning a harmonic filter.
11
1
Cr
L
Xf fX
(9)
where: fr is the resonance frequency, f1 is the fundamental frequency (50 Hz), XC1 is the capacitive reactance and XL1 is the inductive reactance at the fundamental frequency respectively.
III. FEEDER MODELLING FOR TECHNICAL LOSSES EVALUATION
Any distribution system consists from a number of feeders. As many other authors recommend [13], [14], this study starts with a simplified model of a radial feeder Fig. 3. Fig. 3 Simplified distribution feeder model The feeder has j = 1…N number of different loads with different power factor. The equation governing this feeder is given as:
1 1 1
j j j
N N N
I Y V
I Y V
I Y V
(10)
where Ij, Yj and Vj are the parameters presented by load Lj at node j.
Considering rj,j+1 being the resistance of feeder k between node j and j+1, the total power losses could be determined as:
21
, 1 21 1
jNj
loss k j jjj j
SP r
V
(11)
And considering that λ = P / S, the overall power factor of feeder k may be expressed as:
2
21 1
Re /N N
jk loss k j N
jj j
SP S V
V
(12)
As long as the apparent power Si depends on the power factor of each load, then the total losses in the feeder depend as well on it. Using (11) and (12) one can quantify the impact of power factor correction and harmonic pollution.
IV. TECHNICAL IMPACT OF PFC – CASE STUDY Medium voltage (MV) substation situated in the northern
suburbs of Johannesburg was chosen. It comprises of one 88kV busbar and three 11 kV busbar sections as indicated in Fig. 4 and 5 below. There are eighteen active feeders connected to the 11 kV busbar. The feeders are a mix or majority commercial building and few industrial and residential customers. Loads are connected to the 11 kV busbar sections using cross linked polyethene (XLPE) and paper insulated (PILC) cables of 185 and 300 mm2 cross sectional area depending on the size of the load.
Fig. 4: Schematic representation of the substation under study
Fig. 5 Digsilent diagram of the substation under study
Node 1
V1
I1 S1 λ1
Feeder k PCC 11 kV Bus
Node j
Vi
Ij Sj λj
Node j+1
Vj+1
Ij+1 Sj+1 λj+1
Node N
VN IN SN λN
LN Lj+1 Lj L1
Bus 11kV B

A. Case Study Methodology The load flow studies were undertaken for “Bus 11 kV B”
with different system configurations in order to demonstrate the impact of PFC in linear and nonlinear systems [15], [16], [17]. All the load flow evaluations were performed using the PowerFactory - Digsilent software to illustrate the results obtained at Bus 11kV B on following five system configurations: Case 1
Run the load flow studies with the existing network (Fig. 4) at 50Hz and measure the initial system parameters and the results are in Table III line 1. Then determine [18] and connect the capacitor bank at L7, L14, L17 and L18 with the linear system condition (no harmonics pollution) and measure the impact of classic PFC on the transferable power, power losses and PF. PFC was aimed to improve PF from 0.92, 0.89, 0.93 and 0.92, respectively to 0.96 as in Fig. 5 and the results filled in Table III line 2.
Fig. 5: Classic power factor at fundamental frequency Case 2
A harmonic current source (similar to [10]) was inserted (in Digsilent model) at L11 with spectral content indicated in Table II and presented in Fig. 6. Run harmonics load flow without PFC connected in order to demonstrate the impact of harmonics on the total power factor of the system and the results presented in Table III line 3.
TABLE II: CURRENT HARMONIC SOURCE AT L11 [10] 11 kV
Harmonic Order
% of 50Hz Current
Angle
1 100 0 5 69.75 -174 7 47.03 -171 11 6.86 17 13 4.52 -178 17 7.56 9 19 3.81 9 23 2.59 11 % THD 84.99
Fig. 6: Illustration of harmonic source created at L11 Case 3
Now, run harmonics load flow with capacitor banks connected as a classic PFC, as presented in Fig. 7 and demonstrate the negative impact of classic PFC in nonlinear system with results presented in Table III line 4.
Fig. 7: Demonstration of classic PFC applied in nonlinear system at L7 Case 4
In this case, the harmonic source is still connected at load L11, but now harmonic filters are connected, as presented in Fig. 8 to eliminate harmonic orders above the IEEE limits, in parallel with capacitor bank at L7.
Fig. 8: Schematic representation of a nonlinear system with PFC and harmonic filter at L7
Bus 11 kV C
Bus 11 kV C
Bus 11 kV C
Bus 11 kV C
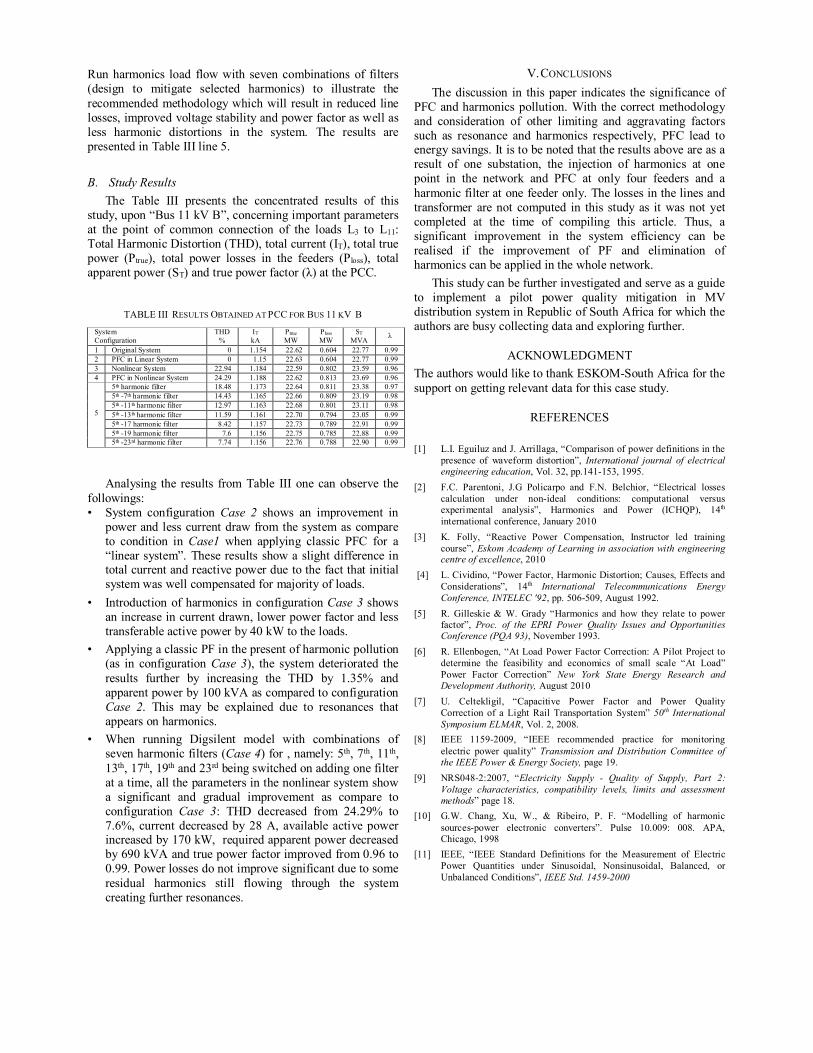
Run harmonics load flow with seven combinations of filters (design to mitigate selected harmonics) to illustrate the recommended methodology which will result in reduced line losses, improved voltage stability and power factor as well as less harmonic distortions in the system. The results are presented in Table III line 5.
B. Study Results The Table III presents the concentrated results of this
study, upon “Bus 11 kV B”, concerning important parameters at the point of common connection of the loads L3 to L11: Total Harmonic Distortion (THD), total current (IT), total true power (Ptrue), total power losses in the feeders (Ploss), total apparent power (ST) and true power factor (λ) at the PCC.
TABLE III RESULTS OBTAINED AT PCC FOR BUS 11 KV B
System Configuration
THD %
IT kA
Ptrue MW
Ploss MW
ST MVA λ
1 Original System 0 1.154 22.62 0.604 22.77 0.99 2 PFC in Linear System 0 1.15 22.63 0.604 22.77 0.99 3 Nonlinear System 22.94 1.184 22.59 0.802 23.59 0.96 4 PFC in Nonlinear System 24.29 1.188 22.62 0.813 23.69 0.96 5
5th harmonic filter 18.48 1.173 22.64 0.811 23.38 0.97 5th -7th harmonic filter 14.43 1.165 22.66 0.809 23.19 0.98 5th -11th harmonic filter 12.97 1.163 22.68 0.801 23.11 0.98 5th -13th harmonic filter 11.59 1.161 22.70 0.794 23.05 0.99 5th -17 harmonic filter 8.42 1.157 22.73 0.789 22.91 0.99 5th -19 harmonic filter 7.6 1.156 22.75 0.785 22.88 0.99 5th -23rd harmonic filter 7.74 1.156 22.76 0.788 22.90 0.99
Analysing the results from Table III one can observe the followings: • System configuration Case 2 shows an improvement in
power and less current draw from the system as compare to condition in Case1 when applying classic PFC for a “linear system”. These results show a slight difference in total current and reactive power due to the fact that initial system was well compensated for majority of loads.
• Introduction of harmonics in configuration Case 3 shows an increase in current drawn, lower power factor and less transferable active power by 40 kW to the loads.
• Applying a classic PF in the present of harmonic pollution (as in configuration Case 3), the system deteriorated the results further by increasing the THD by 1.35% and apparent power by 100 kVA as compared to configuration Case 2. This may be explained due to resonances that appears on harmonics.
• When running Digsilent model with combinations of seven harmonic filters (Case 4) for , namely: 5th, 7th, 11th, 13th, 17th, 19th and 23rd being switched on adding one filter at a time, all the parameters in the nonlinear system show a significant and gradual improvement as compare to configuration Case 3: THD decreased from 24.29% to 7.6%, current decreased by 28 A, available active power increased by 170 kW, required apparent power decreased by 690 kVA and true power factor improved from 0.96 to 0.99. Power losses do not improve significant due to some residual harmonics still flowing through the system creating further resonances.
V. CONCLUSIONS The discussion in this paper indicates the significance of
PFC and harmonics pollution. With the correct methodology and consideration of other limiting and aggravating factors such as resonance and harmonics respectively, PFC lead to energy savings. It is to be noted that the results above are as a result of one substation, the injection of harmonics at one point in the network and PFC at only four feeders and a harmonic filter at one feeder only. The losses in the lines and transformer are not computed in this study as it was not yet completed at the time of compiling this article. Thus, a significant improvement in the system efficiency can be realised if the improvement of PF and elimination of harmonics can be applied in the whole network.
This study can be further investigated and serve as a guide to implement a pilot power quality mitigation in MV distribution system in Republic of South Africa for which the authors are busy collecting data and exploring further.
ACKNOWLEDGMENT The authors would like to thank ESKOM-South Africa for the support on getting relevant data for this case study.
REFERENCES [1] L.I. Eguiluz and J. Arrillaga, “Comparison of power definitions in the
presence of waveform distortion”, International journal of electrical engineering education, Vol. 32, pp.141-153, 1995.
[2] F.C. Parentoni, J.G Policarpo and F.N. Belchior, “Electrical losses calculation under non-ideal conditions: computational versus experimental analysis”, Harmonics and Power (ICHQP), 14th international conference, January 2010
[3] K. Folly, “Reactive Power Compensation, Instructor led training course”, Eskom Academy of Learning in association with engineering centre of excellence, 2010
[4] L. Cividino, “Power Factor, Harmonic Distortion; Causes, Effects and Considerations”, 14th International Telecommunications Energy Conference, INTELEC '92, pp. 506-509, August 1992.
[5] R. Gilleskie & W. Grady “Harmonics and how they relate to power factor”, Proc. of the EPRI Power Quality Issues and Opportunities Conference (PQA 93), November 1993.
[6] R. Ellenbogen, “At Load Power Factor Correction: A Pilot Project to determine the feasibility and economics of small scale “At Load” Power Factor Correction” New York State Energy Research and Development Authority, August 2010
[7] U. Celtekligil, “Capacitive Power Factor and Power Quality Correction of a Light Rail Transportation System” 50th International Symposium ELMAR, Vol. 2, 2008.
[8] IEEE 1159-2009, “IEEE recommended practice for monitoring electric power quality” Transmission and Distribution Committee of the IEEE Power & Energy Society, page 19.
[9] NRS048-2:2007, “Electricity Supply - Quality of Supply, Part 2: Voltage characteristics, compatibility levels, limits and assessment methods” page 18.
[10] G.W. Chang, Xu, W., & Ribeiro, P. F. “Modelling of harmonic sources-power electronic converters”. Pulse 10.009: 008. APA, Chicago, 1998
[11] IEEE, “IEEE Standard Definitions for the Measurement of Electric Power Quantities under Sinusoidal, Nonsinusoidal, Balanced, or Unbalanced Conditions”, IEEE Std. 1459-2000

[12] L.K. Kirmacher, “Economic Operation of Power Systems”, Wiley Eastern Limited, New Delhi, 1979
[13] N. Vempati, R.R. Shoults, M.S. Chen and L. Schwobel, “Simplified Feeder Modelling for Loadflow Calculation”, IEEE Trans. On Power Systems, Vol. PWRS-2, No.1, pp. 168-174, Feb. 1987
[14] C.S. Chen, J.C. Hwang, M.Y. Cho and Y.W. Chen, “Development of Simplified Loss Models for Distribution System Analysis”, IEEE Trans. on Power Delivery, Vol. 9, No. 3, pp. 1545-1551, July 1994
[15] S.W. Kau and M.Y. Cho, “Distribution Feeder Loss Computation by Artificial Neural Network”, Industrial and Commercial Power System Technical Conference, pp. 73-78, 1995
[16] Jian Liu, Bi Pengxiang, Z. Yanqing and Wu Xiaomeng, “Power Flow Analysis on Simplified Feeder Modelling”, IEEE Trans. On Power Delivery, Vol. 19, No. 1, pp. 279-287, Jan. 2004
[17] R.F. Arritt, R.G. Dugan and T.A. Short, “Determining Loss Factor with the Use of Sequential-Time Simulations”, IEEE Trans. On Ind. Applications, Vol. 51, No. 2, pp.1933-1937, March/April 2015
[18] R.G. Dugan and B.W. Kennedy, “Industrial Capacitor Application procedures for Loss Reduction and Estimation of Harmonics” 13th Annual Meeting, Industry Applications Conference, IAS’95, pp. 1117-1122
Motlalepula Felix Dlamini received the B-Tech. degree in electrical engineering from the Vaal University of Technology, South Africa in 2007. Since then, he worked for Rotek Engineering and Eskom R&D as transformers faults investigating technician and a high voltage research engineer, respectively.
He is currently working at Eskom’s integrated demand management as an energy efficiency programme manager. He is currently registered as a candidate engineering technologist with ECSA and completing Magister Technology degree.
Dan Valentin Nicolae, born in Romania 18/09/1948,
has got his first degree Master in (Applied) Electronic Engineering in 1971 from University Polytechnic of Bucharest, Romania.
Between 1971 and 1975 he was with Institute for Nuclear Technologies as design engineer, than in 1975 he joined National Institute for Scientific and Technical Creativity – Avionics Branch in Bucharest Romania as principal researcher.
In 1998, DV Nicolae joined Tshwane University of Technology as lecturer for heavy current subjects. In 2000 he started his research activity in TUT with a stage in France; with this opportunity he started his PhD which has been finalized in 2004. In 2015 he joined University of Johannesburg. Presently, Prof. DV Nicolae is involved in research in power converters for power systems and electric machines.