Embed Size (px)
Citation preview

NeuroImage 93 (2014) 276–291
Contents lists available at ScienceDirect
NeuroImage
j ourna l homepage: www.e lsev ie r .com/ locate /yn img
Review
An approach for parcellating human cortical areas usingresting-state correlations
Gagan S. Wig a,⁎,1, Timothy O. Laumann a,1, Steven E. Petersen a,b,c,d
a Department of Neurology, Washington University School of Medicine, St. Louis, MO, USAb Department of Psychology, Washington University School of Medicine, St. Louis, MO, USAc Department of Radiology, Washington University School of Medicine, St. Louis, MO, USAd Department of Anatomy and Neurobiology, Washington University School of Medicine, St. Louis, MO, USA
⁎ Corresponding author at: Center for Vital Longevity, UE-mail address: [email protected] (G.S. Wig).
1 These authors contributed equally to this work.
1053-8119/$ – see front matter © 2013 Elsevier Inc. All rihttp://dx.doi.org/10.1016/j.neuroimage.2013.07.035
a b s t r a c t
a r t i c l e i n f oArticle history:Accepted 9 July 2013Available online 19 July 2013
Resting State Functional Connectivity (RSFC) reveals properties related to the brain's underlying organizationand function. Features related to RSFC signals, such as the locations where the patterns of RSFC exhibit abrupttransitions, can be used to identify putative boundaries between cortical areas (RSFC-Boundary Mapping). Thelocations of RSFC-based area boundaries are consistent across independent groups of subjects. RSFC-basedparcellation converges with parcellation information from other modalities in many locations, including task-evoked activity and probabilistic estimates of cellular architecture, providing evidence for the ability of RSFC toparcellate brain structures into functionally meaningful units. We not only highlight a collection of these obser-vations, but also point out several limitations and observations that mandate careful consideration in using andinterpreting RSFC for the purposes of parcellating the brain's cortical and subcortical structures.
© 2013 Elsevier Inc. All rights reserved.
Contents
Introduction . . . . . . . . . . . . . . . . . . . . . . . . . . . . . . . . . . . . . . . . . . . . . . . . . . . . . . . . . . . . . . . . 277RSFC can be used to identify area borders in groups of individuals . . . . . . . . . . . . . . . . . . . . . . . . . . . . . . . . . . . . . . . . 277
RSFC-Boundary Mapping identifies locations of abrupt transitions in patterns of resting-state correlations . . . . . . . . . . . . . . . . . . . . . 278RSFC-defined borders are highly similar across independent groups of individuals . . . . . . . . . . . . . . . . . . . . . . . . . . . . . . 278
RSFC-defined borders exhibit strong correspondence with task-activation maps . . . . . . . . . . . . . . . . . . . . . . . . . . . . . . . . . 279Meta-analysis of task-evoked data reveals locations sensitive to a variety of signal types . . . . . . . . . . . . . . . . . . . . . . . . . . . . 279RSFC borders separate clusters of task-evoked data . . . . . . . . . . . . . . . . . . . . . . . . . . . . . . . . . . . . . . . . . . . . 280
RSFC-defined borders respect architectonic divisions in some locations . . . . . . . . . . . . . . . . . . . . . . . . . . . . . . . . . . . . . 280RSFC borders exhibit overlap with architectonic divisions defining primary visual cortex . . . . . . . . . . . . . . . . . . . . . . . . . . . . 281
RSFC can be used to identify the locations of area centers . . . . . . . . . . . . . . . . . . . . . . . . . . . . . . . . . . . . . . . . . . . . 282RSFC-Snowball sampling identifies locations where resting-state correlation peaks aggregate . . . . . . . . . . . . . . . . . . . . . . . . . . 283RSFC-defined centers and borders compliment one-another . . . . . . . . . . . . . . . . . . . . . . . . . . . . . . . . . . . . . . . . 283
RSFC-defined borders not only overlap with RSFC-defined system boundaries, but also reveal plausible areal divisions within the identified systems . . 284RSFC clusters, communities, and components are not equivalent to areas . . . . . . . . . . . . . . . . . . . . . . . . . . . . . . . . . . . 284RSFC-defined area borders are consistent with RSFC-defined system boundaries in many locations . . . . . . . . . . . . . . . . . . . . . . . 284RSFC-defined systems contain multiple areal divisions . . . . . . . . . . . . . . . . . . . . . . . . . . . . . . . . . . . . . . . . . . . 284
Additional constraints and considerations . . . . . . . . . . . . . . . . . . . . . . . . . . . . . . . . . . . . . . . . . . . . . . . . . . . 285Relationship of RSFC-defined borders to BOLD signal strength . . . . . . . . . . . . . . . . . . . . . . . . . . . . . . . . . . . . . . . . 285Relationship of RSFC-defined borders to surface geometry . . . . . . . . . . . . . . . . . . . . . . . . . . . . . . . . . . . . . . . . . 286RSFC-based parcellation of subcortical structures . . . . . . . . . . . . . . . . . . . . . . . . . . . . . . . . . . . . . . . . . . . . . 287
Concluding comments . . . . . . . . . . . . . . . . . . . . . . . . . . . . . . . . . . . . . . . . . . . . . . . . . . . . . . . . . . . 287Acknowledgments . . . . . . . . . . . . . . . . . . . . . . . . . . . . . . . . . . . . . . . . . . . . . . . . . . . . . . . . . . . . . 287Appendix A. Methods . . . . . . . . . . . . . . . . . . . . . . . . . . . . . . . . . . . . . . . . . . . . . . . . . . . . . . . . . . 287
Subjects . . . . . . . . . . . . . . . . . . . . . . . . . . . . . . . . . . . . . . . . . . . . . . . . . . . . . . . . . . . . . . . . 287
niversity of Texas at Dallas, 1600 Viceroy Drive, Suite 800, Dallas, TX, 75219, USA.
ghts reserved.

277G.S. Wig et al. / NeuroImage 93 (2014) 276–291
Data acquisition parameters . . . . . . . . . . . . . . . . . . . . . . . . . . . . . . . . . . . . . . . . . . . . . . . . . . . . . . . 287Image preprocessing . . . . . . . . . . . . . . . . . . . . . . . . . . . . . . . . . . . . . . . . . . . . . . . . . . . . . . . . . 287RSFC preprocessing . . . . . . . . . . . . . . . . . . . . . . . . . . . . . . . . . . . . . . . . . . . . . . . . . . . . . . . . . 287Surface preprocessing . . . . . . . . . . . . . . . . . . . . . . . . . . . . . . . . . . . . . . . . . . . . . . . . . . . . . . . . 287RSFC-Boundary Mapping . . . . . . . . . . . . . . . . . . . . . . . . . . . . . . . . . . . . . . . . . . . . . . . . . . . . . . . 287RSFC-Snowball sampling . . . . . . . . . . . . . . . . . . . . . . . . . . . . . . . . . . . . . . . . . . . . . . . . . . . . . . . 287
Conflict of interest . . . . . . . . . . . . . . . . . . . . . . . . . . . . . . . . . . . . . . . . . . . . . . . . . . . . . . . . . . . . . 287References . . . . . . . . . . . . . . . . . . . . . . . . . . . . . . . . . . . . . . . . . . . . . . . . . . . . . . . . . . . . . . . . 287
287287288288288289290290
Introduction
The brain is organized atmultiple spatial scales ranging fromneuronsto systems of functionally related areas (Sejnowski and Churchland,1989). Area2 parcellation has principally relied on discriminating areasbased on the convergence of multiple underlying properties includingfunction, architectonics (cyto-, mylo-, and chemo-), connectivity, andin some cases, topographic mapping (e.g., Felleman and Van Essen,1991). An areal level of organization as revealed by distinctions inthese properties is not limited to primary sensory areas (e.g., Foerster,1936; Gennari, 1782; Hubel and Wiesel, 1962; Kaas et al., 1979;Marshall et al., 1937), but rather, is evident across the brain. For example,borders of area MT in themacaque monkey (also known as area V5) canbe defined by MT's independent representation of the visual field, thepresence of neurons with sensitivity to processing properties of visualmotion, distinct patterns of incoming and outgoing connections, andthe thick band of myelin that is present in layer IV (e.g., Van Essenet al., 1981). Likewise, distinctions in patterns of connectivity and archi-tectonics have been used to parcellate ventral and medial frontal cortexinto distinct areas in the macaque monkey (Carmichael and Price, 1994,1996) and human (Ongur et al., 2003). While many of the tools used toidentify areal boundaries have typically required invasivemeasurementsor histological analysis of post-mortem brains, recent advances in brainimaging acquisition and analysis have offered an opportunity toparcellate brain areas non-invasively in living subjects (e.g., the presentspecial issue on In vivo Brodmann mapping in neuroimage).
Defining areas using functional distinctions in humans has largelybeen accomplished by dissociating adjacent locations based on their pat-terns of task-evoked activity (e.g., Petersen et al., 1988; Sereno et al.,1995). More recently, attempts to functionally distinguish brain regionshave leveraged the observation that the brain exhibits structured and or-dered patterns of low-frequency functional correlations in the absence ofovert task demands (Resting State Functional Connectivity (RSFC); Biswalet al., 1995). The prevalence of organized patterns of RSFC across levels ofarousal makes RSFC well suited to understanding the function andorganization of individuals that span ranges of age, mental health, andeven species.
The precise significance of RSFC is uncertain; however, accumulatingevidence suggests that resting-state correlations identify locations thatare functionally similar with one another (for reviews see Biswal et al.,2010; Fox and Raichle, 2007). Furthermore, although RSFC relationshipsare likelymediated by anatomical connectivity, they are not restricted todirect structural connections (e.g., Honey et al., 2009; Vincent et al.,2007; for reviews see Deco et al., 2011; Wig et al., 2011). For thesereasons, using resting-state correlations as a property bywhich to under-stand brain organization is likely drawing on information related to acombination of an area's functional role and its underlying anatomicalconnectivity.
RSFC has been used to identify putative areal divisions or boundariesby identifying locations where patterns of RSFC exhibit abrupt transi-tions (RSFC-Boundary Mapping; Cohen et al., 2008). RSFC-based area
2 The term ‘area’ is conventionally restricted to parcellations of the cerebral cortex andthe discussion that follows largely focuses on cortical divisions. It should be noted howev-er, thatmany of the general ideas regarding parcellation thatwill be discussed here are ap-plicable to cortical areas as well as subdivisions of subcortical nuclei and the cerebellum.
parcellations using boundary detection have been described for numer-ous locations including regions of the parietal cortex (Barnes et al.,2012; Nelson et al., 2010a), frontal cortex (Cohen et al., 2008; Hiroseet al., 2012; Nelson et al., 2010b), and across expanses of the wholebrain (Wig et al., 2013). Notably, there have been a number of additionalapplications of RSFC-based analysis with the goal of identifying areas(and also systems) in the brain (e.g., Deen et al., 2011; Doucet et al.,2011; Goulas et al., 2012; Kahnt et al., 2012; Kelly et al., 2010; Kimet al., 2010, 2013; Leech et al., 2012; Margulies et al., 2009; Mars et al.,2012; Mumford et al., 2010; Power et al., 2011; Ryali et al., 2013;Smith et al., 2009; Uddin et al., 2010; Yeo et al., 2011; Zhang et al.,2008).We return to the important distinction between boundary detec-tion and alternate RSFC-basedmethods asmeans for area parcellation ata later point.
Rather than reviewing the growing body of work that has examinedRSFC to identify brain areas and systems, we will utilize this article as aplatform to describe some of our recent efforts towards parcellatinglarge expanses of the cerebral cortex using patterns of RSFC. We recog-nize that the approaches for parcellating brain areas using patterns ofRSFC are under continuous revision and refinement, and will continueto improve. Here we will highlight our groups most recent progress inthis endeavor and provide descriptions of some important observations,caveats, and places for potential improvement in using RSFC to parcellatebrain areas. Our aims are three-fold. First, we aim to demonstrate thatthe borders revealed by RSFC-Boundary Mapping reflect locations ofRSFC pattern transition and are highly similar across independent groupsof subjects. Second, we compare the results of RSFC-Boundary Mappingto areal distinctions revealed by other modalities (specifically, task-evoked activity and architectonics) to demonstrate the strong conver-gence across methods of parcellation in certain locations. Third, we con-trast RSFC-Boundary Mapping to other RSFC-based methods that havebeen used to identify functional area centers or cluster groups of func-tionally related voxels across large expanses of the brain. Throughoutthe report, we will also draw attention to a number of observationsand limitations for using RSFC to parcellate areas, and discuss their impli-cations towards both the theory and practice of RSFC-based parcellation.
RSFC can be used to identify area borders in groups of individuals
Brain imaging permits areal parcellation in individual subjects and arelated article describes our recent efforts towards this endeavor usingRSFC (Wig et al., 2013). We draw attention to two observations fromthat report: (1) RSFC parcellationmaps exhibit significantly higher sim-ilarity between independent scans of the same individual from differentdays than between scans fromdifferent individuals (seeWig et al., 2013,Fig. 11 and Supplementary Fig. 4). The between subject variability inRSFC parcellation is consistent with reports that have demonstratedsubject-wise variability in brain area organization as defined by task-evoked activity (e.g., Dougherty et al., 2003; Fedorenko et al., 2010;Sabuncu et al., 2010), architectonics (e.g., Amunts et al., 2004; Casperset al., 2006), anatomical connectivity (e.g., Johansen-Berg et al., 2005),and macroscopic anatomy (e.g., Van Essen, 2005). (2) Despite the pres-ence of individual differences in area parcellation, numerous featuresrevealed by RSFC parcellation are consistent across individuals (seeWig et al., 2013, Fig. 12). Accordingly, for the present work, rather

a b
Fig. 1.Patterns of RSFC exhibit abrupt changes across the cortical surface. (a) RSFCmapswere derived for locations (R2–R8) between a region in theposterior extent of the cingulate cortex(PCC) and a region in the paracentral lobe (PCL) in a group of subjects (n = 40; defined anatomically; locations are shown as colored balls). The plot to the right depicts the similarity(spatial correlation) of every location's RSFC map with the RSFC map of each of the other locations. RSFC maps are similar from PCC to R4, followed by a location of abrupt change(R5), and then a second set of locations where the maps are highly self-similar. Similarity lines and location balls have been color coded to denote greater RSFC similarity with PCC(blue) or PCL (pink). The location whose RSFC map was not similar to either the PCC or PCL group (R5) is color-coded orange. The RSFC maps of a subset of the regions are depictedon the lower panel, and two locations with prominent differences between maps are highlighted by arrows (the angular gyrus on the lateral views and anterior cingulate gyrus on themedial views). (b) RSFC-Boundary map for a group of subjects (n = 40). The coloring highlights where patterns of RSFC exhibit abrupt transitions (i.e., putative areal borders) and loca-tions where patterns of RSFC are relatively stable. Locations highlighted in panel (a) are displayed on the medial surface— the identified transition point (orange) is at a location of highborder likelihood.
278 G.S. Wig et al. / NeuroImage 93 (2014) 276–291
than focusing on parcellating individual brains that exhibit numeroussources of variation, we adopt a strategy that highlights the commonal-ities across individuals from a single cohort and report ‘group-based’parcellations. While a group-based strategy might obscure importantand interesting parcellation variationwithin a population, it permits iden-tification of the consistent parcellation features across the population.
There are a number of ways to derive a group-based RSFCparcellation. The primary difference across methods relates to the pro-cessing stage at which individuals are combined to create group esti-mates, and each alternative will potentially introduce the influence ofdifferent sources of variation. We refer the interested reader toAppendix A of this report for details of the methods we have usedhere to arrive at group-based RSFC parcellations.
3 Spatial gradient maps can exhibit features reflecting a high level of variability in themagnitude of correlationmap changes (cf. Fig. 9— step 6, andWig et al., 2013), suggestingthat even adjacent cortical areas identified in this way will not be equally separable fromone another in terms of their patterns of RSFC. In the present work, we have applied anedge detection technique that emphasizes the locationswhere there is a gradient present.The edges are agnostic as to how large the correlation pattern change underlying the tran-sition is. Thus large and small correlation pattern changes can both have high values in theedge probability map as long as the location of transition is consistently identified.
4 Parcellation features may also include an area interior/extent or an area geometriccenter.
RSFC-BoundaryMapping identifies locations of abrupt transitions in patternsof resting-state correlations
RSFC-Boundary Mapping rests on the assumption that an area'sRSFC correlations are relatively uniform within the extent of an area,yet may be distinct from the RSFC of an adjacent area (Cohen et al.,2008). In this view, locations where the patterns of RSFC exhibit abrupttransitions can be considered putative boundaries between areas acrossthe cortical surface. This concept is illustrated in Fig. 1. By computingand comparing the average seed-based RSFC maps from a group ofyoung adults (N = 40) for a line of seeds across a portion of the corticalsurface, we can see that the RSFC correlation maps do not changesmoothly, but rather, exhibit rapid and abrupt changes (Fig. 1a). Fur-thermore, these locations of change are consistent in both directions(i.e., from an inferior location in the posterior extent of the cingulategyrus to a more superior location in the paracentral lobe, or in reverse),suggesting the presence of a functional boundary between two adjacent
areas. This basic approach can be extended across the cortical surfacewith the aid of image-processing tools to create a vertex-wise estimateof the likelihoodwithwhich a location is identified as anRSFC boundary(i.e., a spatial gradient of changes in correlation map similarity, or itscorresponding edge 3) between two locations in the brain (Fig. 1b; seeAppendix A—Methods formethod details). The RSFC boundarymap re-veals locations where patterns of RSFC exhibit a transition (hottercolors), and locationswhere the patterns of RSFC aremore locally stable(cooler colors). We hypothesize that the locations of transitions arestrong candidates for the locations of boundaries between distinctareas.
RSFC-defined borders are highly similar across independent groups ofindividuals
We argue that group-based parcellation may deemphasize some ofthe inherent variability across groups of individuals (both anatomicaland otherwise) to reveal the parcellation features (in the current case,areal boundaries4) that are consistent across individuals. If this is thecase, then RSFC-Boundary Mapping parcellations from independentgroups of individuals sampled from the same cohort should be highlysimilar. Fig. 2a depicts the group-based RSFC Boundary Mapping maps
a
b
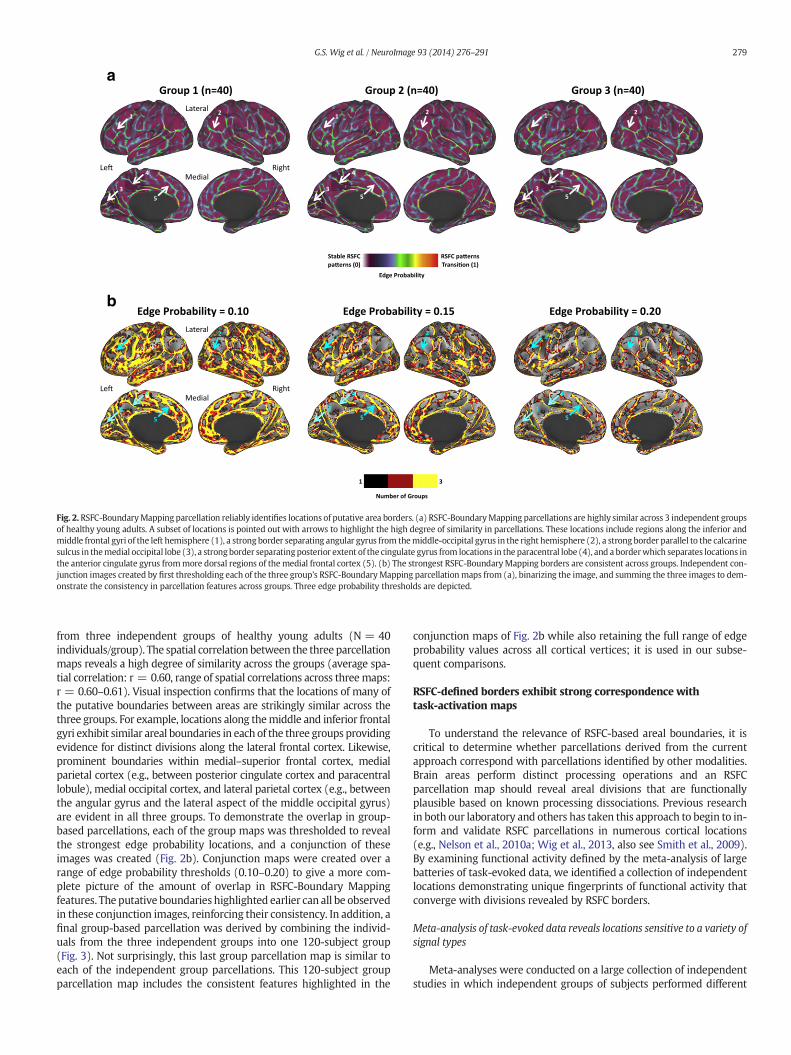
Fig. 2.RSFC-BoundaryMapping parcellation reliably identifies locations of putative area borders. (a) RSFC-BoundaryMapping parcellations are highly similar across 3 independent groupsof healthy young adults. A subset of locations is pointed out with arrows to highlight the high degree of similarity in parcellations. These locations include regions along the inferior andmiddle frontal gyri of the left hemisphere (1), a strong border separating angular gyrus from themiddle-occipital gyrus in the right hemisphere (2), a strong border parallel to the calcarinesulcus in themedial occipital lobe (3), a strongborder separatingposterior extent of the cingulate gyrus from locations in the paracentral lobe (4), and a borderwhich separates locations inthe anterior cingulate gyrus frommore dorsal regions of themedial frontal cortex (5). (b) The strongest RSFC-BoundaryMapping borders are consistent across groups. Independent con-junction images created by first thresholding each of the three group's RSFC-BoundaryMapping parcellationmaps from (a), binarizing the image, and summing the three images to dem-onstrate the consistency in parcellation features across groups. Three edge probability thresholds are depicted.
279G.S. Wig et al. / NeuroImage 93 (2014) 276–291
from three independent groups of healthy young adults (N = 40individuals/group). The spatial correlation between the three parcellationmaps reveals a high degree of similarity across the groups (average spa-tial correlation: r = 0.60, range of spatial correlations across threemaps:r = 0.60–0.61). Visual inspection confirms that the locations of many ofthe putative boundaries between areas are strikingly similar across thethree groups. For example, locations along themiddle and inferior frontalgyri exhibit similar areal boundaries in each of the three groups providingevidence for distinct divisions along the lateral frontal cortex. Likewise,prominent boundaries within medial–superior frontal cortex, medialparietal cortex (e.g., between posterior cingulate cortex and paracentrallobule), medial occipital cortex, and lateral parietal cortex (e.g., betweenthe angular gyrus and the lateral aspect of the middle occipital gyrus)are evident in all three groups. To demonstrate the overlap in group-based parcellations, each of the group maps was thresholded to revealthe strongest edge probability locations, and a conjunction of theseimages was created (Fig. 2b). Conjunction maps were created over arange of edge probability thresholds (0.10–0.20) to give a more com-plete picture of the amount of overlap in RSFC-Boundary Mappingfeatures. The putative boundaries highlighted earlier can all be observedin these conjunction images, reinforcing their consistency. In addition, afinal group-based parcellation was derived by combining the individ-uals from the three independent groups into one 120-subject group(Fig. 3). Not surprisingly, this last group parcellation map is similar toeach of the independent group parcellations. This 120-subject groupparcellation map includes the consistent features highlighted in the
conjunction maps of Fig. 2b while also retaining the full range of edgeprobability values across all cortical vertices; it is used in our subse-quent comparisons.
RSFC-defined borders exhibit strong correspondence withtask-activation maps
To understand the relevance of RSFC-based areal boundaries, it iscritical to determine whether parcellations derived from the currentapproach correspond with parcellations identified by other modalities.Brain areas perform distinct processing operations and an RSFCparcellation map should reveal areal divisions that are functionallyplausible based on known processing dissociations. Previous researchin both our laboratory and others has taken this approach to begin to in-form and validate RSFC parcellations in numerous cortical locations(e.g., Nelson et al., 2010a; Wig et al., 2013, also see Smith et al., 2009).By examining functional activity defined by the meta-analysis of largebatteries of task-evoked data, we identified a collection of independentlocations demonstrating unique fingerprints of functional activity thatconverge with divisions revealed by RSFC borders.
Meta-analysis of task-evoked data reveals locations sensitive to a variety ofsignal types
Meta-analyses were conducted on a large collection of independentstudies in which independent groups of subjects performed different

Fig. 3. RSFC-Boundary Mapping parcellation from combined group (N = 120) of healthy young adult subjects. The coloring highlights where patterns of RSFC exhibit abrupt transitions(i.e., putative areal borders) and locations where patterns of RSFC are relatively stable.
280 G.S. Wig et al. / NeuroImage 93 (2014) 276–291
tasks with different stimuli. Eachmeta-analysis was aimed at identifyingbrain regions that reliably displayed significant activity when certaintasks were performed (e.g., reading) or certain signal types wereexpected (e.g., error-related activity). While the analyses wereconstrained by the available datasets (specifically those collectedin our laboratory), we were able to create meta-analytic maps fortask-evoked activity focused on error-related processing, task-induced deactivations, task-initiation, memory (episodic retrieval),language (reading), and sensorimotor functions. All study datasetscontributing to the meta-analyses were acquired on a single scanner(a Siemens 1.5 Tesla Magnetom Vision MRI scanner), which was dis-tinct from the scanner used to acquire the RSFC data (see Appendix A—
Methods for details). For each dataset, the voxels passing a statisticalthreshold were identified to create a binary mask, and the resultantmaps were summed to create a conjunction image for the correspond-ing meta-analysis (for subject, dataset and analysis details see Poweret al., 2011). This conjunction image indicated how often a voxel wasidentified across all the datasets associated with the given task orsignal-type. In this way, each meta-analytic conjunction image repre-sents an estimate of the spatial extent of functional areas defined bytask-related activity.
RSFC borders separate clusters of task-evoked data
For comparison to the RSFC-Boundary map, we focus on voxelsexhibiting significant activity in at least 60% of the studies contributingto each task-evoked meta-analysis. As the comparison is constrainedby available datasets, only a portion of the total cortical surface is avail-able for comparison between modalities. Fig. 4 demonstrates that loca-tions demonstrating task-induced activity tend to fall within bordersdefined by RSFC (for purposes of comparison, the 120-subject RSFC-Boundary map was thresholded at N0.15 edge probability to identifystronger borders). In several locations, RSFC-defined borders tightly sur-round clusters identified in task-evoked maps. For example, locationsdemonstrating task-induced deactivations including themedial prefron-tal cortex, angular gyrus, and posterior cingulate cortex are surroundedby RSFC borders. In other locations, contiguous voxels of activity whichappear to have multiple local maxima and associated sub-clusters areseparated by an RSFC border, suggesting the sub-clusters may be partsof different areas (e.g., in the motor-response meta-analytic map atask-related cluster in the anterior portion of the cingulate gyrus is sep-arated by an RSFC-border from amore dorsal cluster in themedial supe-rior frontal cortex likely corresponding to the supplementarymotor area,while in the episodic-memory meta-analytic map a task-related cluster
in the inferior parietal lobule is separated by an RSFC-border from a clus-ter in the angular gyrus). As a quantitative confirmation of these qualita-tive observations, we performed a chi-square test of independencebetween a composite task-map of all cortical locations exhibiting task-evoked activity in at least one meta-analytic map and the thresholdedRSFC-Boundary map. The vertices identified as having a high likelihoodof being an RSFC-defined border and the vertices identified as exhibitingtask-evoked data (i.e., putative area interiors) came from non-overlapping populations (Χ2 (1, N = 59,412) = 220.9, p ≪ 0.001).
It is important to note, however, that the correspondence betweentask-evoked activity and RSFC-borders is not perfect at all locations(e.g., not all task clusters are perfectly enclosed by RSFC borders). Thismay be a consequence of the large differences in data acquisition and pro-cessing between the two types of data (e.g., different scanners, volume-based analysis for task data vs. surface-based RSFC parcellation). Indeed,a thorough demonstration of the correspondence between RSFC-borders and task activations will require datasets that include both datatypes in the same subjects. This caveat notwithstanding, there may re-main true discrepancies between thesemodalities thatwillmandate clos-er examination of the sources of disparity. Resting state and task-evokedactivity may highlight different aspects of the brain's functionalorganization.
RSFC-defined borders respect architectonic divisions insome locations
In addition to functional dissociations, identifying the transitionsin architectonic features has been a standard approach towardsparcellating human cortical areas since (Brodmann, 1909).More recently,probabilistic maps of a collection of cortical areas have been defined byquantitative procedures thatmeasure changes in the laminar distributionof cell-body density across the cortical surface in a set of post-mortemhuman brains (Amunts et al., 2000; Schleicher and Zilles, 1990;Schormann and Zilles, 1998). Surface-based representations of thesemaps, as well as a number of other parcellations, are available in thesumsDB database (http://sumsdb.wustl.edu/) and have been describedat greater length elsewhere (Fischl et al., 2008; Van Essen et al., 2012). Di-rect comparisons betweenmaps derived from post-mortem dissection ofhuman brains and the in-vivo RSFC parcellation described hitherto haveclear caveats towards interpretation. Determining the precise conver-gence between architectonics and RSFC will be best accomplished by in-corporating imaging methods that can reveal cellular and sub-cellularfeatures of anatomy, and there are numerous efforts to do so (Dicket al., 2012; Glasser and Van Essen, 2011; Toga et al., 2006). Keeping

Fig. 4. RSFC-BoundaryMapping parcellation exhibits a high degree of correspondencewith areas defined by task-evoked activity. Task-evoked activity was derived frommeta-analyses ofmultiple studies to highlight locations exhibiting sensitivity to performance of certain tasks (e.g., reading) or certain signal types (e.g., error-related activity). The 120-subject RSFC-BoundaryMapping parcellationwas thresholded (edge probability N0.15) to reveal locations exhibiting a high likelihood of being a border between areas. Many area locations defined by task-evokedactivity are surrounded by RSFC-borders (e.g., the cluster of activity in the ventral medial prefrontal cortex in the task-induced deactivation meta-analytic map). In other locations RSFC-borders separate what appear to be distinct clusters of task-evoked activity, suggesting the existence of distinct areas (e.g., a cluster of activity in the inferior parietal lobule is separatedfrom a cluster of activity in the angular gyrus in the episodic memory meta-analysis map). Parcellations are overlaid on inflated cortical surfaces; some surfaces have been tilted to facil-itate viewing (i.e., the lateral surface of the right hemisphere in themotor response (button pushing) comparison and the lateral surface of the left hemisphere in the error-related activitycomparison).
281G.S. Wig et al. / NeuroImage 93 (2014) 276–291
this limitation inmind,we describe preliminary observations that suggestRSFC-based parcellations may converge with features related to underly-ing cellular anatomy.
RSFC borders exhibit overlap with architectonic divisions defining primaryvisual cortex
While the precise correspondence between probabilistic maps ofcyto-architecture based on post-mortem histology and RSFC-basedboundaries may be difficult to ascertain due to the very differentmethods and underlying properties used to create these parcellations,we highlight here an important instance where they appear to con-verge. Fig. 5a depicts the probabilistic estimates of areas 17 and 18(herein referred to as probabilistic area (PA) 17 and 18). These architec-tonic areas have been shown to have reasonable correspondence withretinotopic maps of V1 and V2 (V1 more clearly than V2; Hinds et al.,2009; Van Essen et al., 2012). The architectonic boundaries are overlaidon amedial occipital view of the RSFC-Boundarymap as black lines. Theborder between PA 17 and PA 18 overlaps with a prominent border inthis map that runs both ventral and dorsal to the calcarine sulcus.
These RSFC-based borders were also consistently observed in each ofthe individual group parcellations (see arrow ‘3’ in Fig. 2).
Fig. 5b demonstrates howRSFC seedmaps differ on either side of theRSFC-Boundary Mapping defined border (calculated across all 120 sub-jects).When a seed is placed ventral to the calcarine sulcus but dorsal toan RSFC-defined border (gray ball labeled ‘17’ in Fig. 5a), resting-statecorrelations are prominent within PA 17 but bound by the RSFC-defined borders separating PA 17 from PA 18. Conversely, a seed regionon the opposing side of the RSFC-defined border (gray ball labeled ‘18’in Fig. 5a) exhibits the strongest resting-state correlations with loca-tions within PA 18, both dorsal and ventral to the calcarine sulcus. Thedifference between these two seed-based maps is best appreciated inthe statistical difference image (t(119) = 3.38, p b 0.001); a collectionof other more distal locations also exhibit differential connectivity as afunction of seed location. Accordingly, the presence of a RSFC-definedborder separating PA 17 from PA 18 likely reflects differences in bothlocal and global correlation patterns.
Notably, there are additional borders found by RSFC-BoundaryMappingwithin PA17. For example, a border running along the calcarinesulcus (red arrow, labeled ‘1’) approximates the position of the

b
a
Fig. 5. RSFC-BoundaryMapping compared to cyto-architectonically-defined probabilistic areas (PA) 17 and 18. (a)Medial occipital view of PA 17 and PA 18 (Fischl et al., 2008) and 120-sub-ject RSFC-Boundarymap. Black lines indicate reasonable boundaries between and around areas 17 and18 as described inVan Essen et al. (2012). Thewhite arrows indicate dorsal and ventralRSFC boundaries that appear to closely correspond to the architectonic boundary. The RSFC-based borders are also apparent in each of the individual groups (see Fig. 2). Red arrow1 indicatesa boundary along the calcarine fissure that may correspond to the horizontal meridian of PA 17 (Visual Area 1). Red arrow 2 indicates a boundary that is likely due to susceptibility artifact atthe occipital pole (see Fig. 8a). (b) Correlation maps generated from ventral PA 17 and PA 18 seeds (gray balls) and the differences between them. Green and black arrows highlight the lo-cationsof strongest correlations for seeds inPA17 and PA18, respectively. Thedifferences between the two seeds can be best appreciated on the statistical differencemap,which is calculatedas a surface vertex-wise two-sample t-test between the correlation maps of the two seeds. Note that the contour of the difference image follows the PA 17/18 boundary.
282 G.S. Wig et al. / NeuroImage 93 (2014) 276–291
horizontal meridian in retinotopic maps of V1 and may reflect differ-ences in RSFC between the upper and lower visual fields of V1. Likewisea border running along the dorsal–ventral axis mid-way through PA 17may divide themore central vs. peripheral visual representations of thisarea. The presence of additional borders within a cortical area charac-terized by topographic mapping is consistent with the RSFC-baseddivision between mouth and hand regions of primary motor and so-matosensory cortex that has been reported by network estimationmethods elsewhere (e.g., Power et al., 2011; Yeo et al., 2011). This divi-sion ofmotor/somatosensory cortex can also be seen in the parcellationmaps presented here (e.g., see borders surrounding the dorsal motorcortex surrounding button-push related task activity and in the ventralmotor cortex surrounding reading-related task activity in Fig. 5).Importantly, a number of divisions are also apparent along the pre-and post-central gyri, and exhibit correspondence with other probabi-listic area divisions (e.g., PA 1 vs. 2, PA 2 vs. 3b; see post-central gyrusin lateral views in Fig. 4). All together, these observations are criticalto evaluate: they likely reflect the special nature of the informationRSFC brings to bear towards understanding area organization and func-tion but also stress caution when interpreting the presence of RSFCboundaries in the absence of parcellation information from othermodalities.
The RSFC-Boundary Mapping border corresponding to the PA 17/PA18 border extends somewhat further laterally beyond the occipital polethan the cyto-architectonic boundary (while a lateral view is notpresented in Fig. 5, a lateral view of the RSFC-Boundary Mapping bor-ders are presented in Fig. 3). This discrepancy, along with an aberrantborderwithin PA 17 (Fig. 5a: red arrow, labeled ‘2’),may be due to inad-equacies in the scan acquisition and processing— in particular, field dis-tortions and/or signal loss related to vasculature at the occipital polelikely affected the position of borders measured here (see subsequentAdditional constraints and considerations section and red arrow labeled‘4’ in Fig. 8a).
RSFC can be used to identify the locations of area centers
RSFC patterns can also be leveraged to reveal alternative featuresthat may relate to area organization. So far, we have described howidentifying locations where patterns of RSFC exhibit an abrupttransition can be used for identifying borders between putativeareas. An alternative strategy is to focus on identifying the interior(or central) parts of areas rather than the boundaries betweenthem. We use an RSFC approach that aims to directly identifythese interior regions and suggests that RSFC-based areal center

283G.S. Wig et al. / NeuroImage 93 (2014) 276–291
identification may help parcellate areas that are not clearly distin-guished by RSFC-Boundary Mapping (Wig et al., 2013). In general,these two approaches to RSFC-based area definition should be highlycomplimentary to one another.
RSFC-Snowball sampling identifies locations where resting-state correlationpeaks aggregate
Our method for identifying candidate locations for the centralportions of areas combines seed-based RSFC with principles inspiredby social network science and graph theory (Snowball sampling;Goodman, 1961; Wasserman and Faust, 1994). RSFC-Snowballsampling first identifies the peaks of correlation (i.e., neighbors)from a seed-based RSFC map, and then iteratively tracks the neigh-bors of these neighbors through multiple stages. To minimize sam-pling bias, this basic process is repeated from numerous startinglocations across the brain, and the output of each sampling proce-dure is aggregated to arrive at a final peak density map. We havepreviously described the details of using this method for parcellatingan individual subject's cortical and subcortical brain structures;RSFC-Snowballing parcellation maps are reliable within an individualscanned over multiple days, and area center locations defined byRSFC-Snowballing correspond with area center locations defined bytask-evoked data (Wig et al., 2013). To parallel the present group-based RSFC-Boundary Mapping parcellation observations, a methodfor extending the RSFC-Snowballing method to the level of groups ispresented in the Appendix A section.
RSFC-defined centers and borders compliment one-another
An RSFC-Snowballing peak densitymapwas derived for the group of120 individuals. Rather than being randomly or uniformly distributed,the RSFC-Snowballing map exhibits a structured distribution, with
Dorsal
Later
Medi
Lower RSFC-Snowballingpeak density (threshold > 0.03)
RSFC-Boundary Ma(edge probabilit
RSFC-Snowballin
Fig. 6. Area borders defined by RSFC-BoundaryMapping surround area centers defined by RSFC-area interiors (centers). This RSFC-Snowballing parcellationmapwas thresholded to highlight verMapping parcellation was thresholded to reveal locations exhibiting a high likelihood (edge proarea features (i.e., interiors and borders) andmany locations exhibit a high degree of correspondedial hemisphere and the right anterior insula in the right lateral hemispherehighlighted bywhitethe other (e.g., two area centers identified by RSFC-Snowballing [pointed out with white arrowshemisphere) encouraging the use of multiple methods for RSFC-based parcellation.
some locations having many peaks, and others having very few. IfRSFC-Boundary Mapping identifies the locations of putative boundariesbetweenareas andRSFC-Snowballing identifies the locations of putativecenters of areas, peak density values should be less prominent at loca-tions that are transition points (or boundaries) and more prominentwithin boundary interiors. Simultaneously viewing the strong bordersdefined by RSFC-Boundary Mapping and the strong centers defined byRSFC-Snowballing suggests this expectationmaybe true (Fig. 6). Impor-tantly, each of the two methods appears to reveal unique parcellationfeatures in some locations (e.g., two area centers identified by RSFC-Snowballing in the posterior–inferior temporal cortex are surroundedby an area border defined by RSFC-Boundary Mapping on the lateralright hemisphere), suggesting the two methods are not completely re-dundant with one another and can be used in combination for the pur-poses of RSFC parcellation (for more detailed examples and discussionsee Wig et al., 2013). This is consistent with the negative, but non-perfect relationship between the two RSFC-based parcellation maps(r = −0.14, p b b0.001).
The non-perfect relationship noted above may be surprising, giventhat both methods of area parcellation focus on patterns of RSFC. Thisobservation may related to a practical as opposed to conceptual differ-ence between the methods — operationally, the thresholds that aremost useful for a given method of parcellation may miss distinctionsin another method of parcellation and the different processing stepsfor each method may accentuate and attenuate non-overlappingsources of noise in RSFC. For example, adjacent areas that share verysimilar patterns of RSFC would have a weak boundary between them,yet the area centers might be highlighted by RSFC-Snowballing. Alongthese lines, there are trade-offs betweenmethods that focus on bordersbetween areas versus methods that attempt to identify area interiors.Relying on borders may result in parcellations with discontinuousboundaries if there are differences in the strength of RSFC transitionsbetween an area and the various areas that are adjacent to it. Likewise,focusing on area centers may result in a parcellation with a poor
Ventral
al
al
Higher RSFC-Snowballingpeak density
pping bordery > 0.15)
g Centers (n=120)
Snowballing. RSFC-Snowballing parcellation of 120 subjects reveals the locations of putativeticeswith high area center likelihood (peak density N0.03). The 120-subject RSFC-Boundarybability N0.15) of being a border between areas. Each parcellation method reveals differentnce between themethods (e.g., running above the posterior cingulate sulcus in the left me-boxes). In other locations, a given parcellationmethodmay identify features not revealed by] are surrounded by an area border defined by RSFC-Boundary Mapping on the lateral right

284 G.S. Wig et al. / NeuroImage 93 (2014) 276–291
representation of area extent. Accordingly, just as it is important tofocus onmultiplemodalities to accurately parcellate areas, it is advanta-geous to focus on multiple features that may distinguish areas (i.e.,boundaries and centers or interiors).
RSFC-defined borders not only overlap with RSFC-defined systemboundaries, but also reveal plausible areal divisions within theidentified systems
Voxels can be clustered or grouped based on the similarity of theirresting-state time series or their RSFC maps (e.g., using community de-tection, clustering algorithms, or independent component analysis(ICA)5; e.g., Doucet et al., 2011; Mumford et al., 2010; Power et al.,2011; Smith et al., 2009; Yeo et al., 2011). In some cases, the identifiedclusters have demonstrated a considerable degree of overlapwith func-tionally defined systems, providing evidence that patterns of RSFC canbe used to identify system-level organization (e.g., Power et al., 2011;Smith et al., 2009). Althoughmany clustering approaches have been de-scribed as methods of parcellation, it is important to recognize that thepurpose (and the outcome) of these analyses typically differs from thework presented here. Community detection, clustering, and componentseparation techniques operate on a data space that is blind to the under-lying neuroanatomy. As a consequence, RSFC-based clustering tech-niques are capable of identifying collections of voxels or locations withsimilar properties, but these collections are not bound by space andmay also group distinct adjacent areas into a single cluster. Accordingly,the majority of clustering analyses have typically identified locationsthat are functionally similar and may compose a given system (e.g.,the visual system or the default system), but do not necessarilyparcellate areas themselves (e.g., V1 versus V2 of the visual system). Di-rect comparisons of RSFC-defined systemdivisions and RSFC-based areaparcellation provide illustrations of this important distinction.
RSFC clusters, communities, and components are not equivalent to areas
Brain systems are defined as groups of functionally related areas(Sejnowski and Churchland, 1989) and RSFC clustering techniqueshave identified collections of areas (or technically, regions/voxels)that likely represent functional brain systems at the scales that havebeen prominently explored. It is important to point out that the voxelscorresponding to a given cluster are often spatially discontiguous, andcan even span the length of the brain (e.g., groupings labeled as the de-fault system typically include voxels in themedial prefrontal cortex andposterior parietal cortex; Fig. 7a). It should be clear based on this discon-tinuity alone that the identification of a cluster may reflect a granularityof organization that should not be confused with the parcellation of anarea.
RSFC-defined area borders are consistent with RSFC-defined systemboundaries in many locations
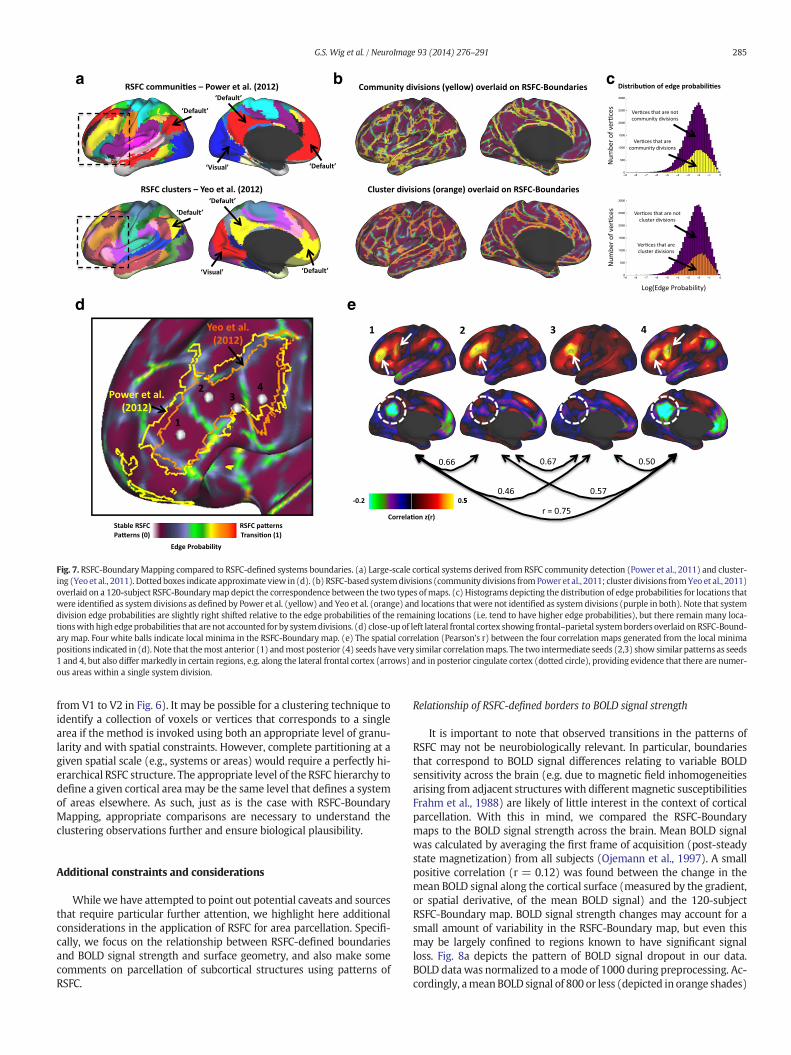
If clustering techniques are capable of identifying putative systems,and systems are composed of areas, the locations of system divisionsshould overlap with the locations of some areal boundaries. Fig. 7bdepicts the correspondence between system divisions (i.e., transitionsbetween two adjacent clusters) and the 120-subject RSFC-Boundarymap. As expected, many locations that are system divisions exhibithigh RSFC-Boundary Mapping edge probabilities. A direct comparisonof RSFC-defined boundaries and two published systems maps (Poweret al., 2011 and Yeo et al., 2011) was conducted. Fig. 7c depicts the dis-tribution of edge probability values across all cortical vertices. Two sep-arate distributions are presented in each histogram: the subset of edge
5 While there are important differences across each of thesemethods, for simplicity wewill refer to the collection ofmethods as ‘clustering techniques’ and the identified units as‘clusters’.
probability values located at cortical vertices thatwere identified as sys-temdivisions (colored in yellow (Power et al., 2011) and orange (Yeo etal., 2011)), and the subset of edge probability values located at corticalvertices thatwere not identified as systemdivisions (colored in purple).Locations of system divisions exhibited higher edge probability valuesthan the locations not identified as system divisions6 (Power et al.(2011) division comparison: median edge probability at locations thatare system divisions: 0.168, median edge probability at locations thatare not system divisions: 0.144, W(57034) = 492580832, z = 19.5,p b b0.0001; Yeo et al. (2011) division comparison: median edge prob-ability at locations that are system divisions: 0.174, median edge prob-ability at locations that are not system divisions: 0.143, W(57034) =471727456, z = 28.0, p b b0.0001).
RSFC-defined systems contain multiple areal divisions
The locations of putative system divisions revealed by clusteringtechniques coincide with the locations of several strong putative areaboundaries as identified by RSFC-Boundary Mapping. One might try touse clustering techniques for parcellation by segregating a cluster intoportions that only contain adjacent voxels or vertices and label thesesub-clusters as areas. However, there is a strong reason to be cautiousin this regard. As a prominent example, it should be apparent that thiswould result in the entire visual system in Fig. 8a (blue community)being labeled as a single area. Consistent with this, it is apparent thatmany locations not identified as system divisions exhibit high edgeprobability (RSFC boundary) likelihood (see purple bars in histogramsdepicted in Fig. 7c). These observations support the notion that systemdivisions are not a comprehensive representation of area boundaries.
Further comparison of RSFC-derived clusters and communities toRSFC-derived borders confirms that, in some cases, multiple strongboundaries can be found within a single contiguous portion of a clusteror community. We have already pointed out the parcellation of PA17/PA18 using RSFC-Boundary Mapping; here we highlight a portion ofthe left lateral inferior frontal cortex as an additional example of a loca-tion where multiple boundaries are observed within a cluster. Two in-dependent techniques (community detection (yellow in Power et al.,2011) and clustering (orange in Yeo et al., 2011)) identified similarclusters of continuous voxels spanning the extent of the left inferior/middle frontal gyrus, a portion of the frontal-parietal control system(Fig. 7d). However, the RSFC-Boundary Mapping parcellation suggeststhe presence of 3 borders (corresponding to 4 putative areas, as definedby identifying the local-minima of the RSFC-Boundary Mapping map)within these clusters. While it is possible that the presence of RSFC-Boundary Mapping divisions simply reflect subtle and progressive dis-tinctionswithin a single area, this would be inconsistentwith the archi-tectonic divisions that have been noted along this part of the brain (e.g.,Brodmann’s areas 44–47 and possibly 10). Furthermore, examination ofthe seed-based RSFCmaps obtained from locationswithin each of thesedivisions suggests otherwise (the most posterior location (4) has anRSFC map most similar to the most anterior location (1), which arequite distinct from maps obtained from locations (2) and (3); Fig. 7e).
Why do clustering techniques behave differently than the RSFC-Boundary Mapping parcellation method highlighted here? Clusteringtechniques, for a given a priori or data-determined number of clusters,will identify groups of voxels that minimize RSFC similarity distancewithin clusters while simultaneously maximizing RSFC similarity dis-tance between clusters. This focus on maximizing global separationmay come at the cost of more local distinctions. In contrast, parcellationmethods that rely on local feature changes (such as RSFC-BoundaryMapping) will be more sensitive to transitions in cortical identity (e.g.,
6 Kolmogorov-Smirnov goodness-of-fit hypothesis tests revealed that the distributionsof the RSFC-Boundary Mapping edge probabilities were non-normal and log transforma-tion did not achieve normality. Accordingly, a Wilcoxon rank sum test was used to deter-mine the probability with which the two distributions had equivalent medians.
a b
d e
c
Fig. 7. RSFC-BoundaryMapping compared to RSFC-defined systems boundaries. (a) Large-scale cortical systems derived from RSFC community detection (Power et al., 2011) and cluster-ing (Yeo et al., 2011). Dottedboxes indicate approximate view in (d). (b) RSFC-based systemdivisions (community divisions fromPower et al., 2011; cluster divisions fromYeo et al., 2011)overlaid on a 120-subject RSFC-Boundarymap depict the correspondence between the two types ofmaps. (c) Histograms depicting the distribution of edge probabilities for locations thatwere identified as systemdivisions as defined by Power et al. (yellow) and Yeo et al. (orange) and locations thatwere not identified as systemdivisions (purple in both). Note that systemdivision edge probabilities are slightly right shifted relative to the edge probabilities of the remaining locations (i.e. tend to have higher edge probabilities), but there remain many loca-tionswith high edgeprobabilities that are not accounted for by systemdivisions. (d) close-upof left lateral frontal cortex showing frontal–parietal systemborders overlaid on RSFC-Bound-ary map. Four white balls indicate local minima in the RSFC-Boundary map. (e) The spatial correlation (Pearson's r) between the four correlation maps generated from the local minimapositions indicated in (d). Note that themost anterior (1) andmost posterior (4) seeds have very similar correlationmaps. The two intermediate seeds (2,3) show similar patterns as seeds1 and 4, but also differ markedly in certain regions, e.g. along the lateral frontal cortex (arrows) and in posterior cingulate cortex (dotted circle), providing evidence that there are numer-ous areas within a single system division.
285G.S. Wig et al. / NeuroImage 93 (2014) 276–291
from V1 to V2 in Fig. 6). It may be possible for a clustering technique toidentify a collection of voxels or vertices that corresponds to a singlearea if the method is invoked using both an appropriate level of granu-larity and with spatial constraints. However, complete partitioning at agiven spatial scale (e.g., systems or areas) would require a perfectly hi-erarchical RSFC structure. The appropriate level of the RSFC hierarchy todefine a given cortical area may be the same level that defines a systemof areas elsewhere. As such, just as is the case with RSFC-BoundaryMapping, appropriate comparisons are necessary to understand theclustering observations further and ensure biological plausibility.
Additional constraints and considerations
While we have attempted to point out potential caveats and sourcesthat require particular further attention, we highlight here additionalconsiderations in the application of RSFC for area parcellation. Specifi-cally, we focus on the relationship between RSFC-defined boundariesand BOLD signal strength and surface geometry, and also make somecomments on parcellation of subcortical structures using patterns ofRSFC.
Relationship of RSFC-defined borders to BOLD signal strength
It is important to note that observed transitions in the patterns ofRSFC may not be neurobiologically relevant. In particular, boundariesthat correspond to BOLD signal differences relating to variable BOLDsensitivity across the brain (e.g. due to magnetic field inhomogeneitiesarising from adjacent structures with differentmagnetic susceptibilitiesFrahm et al., 1988) are likely of little interest in the context of corticalparcellation. With this in mind, we compared the RSFC-Boundarymaps to the BOLD signal strength across the brain. Mean BOLD signalwas calculated by averaging the first frame of acquisition (post-steadystate magnetization) from all subjects (Ojemann et al., 1997). A smallpositive correlation (r = 0.12) was found between the change in themean BOLD signal along the cortical surface (measured by the gradient,or spatial derivative, of the mean BOLD signal) and the 120-subjectRSFC-Boundary map. BOLD signal strength changes may account for asmall amount of variability in the RSFC-Boundary map, but even thismay be largely confined to regions known to have significant signalloss. Fig. 8a depicts the pattern of BOLD signal dropout in our data.BOLD data was normalized to amode of 1000 during preprocessing. Ac-cordingly, ameanBOLD signal of 800 or less (depicted in orange shades)

b
a
Fig. 8. RSFC-Boundary Mapping compared to BOLD signal strength and surface geometry. (a) Mean BOLD signal from the first frame of resting state data from 120 subjects overlaid onRSFC-Boundary map. Regions with BOLD signal less than 800 (BOLD signal has been mode 1000 normalized) can be seen in orange-yellow. Signal loss is apparent in ventral temporal(red arrow ‘1’) and orbitofrontal (red arrow ‘2’) regions, superior temporal gyrus (red arrow ‘3’), and the occipital pole (red arrow ‘4’). (b) Lateral parietal–occipital (right) and lateralfrontal views of RSFC-Boundarymap compared to surface geometry. Left panels show full range RSFC-Boundarymap,middle panels showRSFC-Boundarymap thresholded at 0.15 bound-ary frequency, and right panels show average surface convexity of Conte-69 atlas (darker and brighter values on this surface represent sulcal and gyral regions respectively). Red arrowsindicate gyral crowns where there is an absence of a strong RSFC-defined border and blue arrows indicate regions in which RSFC boundaries cross over sulcal fundi.
286 G.S. Wig et al. / NeuroImage 93 (2014) 276–291
represents a substantial attenuation of signal. Boundaries in the ventralportion of the temporal lobe (red arrow 1) and in orbitofrontal cortex(red arrow 2) are clearly suspect given the large signal loss in these re-gions. Similarly, the boundaries along the superior temporal gyrus (redarrow3) and at the occipital pole (red arrow4)may be explained by thedecreased signal in these regions. Leaving out regions with substantialsignal loss (i.e. BOLD b800) significantly reduces the correlation be-tween the change in BOLD signal strength and the RSFC-Boundarymap (r = 0.07). We conclude that for much of the brain changes inBOLD signal strength do not account for the presence of RSFC-definedboundaries. Field map-based distortion correction, which was not car-ried out here as many subjects in our cohort had not been collectedwith field maps, may help ameliorate distortion-related effects, butwould not be able to repair boundaries related to frank signal loss. Con-sideration of artifacts such as these are critical to keep in mind wheninterpreting boundaries and highlight regions of the brain whereRSFC-based tools will struggle to generate meaningful parcellationwithout further processing or acquisition refinements.
Relationship of RSFC-defined borders to surface geometry
Areal borders need not respect morphometric divisions. For example,the primary visual area (V1) spans both sides of the calcarine sulcus,reflecting the upper and lower representations of the visual field in thisarea (e.g., Dougherty et al., 2003). However, a number of strong borders
defined by RSFC-Boundary Mapping follow prominent gyral and sulcallandmarks: strong RSFC borders are present along the central sulcus(from dorsal to ventral) and along the cingulate gyrus (from anterior toposterior). While some of these divisions may be consistent with arealdivisions (e.g., the primary motor and somatosensory areas follow thecentral sulcus along the pre- and post-central gyri, respectively), one con-cern is that the identification of RSFC-Boundary Mapping borders is bi-ased by surface geometry (for example, as a consequence of thevolume-to-surface processing and analysis stream; see methods inAppendix A — Methods). Indeed, the RSFC-Boundary map has a smallpositive correlation with the average convexity of the Conte69 atlas(r = 0.11). A number of observations mitigate this concern however.Fig. 8b highlights a few examples in the frontal and temporal/parietalcortex where strong RSFC boundaries are not found along gyralcrowns (red arrows), as well as examples of regions where strong RSFCboundaries cross over sulcal fundi (blue arrows). While it is conceivablethat RSFC borders follow morphometric landmarks in some locations asa consequence of the presence of an areal division, we do not view gyraland sulcal features as the causal source of group-level RSFC borders. Werecognize that the previous observations do not completely rule out thepossibility that inter-individual variability in surface geometry may bemasked when individuals are combined into a group, and that geometricbias may be present when RSFC borders are computed on individualsubjects. With respect to the latter point, observations in our laboratorysuggest otherwise (e.g., see Supplemental Fig. 3 in Wig et al., 2013).
287G.S. Wig et al. / NeuroImage 93 (2014) 276–291
RSFC-based parcellation of subcortical structures
While we have focused our present discussions on parcellation ofcortical areas, many of the general points we have made are applicableto subdividing subcortical structures, with some caveats. For example,the gradient-based approach described here is applied primarily forthe 2-dimensional parcellation of the cortical sheet; subcortical struc-tures, however, are not arrayed on a sheet, but rather are organized asnuclei having, sometimes complex, 3-dimensional forms. As such, dif-ferent approaches are necessary for their parcellation. The gradient-based strategy for finding RSFC pattern transitions can naturally be ex-tended into 3-dimensions for this purpose, though we do not presentsuch an approach here. The current form of the RSFC-Snowballing pro-cedure is not limited to the cortical surface and is capable of identifyingarea centers within subcortical structures, which in fact is highlightedelsewhere (Wig et al., 2013). In addition, clustering approaches haveclearly demonstrated the ability to partition subcortical structuresaccording to RSFC correlations (e.g., Barnes et al., 2010; Zhang et al.,2008). As with the cortex, much work remains to be done comparingapparent RSFC-based distinctions with other modalities to understandhowRSFC information in the subcortical nuclei and the cerebellum con-verges with and/or diverges from other properties of brain organizationand function.
Concluding comments
Patterns of RSFC exhibit abrupt transitions across the brain and re-cent advances in BOLD imaging acquisition and analysis have facilitatedthe development of tools to map the locations of these changes acrossthe cortical surface. Throughout this report, we have described someprominent observations where the locations of putative areal divisionsas defined by RSFC-Boundary Mapping converge with features fromother parcellation modalities as well as other RSFC analysis methods.
Where possible, we have attempted to highlight observations andissues that necessitate particular attention in order to more fully un-derstand and interpret the parcellation information gleaned fromRSFC-based approaches. Of course, as the nature and source of RSFCsignals is continually explored, we suspect our understanding ofRSFC-based area parcellation will also be modified. For example,deeper understanding of the non-stationary nature of RSFC signals(e.g., Chang and Glover, 2010; Smith et al., 2012) and of the sensitiv-ity of RSFC to various sources of spurious noise (e.g., Birn et al., 2006;Chang et al., 2009; Power et al., 2012; Satterthwaite et al., 2012;Van Dijk et al., 2012), as well as improved image acquisition and pro-cessing techniques (De Martino et al., 2011; Van Essen et al., 2012)will likely aid our ability to use RSFC for parcellating cortical and sub-cortical areas.
The parcellation of brain areas relies on distinctions related to func-tion, architectonics, connectivity and topography. While the earliestparcellation of human cortical areas relied on invasive approachessuch as post-mortem dissection (e.g., Brodmann, 1909; Vogt and Vogt,1919) or intra-cranial recording (e.g., Jasper and Penfield, 1954), recentadvances in brain imaging have enabled continual improvements andrefinement in our understanding of the properties and methods foridentifying areal divisions (Toga et al., 2006; the present special issueon In vivo Brodmann mapping in neuroimage). As has been the casewith parcellation of non-human cortical areas, it is likely that no singlefeature will serve to parcellate all cortical and subcortical structures.Accurate and informative parcellation has been accomplished by thecareful consideration of multiple converging features. In additionalto distinctions identified by examining patterns of evoked-activity,connectional anatomy, architectonics, and topography, we feel there issufficient and compelling evidence to suggest that patterns of RSFCprovide confirmatory and complementary information for the purposesof parcellating cortical areas and subcortical divisions of the brain.We urge interested readers to explore and utilize our RSFC-based
parcellation maps for themselves, we have made these maps availableon our laboratory website (http://www.nil.wustl.edu/labs/petersen/Publications.html).
Acknowledgments
We thank Alex Cohen, Steven Nelson, Jonathan Power, and BradSchlaggar for thoughtful discussions and feedback throughout much ofthis work. We also thank Malcolm Tobias, Avi Snyder, Matt Glasser,and Babatunde Adeyemo for technical support and assistance. Thiswork was supported by a McDonnell Foundation Collaborative ActionAward, NIH (32979, 46424, 61144) and theHumanConnectome Project(1U54MH091657) from the 16 NIH Institutes and Centers that supportthe NIH Blueprint for Neuroscience Research.
Appendix A. Methods
Subjects
RSFC from a total of 120 healthy young adult subjects was analyzedfor parcellation (60 females, mean age = 25 years, age range =19–32 years). All subjects were native speakers of English andwere right-handed. Subjects were recruited from the WashingtonUniversity community and were screened with a self-report question-naire to ensure that they had no current or previous history of neurolog-ical or psychiatric diagnosis. Informed consent was obtained from allsubjects. The study was approved by theWashington University Schoolof Medicine Human Studies Committee and Institutional Review Board.
Data acquisition parameters
Structural and RSFC (functional) MRI data were obtained with aSiemens Magnetom Trio Tim 3.0 T Scanner (Erlangen, Germany) and aSiemens 12 channel Head Matrix Coil. To help stabilize head position,each subject was fitted with a thermoplastic mask fastened to holderson the headcoil. A T1-weighted sagittal magnetization-prepared rapidacquisition gradient echo (MP-RAGE) structural image was obtained(TE = 3.08 ms, TR(partition) = 2.4 s, TI = 1000 ms, flip angle = 8°,176 slices with 1 × 1 × 1 mm voxels) (Mugler and Brookeman,1990). An auto align pulse sequence protocol provided in the Siemenssoftware was used to align the acquisition slices of the functionalscans parallel to the anterior commissure–posterior commissure (AC–PC) plane and centered on the brain. This plane is parallel to the slicesin the Talairach atlas (Talairach and Tournoux, 1988).
During RSFC data acquisition, subjectswere instructed to relaxwhilefixating on a black crosshair that was presented against a whitebackground. Functional imagingwas performed using a blood oxygena-tion level-dependent (BOLD) contrast sensitive gradient echo echo-planar sequence (TE = 27 ms, flip angle = 90°, in-plane resolution =4 × 4 mm). Whole brain EPI volumes (MR frames) of 32 contiguous,4 mm-thick axial slices were obtained every 2.5 s. A T2-weighted turbospin echo structural image (TE = 84 ms, TR = 6.8 s, 32 slices with1 × 1 × 4 mm voxels) in the same anatomical planes as the BOLD im-ages was also obtained to improve alignment to an atlas. The numberof volumes obtained from subjects ranged from 184 to 729 (mean =336 frames).
Image preprocessing
Functional images were first processed to reduce artifacts (Miezinet al., 2000). These steps included: (i) correction of odd vs. evenslice intensity differences attributable to interleaved acquisition with-out gaps, (ii) correction for head movement within and across runsand (iii) across-run intensity normalization to a whole brain modevalue of 1000. Atlas transformation of the functional data was comput-ed for each individual using the MP-RAGE scan. Each run was then re-

288 G.S. Wig et al. / NeuroImage 93 (2014) 276–291
sampled to an isotropic 3-mm atlas space (Talairach and Tournoux,1988), combining movement correction and atlas transformation in asingle cubic spline interpolation (Lancaster et al., 1995; Snyder, 1996).This single interpolation procedure avoids blurring thatwould be intro-duced by multiple interpolations. All subsequent operations wereperformed on the atlas-transformed volumetric time series.
RSFC preprocessing
Several additional preprocessing steps were utilized to reduce spuri-ous variance unlikely to reflect neuronal activity in RSFC data. RSFCpreprocessing was performed in two iterations. In the first iteration,RSFC preprocessing included, in the following order: (i) multiple regres-sion of the BOLD data to remove variance related to the whole brainsignal (cf. Scholvinck et al., 2010), ventricular signal, whitematter signal,six detrended head realignment parameters obtained by rigid bodyheadmotion correction, and the first-order derivative terms for all afore-mentioned nuisance variables. (ii) A band-pass filter (0.009 Hz b
f b 0.08 Hz), (iii) volumetric spatial smoothing (6 mm full width athalf maximum in each direction).7
Following the initial RSFC preprocessing iteration, to ameliorate theeffect of motion artifact on RSFC correlations, data was processed fol-lowing the recently described ‘scrubbing’ procedure (Power et al.,2012). Temporal masks were created to flag motion-contaminatedframes so that they could be ignored during subsequent nuisance re-gression and correlation calculations. Motion contaminated volumeswere identified by frame-by-frame displacement (FD, calculated as thesum of absolute values of the differentials of the 3 translational motionparameters and 3 rotational motion parameters) and by frame-by-frame signal change (DVARS). Volumes with FD N0.3 mm or DVARSN3% signal change were flagged. In addition, the two frames acquiredimmediately prior to each of these frames and the two frames acquiredimmediately after these frames were also flagged to account for tempo-ral spread of artifactual signal resulting from the temporal filtering inthe first RSFC preprocessing iteration.
The RSFC preprocessing steps outlined above (steps i–iii; includingnuisance regression, temporal filtering, and volumetric smoothing)were applied in the second iteration on RSFC data that excluded volumesflagged during motion scrubbing. The mean percent of frames excludedfrom the remaining subjects was 26% (range: 1%–26.0%). All subjectshad a minimum of 126 frames remaining after RSFC preprocessing(mean = 245 frames).
Surface preprocessing
Following volumetric registration, each subject's MP-RAGE imagewas processed to generate anatomical surfaces using FreeSurfer's defaultrecon-all processing pipeline (version 5.0). This pipeline included brainextraction, segmentation, generation of white matter and pial surfaces,inflation of the surfaces to a sphere, and surface shape-based sphericalregistration of the subject's ‘native’ surface to the fsaverage surface(Dale and Sereno, 1993; Dale et al., 1999; Fischl et al., 1999; Ségonneet al., 2004, 2005). The fsaverage-registered left and right hemispheresurfaces were brought into register with each other using deformationmaps from a landmark-based registration of the left and right fsaveragesurfaces to a hybrid left–right fsaverage surface (‘fs_LR’; Van Essen et al.,2012) and resampled to a resolution of 164,000 vertices (164k fs_LR)using Caret tools (Van Essen et al., 2001). Finally, each subject's 164kfs_LR surface was down-sampled to a 32,492 vertex surface (fs_LR32k), which allowed for analysis in a computationally tractable spacewhile still oversampling the underlying resolution of BOLD data used insubsequent analyses. The various deformations from the ‘native’ surfacesto the fs_LR 32k surface were composed into a single deformation map
7 Volumetric smoothing was only performed as an RSFC preprocessing step for RSFC-Snowballing.
allowing for one step resampling. The above procedure results in a sur-face space that allows for quantitative analysis across subjects as wellas between hemispheres. A script for this procedure is available on theVan Essen Lab website (Freesurfer_to_fs_LR Pipeline, http://brainvis.wustl.edu).
RSFC-Boundary Mapping
RSFC-BoundaryMapping identifies transitions in resting state corre-lations across the cortical surface. Cohen et al.'s (2008) original ap-proach applied 2-D image processing tools to BOLD data sampled frompatches on a flattened cortical surface (e.g., Nelson et al., 2010a). Flat-tening the surface induces distortions in the surface representationthat could lead to spurious boundary identification. The current imple-mentation of RSFC-Boundary Mapping avoids this issue by performingall computations directly on a closed surface topology. The analysis isnow also applied to the entire cortical surface as opposed to small se-lected patches of cortex. The details of this procedure have been de-scribed for individual subjects elsewhere (Wig et al., 2013). Here weapply the method to groups of individuals.
A flowchart of the RSFC-Boundary Mapping procedure can be seenin Fig. 9. The RSFC BOLD time courses8 were first sampled to eachsubject's individual ‘native’ midthickness surface (generated as theaverage of the white and pial surfaces) using the ribbon-constrainedsampling procedure available in Connectome Workbench 0.7. Thisprocedure samples data from voxels within the gray matter ribbon(i.e. between the white and pial surfaces) that lay in a cylinder orthog-onal to the local midthickness surface weighted by the extent to whichthe voxel falls within the ribbon — it is designed to minimize partial-volume effects arising from the low sampling resolution of the BOLDdata relative to the structural image acquisition (Glasser and VanEssen, 2011). Once sampled to the ‘native’ surface, the time courseswere smoothed along the surface using a Gaussian smoothing kernel(σ = 2.55). The smoothed time courses were deformed and resampledfrom the individual's ‘native’ surface to the 32k fs_LR surface in a singlestep using the deformation map generated as described above.
Each surface vertex's time course was correlated with the timecourses from every voxel in a brain mask to generate full volume corre-lationmaps (32,492 vertices × 65,549 voxels). Each correlationmapwastransformed using Fisher's r-to-z transformation (Zar, 1996) and aver-aged across subjects. Full volume correlation maps were used insteadof surface correlation maps in order to ensure that sub-cortical correla-tion relationships contributed to areal parcellation. An RSFCmap similar-ity matrix was created by calculating the spatial correlation betweenevery vertex's RSFC correlation maps with one another, producing a32k × 32k matrix. Each row of this matrix corresponds to a map on thecortical surfacewherein the values reflect the similarity of a given vertexRSFC map with the RSFC map of every other vertex. To find positionswhere RSFC similarity exhibited abrupt changes, the similarity mapswere first Gaussian smoothed along the surface (σ = 2.55) and thefirst spatial derivative was computed using the ‘metric-gradient-all’function available in Caret 5.65. This resulted in 32k ‘gradient’ maps foreach hemisphere. These gradient maps represent the essential featureof RSFC transition we aim to identify. As a further refinement relativeto whole-brain boundary maps presented in previous work (Wig et al.,2013), in order to sharpen observed borders and facilitate identificationof even subtle differences in correlation patterns, we applied a non-maxima suppression procedure to each of the gradient maps, creating32k ‘edge’maps. This technique identifies a vertex as an edge if it is a gra-dient maximawith respect to at least two pairs of spatially non-adjacentneighboring vertices (each of the 32k vertices has six neighbors, except12 which have five neighbors). The non-linear nature of this step
8 No spatial smoothing was performed in the volume during pre-processing for RSFC-Boundary Mapping so as to minimize any partial-volume effects and cross-sulcal datablurring.

Fig. 9. RSFC-BoundaryMapping procedure. (1) Resting state time courses are first sampled to each subject's nativemidthickness surface and smoothed along the surface. (2) The sampleddata is then deformed and resampled to the 32k fs_LR surface space (Van Essen et al., 2012). (3) Full volume RSFC maps are calculated for all surface vertices and averaged across all sub-jects. (4) The spatial correlation between all RSFC maps is calculated generating a 32,492 × 32,492 vertex matrix. (5) Each column of this matrix represents each surface vertex's RSFCsimilarity map. (6) The spatial gradient of each RSFC similarity map is computed. (7) Edges in the gradient map are highlighted by non-maxima suppression (where 1 indicates anedge and 0 indicates no edge). (8) Finally, the edge maps from all vertices are averaged together; this generates a final RSFC-Boundary map that indicates how frequently an edge wasdetected at each vertex (edge probability).
289G.S. Wig et al. / NeuroImage 93 (2014) 276–291
makes it susceptible to potentially uninteresting noise in the input data;averaging correlation maps frommany subjects minimizes this possibil-ity. Finally, the 32k ‘edge’maps from each hemisphere were averaged toindicate the frequency with which a given vertex was identified as anedge.
RSFC-Snowball sampling
RSFC-Snowball sampling (RSFC-Snowballing) identifies locationsthat exhibit a high density of resting-state correlations to other loca-tions in the brain. Peak density values are lesser at locations that aretransition points (or boundaries) between adjacent areas and greaterwithin an area's interior (or center). Therefore, the voxel-wise distribu-tion of peaks can be used to identify the locations of area centers. Aseparate report describes RSFC-Snowballing for parcellating corticaland sub-cortical structures in an individual subject (Wig et al., 2013).As with RSFC-Boundary Mapping, we describe here the method for ap-plication to groups of individuals.
RSFC-Snowballing is an iterative procedure that uses seed-basedRSFC to identify locations correlated with a starting seed location (i.e.,the ‘neighbors’ of the seed, in a graph theoretic sense), and then iden-tifies the neighbors of the neighbors, and so forth over multiple
iterations (zones). RSFC-Snowballing is initialized from multiplestarting seed locations (i.e., from a pre-defined set of coordinates) creat-ing a peakdensitymap for each starting location. The peakdensitymapsderived from each starting location are summed and normalized rela-tive to themaximumvalue of the summedmap to arrive at an aggregatepeak density map (Fig. 10). In the present analysis, the starting locationsetwas defined from ameta-analysis of task-evoked data, which identi-fied 151 task-defined centers across cortical and sub-cortical structures(for details see Wig et al., 2013). Aggregating the peak density mapsfrommultiple starting locations minimizes the potential bias of a singlestarting seed location and provides estimates of area centers acrossbroad expanses of the brain's cortical and subcortical structures.
A neighbor of a given seed need not be physically adjacent to theseed, but rather is defined by the presence of an RSFC relationshipabove a given correlation threshold. Neighbor identification wasconducted by calculating seed-based statistical correlation maps acrossthe group of individuals. For each participant, the average time coursewas extracted from the seed region of interest (ROI) and Pearson's cor-relation coefficient was computed between this ROI's time course andthe time course for each voxel across the whole brain volume. Theresulting correlation map was converted to z values using Fisher'sr-to-z transformation (Zar, 1996). The individual z(r) images were

a b c
Fig. 10.Overviewof RSFC-Snowballingusingmultiple starting seed locations. (a) Initialization location set consisting of cortical and sub-cortical seed locations (n = 151) defined bymeta-analysis of task-evoked data. (b) For each seed location in the initialization location set, RSFC-Snowballing iteratively identifies the neighbors (peaks of RSFC correlation) of seed ROIs overmultiple zones and adds these neighbors to a peak density map. (c) The independently derived peak density maps from each of the seed locations of the initialization location set aresummed to arrive at an aggregate peak density map presumed to reflect the likelihood with which a given location is an area center.
290 G.S. Wig et al. / NeuroImage 93 (2014) 276–291
next submitted to a random-effects analysis, treating participant asthe random factor, to create a statistical map using a t-test. To iden-tify the seed ROI's ‘neighbors’ (i.e. the regions that were correlatedwith the seed ROI), the statistical t-maps were first smoothed(6 mm FWHM) and the local maxima (peaks) of contiguous clustersof voxels that both surpassed a correlation threshold (p b 0.001,uncorrected) and had a minimum distance of 10 mm betweenpeaks were identified.
Each starting location was submitted to RSFC-Snowballing over 3zones. The final aggregate peak density map was spatially smoothed(volumetric smoothing of 6 mm FWHM) and then normalized relativeto its maximal value to facilitate viewing.
Conflict of interest
The authors declare no conflict of interest.
References
Amunts, K., Malikovic, A., Mohlberg, H., Schormann, T., Zilles, K., 2000. Brodmann's areas17 and 18 brought into stereotaxic space—where and how variable? NeuroImage 11,66–84.
Amunts, K., Weiss, P.H., Mohlberg, H., Pieperhoff, P., Eickhoff, S., Gurd, J.M., Marshall, J.C.,Shah, N.J., Fink, G.R., Zilles, K., 2004. Analysis of neural mechanisms underlying verbalfluency in cytoarchitectonically defined stereotaxic space—the roles of Brodmannareas 44 and 45. NeuroImage 22, 42–56.
Barnes, K.A., Cohen, A.L., Power, J.D., Nelson, S.M., Dosenbach, Y.B., Miezin, F.M., Petersen,S.E., Schlaggar, B.L., 2010. Identifying basal ganglia divisions in individuals usingresting-state functional connectivity MRI. Front. Syst. Neurosci. 4, 18.
Barnes, K.A., Nelson, S.M., Cohen, A.L., Power, J.D., Coalson, R.S., Miezin, F.M., Vogel, A.C.,Dubis, J.W., Church, J.A., Petersen, S.E., Schlaggar, B.L., 2012. Parcellation in left lateralparietal cortex is similar in adults and children. Cereb. Cortex 22 (5), 1148–1158(May).
Birn, R.M., Diamond, J.B., Smith, M.A., Bandettini, P.A., 2006. Separating respiratory-variation-related fluctuations from neuronal-activity-related fluctuations in fMRI.NeuroImage 31, 1536–1548.
Biswal, B., Yetkin, F.Z., Haughton, V.M., Hyde, J.S., 1995. Functional connectivity in themotor cortex of resting human brain using echo-planar MRI. Magn. Reson. Med. 34,537–541.
Biswal, B.B., Mennes, M., Zuo, X.N., Gohel, S., Kelly, C., Smith, S.M., Beckmann, C.F.,Adelstein, J.S., Buckner, R.L., Colcombe, S., Dogonowski, A.M., Ernst, M., Fair, D.,Hampson, M., Hoptman, M.J., Hyde, J.S., Kiviniemi, V.J., Kotter, R., Li, S.J., Lin, C.P.,Lowe, M.J., Mackay, C., Madden, D.J., Madsen, K.H., Margulies, D.S., Mayberg, H.S.,McMahon, K., Monk, C.S., Mostofsky, S.H., Nagel, B.J., Pekar, J.J., Peltier, S.J., Petersen,S.E., Riedl, V., Rombouts, S.A., Rypma, B., Schlaggar, B.L., Schmidt, S., Seidler, R.D., G,J.S., Sorg, C., Teng, G.J., Veijola, J., Villringer, A., Walter, M., Wang, L., Weng, X.C.,Whitfield-Gabrieli, S., Williamson, P., Windischberger, C., Zang, Y.F., Zhang, H.Y.,Castellanos, F.X., Milham, M.P., 2010. Toward discovery science of human brain func-tion. Proc. Natl. Acad. Sci. U. S. A. 107, 4734–4739.
Brodmann, K., 1909. Vergleichende lokalisationslehre der grosshirnrinde in ihrenprinzipien dargestellt auf grund des zellenbaues. J.A. Barth, Leipzig.
Carmichael, S.T., Price, J.L., 1994. Architectonic subdivision of the orbital and medial pre-frontal cortex in the macaque monkey. J. Comp. Neurol. 346, 366–402.
Carmichael, S.T., Price, J.L., 1996. Connectional networks within the orbital and medialprefrontal cortex of macaque monkeys. J. Comp. Neurol. 371, 179–207.
Caspers, S., Geyer, S., Schleicher, A., Mohlberg, H., Amunts, K., Zilles, K., 2006. The humaninferior parietal cortex: cytoarchitectonic parcellation and interindividual variability.NeuroImage 33, 430–448.
Chang, C., Glover, G.H., 2010. Time–frequency dynamics of resting-state brain connectiv-ity measured with fMRI. NeuroImage 50, 81–98.
Chang, C., Cunningham, J.P., Glover, G.H., 2009. Influence of heart rate on the BOLD signal:the cardiac response function. NeuroImage 44, 857–869.
Cohen, A.L., Fair, D.A., Dosenbach, N.U., Miezin, F.M., Dierker, D., Van Essen, D.C., Schlaggar,B.L., Petersen, S.E., 2008. Defining functional areas in individual human brains usingresting functional connectivity MRI. NeuroImage 41, 45–57.
Dale, A.M., Sereno, M.I., 1993. Improved localization of cortical activity by combining EEGand MEG with cortical surface reconstruction: a linear approach. J. Cogn. Neurosci. 5,162–176.
Dale, A.M., Fischl, B., Sereno, M.I., 1999. Cortical surface-based analysis. I. Segmentationand surface reconstruction. NeuroImage 9, 179–194.
De Martino, F., Esposito, F., van de Moortele, P.F., Harel, N., Formisano, E., Goebel, R.,Ugurbil, K., Yacoub, E., 2011. Whole brain high-resolution functional imaging atultra high magnetic fields: an application to the analysis of resting state networks.NeuroImage 57, 1031–1044.
Deco, G., Jirsa, V.K., McIntosh, A.R., 2011. Emerging concepts for the dynamical organiza-tion of resting-state activity in the brain. Nat. Rev. Neurosci. 12, 43–56.
Deen, B., Pitskel, N.B., Pelphrey, K.A., 2011. Three systems of insular functional connectiv-ity identified with cluster analysis. Cereb. Cortex 21, 1498–1506.
Dick, F., Tierney, A.T., Lutti, A., Josephs, O., Sereno,M.I.,Weiskopf, N., 2012. In vivo function-al and myeloarchitectonic mapping of human primary auditory areas. J. Neurosci. 32,16095–16105.
Doucet, G., Naveau, M., Petit, L., Delcroix, N., Zago, L., Crivello, F., Jobard, G., Tzourio-Mazoyer, N., Mazoyer, B., Mellet, E., Joliot, M., 2011. Brain activity at rest: a multiscalehierarchical functional organization. J. Neurophysiol. 105, 2753–2763.
Dougherty, R.F., Koch, V.M., Brewer, A.A., Fischer, B., Modersitzki, J., Wandell, B.A., 2003.Visual field representations and locations of visual areas V1/2/3 in human visual cor-tex. J. Vis. 3, 586–598.
Fedorenko, E., Hsieh, P.J., Nieto-Castanon, A., Whitfield-Gabrieli, S., Kanwisher, N., 2010.New method for fMRI investigations of language: defining ROIs functionally in indi-vidual subjects. J. Neurophysiol. 104, 1177–1194.
Felleman, D.J., Van Essen, D.C., 1991. Distributed hierarchical processing in the primate ce-rebral cortex. Cereb. Cortex 1, 1–47.
Fischl, B., Sereno, M.I., Dale, A.M., 1999. Cortical surface-based analysis. II: Inflation, flat-tening, and a surface-based coordinate system. NeuroImage 9, 195–207.
Fischl, B., Rajendran, N., Busa, E., Augustinack, J., Hinds, O., Yeo, B.T., Mohlberg, H., Amunts,K., Zilles, K., 2008. Cortical folding patterns and predicting cytoarchitecture. Cereb.Cortex 18, 1973–1980.
Foerster, O., 1936. Themotor cortex ofman in light of Hughlings Jackson's doctrines. Brain58, 135–159.
Fox, M.D., Raichle, M.E., 2007. Spontaneous fluctuations in brain activity observed withfunctional magnetic resonance imaging. Nat. Rev. Neurosci. 8, 700–711.
Frahm, J., Merboldt, K.D., Hanicke, W., 1988. Direct FLASH MR imaging of magnetic fieldinhomogeneities by gradient compensation. Magn. Reson. Med. 6, 474–480.
Gennari, F., 1782. Francisci Gennari Parmensis Medicinae Doctoris Collegiati de PeculiariStructura Cerebri Nonnullisque Eius Morbis-Paucae Aliae Anatom. Observat.Accedunt. Regio Typographeo, Parma, Italy.
Glasser, M.F., Van Essen, D.C., 2011. Mapping human cortical areas in vivo based onmyelin content as revealed by T1- and T2-weightedMRI. J. Neurosci. 31, 11597–11616.

291G.S. Wig et al. / NeuroImage 93 (2014) 276–291
Goodman, L., 1961. Snowball sampling. Ann. Math. Stat. 32, 148–170.Goulas, A., Uylings, H.B., Stiers, P., 2012. Unravelling the intrinsic functional organization
of the human lateral frontal cortex: a parcellation scheme based on resting state fMRI.J. Neurosci. 32, 10238–10252.
Hinds, O., Polimeni, J.R., Rajendran, N., Balasubramanian, M., Amunts, K., Zilles, K.,Schwartz, E.L., Fischl, B., Triantafyllou, C., 2009. Locating the functional andanatomical boundaries of human primary visual cortex. NeuroImage 46, 915–922.
Hirose, S., Watanabe, T., Jimura, K., Katsura, M., Kunimatsu, A., Abe, O., Ohtomo, K.,Miyashita, Y., Konishi, S., 2012. Local signal time-series during rest used for arealboundary mapping in individual human brains. PLoS One 7, e36496.
Honey, C.J., Sporns, O., Cammoun, L., Gigandet, X., Thiran, J.P., Meuli, R., Hagmann, P.,2009. Predicting human resting-state functional connectivity from structural connec-tivity. Proc. Natl. Acad. Sci. U. S. A. 106, 2035–2040.
Hubel, D.H., Wiesel, T.N., 1962. Receptive fields, binocular interaction and functionalarchitecture in the cat's visual cortex. J. Physiol. 160, 106–154.
Jasper, H., Penfield, W., 1954. Epilepsy and the Functional Anatomy of the Human Brain,2nd ed.
Johansen-Berg, H., Behrens, T.E., Sillery, E., Ciccarelli, O., Thompson, A.J., Smith, S.M.,Matthews, P.M., 2005. Functional–anatomical validation and individual variation ofdiffusion tractography-based segmentation of the human thalamus. Cereb. Cortex15, 31–39.
Kaas, J.H., Nelson, R.J., Sur, M., Lin, C.S., Merzenich, M.M., 1979. Multiple representations ofthe body within the primary somatosensory cortex of primates. Science 204, 521–523.
Kahnt, T., Chang, L.J., Park, S.Q., Heinzle, J., Haynes, J.D., 2012. Connectivity-basedparcellation of the human orbitofrontal cortex. J. Neurosci. 32, 6240–6250.
Kelly, C., Uddin, L.Q., Shehzad, Z., Margulies, D.S., Castellanos, F.X., Milham, M.P., Petrides,M., 2010. Broca's region: linking human brain functional connectivity data and non-human primate tracing anatomy studies. Eur. J. Neurosci. 32, 383–398.
Kim, J.H., Lee, J.M., Jo, H.J., Kim, S.H., Lee, J.H., Kim, S.T., Seo, S.W., Cox, R.W., Na, D.L., Kim,S.I., Saad, Z.S., 2010. Defining functional SMA and pre-SMA subregions in humanMFCusing resting state fMRI: functional connectivity-based parcellation method.NeuroImage 49, 2375–2386.
Kim, D.J., Park, B., Park, H.J., 2013. Functional connectivity-based identification of subdivi-sions of the basal ganglia and thalamus using multilevel independent componentanalysis of resting state fMRI. Hum. Brain Mapp. 34 (6), 1371–1385 (Jun).
Lancaster, J.L., Glass, T.G., Lankipalli, B.R., Downs, H., Mayberg, H., Fox, P.T., 1995. Amodality-independent approach to spatial normalization of tomographic images ofthe human brain. Hum. Brain Mapp. 3, 209–223.
Leech, R., Braga, R., Sharp, D.J., 2012. Echoes of the brain within the posterior cingulatecortex. J. Neurosci. 32, 215–222.
Margulies, D.S., Vincent, J.L., Kelly, C., Lohmann, G., Uddin, L.Q., Biswal, B.B., Villringer, A.,Castellanos, F.X., Milham, M.P., Petrides, M., 2009. Precuneus shares intrinsic functionalarchitecture in humans and monkeys. Proc. Natl. Acad. Sci. U. S. A. 106, 20069–20074.
Mars, R.B., Sallet, J., Schuffelgen, U., Jbabdi, S., Toni, I., Rushworth, M.F., 2012. Connectivity-based subdivisions of the human right “temporoparietal junction area”: evidence for dif-ferent areas participating in different cortical networks. Cereb. Cortex 22, 1894–1903.
Marshall, W.H., Woolsey, C.N., Bard, P., 1937. Cortical representation of tactile sensibilityas indicated by cortical potentials. Science 85, 388–390.
Miezin, F.M.,Maccotta, L., Ollinger, J.M., Petersen, S.E., Buckner, R.L., 2000. Characterizing thehemodynamic response: effects of presentation rate, sampling procedure, and the pos-sibility of ordering brain activity based on relative timing. NeuroImage 11, 735–759.
Mugler III, J.P., Brookeman, J.R., 1990. Three-dimensional magnetization-prepared rapidgradient-echo imaging (3D MP RAGE). Magn. Reson. Med. 15, 152–157.
Mumford, J.A., Horvath, S., Oldham, M.C., Langfelder, P., Geschwind, D.H., Poldrack, R.A.,2010. Detecting network modules in fMRI time series: a weighted network analysisapproach. NeuroImage 52, 1465–1476.
Nelson, S.M., Cohen, A.L., Power, J.D., Wig, G.S., Miezin, F.M., Wheeler, M.E., Velanova, K.,Donaldson, D.I., Phillips, J.S., Schlaggar, B.L., Petesen, S.E., 2010a. A parcellationscheme for human left lateral parietal cortex. Neuron 67, 156–170.
Nelson, S.M., Dosenbach, N.U., Cohen, A.L., Wheeler, M.E., Schlaggar, B.L., Petersen, S.E.,2010b. Role of the anterior insula in task-level control and focal attention. BrainStruct. Funct. 214, 669–680.
Ojemann, J.G., Akbudak, E., Snyder, A.Z., McKinstry, R.C., Raichle, M.E., Conturo, T.E., 1997.Anatomic localization and quantitative analysis of gradient refocused echo-planarfMRI susceptibility artifacts. NeuroImage 6, 156–167.
Ongur, D., Ferry, A.T., Price, J.L., 2003. Architectonic subdivision of the human orbital andmedial prefrontal cortex. J. Comp. Neurol. 460, 425–449.
Petersen, S.E., Fox, P.T., Posner, M.I., Mintun, M., Raichle, M.E., 1988. Positron emission tomo-graphic studies of the cortical anatomy of single-word processing. Nature 331, 585–589.
Power, J.D., Cohen, A.L., Nelson, S.M., Wig, G.S., Barnes, K.A., Church, J.A., Vogel, A.C.,Laumann, T.O., Miezin, F.M., Schlaggar, B.L., Petersen, S.E., 2011. Functional networkorganization of the human brain. Neuron 72, 665–678.
Power, J.D., Barnes, K.A., Snyder, A.Z., Schlaggar, B.L., Petersen, S.E., 2012. Spurious butsystematic correlations in functional connectivity MRI networks arise from subjectmotion. NeuroImage 59, 2142–2154.
Ryali, S., Chen, T., Supekar, K., Menon, V., 2013. A parcellation scheme based on vonMises–Fisher distributions and Markov random fields for segmenting brain regionsusing resting-state fMRI. NeuroImage 65, 83–96.
Sabuncu, M.R., Singer, B.D., Conroy, B., Bryan, R.E., Ramadge, P.J., Haxby, J.V., 2010.Function-based intersubject alignment of human cortical anatomy. Cereb. Cortex20, 130–140.
Satterthwaite, T.D., Wolf, D.H., Loughead, J., Ruparel, K., Elliott, M.A., Hakonarson, H., Gur,R.C., Gur, R.E., 2012. Impact of in-scanner head motion on multiple measures of func-tional connectivity: relevance for studies of neurodevelopment in youth. NeuroImage60, 623–632.
Schleicher, A., Zilles, K., 1990. A quantitative approach to cytoarchitectonics: analysis ofstructural inhomogeneities in nervous tissue using an image analyser. J. Microsc.157, 367–381.
Scholvinck, M.L., Maier, A., Ye, F.Q., Duyn, J.H., Leopold, D.A., 2010. Neural basis of globalresting-state fMRI activity. Proc. Natl. Acad. Sci. U. S. A. 107, 10238–10243.
Schormann, T., Zilles, K., 1998. Three-dimensional linear and nonlinear transformations:an integration of light microscopical and MRI data. Hum. Brain Mapp. 6, 339–347.
Ségonne, F., Dale, A.M., Busa, E., Glessner, M., Salat, D., Hahn, H.K., Fischl, B., 2004. Ahybrid approach to the skull stripping problem in MRI. NeuroImage 22,1060–1075.
Ségonne, F., Grimson, E., Fischl, B., 2005. A genetic algorithm for the topology correction ofcortical surfaces. Inf. Process. Med. Imaging 19, 393–405.
Sejnowski, T.J., Churchland, P.S., 1989. Brain and cognition. In: Posner, M. (Ed.), Founda-tions of Cognitive Science. MIT Press, Cambridge, p. 888.
Sereno, M.I., Dale, A.M., Reppas, J.B., Kwong, K.K., Belliveau, J.W., Brady, T.J., Rosen, B.R.,Tootell, R.B., 1995. Borders of multiple visual areas in humans revealed by functionalmagnetic resonance imaging. Science 268, 889–893.
Smith, S.M., Fox, P.T., Miller, K.L., Glahn, D.C., Fox, P.M., Mackay, C.E., Filippini, N.,Watkins, K.E., Toro, R., Laird, A.R., Beckmann, C.F., 2009. Correspondence of thebrain's functional architecture during activation and rest. Proc. Natl. Acad. Sci.U. S. A. 106, 13040–13045.
Smith, S.M., Miller, K.L., Moeller, S., Xu, J., Auerbach, E.J., Woolrich, M.W., Beckmann, C.F.,Jenkinson, M., Andersson, J., Glasser, M.F., Van Essen, D.C., Feinberg, D.A., Yacoub, E.S.,Ugurbil, K., 2012. Temporally-independent functional modes of spontaneous brainactivity. Proc. Natl. Acad. Sci. U. S. A. 109, 3131–3136.
Snyder, A.Z., 1996. Difference image vs. ratio image error function forms in PET–PET re-alignment. In: Myer, R., Cunningham, V.J., Bailey, D.L., Jones, T. (Eds.), Quantificationof Brain Function using PET. Academic Press, San Diego, CA, pp. 131–137.
Talairach, J., Tournoux, P., 1988. Co-planar Stereotaxic Atlas of the Human Brain. ThiemeMedical Publishers, Inc., New York.
Toga, A.W., Thompson, P.M., Mori, S., Amunts, K., Zilles, K., 2006. Towards multimodalatlases of the human brain. Nat. Rev. Neurosci. 7, 952–966.
Uddin, L.Q., Supekar, K., Amin, H., Rykhlevskaia, E., Nguyen, D.A., Greicius, M.D., Menon, V.,2010. Dissociable connectivity within human angular gyrus and intraparietalsulcus: evidence from functional and structural connectivity. Cereb. Cortex 20,2636–2646.
Van Dijk, K.R., Sabuncu, M.R., Buckner, R.L., 2012. The influence of head motion on intrin-sic functional connectivity MRI. NeuroImage 59, 431–438.
Van Essen, D.C., 2005. A Population-Average, Landmark- and Surface-based (PALS) atlasof human cerebral cortex. NeuroImage 28, 635–662.
Van Essen, D.C., Maunsell, J.H., Bixby, J.L., 1981. The middle temporal visual area in themacaque: myeloarchitecture, connections, functional properties and topographicorganization. J. Comp. Neurol. 199, 293–326.
Van Essen, D.C., Drury, H.A., Dickson, J., Harwell, J., Hanlon, D., Anderson, C.H., 2001.An integrated software suite for surface-based analyses of cerebral cortex. J. Am.Med. Inform. Assoc. 8, 443–459.
Van Essen, D.C., Glasser, M.F., Dierker, D.L., Harwell, J., Coalson, T., 2012. Parcellations andhemispheric asymmetries of human cerebral cortex analyzed on surface-basedatlases. Cereb. Cortex 22 (10), 2241–2262 (Oct).
Van Essen, D.C., Ugurbil, K., Auerbach, E., Barch, D., Behrens, T.E., Bucholz, R., Chang, A.,Chen, L., Corbetta, M., Curtiss, S.W., Della Penna, S., Feinberg, D., Glasser, M.F., Harel,N., Heath, A.C., Larson-Prior, L., Marcus, D., Michalareas, G., Moeller, S., Oostenveld,R., Petersen, S.E., Prior, F., Schlaggar, B.L., Smith, S.M., Snyder, A.Z., Xu, J., Yacoub, E.,2012. The Human Connectome Project: a data acquisition perspective. NeuroImage62, 2222–2231.
Vincent, J.L., Patel, G.H., Fox, M.D., Snyder, A.Z., Baker, J.T., Van Essen, D.C., Zempel, J.M.,Snyder, L.H., Corbetta, M., Raichle, M.E., 2007. Intrinsic functional architecture in theanesthetized monkey brain. Nature 447, 46–47.
Vogt, O., Vogt, C., 1919. Allgemeine Ergebnisse unserer Hirnforschung. J. Psychol. Neurol.25, 273–462.
Wasserman, S., Faust, K., 1994. Social Network Analysis: Methods and Applications.Cambridge University Press, Cambridge.
Wig, G.S., Schlaggar, B.L., Petersen, S.E., 2011. Concepts and principles in the analysis ofbrain networks. Ann. N. Y. Acad. Sci. 1224, 126–146.
Wig, G.S., Laumann, T.O., Cohen, A.L., Power, J.D., Nelson, S.M., Glasser, M.F., Miezin, F.M.,Snyder, A.Z., Schlaggar, B.L., Petersen, S.E., 2013. Parcellating an individual subject's cor-tical and subcortical brain structures using snowball sampling of resting-state correla-tions. Cereb. Cortex. http://dx.doi.org/10.1093/cercor/bht056 (first published onlineMarch 8, 2013).
Yeo, B.T., Krienen, F.M., Sepulcre, J., Sabuncu, M.R., Lashkari, D., Hollinshead, M., Roffman,J.L., Smoller, J.W., Zollei, L., Polimeni, J.R., Fischl, B., Liu, H., Buckner, R.L., 2011. Theorganization of the human cerebral cortex estimated by intrinsic functional connec-tivity. J. Neurophysiol. 106, 1125–1165.
Zar, J., 1996. Biostatistical Analysis. Prentice Hall, Upper Saddle River, NJ.Zhang, D., Snyder, A.Z., Fox, M.D., Sansbury, M.W., Shimony, J.S., Raichle, M.E., 2008.
Intrinsic functional relations between human cerebral cortex and thalamus.J. Neurophysiol. 100, 1740–1748.