Embed Size (px)
Citation preview

AN APPRAISAL OF AN INDUSTRIAL WAREHOUSE BUILDING
60-70 SEAVIEW DRIVE SECAUCUS TOWNSHIP
HUDSON COUNTY, NEW JERSEY 07094
PREPARED FOR:
THE JOHNS HOPKINS UNIVERSITY CAREY BUSINESS SCHOOL
EDWARD ST. JOHN DEPARTMENT OF REAL ESTATE 10 NORTH CHARLES STREET
BALTIMORE, MARYLAND 21201
PREPARED BY:
DANIEL ELIOT REMS
137 WEST 82nd STREET, APARTMENT 5B NEW YORK, NEW YORK 10024
EFFECTIVE DATE OF REPORT – DECEMBER 10, 2009
EFFECTIVE DATE OF VALUE – FEBRUARY 28, 2007

December 10, 2009 The Johns Hopkins University Carey Business School Edward St. John Department of Real Estate 10 North Charles Street Baltimore, Maryland 21201 RE: Demonstration Appraisal of a Single-Story Industrial Warehouse Building
60-70 Seaview Drive, Secaucus Township, Hudson County, New Jersey 07094 Ladies and Gentlemen: Per your request, I have made the necessary inspection and analysis to appraise the above referenced property. The attached report provides essential data and detailed reasoning employed in reaching my opinion of value. The purpose of the following report was to estimate the fee simple interest in the property, in its “as is” condition, as of February 28, 2007, a retrospective value opinion. The intended use of the report is to satisfy the practicum requirement of The Edward St. John Department of Real Estate. The intended users of the report include The Edward St. John Department of Real Estate and its faculty, staff, and administrators. The property being appraised consists of a 146,342-square-foot single-story, single-tenant industrial warehouse facility located on 6.712-acres of land. The property was originally constructed in 1978. The building, vacant as of the date of value, was previously leased to Nippon Express U.S.A., Inc. with a lease that extended from 1992 through October 31, 2006. The property is located in Secaucus Township, Hudson County, New Jersey, within the zoning jurisdiction of the Hackensack Meadowlands Development Commission. It is well situated within a mature industrial submarket and affords good access to the regional highway system. The value reported is qualified by certain definitions, limiting conditions, extraordinary assumptions and certifications that set forth in the attached report. The scope of my appraisal included a site inspection, most recently on October 8th, 2009. At the time of inspection, the property was 100% leased to AFL Quality NY, LLC with a lease that extending through December 31, 2017. Over the course of the inspection, the entire floor area was inspected, including warehouse and office areas. The mechanical areas and roof were also inspected by the appraiser.

Edward St. John Department of Real Estate December 10, 2009 Page Two In its current condition, upon occupancy in 2008, the current tenant performed extensive renovations to the property including new paint, new vinyl tile, carpeted floorings, and a new ceiling grid in the office area. Furthermore, the tenant dramatically increased the floor load in one bay of the warehouse in order to support a very heavy printing press. The front façade was recently upgraded with new stucco and paint. Lastly, the tenant recently installed a new 2,500 KVA transformer and a 3,200 Amp, 480/277 volt, three-phase, four-wire electrical service, including installation of a 4” copper pipe along the roofline for the delivery of compressed air throughout the warehouse. As previously mentioned, my appraisal is as of a retrospective date of value of February 28, 2007, when the subject was vacant and the recent renovations had yet to be undertaken. Although the appraiser did not inspected the property on the retrospective date of value, in its pre-renovated condition, the appraiser relied on detailed property descriptions, leases, operating statements, and property photographs from building ownership and other parties familiar with the property on the retrospective date of value. The analysis contained in the report that follows is considered to be a complete appraisal and is presented in a self-contained format. Based on this analysis, my opinion of the retrospective market value of the subject property, as set forth, documented, and qualified in the attached report under conditions prevailing on February 28, 2007, was:
TEN MILLION SIX HUNDRED THOUSAND DOLLARS ($10,600,000)
The value reported is qualified by the definitions, limiting conditions, and certifications set forth in the attached report. Respectfully submitted, Daniel Eliot Rems Associate Appraiser

TABLE OF CONTENTS Subject Property Photographs ..........................................................................................1 Summary of Important Facts and Conclusions ..............................................................5 Scope of the Appraisal .......................................................................................................7 Purpose of the Appraisal ....................................................................................................8 Intended Use and User of the Appraisal...........................................................................8 Property Rights Appraised ................................................................................................8 Date of Value Opinion.........................................................................................................8 Definition of Market Value ................................................................................................8 Exposure and Marketing Time..........................................................................................9 Identification of the Property.............................................................................................9 History of the Property.....................................................................................................10 Site Description and Analysis ..........................................................................................11 Improvement Description and Analysis.........................................................................13 Zoning and Land Use Plans .............................................................................................16 Real Estate Tax and Assessment Analysis .....................................................................17 Regional Map.....................................................................................................................18 Fundamental Market Analysis ........................................................................................19 Highest and Best Use.........................................................................................................56 Cost Approach ...................................................................................................................59 Income Capitalization Approach ....................................................................................80 Sales Comparison Approach............................................................................................98 Reconciliation and Final Value Estimate .....................................................................109

1
SUBJECT PROPERTY PHOTOGRAPHS
FRONT ELEVATION (Photo 1/18/07)
REAR ELEVATION (Photo 1/18/07)

2
SUBJECT PROPERTY PHOTOGRAPHS
WEST SIDE ELEVATION (Photo 1/18/07)
EAST SIDE ELEVATION (Photo 1/18/07)

3
SUBJECT PROPERTY PHOTOGRAPHS
TYPICAL INTERIOR VIEW OF WAREHOUSE (Photo 1/18/07)
TYPICAL INTERIOR VIEW OF OFFICE (Photo 1/18/07)

4
SUBJECT PROPERTY PHOTOGRAPHS
STREET SCENE VIEW NORTHWEST ALONG SEAVIEW DRIVE (Photo 1/18/07)
STREET SCENE VIEW SOUTHEAST ALONG SEAVIEW DRIVE (Photo 1/18/07)

5
SUMMARY OF IMPORTANT FACTS AND CONCLUSIONS
Property type: 146,342 square foot industrial warehouse facility Location: 60-70 Seaview Drive Secaucus, Hudson County, New Jersey 07094 Date of value opinion: February 28, 2007 Property rights appraised: Fee Simple Estate Site: A 6.712-acre site that is fully improved and conforms to all
applicable ordinances. Improvements: The subject property is a fully sprinklered, single-story
warehouse industrial building originally constructed in 1978.The rentable area is 146,342 square feet. The building is composed of a steel frame with concrete block curtain walls over poured concrete slab. The building contains 14,500+ square feet (9.9+%) office space, which is in need of renovation. There are 15 dock height loading doors including three interior docks. Additionally, the site is improved with an asphalt parking area suitable for approximately 150 automobiles and 15-20 tractor-trailers. The parking areas have landscaped islands and concrete curbs and walkways.
Intended use/user: To fulfill demonstration appraisal report requirement
for Johns Hopkins University. Client is Johns Hopkins University.
Zoning: The subject property is zoned Light Industrial and
Distribution A, as designated by the Hackensack Meadowlands Development Commission.
Highest and Best Use: As vacant Hold the site for development until the ideal improvement
(determined to be a similar industrial building developed to the highest allowable density) becomes financially feasible.
As improved Continued use as an industrial warehouse building is the
optimum use.

6
SUMMARY OF IMPORTANT FACTS AND CONCLUSIONS
VALUE VIA INCOME CAPITALIZATION APPROACH: $10,600,000 (rounded) IRR 8.50% Terminal Cap Rate 7.50% Going-In Rate 7.00% VALUE VIA SALES COMPARISON APPROACH: $10,400,000 (rounded) Unit Value $71.07/SF VALUE VIA COST APPROACH: $9,500,000 (rounded) FINAL VALUE CONCLUSION: $10,600,000 Estimated Marketing Period up to 12 months

7
SCOPE OF THE APPRAISAL
The scope of my appraisal included a site inspection, most recently on October 8th, 2009. Over the course of the inspection, the entire floor area was inspected, including warehouse and office areas. The mechanical areas and roof were also inspected by the appraiser. I extracted relevant market data from throughout the New York Metropolitan area, and specifically within the subject’s sub-market. Information pertaining to industrial rental rates and terms, operating expenses, vacancy rates and information on recent comparable sales were collected, verified and analyzed. This data was obtained through a variety of sources, including: interviews with commercial real estate brokers, leasing agents and property managers, assessment and land records from the various local jurisdictions, Comps data services, the CoStar database and various trade publications. The sales data included herein was confirmed through my conversations with market participants (real estate brokers and property owners) who were involved in the various transactions. I focused my search to comparable data in the subject's market area and determined that data obtained from the past three years is most relevant to the valuation of the subject property. General economic data such as population, income, households, employment, etc., was gathered from governmental sources including the CCIM Site to do Business, the U.S. Census Bureau and the U.S. Bureau of Labor Statistics. Principal Real Estate Investors, LLC, the owner of the property, provided information specific to the subject property including lease, expense data and information on recent capital improvements. Other information such as taxes, ownership history and zoning was provided by governmental and private sources. Specific estimates concerning market rent, expenses, vacancy, cash flows, etc. are the judgment of the appraiser based upon my interpretation of the available market data. Support for the estimate of exposure time was derived from recent sales of similar properties in the market, discussions with market participants, as well as from the PriceWaterhouseCoopers Korpacz Investor Survey (see Exposure Time discussion on a following page). All three traditional appraisal methods – the Income Capitalization Approach, Sales Comparison Approach and the Cost Approach – are used in the appraisal report in order to render an opinion of market value.

8
PURPOSE OF THE APPRAISAL
The purpose of the appraisal is to develop a supportable opinion of the retrospective market value of the subject’s fee simple estate, as of February 28, 2007.
INTENDED USE AND INTENDED USER OF THE APPRAISAL The intended use of the report is to satisfy the practicum requirement of The Edward St. John Department of Real Estate. The intended users of this report include The Edward St. John Department of Real Estate and its faculty, staff and administrators.
PROPERTY RIGHTS APPRAISED
The subject is appraised on the basis of the fee simple interest, which is defined in The Dictionary of Real Estate Appraisal, 4th edition, published by the Appraisal Institute as: "Absolute ownership unencumbered by any other interest or estate, subject only to the limitations imposed by the governmental powers of taxation, eminent domain, police power, and escheat." 1
DATE OF VALUE OPINION The effective date of the appraisal is February 28, 2009.
DEFINITION OF MARKET VALUE Market Value means the most probable price that a property should bring in a competitive and open market under all conditions requisite to a fair sale, the buyer and seller each acting prudently and knowledgeably, and assuming the price is not affected by undue stimulus. Implicit in this definition is the consummation of a sale as of a specified date and the passing of title from seller to buyer under conditions whereby: (1) Buyer and seller are typically motivated; (2) Both parties are well informed or well advised, and acting in what they consider their
own best interests; (3) A reasonable time is allowed for exposure in the open market; (4) Payment is made in terms of cash in U.S. dollars or in terms of financial arrangements
comparable thereto; and (5) The price represents the normal consideration for the property sold unaffected by special
or creative financing or sales concessions granted by anyone associated with the sale. 2
1 The Appraisal Institute, The Dictionary of Real Estate Appraisal Fourth Edition 2 Federal Register, Department of the Treasury, Office of the Comptroller of the Currency, 12 CFR Part 34, Real Estate
Appraisals, August 24, 1990.

9
EXPOSURE TIME
“The estimated length of time the property interest being appraised would have been offered on the market prior to the hypothetical consummation of a sale at market value on the effective date of the appraisal; a retrospective estimate is based upon an analysis of past events assuming a competitive and open market.”3
MARKETING TIME
“Reasonable marketing time is an estimate of the amount of time it might take to sell an interest in real property at its estimated market value during the period immediately after the effective date of the appraisal; the anticipated time required to expose the property to a pool of prospective purchasers and to allow appropriate time for negotiation, the exercise of due diligence, and the consummation of a sale at a price supportable by current market conditions.”4 In order to make estimates of exposure and marketing time, I contacted various individuals active in the local market. Brokers indicated that while there is strong demand for all industrial property types in Northern New Jersey, there is limited product available for sale, as owners are reluctant to sell in a rising market. A shortage of supply, coupled with strong demand, has resulted in relatively short exposure times. The subject is a good-quality property situated in a good location. According to local brokers, there are a number of buyers in the market for industrial properties, and if the subject were exposed to the market at this time, a marketing period of six months would be anticipated. According to the 1st quarter 2007 Korpacz Price Waterhouse Coopers Investor Survey, marketing times for warehouse properties nationwide are ranging from 1 to 12 months, with an average of 5.77 months. I have also considered actual transaction in the market as well. The sales used in the Sales Comparison Approach had marketing periods of 1 to 5 months. Therefore, my value conclusion is based upon an exposure period of 6 months. As I expect demand for the property to continue to be strong in the future, I estimate the marketing time for the subject to be 6 months.
IDENTIFICATION OF THE PROPERTY
The subject property, commonly known as 60-70 Seaview Drive, Secaucus, New Jersey 07094, is situated along the northeast side of Seaview Drive, approximately 1,200+ feet southeast of Meadowlands Parkway and 2,000+ feet south of an entrance to Route 3, which provides direct access to Midtown Manhattan via the Lincoln Tunnel, approximately four miles east. Secaucus Township identifies the subject as Block 19, Lot 13. The subject improvement consists of a 146,342 square foot single-story, single-tenant industrial warehouse facility located on 6.712 acres of land. The building, vacant as of the date of value, was previously leased to Nippon Express U.S.A., Inc. with a lease that extended from 1992 through October 31, 2006. Principal Life Insurance Company has fee simple ownership of the subject property. 3. Appraisal Standards Board of the Appraisal Foundation, Statement on Appraisal Standards #6,
“Reasonable Exposure Time in Market Value Estimates”, October 1992 4. Advisory Opinion G-7 of the Appraisal Standards Board of the Appraisal Foundation

10
HISTORY OF THE PROPERTY
Principal Life Insurance Company owns the subject property. The property was originally constructed in 1978. The current owner acquired the property from TCW Realty Fund VA Holding in March 1997. The transfer was recorded on Hudson County Deed Book 5123, Page 16. The recorded price was $7,250,000 or $49.54 per square foot of rentable area. The building is not being offered for sale and is not under contract. There are no negative easements or encroachments which impact the value of the subject.

11
SITE DESCRIPTION AND ANALYSIS
Location: 60-70 Seaview Drive, Secaucus, New Jersey 07094 Tax Reference: Block 19, Lot 13 Site Area: 292,375+ square feet (6.712 acres) Shape/Topography/Frontage: The site is rectangular in shape with 487.29 feet of frontage
along the northeast side of Seaview Drive, with a depth of 600 feet. The property is situated along the northeast side of Seaview Drive, approximately 1,200+ feet southeast of Meadowlands Parkway and 2,000+ feet south of an entrance to Route 3, which provides direct access to Midtown Manhattan via the Lincoln Tunnel, approximately four miles east. The site is generally level and drainage appears to be adequate.
Soil and Sub-soil Conditions: At the time of inspection, no obvious adverse subsoil
conditions were observed. My inspection indicated that the site is physically and functionally suitable to support the present development; however, an engineer’s report supporting the observation was not submitted.
Access/Visibility: The site is accessed via two curb cuts on Seaview Drive.
Access and visibility are considered adequate. The site backs up to an active Conrail freight rail line and the subject has an inactive rail spur along the rear of the site.
Utilities: All necessary public utilities are available and connected to
the site, including water/sewer, electricity, gas and telephone.
Easements/Encroachments: I have not had the benefit of examining a title report or a
plat for the subject property. In the performance of this appraisal, I did not observe, nor was I made aware of, any easements or encroachments which would have an adverse effect on the subject site.
Site Improvements: The primary site improvements consist of a one-story
warehouse industrial building with 146,342 square feet of rentable area. Additionally, the site is improved with an asphalt parking area suitable for approximately 150 automobiles and 15-20 tractor-trailers. The parking areas have landscaped islands and concrete curbs and walkways.

12
SITE DESCRIPTION AND ANALYSIS
Hazards, Nuisances, or Detrimental Influences: Based on my observation of the subject’s area, there are no
hazards, nuisances, and/or detrimental influences which impact the subject property.
Flood Zone: According to the National Flood Insurance Program Flood
Insurance Rate Map, Community Panel Number 340226B, dated March 25, 1983, the property is situated in a non-flood hazard zone “C”, which has no detrimental effect on the usability of the site.
Conclusion: The site offers good access and appears to adequately
support the existing improvements. The property appears to be developed to its full potential. If vacant, it could physically support a variety of property types.

13
IMPROVEMENT DESCRIPTION AND ANALYSIS
The value reported is qualified by certain definitions, limiting conditions, extraordinary assumptions and certifications set forth in the attached report. The scope of my appraisal included a site inspection, most recently on October 8th, 2009. At the time of inspection, the property was 100% leased to AFL Quality NY, LLC with a lease extending through December 31, 2017. Over the course of the inspection, the entire floor area was inspected, including warehouse and office areas. The mechanical areas and roof were also inspected by the appraiser. In its current condition, upon occupancy in 2008, the current tenant performed extensive renovations to the property including new paint, new vinyl tile, carpeted floorings, and a new ceiling grid in the office area. Furthermore, the tenant dramatically increased the floor load in one bay of the warehouse in order to support a very heavy printing press. The front façade was recently upgraded with new stucco and paint. Lastly, the tenant recently installed a new 2,500 KVA transformer and a 3,200 Amp, 480/277 volt, three-phase, four-wire electrical service, including installation of a 4” copper pipe along the roofline for the delivery of compressed air throughout the warehouse. As previously mentioned, my appraisal is as of a retrospective date of value of February 28, 2007, when the subject was vacant and the recent renovations had yet to be undertaken. Although the appraiser had not inspected the property on the retrospective date of value, in its pre-renovated condition, the appraiser relied on detailed property descriptions, leases, operating statements and property photographs from building ownership and other parties familiar with the property on the retrospective date of value. The following description of the subject property is based on a review of site plans, building floor plans and upon a physical inspection conducted by Peter Enright, MAI on January 18, 2007, accompanied by an employee of the tenant.

14
IMPROVEMENT DESCRIPTION AND ANALYSIS
Building Area: 146,342 Square feet (rentable area) Occupancy: 0%; Vacated by Nippon Express U.S.A., Inc. October 31, 2006 Age: Built 1978 Office Area: There is approximately 14,500 square feet (9.9%) of office space. The
office area requires new carpeting, paint and ceiling grid repairs. Foundation: Cast-in-place concrete perimeter wall footings with masonry foundation
walls and cast-in-place concrete lift slab at dock height. Frame: Structural steel framing including interior and perimeter columns; 40’ x
45’ bay spacing. Exterior Walls: Concrete block exterior curtain walls covered with brick façade along the
front elevation and painted along the rear and sides. Roof: The flat roof is framed with steel beams and open web-joists with metal
deck. The interior clear ceiling height is 24 feet. The roof cover consists of insulated rubberized roofing membrane. Overall condition of the roof cover appears to be good.
Windows/Doors: There are windows along the office area at the front of the building.
Windows are aluminum frame, double glazed fixed panel type. The front exterior entrance doors are aluminum with full glass panel set in metal frames. The service doors are painted hollow metal doors.
Loading Doors: There are a total of 15 dock height loading doors, including three interior
loading docks. All doors have mechanical levelers some with seals. Ceilings: 24 Feet clear. Lighting: Suspended metal halide lighting in the warehouse and recessed florescent
fixtures in office areas. HVAC: The office areas are heated and cooled via gas-fired, packaged, rooftop
units. The warehouse areas are heated via ceiling-hung gas-fired space heaters.
Sprinklers: 100% Wet sprinklered.

15
IMPROVEMENT DESCRIPTION AND ANALYSIS
Electrical Service: 800 Amp, 480/277 volt, three phase, four-wire service. Interior Finish: Finish within the office area consists of bare floors needing new
carpeting, painted gypsum board walls and suspended acoustical tile drop ceilings. The overall condition of the office is fair and in need of new flooring, painting and miscellaneous ceiling tiles. The concrete floor in the warehouse is sealed.
Site Improvements: The site contains asphalt paved parking and driveways with approximately
150 automobile parking spaces and 15-20 tractor trailer spaces along a concrete pad on the south elevation. Additional site improvements include concrete curbs and gutters, poured concrete sidewalks and landscaping. The site improvements are generally in good condition. The front and western side parking areas were recently repaved.
Conclusion The improvements are in average condition and do not display any major deferred maintenance with the exception of needed upgrades to the offices including carpeting, paint and various ceiling and wall repairs. The building has a functional layout and design, with adequate loading facilities and on-site parking. The building should be able to remain competitive for the foreseeable future.
16
ZONING AND LAND USE PLANS
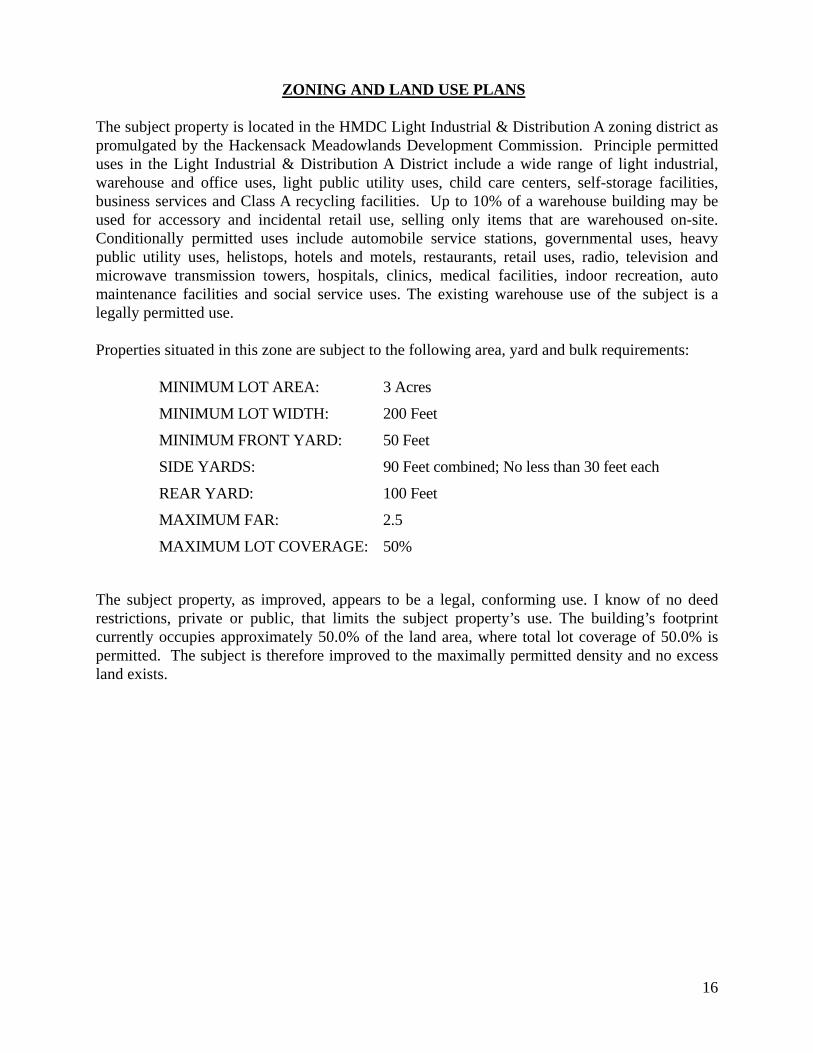
The subject property is located in the HMDC Light Industrial & Distribution A zoning district as promulgated by the Hackensack Meadowlands Development Commission. Principle permitted uses in the Light Industrial & Distribution A District include a wide range of light industrial, warehouse and office uses, light public utility uses, child care centers, self-storage facilities, business services and Class A recycling facilities. Up to 10% of a warehouse building may be used for accessory and incidental retail use, selling only items that are warehoused on-site. Conditionally permitted uses include automobile service stations, governmental uses, heavy public utility uses, helistops, hotels and motels, restaurants, retail uses, radio, television and microwave transmission towers, hospitals, clinics, medical facilities, indoor recreation, auto maintenance facilities and social service uses. The existing warehouse use of the subject is a legally permitted use. Properties situated in this zone are subject to the following area, yard and bulk requirements: MINIMUM LOT AREA: 3 Acres
MINIMUM LOT WIDTH: 200 Feet
MINIMUM FRONT YARD: 50 Feet
SIDE YARDS: 90 Feet combined; No less than 30 feet each
REAR YARD: 100 Feet
MAXIMUM FAR: 2.5
MAXIMUM LOT COVERAGE: 50%
The subject property, as improved, appears to be a legal, conforming use. I know of no deed restrictions, private or public, that limits the subject property’s use. The building’s footprint currently occupies approximately 50.0% of the land area, where total lot coverage of 50.0% is permitted. The subject is therefore improved to the maximally permitted density and no excess land exists.

17
REAL ESTATE TAX AND ASSESSMENT ANALYSIS
The subject is identified in the Secaucus Township assessor’s tax roll as:
Block 19, Lot 13
The subject’s assessed value and tax burden are illustrated below. The taxes are computed on a fiscal year basis beginning July 1.
2006 Assessed Value Land: $1,845,800 Improvements: $5,404,200 Total: $7,250,000 $49.54/SF 2006 Equalization Ratio 63.47% Implied Market Value $11,422,719 $78.05/SF 2006 Tax Rate 2.834/$100 AV 2006 Tax Burden $205,465 $1.40/SF
As of the date of value, the 2007 equalization ratio and tax rates have not yet been released. 2006 assessed values in Secaucus are supposed to reflect 63.47% of market value. The subject’s 2006 equalized value is considered reasonable based on the opinion of market value contained herein. Assessed values are typically changed only upon township or neighborhood-wide reassessments, revaluations or in response to major capital improvements. There are no reassessments or revaluations planned for Secaucus, and therefore, the subject’s existing assessed value should remain unchanged for the foreseeable future.
In order to test the reasonableness of the subject’s current assessment, I have compared the property to several others in the neighborhood. This data is summarized as follows:
Address Building Area Land Area Year Built 2006 Assessed Value 50 Enterprise Ave., Secaucus 164,812 SF 6.385 acres 1972 $7,294,500 $44.26/SF55 Metro Way, Secaucus 146,467 SF 6.928 acres 1986 $8,306,100 $56.71/SF80 Enterprise Ave., Secaucus 121,385 SF 4.887 acres N/A $6,193,200 $51.02/SFSubject 146,342 SF 6.712 acres 1978 $7,250,000 $49.54/SF
The subject’s current assessment appears to be reasonable based on the comparables illustrated above. I anticipate that the subject’s assessed value will remain unchanged for the foreseeable future. For the upcoming year, I will utilize the existing assessed value applied to the existing 2006 tax rate (the 2007 tax rate will not be published until June or July 2007) plus a 4% inflation factor. This results in a first-year real estate tax projection of $213,684 or $1.46/SF. The subject’s tax burden is projected to increase at a rate of 4.0% per-annum throughout the holding period.

18
REGIONAL MAP

19
FUNDAMENTAL MARKET ANALYSIS
Regional Data: The subject is located in Secaucus Township, Hudson County, New Jersey. Hudson County is located in Northern New Jersey, which is generally defined as the thirteen northernmost counties in New Jersey (Bergen, Essex, Hudson, Hunterdon, Mercer, Middlesex, Monmouth, Morris, Passaic, Somerset, Sussex, Union and Warren). The economic well-being of Northern New Jersey, given its location directly opposite Manhattan, is directly linked to the economy of New York City. As such, a discussion of the New York City economy is vital in understanding the subject’s regional economic influences.
New York City is the heart of the northeast region, the largest city in the country, and the traditional “gateway” to the United States. New York City encompasses 320 square miles and is surrounded to the north by Westchester County, New York, to the east by Nassau County, New York, to the south by New York Bay and the Atlantic Ocean and to the west by the state of New Jersey.
According to the U.S. Census Bureau, as of January 2007 the population of the United States has exceeded 301 million people, a 10.4% increase over the 272.7 million people counted in the 1999 census. The largest concentration, approximately 70 million people, live in the “northeast corridor,” between Boston to the north and Washington D.C. in the south. Commerce and population density have increasingly formed one interdependent environment throughout this region. This trend is expected to continue as transportation systems and suburban sprawl overlap with adjacent cities. Northern New Jersey’s proximity to Manhattan, its excellent transportation links, a diverse and educated work force and a range of housing opportunities have all been instrumental in the Northern New Jersey’s unprecedented growth and development since the 1980s.
While the area has historically wrestled with the same problems faced by most large urban economies in America, such as a shortage of affordable housing, a shrinking manufacturing base, struggling inner cities, and overburdened infrastructure, a strong economy in the late 1990s and housing boom in the past several years allowed the region to prosper, and many of the urban areas in the region have enjoyed significant redevelopment and renaissance.
Being the economic center of the region, New York City’s influence extends far beyond its political boundaries. It enjoys a highly diversified economy, and is home to more corporations than any other city in the United States. A great deal of the surrounding population commutes to the City’s employment centers. As residential housing around New York City has become increasingly expensive, the metropolitan area has expanded to western and central New Jersey, eastern Pennsylvania, eastern Long Island, Orange and Putnam Counties in New York, and southwestern Connecticut. The metropolitan area, as defined by the United States Department of Commerce, includes 17 counties within the states of New York, New Jersey, and Connecticut. This Standard Consolidated Statistical Area (SCSA), which comprises approximately 13,000 square miles, had a total population of almost 18 million in 1990. The expanding commercial bases in these areas have encouraged this growth, and there are continuing defections of companies from Manhattan to the surrounding areas in order to capitalize on the proximity of labor and lower expenses associated with suburbia.

20
FUNDAMENTAL MARKET ANALYSIS
On September 11, 2001, New York City and Washington D.C. were the sites of the worst terrorist attacks in U.S. history. The entire World Trade Center complex in downtown Manhattan was destroyed, representing 13.4 million square feet, with another 16.5 million square feet of office space damaged. In addition to the tragic loss of life, the events of September 11th temporarily displaced over one thousand small businesses, and many thousands of local residents, primarily in Battery Park City. While efforts are underway to rebuild New York City, and the business community and government on all levels have stated their commitment to the future of the City, it will nonetheless be many years before downtown Manhattan is whole once again. The overwhelming majority of New Jersey Class A Hudson Waterfront development is located in Jersey City, which was perhaps the hottest real estate market throughout the region in 1999 to 2000. Jersey City experienced an unprecedented amount of development and growth during these years and further development is already underway with millions of square feet of office and residential space still proposed and poised for development. The Jersey City waterfront has been renamed by some “Wall Street West” due to its emergence as a leading financial district. As noted, due to its smaller size and lack of development sites, Hoboken has not undergone the major transformation into an office center as has its neighbor to the south. Waterfront Corporate Center I and II represent the first new Class A office construction on Hoboken’s waterfront in a number of years, in part because a prior attempt to build large-scale development on the Hoboken waterfront became mired in lawsuits and became highly politicized. In recent years, a number of high-profile Wall Street firms such as Merrill Lynch, Lehman Brother, Goldman Sachs, UBS Warburg/Paine Webber, JP Morgan Chase and several other firms have relocated major front-office operations to the Jersey City waterfront. Given the loss of office inventory and damage to downtown Manhattan’s transportation network, coupled with the psychological effects of working downtown, many firms looked beyond Downtown Manhattan in the post September 11th era. As an emerging center for the financial industry, Jersey City may continue to attract corporate expansion and remain a viable alternative to downtown Manhattan. Population: New York City’s population first surpassed 8 million residents in 2000. According to the U.S. Census Bureau New York City’s population increased to 8,143,197 as of 2005, reflecting a 1.7% increase since 2000. Recent population growth is in contrast to the 1970s, during which the city’s population fell from a previous high of 7,894,854 persons in 1970 to 7,071,737 in 1980, a decrease of 10.4%. Analysts point out that a decade of sustained immigration combined with several years of prosperity have helped to drive up the population. A strong local economy has not only drawn newcomers, but is has persuaded native New Yorkers to stay put.

21
FUNDAMENTAL MARKET ANALYSIS
New Jersey is the nation's most densely populated state. According to the U.S. Census Bureau, New Jersey’s 2005 population is estimated at 8,717,925 persons. The estimated population increase in New Jersey in the 1990’s represents a faster rate of population growth (8.9%) than in the 1980s (5.0%). Approximately 5.2 million live residents in North-Central New Jersey; the region houses 62% of the entire state population. The fastest growing parts of New Jersey are the coastal region, the rural northwest, and the central region. The six industrialized counties (Bergen, Essex, Hudson, Morris, Passaic and Union) in the state’s northeastern region experienced population growth of 6.9% from 1990 to 2000, after a decline during the 1980s (-2.4%). All counties in this region gained population during the 1990s.
The following table illustrates local population trends.
REGIONAL POPULATION SURVEY 2011
Projection 2006
Estimate 2000
Census 1990
Census % Change 2000-2006
% Change 1990 - 2000
New York City 8,481,198 8,270,881 8,008,278 7,322,564 3.3% 9.4% New Jersey 9,201,692 8,853,518 8,414,350 7,730,188 5.2% 8.9% Hudson County 628,758 620,796 608,975 553,099 1.9% 10.1% Secaucus 15,886 15,750 15,931 14,061 -1.1% 13.3%
Source: ESRI
New York City experienced greater population growth than the entire state of New Jersey from 1990 to 2000. Over the 2000-2006 period New Jersey’s population growth substantially outpaced New York City. Hudson County’s growth rate exceeded that of New Jersey and New York City during the 1990’s; however due to the economic dislocation that occurred in the wake of 9/11/01 the county’s population growth has lagged the State’s since 2000. Hudson County is New Jersey’s smallest and most densely populated county with a population of 10,013 persons per square mile.
While Hoboken and Jersey City enjoy great popularity, most of New Jersey’s future growth is expected to be concentrated in the central New Jersey counties of Mercer, Middlesex, Monmouth and Somerset along the established transportation corridors of I-287, I-78 and Route 1, typical of the pattern of ever-outward suburban growth seen over the past 40 years.
Economy: Over the past year, the local economy, like the regional and national economy, has shown modest improvement. According to the US Department of Labor, New Jersey gained 20,500 jobs between December 2005 and December 2006, while New York City gained 43,772 jobs over the same period. New Jersey’s unemployment rate decrease from a December 2005 rate of 4.3% to December 2006 rate of 3.9%, while New York City’s unemployment rate declined from 5.6% to 4.0%.
New Jersey retains its powerful core of leading-edge, knowledge-based economic activities. However, going forward, it has two major concerns. The first is that even though the state’s economy continued to expand in 2006, employment growth has slowed substantially, particularly in the private sector. This loss of economic momentum comes at a time when the national economic expansion is maturing.

22
FUNDAMENTAL MARKET ANALYSIS
Currently (January 2007), the expansion is 62 months old. The average length of the nine postwar national expansions, excluding the current one, is 59 months. That average was reached in October. Thus, America’s current expansion has already achieved above-average-length status. The maturing of expansion is a concern raising questions about its impact on New Jersey. Moreover, the stresses of higher interest rates and rising energy costs are causing national economic growth to slow measurably. Inevitably, a weakening national economy and a maturing economic cycle will filter down into New Jersey. This makes for a modest short-term outlook for the first half of 2007. Jersey City has been one of the primary beneficiaries of the recent exodus from Manhattan post September 11th 2001. Hudson County saw a surge in employment of 12,300 jobs between August and December 2001 (from 259,900 to 272,200), but the number has since fallen back as financial and technology firms continue to consolidate (as shown on the following table). Unemployment in Hudson County has moderated over the past year, decreasing from an average of 5.4% during 2005 to a preliminary annual average of 4.5% in 2006.
Average Annual Unemployment Figures Geographic Area 1998 1999 2000 2001 2002 2003 2004 2005 2006 12/06 New York City 8.0% 6.7% 5.7% 5.8% 7.9% 8.4% 7.1% 5.8% 5.0% 4.0% New Jersey 4.6% 4.6% 3.8% 4.3% 5.8% 5.8% 4.9% 4.4% 4.8% 3.9% Hudson County 7.3% 7.3% 5.7% 6.2% 7.2% 8.0% 6.3% 5.4% 5.8% 4.5% United States 4.5% 4.2% 4.0% 4.8% 5.8% 6.0% 5.5% 5.1% 4.6% 4.5%
Source: Bureau of Labor Statistics Employment Base: The following table illustrates the current employment base and job growth in the Bergen-Hudson-Passaic MSA since 1997.
Bergen-Hudson-Passaic MSA
Employment by Industry Sector 1997 1998 1999 2000 2001 2002 2003 2004 2005 2006 Total Nonfarm 874.9 897.2 904.6 920.0 923.4 901.6 905.1 902.5 904.7 902.8 Goods Producing 147.4 146.0 141.7 139.1 134.6 125.6 119.0 114.6 110.1 104.9 Service Producing 727.5 751.2 762.9 780.9 788.9 776.1 786.1 787.9 794.7 798.0 Natural Res/Mining & Cons 26.8 28.3 29.5 30.3 31.7 33.1 32.1 32.2 31.9 32.1 Manufacturing 120.7 117.6 112.3 108.8 102.8 92.5 86.8 82.4 78.2 72.8 Wholesale Trade 76.7 78.6 78.6 77.6 76.2 71 71.5 70.4 70.4 71.2 Retail Trade 104.2 104.8 104.4 106.1 105.4 106 104.9 103.4 102.8 101.6 Trans., Warehouse & Util. 43.3 45.0 46.9 48.1 49.3 47.2 46.8 45.2 44.3 43.4 Information 24.3 25.8 26.2 27.2 27.1 24.8 23.8 23.2 23.9 23.3 Financial Activities 63.3 65.2 68.7 73.3 73.8 72.3 72.3 72.6 73.4 74.5 Prof. & Business Services 129.6 138.5 140.6 142.8 142.7 134.2 134.5 133.6 134.9 133.6 Educ. & Health Service 97.8 102.8 105.0 108.5 113.0 117 120.8 123.5 124.9 127.2 Leisure & Hospitality 50.2 51.7 52.0 52.7 53.6 54.4 57.1 58.2 59.4 60.8 Other Services 35.3 35.6 36.1 37.0 37.1 36.2 36.9 38.3 40.4 40.5 Total Private Sector 771.9 794.0 800.2 812.3 812.8 788.5 787.5 783.1 784.5 781.0 Government 103.1 103.1 104.4 107.7 110.7 113.1 117.6 119.4 120.2 121.4
Source: Bureau of Labor Statistics (measured in thousands)

23
FUNDAMENTAL MARKET ANALYSIS
The table above indicates the Bergen-Hudson-Passaic MSA experienced a decline of 18,300 jobs between 2001 and 2003. Employment levels have remained basically stable since 2003. Much of northern New Jersey’s growth has come on the strength of, but also at the expense of New York City. Lower expenses have lured many companies here, including lower taxes, cheaper real estate, and ease of transportation of goods over land and through the ports, and the availability of an educated labor force. Conclusion: At the end of 2000, the New York City metropolitan area completed its eighth consecutive year of economic expansion. 2001 and 2002 were a reversal of fortunes, while in 2003 the extended economic downturn reversed course and the economy once again began to expand at a steady albeit restrained pace. Looking forward, the economic indicators are cautiously optimistic. Job growth is occurring on a modest level, which is an improvement from the declines seen over the past several years. Unemployment levels have declined, and analysts project modest job growth in 2007. Continued improvement in the national economy has been beneficial to Wall Street and the New York City regional economy in 2006 and continued improvements could cause the real estate markets to tighten further in 2007. Improving market fundamentals combined with rising interest rates may however weaken investor demand in the coming year. Hudson County Overview: The subject property is located in Secaucus Township, Hudson County, New Jersey. Hudson County is located along the Hudson River and overlooks the city of New York. The county is situated on a peninsula bounded by Newark Bay, the Passaic and Hackensack Rivers to the west, the Hudson River to the east, the Kill Van Kull to the south, and Bergen County, New Jersey to the north. Essex and Union County, New Jersey are located to the west, the borough of Staten Island, New York is located to the south and Manhattan is located to the east. The county is the smallest in New Jersey, as it contains only 62 square miles. At the same time it is the most densely populated county, with a population density of 10,013 people per square mile. Hudson County contains twelve municipalities, including Jersey City, Bayonne, North Bergen, Union City, West New York, Kearny, Harrison, Secaucus, Guttenberg, Weehawken, East Newark and Hoboken. Despite the county’s comparatively small size, its location wedged between the cities of Newark and New York City makes it a highly desirable business location. Augmenting this desirability is a well-developed transportation system. The major components of the transportation system include the Lincoln and Holland Tunnels, which connect with Midtown and Downtown Manhattan. Other major arteries which run through the county include the New Jersey Turnpike (I-95) and the New Jersey Turnpike extension (I-78), Route 3, Route 7, U.S. Route 1&9, and the Bayonne Bridge from Staten Island, New York.

24
FUNDAMENTAL MARKET ANALYSIS
New Jersey Transit has an extensive rail system providing passenger service throughout New Jersey and into New York’s Penn Station at 32nd Street between 7th and 8th Avenues. The Hoboken Terminal is NJ Transit’s only station on the New Jersey Waterfront and provides convenient and frequent direct or connecting routes to all destinations served by the NJ Transit rail system. NJ Transit runs seven separate routes to and from the Hoboken Terminal. The Port Authority Trans-Hudson (PATH) trains provide quick service from Midtown Manhattan (at Sixth Avenue and 32nd Street) to Hoboken, Newport/Pavonia (Jersey City), Grove Street (Jersey City) and Journal Square (Jersey City). A second PATH route connecting directly with the World Trade Center to Downtown Manhattan reopened in 2005 after repairs made necessary by the terrorist attack on the World Trade Center in 2001. The PATH extends westward to Newark and contains a total of 13.9 miles. The PATH contains 13 rail stations in New Jersey and Manhattan. The light rail opened to the public in April 2000, with the initial operating segment connecting Bayonne (34th Street) and Jersey City (Exchange Place), as well as a spur line to West Side Avenue in Jersey City. Later that year, the service was extended northward to Pavonia-Newport. In 2002, service was extended out to Hoboken Terminal. The system will ultimately contain 20.5 miles of rail service from southern Bayonne to the N.J. Turnpike’s Vince Lombardi service area in Bergen County. Original plans called for extending the Hudson-Bergen Light Rail north to the Vince Lombardi Park-and-Ride in Ridgefield, to Society Hill on the West Side Avenue branch, and south to 5th Street in Bayonne. Currently the line is now planned to have its southern terminus at 8th Street in Bayonne. No other firm expansion plans have been announced nor has any timeline been set for the completion of subsequent parts of the project. Within Hoboken, the line was to have originally been configured as a through-running operation, with an alignment built either through or adjacent to Sinatra Park en route to Port Imperial in Weehawken, which would have given access to both the PATH station entrance and the bus terminal. This was shelved in favor of the current stub-end station in the southern end of Hoboken Terminal and the current route along Hoboken's west side. Hudson County also benefits from a privately owned and operated ferry service called NY Waterway. NY Waterway runs several different ferries across the Hudson River connecting Jersey City, Hoboken and Weehawken to both Midtown and Downtown Manhattan. NY Waterway’s ferry terminals are all conveniently located next to NJ Transit and PATH stations. NJ Transit also provides a number of bus routes throughout the county as do several private carriers. At least three private bus companies provide interstate services to New York City. Newark International Airport is less than a half hour from all municipalities in Hudson County. The airport covers over 2,000 acres and supports 35 carriers. It is a hub for Continental Airlines, which is accountable for 65% of the airport’s annual volume. Teterboro Airport, a smaller regional airport is also a short commute from the county.

25
FUNDAMENTAL MARKET ANALYSIS
Both Hudson County’s and Hoboken’s greatest asset is the Hudson River waterfront. The waterfront was vacant and somewhat decayed for many years, after the old manufacturing base eroded and moved out of the metropolitan area. Beginning in the 1980s, substantial redevelopment began, which today has resulted in numerous high quality residential and office developments. In terms of the local population, Hudson County is a heavily urbanized county that has traditionally housed more of the region’s lower income and less employable population. The unemployment rate in the county since the 1980s has typically ranged between 30% to 50% above the state average. This was aggravated by the decline in the manufacturing base, which is continuing to shrink, especially those companies housed in older obsolete facilities. Historical population figures for the county and municipalities are indicated below. The estimated 2006 population of the county is 620,796 people, up 1.9% since 2000. While the county’s population had been slowly declining between 1950 and 1990, the trend has reversed itself during the 1990s, with an unexpectedly sharp uptick in population reflected in the 2000 Census. The county’s population base increased more modestly since 2000 with further modest population gains projected through 2011. Population growth rates are widely distributed in the county with Hoboken expected to grow by more than 2.8% by 2011, while less desirable communities continue to lose residents. The estimated median household income for the county as of 2006 stood at $48,409, a 20.1% increase over the 2000 Census figure of $40,316 per household. The 2006 average household income stands at $68,122, which is well below the New Jersey average of $93,210. Office development is extremely active, but entirely concentrated on the Hudson Waterfront, which some local real estate participants refer to as “Wall Street West”. Major corporations that have committed to Jersey City in recent years include Chase Manhattan Bank, UBS Warburg/Paine Webber, ISO, Knight Securities, Merrill Lynch, Lehman Brother, Goldman Sachs, Morgan Stanley, Datek Online, T.D. Waterhouse, DLJ and American Express. Book publisher John Wiley & Sons are relocating their headquarters from Midtown Manhattan to a new building recently completed on the waterfront in Hoboken. There are several thousand residential units planned or under construction along the Hudson Waterfront, in Jersey City, Hoboken, Weehawken, and West New York. In addition to office and residential development, new hotel development is also prevalent. Several new hotels have opened in Jersey City with others planned and under construction. Additional development includes the Hoboken waterfront revitalization, which is a mixed-use project featuring waterfront access and open space, a hotel, office space and residential units.

26
FUNDAMENTAL MARKET ANALYSIS
Just west of Secaucus in Bergen County the Meadowlands Xanadu is beginning to take form. Once complete this development will encompass 4.8 million square feet of retail and entertainment space. The estimated completion date for the project is in 2007, with a grand opening in mid-2008. The project is joint venture developed by the Mills Corporation in partnership with Mack-Cali Realty Corporation. Xanadu will contain the country’s first indoor ski resort, minor league baseball stadium, indoor Formula One race track and simulated skydiving facility. An entertainment area will include Muvico Theaters (160,000 SF movie complex), Virgin Megastore, a 1940’s bowling center, a Ferris wheel, Borders Books and Music, and a new concept store owned by Circuit City, as well as many other state of the art stores. New Jersey Transit is extending the nearby Passaic Valley Line to the Meadowlands Sports Complex by the end of 2007, in preparation for the opening of the Meadowlands Xanadu. There are also plans to extend the Hudson-Bergen Light Rail to the complex. The construction of Xanadu will provide the Meadowlands area with an unprecedented level of shopping and entertainment options. The project is expected to bring over 20,000 jobs to the region, as well as infrastructure improvements and millions of dollars of tax revenue.
Conclusion While Hudson County has seen considerable growth and development in recent years, the current uncertainty surrounding the regional and national economy suggest that the economy may have reached a plateau for the near term. Given the county’s excellent transportation network and its proximity to Manhattan, a period of continued growth is projected over the long-term.

27
NEIGHBORHOOD MAP

28
FUNDAMENTAL MARKET ANALYSIS
Town of Secaucus The subject property is situated along the northeast side of Seaview Drive, Hudson County, New Jersey, approximately 1,200 feet south of Meadowlands Parkway and 2,000+ feet south of Route 3. Route 3 provides direct access to the New Jersey Turnpike (Exists 16E & 16W) and to the Lincoln Tunnel which provides direct access to Mid-town Manhattan, less than four miles east. The Town of Secaucus contains an area of 5.89 square miles with a 2000 population of 15,931 residents according to the 2000 U.S. Census, reflecting a population density of 2,705 persons per square mile. Secaucus’ population is up 13.3% since 1990. The township is surrounded by North Bergen to the north and east, Jersey City to the south and the Bergen County communities of Lyndhurst, East Rutherford and Carlstadt to the west. The subject property itself is situated within the defined regional planning district known as the Hackensack Meadowlands Development Commission (HMDC), which includes parts of eleven municipalities in Bergen and Hudson Counties. Access/Linkage Access to this local area is most easily achieved by three roads, The New Jersey Turnpike (I-95), I-495 and Route 3. The New Jersey Turnpike is the area’s primary north/south artery. Also known as I-95, this is the premier north/south artery for the eastern seaboard of the United States connecting Maine to the north with Florida to the south. Route 3 is the primary east west artery in the region, which connects with I-495 in neighboring North Bergen. I-495 is also known as the Lincoln Tunnel Approach roadway, since it connects Route 3 and the Turnpike with the Lincoln Tunnel in neighboring Weehawken. The Lincoln Tunnel is one of the three primary access arteries between New Jersey and Manhattan, New York. Therefore, access to the subject from both local and regional roads is considered excellent. The subject is located in an area known as Harmon Cove, which is owned primarily by Hartz Mountain Industries. Started in the late 1960’s Harmon Cove is a 750-acre parcel located between the Hackensack River and the New Jersey Turnpike. The area was formerly an undeveloped mix of meadowlands and freshwater marsh. The complex now contains 13 million square feet of industrial warehouses and offices, 120 retail outlet stores, three hotels and 1,400 luxury condominium apartments. The vast majority of industrial buildings in the area contain 20’-24’ clear ceiling heights. Many of the industrial buildings in the area contain a small percentage of space (usually under 5%) devoted to retail outlet center use. Over the past decade the area has experienced the influx of many national brand retail outlets. There is virtually no land available for development in the neighborhood. The following map outlines the general boundaries of Harmon Cove.

29
FUNDAMENTAL MARKET ANALYSIS
SUBJECT

30
FUNDAMENTAL MARKET ANALYSIS
Conclusions The subject property is considered well located for use as an industrial facility due to its location to the major north/south and east/west arteries of the area. Major planned investments should augment the existing highway infrastructure. The market area is considered economically stable with gradual growth predicted for the long-term future.

31
FUNDAMENTAL MARKET ANALYSIS
Fundamental market analysis for an existing industrial building is a six-step process including: 1. Property productivity analysis 2. Specification of the market of the most probable property user’s (market delineation) 3. Demand analysis and forecast 4. Competitive supply analysis and forecast 5. Supply and demand relationship 6. Capture estimate for the subject Each of the six steps is divided further into sub-steps. The results are applied to the appraisal to test highest and best use alternatives and to support the three approaches to value. Property Productivity Analysis The subject is a 29-year old, steel-framed concrete warehouse/distribution building in average overall condition. The property was originally constructed in 1978 and is designed for single-tenant occupancy. The building, vacant as of the date of value, was previously leased to Nippon Express U.S.A., Inc. with a lease extending from 1992 through October 31, 2006. There is approximately 14,500 square feet (9.9%) of office space, with the remainder being warehouse space. A review of the subject’s typical competition and/or the market standard is developed in order to provide a preliminary rating of the subject site and building improvements. The purpose of this rating is to identify characteristics in determining which comparable properties constitute competitive supply. The following factors should be considered in a typical analysis of the subject’s site and building. Micro-Location Analysis Factors Important factors to consider within micro-location analysis for industrial properties include proximity to major thoroughfares, truck access onto the subject site, access and visibility for customers, and proximity to complementary uses. As stated earlier, the subject property is situated along the northeast side of Seaview Drive, Hudson County, New Jersey, approximately 1,200 feet south of Meadowlands Parkway and 2,000+ feet south of Route 3. Route 3 provides direct access to the New Jersey Turnpike (Exists 16E & 16W) and to the Lincoln Tunnel which provides direct access to Mid-town Manhattan, less than four miles east. Access to this local area is most easily achieved by three roads, the New Jersey Turnpike (I-95), I-495 and Route 3. The New Jersey Turnpike is the area’s primary north/south artery. Access to the subject from both local and regional roads is considered very good.

32
FUNDAMENTAL MARKET ANALYSIS
The fundamental purpose of warehouse/distribution properties is to get materials in and out of the facility. As such, access onto the site for trucks is paramount to the subject property. The site is accessed via two curb cuts on Seaview Drive. The site backs up to an active Conrail freight rail line and the subject has an inactive rail spur along the rear of the site. Access and visibility are considered average. The proximity of the subject to complimentary uses recognizes the need for an industrial property nearby land use support from related industrial services and high-end users. Harmon Cove contains 13 million square feet of industrial warehouses and offices, 120 retail outlet stores, three hotels and 1,400 luxury condominium apartments. The vast majority of industrial buildings in the area contain 20’-24’ clear ceiling heights. Many of the industrial buildings in the area contain a small percentage of space (usually under 5%) devoted to retail outlet center use. The subject highly benefits from proximity to complimentary uses. Site Analysis Factors Important factors to consider within site analysis for industrial properties include parking for cars and trucks, circulation on-site for trucks (truck maneuvering), land shape/topography and land-to-building ratio. An adequate parking ratio depends on the labor requirements of the facility based on its current and potential uses. For industrial parks, a standard parking requirement is 2.4 spaces per/1,000 square feet of gross building area. The subject site is improved with an asphalt parking area suitable for approximately 150 automobiles and 15-20 tractor-trailers, resulting in an automobile parking ratio of 1.02 spaces per/1,000 square feet of gross building area, below-standard for typical industrial properties, although the subject does benefit from good access to public transportation linkage. A CoStar Group analytic survey of a 3-mile radius surrounding the subject, totaling 332 industrial properties, results in an average parking ratio of 1.8 spaces per/1,000 square feet of gross building area, superior to the subject. In regards to truck maneuvering, in recent years, the maximum truck length of 65 feet has grown to exceed 70 feet. In order to service semi-trailers of this length, the recommended combined distance from loading dock to the outside edge of the turnout area is approximately 150 feet. The approximate relationship between truck maneuvering distance and truck length is 2.05 ft: 1 ft. In comparison to the market and the comparables outlined later within this report, the subject’s truck maneuvering area is typical for the area. The subject site is rectangular in shape with 487.29 feet of frontage along the northeast side of Seaview Drive, with a depth of 600 feet. The property is situated along the northeast side of Seaview Drive, approximately 1,200+ feet southeast of Meadowlands Parkway and 2,000+ feet south of an entrance to Route 3. The site is generally level and drainage appears to be adequate.

33
FUNDAMENTAL MARKET ANALYSIS
The land-to-building ratio is an important factor in determining if the subject site is large enough for parking, truck maneuvering and/or whether any additional land not needed to support the improvements is excess or surplus land. In many markets, the typical land-to-building ratio is between 2.5:1 and 3.5:1. The subject’s land-to-building ratio of 2.0:1, below standard for most markets, which translates into the inferior parking ratio and truck maneuvering radius discussed above. The following chart outlines the land-to-building ratios presented in the Sales Comparison Approach.
#
Address
Land-To-Building Ratio
1. 903 Castle Road, Secaucus 3.75:1 2. 350 Secaucus Road, Secaucus 2.13:1 3. 35 UPS Drive, Secaucus 1.47:1 4. 7 Caesar Place, Moonachie 2.47:1 5. 120 Moonachie Avenue, Moonachie 2.19:1 6. 99 Avenue A, Bayonne 8.61:1 Average 3.44:1
As evidenced above, the subject’s land-to-building ratio is slightly inferior compared to both general market parameters and competitive properties within the immediate market area. Building Improvement & Obsolescence Analysis Factors Important factors to consider when undertaking building analysis for industrial properties includes construction quality, exterior appearance, size of warehouse area, size of office area, condition and effective age, security features, flexibility of design for multitenants and quality of interior finish. Lastly, overall obsolescence as it relates to exterior design and interior design/layout is also factored. The construction quality of the subject is average for the market featuring cast-in-place concrete footings with masonry foundation walls and cast-in-place concrete lift slab at dock height. The floor thickness, although not detailed specifically, is of typical application between five to eight inches of reinforced concrete. The exterior appearance is also average for the market, consisting of concrete block exterior curtain walls covered with a brick façade along the front elevation and painted along the rear and sides. There is approximately 14,500 square feet (9.9%) of office space and 131,842 square feet (90.1%) of warehouse area at the subject. Typically, warehouse facilities in the market contain <10% finished office buildout, while flex and high-tech properties typically exceed these specifications. The chart on the following page outlines the percentage of office build-out from competitive properties presented in the Sales Comparison Approach.

34
FUNDAMENTAL MARKET ANALYSIS
# Address Office Build-out 1. 903 Castle Road, Secaucus 3% 2. 350 Secaucus Road, Secaucus 15% 3. 35 UPS Drive, Secaucus 7% 4. 7 Caesar Place, Moonachie 10% 5. 120 Moonachie Avenue, Moonachie 18% 6. 99 Avenue A, Bayonne 13% Average 11%
As displayed above, the subject’s 14,500 square feet, or 9.9% office build-out is similarly in-line with the market norm and is averagely competitive with industrial properties in the immediate market area. In relation to effective age, the subject was built in 1978. The property is situated within a mature industrial submarket in an area known as Harmon Cove, owned primarily by Hartz Mountain Industries and started in the late 1960’s. The previously mentioned radius survey resulted in an average year-built date of 1951 and an average year-renovated date of 1997. Furthermore, the subject has a single-tenant layout and barbed fencing around the perimeter. Finish within the office area consists of bare floors needing new carpeting, painted gypsum board walls and suspended acoustical tile drop ceilings. The overall condition of the office is fair and in need of new flooring painting and miscellaneous ceiling tiles. The concrete floor in the warehouse is sealed. Rating the exterior and interior design and layout includes factors such as ceiling heights, bay spacing and loading capacity (including dock and door count). The subject has structural steel framing including interior and perimeter columns totaling 40’ x 45’ bay spacing, below current standards for most warehouse operations, which require between 52’ x 52’ to 60’ x 60’ spacing, the emerging standard for state-of-the-art distribution facilities. The radius survey discussed earlier resulted in an average column spacing of 28’ x 37’. The subject has a ceiling height of 24’, characteristic of a contemporary, efficient, warehouse building. The radius survey indicated a range of ceiling heights between 8’ to 33’, averaging 16’, representing a superior layout in comparison to the market. Lastly, the subject features 15 dock height loading doors, including three interior loading docks. The radius survey indicated an average loading dock total of 10 per industrial facility.

35
FUNDAMENTAL MARKET ANALYSIS
The following chart illustrates the above factors used to rate the subject. In a Level C market analysis, a quantitative method is applied. I have generally rated the subject in comparison to typical competitive areas in Northern New Jersey. As noted, the categories are ranked on a scale of 0 to 10, with 10 representing the strongest score.
Industrial (Warehouse/Distribution) Building - Property Rating
Micro Location (Immediate Area) High Inferior
Moderate Slight Typical
Neutral* Slight Superior Moderate High
Proximity to major thoroughfare x Access onto site for trucks x Access and visibility for customers x Proximity to complementary uses x Site Parking for cars and trucks x Circulation on site for trucks x Topography x Land-to-building ratio x Building Improvements Construction quality x Exterior appearance x Size of warehouse area x Size of office area x Condition and effective age x Security features x Flexibility of design for multitenants x Quality of interior finish x Obsolescence (overall) Exterior design x Interior layout and design x Rating Conclusions Sub-rate number of items 0 1 3 9 5 0 0 Times category score 0 2 4 5 6 8 10 Category score 0 2 12 45 30 0 0 Total subject score 89 Percentage above or (below) all average -1%
*Typical industrial buildings in competitive areas

36
FUNDAMENTAL MARKET ANALYSIS
Location Analysis As demand for industrial space is spread over both a broad metropolitan area, in addition to on a localized basis, my analysis includes both a macro and micro location analysis of the subject property. My macro-level analysis includes a brief reiteration of the metropolitan area, an identification of the markets within the metropolitan area, a rating of the subject’s industrial market relative to the other markets in terms of land-use linkages and the direction/rate of urban growth. My micro-level analysis includes a description of the subject’s immediate area (Hudson County and Secaucus Township), an identification of the subject’s immediate submarket and an analysis of the subject’s submarket in comparison to competing submarkets within the subject’s competitive node. Macro Location Analysis The subject is located in Secaucus Township, Hudson County, New Jersey. Hudson County is located in Northern New Jersey, which is generally defined as the thirteen northernmost counties in New Jersey (Bergen, Essex, Hudson, Hunterdon, Mercer, Middlesex, Monmouth, Morris, Passaic, Somerset, Sussex, Union and Warren). The economic well-being of Northern New Jersey, given its location directly opposite Manhattan, is directly linked to the economy of New York City. Macro Location Analysis & Delineation: According to CoStar, the subject is located within the Secaucus/North Bergen Industrial submarket, segmented within the greater Meadowlands Industrial market, which spans Hudson and Bergen Counties, reaching from Hasbrouck Heights to Kearny, and from the Hudson River to Essex County. It is a preferred industrial location that provides quick access to metropolitan New York City. Although the Northern New Jersey metropolitan area encompasses 22 separate markets, the subject most directly competes with five surrounding markets: Newark Industrial, Hudson Waterfront Industrial, Rt. 46/23/3-I Industrial, Central Bergen Industrial and West Essex Industrial. The following map outlines the subject’s location in relation to its competing market areas.
37
FUNDAMENTAL MARKET ANALYSIS
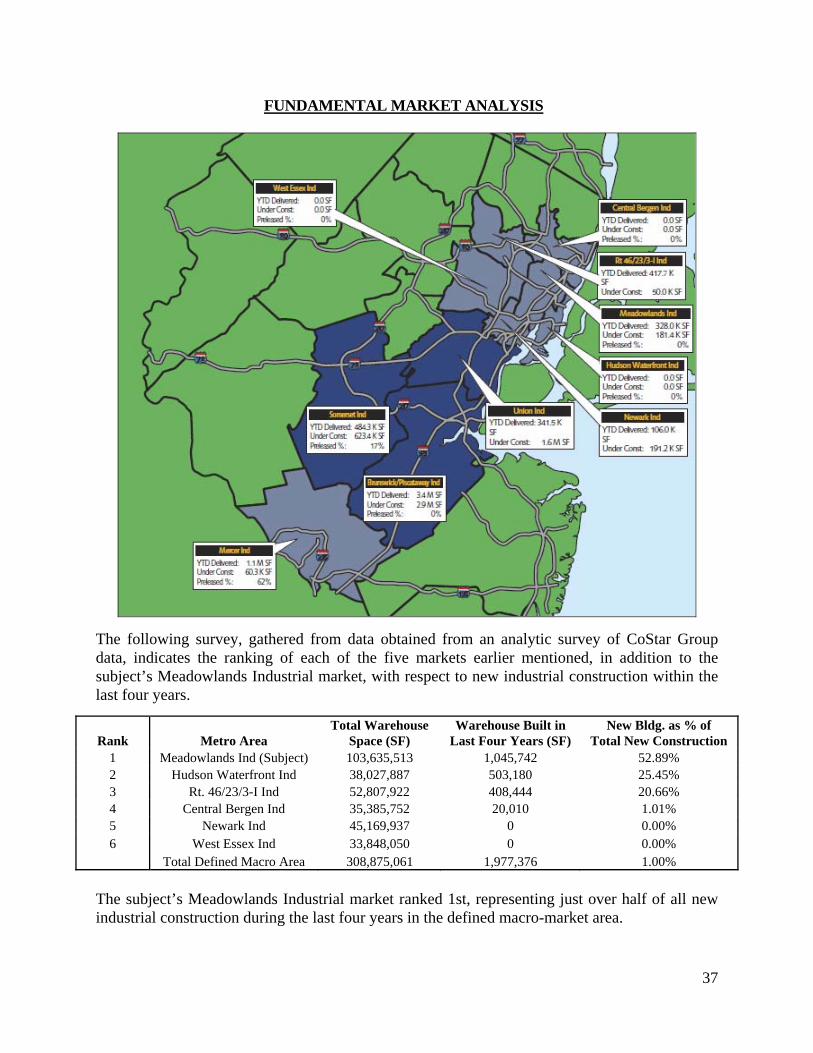
The following survey, gathered from data obtained from an analytic survey of CoStar Group data, indicates the ranking of each of the five markets earlier mentioned, in addition to the subject’s Meadowlands Industrial market, with respect to new industrial construction within the last four years.
Rank Metro Area Total Warehouse
Space (SF) Warehouse Built in
Last Four Years (SF) New Bldg. as % of
Total New Construction 1 Meadowlands Ind (Subject) 103,635,513 1,045,742 52.89% 2 Hudson Waterfront Ind 38,027,887 503,180 25.45% 3 Rt. 46/23/3-I Ind 52,807,922 408,444 20.66% 4 Central Bergen Ind 35,385,752 20,010 1.01% 5 Newark Ind 45,169,937 0 0.00% 6 West Essex Ind 33,848,050 0 0.00% Total Defined Macro Area 308,875,061 1,977,376 1.00%
The subject’s Meadowlands Industrial market ranked 1st, representing just over half of all new industrial construction during the last four years in the defined macro-market area.

38
FUNDAMENTAL MARKET ANALYSIS
Macro-location factors influence urban growth, especially elements preferred for warehouse facilities such as growth trends, development climate, public infrastructure, available land, available labor and quality of life. The six market areas comprising the subject’s macro-market area, ranked in the following chart, are rated based on their competitiveness. Furthermore, it will provide support for the allocation of macro demand and will help determine the subject’s future market penetration and economic demand.
ID# Rating Criteria
Meadowlands Ind
(Subject)
Hudson Waterfront
Ind
Central Bergen
Ind Newark
Ind
Rt. 46/23/3-I
Ind
West Essex
Ind Importance
Factor 1 Travel time to employee housing 3 1 5 3 4 2 10 2 Travel time to executive housing 4 5 3 3 2 1 7 3 Travel time to passenger airport 4 3 1 5 2 3 3
4 Support facilities in the area (hotels, restaurant, office, etc.) 4 5 1 4 2 3 5
5 Most public expenditures in last 5 years (infrastructure) 5 4 2 1 3 1 8
6 Forecast most public expenditures in next 5 years 5 4 2 1 3 1 8
7 Quantity of prestige companies in area 3 5 1 4 1 2 5
8 Area of most new industrial building in last 5 years 5 4 2 1 3 1 14
9 Area forecast to have most employment growth in next 10 years 3 4 2 2 1 3 13
10 Proximity to air freight 4 3 1 5 2 3 11 11 proximity to rail 5 1 2 4 3 2 10 12 Proximity and access to interstate highway 5 3 3 5 2 1 12 13 Current travel time to customers 5 3 3 5 2 1 9 14 Current travel time to vendors 5 3 3 5 2 1 9 15 Expected travel time to customers in 10 years 5 3 3 5 2 1 8 16 Expected travel time to vendors in 10 years 5 3 3 5 2 1 8
17 Area with most land ready for new industrial buildings 2 1 4 2 3 5 4
18 Land cost 2 1 4 2 3 5 2 19 Taxation cost 2 1 4 2 4 3 3 20 Education attainment in area 3 5 4 2 3 1 5 21 Proximity to universities and training schools 3 5 3 4 2 1 6 22 Air/water quality and compliance cost 1 1 2 1 2 2 1 23 Utilities type and capacity in area 5 3 2 4 2 1 9 24 Crime in area 3 2 5 1 4 3 7
Total score 736 563 468 583 427 311 3,088 Percentage of
total score 24% 18% 15% 19% 14% 10% 100%

39
FUNDAMENTAL MARKET ANALYSIS
Micro Location Analysis & Delineation: The subject’s micro location is analyzed in terms of competing submarkets within its greater market area. As stated previously, according to CoStar, the subject is located within the Secaucus/North Bergen Industrial submarket, segmented within the greater Meadowlands Industrial market. There are a total of four submarkets within the Meadowlands Industrial market including Carlstadt/Rutherford Industrial, Lyndhurst/Harrison Industrial, Secaucus/North Bergen Industrial (subject) and Teterboro Airport Industrial. The following maps identify the locations of the submarkets within the subject’s Meadowlands Industrial market.

40
FUNDAMENTAL MARKET ANALYSIS

41
FUNDAMENTAL MARKET ANALYSIS

42
FUNDAMENTAL MARKET ANALYSIS
Similar to the macro-location analysis, these competitive submarkets are also rated by important factors such as access, proximity to vendors, rail, airport, etc. The four submarkets comprising the subject’s micro-market area are ranked on the following chart.
ID# Rating Criteria
Secaucus/ North Bergen Ind
(Subject)
Carlstadt/ Rutherford
Ind
Lyndhurst/ Harrison
Ind
Teterboro Airport
Ind Importance
Factor 1 Travel time to employee housing 2 2 1 3 10 2 Travel time to executive housing 3 1 2 1 7 3 Travel time to passenger airport 1 2 2 3 3
4 Support facilities in the area (hotels, restaurant, office, etc.) 3 2 2 1 5
5 Most public expenditures in last 5 years (infrastructure) 1 2 3 2 8
6 Forecast most public expenditures in next 5 years 2 1 3 2 8
7 Quantity of prestige companies in area 3 2 2 1 5
8 Area of most new industrial building in last 5 years 1 1 3 2 14
9 Area forecast to have most employment growth in next 10 years 2 1 3 2 13
10 Proximity to air freight 2 2 1 3 11 11 proximity to rail 3 2 1 2 10 12 Proximity and access to interstate highway 3 2 2 1 12 13 Current travel time to customers 3 2 1 2 9 14 Current travel time to vendors 3 2 1 2 9 15 Expected travel time to customers in 10 years 3 1 2 2 8 16 Expected travel time to vendors in 10 years 3 1 2 2 8
17 Area with most land ready for new industrial buildings 1 1 3 2 4
18 Land cost 3 2 1 2 2 19 Taxation cost 2 2 2 2 3 20 Education attainment in area 3 2 1 2 5 21 Proximity to universities and training schools 3 2 2 1 6 22 Air/water quality and compliance cost 1 3 1 2 1 23 Utilities type and capacity in area 3 2 1 2 9 24 Crime in area 3 2 1 2 7
Total score 426 293 328 343 1,390 Percentage of
total score 30% 21% 24% 25% 100% Delineation of Property Users: The initial step in identifying possible users of the subject property is to define the pool of tenants who most utilize warehouse/distribution space. Most industrial markets do not have contiguous market areas, but are spread across a broader metropolitan area. Users of industrial facilities such as the subject are driven by national economies and translated to local metropolitan areas, where demand for future space will come from the overall economic expansions of the metro area. The following table illustrates the current employment base and job growth in the subject’s Bergen-Hudson-Passaic MSA since 1997.

43
FUNDAMENTAL MARKET ANALYSIS
Bergen-Hudson-Passaic MSA
Employment by Industry Sector 1997 1998 1999 2000 2001 2002 2003 2004 2005 2006 Natural Res/Mining & Cons 26.8 28.3 29.5 30.3 31.7 33.1 32.1 32.2 31.9 32.1 Manufacturing 120.7 117.6 112.3 108.8 102.8 92.5 86.8 82.4 78.2 72.8 Wholesale Trade 76.7 78.6 78.6 77.6 76.2 71.0 71.5 70.4 70.4 71.2 Retail Trade 104.2 104.8 104.4 106.1 105.4 106 104.9 103.4 102.8 101.6 Trans., Warehouse & Util. 43.3 45.0 46.9 48.1 49.3 47.2 46.8 45.2 44.3 43.4 Information 24.3 25.8 26.2 27.2 27.1 24.8 23.8 23.2 23.9 23.3 Financial Activities 63.3 65.2 68.7 73.3 73.8 72.3 72.3 72.6 73.4 74.5 Prof. & Business Services 129.6 138.5 140.6 142.8 142.7 134.2 134.5 133.6 134.9 133.6 Educ. & Health Service 97.8 102.8 105.0 108.5 113.0 117 120.8 123.5 124.9 127.2 Leisure & Hospitality 50.2 51.7 52.0 52.7 53.6 54.4 57.1 58.2 59.4 60.8 Other Services 35.3 35.6 36.1 37.0 37.1 36.2 36.9 38.3 40.4 40.5 Government 103.1 103.1 104.4 107.7 110.7 113.1 117.6 119.4 120.2 121.4 Total Nonfarm Employment 875.3 897.0 904.7 920.1 923.4 901.8 905.1 902.4 904.7 902.4
Source: Bureau of Labor Statistics (measured in thousands) Of the employment categories outlined above, manufacturing, wholesale trade, transportation/warehouse and utilities, the categories of users most likely to occupy industrial space, represent 187,400 employees or 20.8% of all non-farm employment in the subject’s market area. In terms of growth, employment levels have remained basically stable since 1997, with total employment averaging an increase of only 2,710 jobs or 0.31% annually. Much of northern New Jersey’s growth has come on the strength of, but also at the expense of, New York City. Lower expenses have lured many companies to the MSA, including lower taxes, cheaper real estate, ease of transportation of goods over land and through ports, and the availability of an educated labor force. In order to forecast future demand, my analysis must determine which future number of employees, as outlined in the above-mentioned group of potential users, will constitute the bulk of the demand. The following chart, published by the New Jersey Department of Labor and Workforce Development, forecasts total employment growth in the next 10 years within Bergen, Hudson and Passaic Counties, which make-up the primary employment base of potential future users.
Area name Industry Title 2006 Est.
Employment 2016 Proj.
Employment Employment
Growth
Annual Employment
Growth
Annual Growth Rate Outlook
Bergen County Total Employment, All Jobs 507,900 534,250 26,300 2,630 0.5% Growing Hudson County Total Employment, All Jobs 264,350 277,600 13,300 1,330 0.5% Stable Passaic County Total Employment, All Jobs 201,500 209,400 7,900 790 0.4% Stable
Total 973,750 1,021,250 47,500 4,750 0.49% Stable The forecasts above predict that the previously sluggish job growth seen between1997-2006 is likely to continue during the next decade, although at a slightly increased annual growth rate of 0.49%, compared to 0.31% the previous decade. Thus, the appraiser’s estimated forecast for job growth in the subject’s Bergen-Hudson-Passaic MSA is estimated to be 4,750 per year on average.

44
FUNDAMENTAL MARKET ANALYSIS Demand Analysis and Forecast Current Market Trend Analysis – Inferred Demand: The first step in demand analysis is considering inferred demand indicators. As displayed in the following chart, industrial space in the metropolitan area contained a total inventory of approximately 786 million square feet as of year-end 2006.
Northern and Central New Jersey Industrial Market Year-End 2006
Source: Costar New Jersey has fared better than many other parts of the country in terms of industrial occupancy. A strong housing market, growth in the health care industry and the relocation of many New York firms’ back-office operations to the state have helped New Jersey’s unemployment rate remain below the national average. The New Jersey industrial real estate market reflects the state’s economic health. As of Q4-2006, the overall vacancy rate registered 8.1%, a 0.1% decrease from the 8.2% rate recorded in Q1-2006. Net absorption, an important indicator of new demand calculated as gross absorption minus moveouts, is outlined on the following chart for all industrial space within the metro area.

45
FUNDAMENTAL MARKET ANALYSIS
Source: Costar The metro area saw approximately 3.55 million SF of net absorption within the last year, compared with 3.52 million SF two-years ago, negative 960,140 SF three-years ago and 9.85 million SF four-years ago, when the market experienced its greatest annual demand since 1998. While continued manufacturing job losses are a concern, the outlook is relatively positive. New Jersey remains a desirable warehouse and distribution hub with over 70% of all industrial space in New Jersey comprised of warehouse/distribution space. The Port Authority of New York and New Jersey continue to move forward with its plan to deepen port channels and improve the flow of goods by rail, road and barge. These efforts help the market remain a primary distribution hub and the data points above suggest a strong market for warehouse/distribution facilities. Analyzing inferred demand on a micro-market level, the following chart outlines the inventory, historical vacancy, historical net absorption and square footage under construction within the subject’s Meadowlands Industrial submarket, compared with the Newark Industrial, Hudson Waterfront Industrial, Rt. 46/23/3-I Industrial, Central Bergen Industrial and West Essex Industrial market.
Vacancy
Rate
SF Under Const.
Net Absorption (SF)
Market Total Bldg.
SF 4 Yrs. Ago
3 Yrs. Ago
2 Yrs. Ago
1 Yr. Ago
4 Yrs. Ago
3 Yrs. Ago
2 Yrs. Ago
1 Yr. Ago
Meadowlands Ind (subject) 103,635,513 8.4% 9.1% 8.5% 8.7% 181,440 1,936,010 -839,415 1,830,616 664,266 Newark Ind 45,169,937 5.4% 5.2% 5.4% 5.1% 191,196 1,143,314 -291,729 419,102 -338,667 Hudson Waterfront 38,027,887 7.7% 9.6% 9.8% 10.5% 0 570,702 81,754 -497,431 105,348 R. 46/23/3-I Ind 52,807,922 5.7% 7.2% 7.7% 7.6% 50,000 701,681 -1,013,308 -79,657 258,229 Central Bergen Ind 35,385,752 7.0% 7.9% 6.9% 7.2% 0 -76,585 37,011 114,982 -175,158 West Essex Ind 33,848,050 5.4% 6.1% 5.6% 5.6% 0 -281,186 -75,682 -467,137 362,223

46
FUNDAMENTAL MARKET ANALYSIS
At a vacancy rate of 8.7%, the subject’s Meadowlands Industrial market has the second highest vacancy rate for the defined market area as a whole. The subject market also has the second most square footage under construction at 181,440 SF. The high vacancy rate is a negative sign for demand, although the increased amount of new construction and high net absorption is a positive factor, if the new construction is not a precursor to an oversupply. Forecasting Demand by Fundamental Analysis – Segmentation: The market delineation section previously provided a forecasted future job growth in the subject’s Bergen-Hudson-Passaic MSA of 0.49% annually, up from 0.31% annual growth the previous decade. Of this growth, wholesale trade, the category of user most likely to occupy industrial space, represents 187,400 employees or 20.8% of all non-farm employment in the subject’s market area. Based on these projections, the following chart provides a complete demand forecast by the segmentation method of analysis.
Line Forecast New Demand Current
year End Year 1 Year 2 Year 3 Year 4 Year 5 Comment/Source 1 Total employment in MSA 973,750 978,500 983,250 988,000 992,750 997,500 Source: NJ Dept. of Labor
2
Forecast yearly increase of new employment (all categories) in MSA 4,500 4,500 4,500 4,500 4,500 Source: NJ Dept. of Labor
3
Percentage employment in warehousing and wholesale trade 20.8% 20.8% 20.8% 20.8% 20.8% 20.8%
Source: Bureau of Labor Statistics
4 Estimated warehouse and wholesale employment 202,540 203,528 204,516 205,504 206,492 207,480 Calculation Line 1 X 3
5 Average SF per employee 1,245 1,245 1,245 1,245 1,245 1,245 Gruen, Gruen & Associates
Survey
6 Total occupied demand for warehouse/distribution space 252,162,300 253,392,360 254,622,420 255,852,480 257,082,540 258,312,600 Calculation Line 4 X 5
Forecasting Demand by Fundamental Analysis – Ratio Method: Another method of fundamental analysis for forecasting demand, known as the ratio method, is useful when local data on occupied industrial space is available and the future employment mix in the area is expected to remain stable. The first step in the ratio method is to divide the square footage of industrial space in the subject’s market area by the total number of jobs within the market area, resulting in the total SF of space per job. This calculation is outlined below.
Total Industrial
Building Area (SF) % Vacant Estimated
Occupied Space Total Jobs
SF of Space Per Job
Current Bergen-Hudson-Passaic MSA 259,591,684* 7.8% 239,245,609 973,750 245.7
Three Years Ago Bergen-Hudson-Passaic MSA 257,860,317* 7.2% 239,268,247 923,400 259.1
*Combination of Central Bergen, Hudson Waterfront, Meadowlands, Northern Bergen, NW Frontier and Rt. 46/23/3-I markets, delineated by CoStar, estimated to encompass the Bergen-Hudson-Passaic geographic MSA
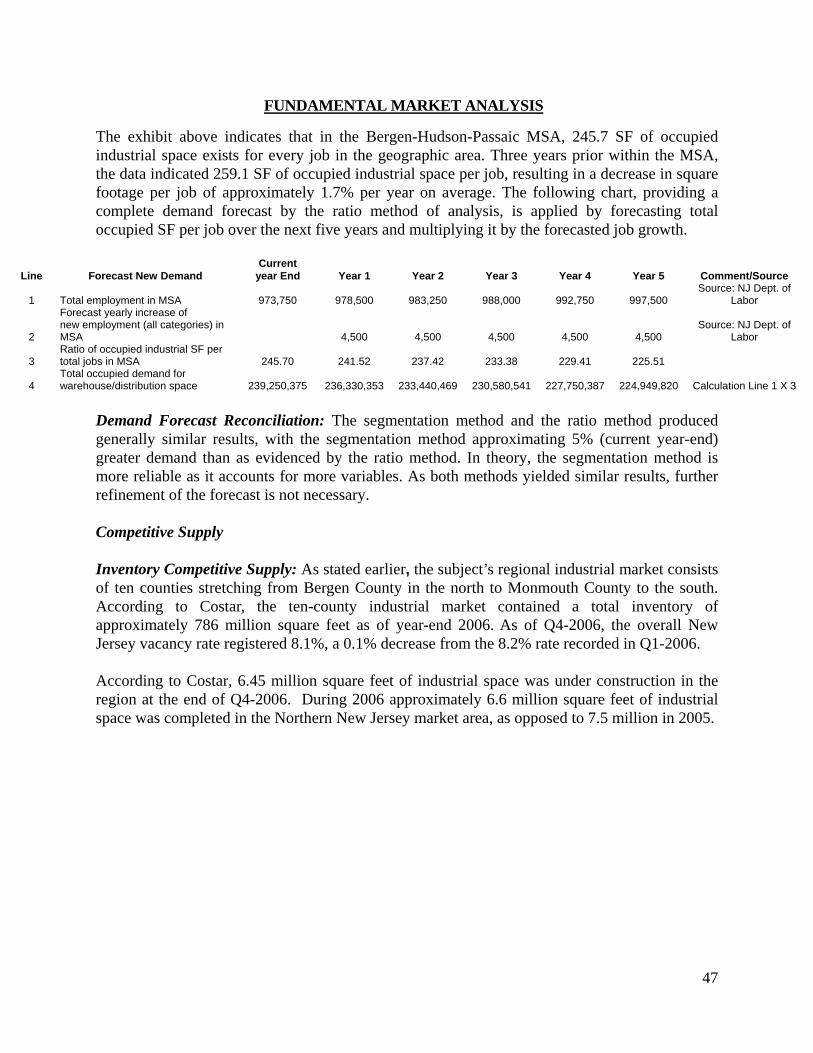
47
FUNDAMENTAL MARKET ANALYSIS
The exhibit above indicates that in the Bergen-Hudson-Passaic MSA, 245.7 SF of occupied industrial space exists for every job in the geographic area. Three years prior within the MSA, the data indicated 259.1 SF of occupied industrial space per job, resulting in a decrease in square footage per job of approximately 1.7% per year on average. The following chart, providing a complete demand forecast by the ratio method of analysis, is applied by forecasting total occupied SF per job over the next five years and multiplying it by the forecasted job growth.
Line Forecast New Demand Current
year End Year 1 Year 2 Year 3 Year 4 Year 5 Comment/Source
1 Total employment in MSA 973,750 978,500 983,250 988,000 992,750 997,500 Source: NJ Dept. of
Labor
2
Forecast yearly increase of new employment (all categories) in MSA 4,500 4,500 4,500 4,500 4,500
Source: NJ Dept. of Labor
3 Ratio of occupied industrial SF per total jobs in MSA 245.70 241.52 237.42 233.38 229.41 225.51
4 Total occupied demand for warehouse/distribution space 239,250,375 236,330,353 233,440,469 230,580,541 227,750,387 224,949,820 Calculation Line 1 X 3
Demand Forecast Reconciliation: The segmentation method and the ratio method produced generally similar results, with the segmentation method approximating 5% (current year-end) greater demand than as evidenced by the ratio method. In theory, the segmentation method is more reliable as it accounts for more variables. As both methods yielded similar results, further refinement of the forecast is not necessary. Competitive Supply Inventory Competitive Supply: As stated earlier, the subject’s regional industrial market consists of ten counties stretching from Bergen County in the north to Monmouth County to the south. According to Costar, the ten-county industrial market contained a total inventory of approximately 786 million square feet as of year-end 2006. As of Q4-2006, the overall New Jersey vacancy rate registered 8.1%, a 0.1% decrease from the 8.2% rate recorded in Q1-2006. According to Costar, 6.45 million square feet of industrial space was under construction in the region at the end of Q4-2006. During 2006 approximately 6.6 million square feet of industrial space was completed in the Northern New Jersey market area, as opposed to 7.5 million in 2005.

48
FUNDAMENTAL MARKET ANALYSIS
Northern and Central, NJ Industrial Construction Activity Q4-2006
Source: Costar The subject property is located in the Meadowlands Industrial submarket, which spans Hudson and Bergen Counties, reaching from Hasbrouck Heights to Kearny, and from the Hudson River to Essex County. It is a preferred location that provides quick access to metropolitan New York. According to Costar, the Meadowlands Industrial market had an industrial inventory of about 103.6 million square feet as of year-end 2006. The total vacancy rate is estimated at 7.7%, down from 8.0% as of year-end 2005. The current vacancy rate is the lowest it’s been in the past four years.
Meadowlands Industrial Market Year-End 2006
Source: Costar

49
FUNDAMENTAL MARKET ANALYSIS
Leasing and sales activity in the Meadowlands has remained strong since 1994 with over four million square feet of activity each year since 1996. The Meadowlands region recorded strong leasing activity of 3.7 million square feet, through the first three quarters of 2006, according to Cushman & Wakefield, accounting for about 18% of total leases in Northern & Central New Jersey. The largest lease occurred in Secaucus, where distribution company Worldwide Distribution leased 414,417 square feet at 1000 New County Road. Other large leases included Children’s Place leasing 245,200 square feet at 2 Emerson Lane in Secaucus, and Party Rental, leasing 230,728 square feet at 275 North Street in Teterboro. Sales activity has been very strong, registering over 500,000 square feet more than in third-quarter 2005. The largest sale-to-date was RREEF’s acquisition of the former Ford Motor Company site at 698 Route 46 West in Teterboro, totaling 606,800 square feet. A breakdown of market leasing and sales activity from 1995 through Q3-2006, within the Meadowlands, is shown in the following below.
Source: Cushman & Wakefield The following table illustrates average asking rents, segmented by industrial space type, in the Meadowlands (reported by Cushman & Wakefield).
Meadowland Industrial Leasing & Sales Activity
5.10
6.16
5.31
4.89
7.73
6.91
6.83
4.815.
20
6.90
6.80
3.92
0.0
3.0
6.0
9.0
1995 1996 1997 1998 1999 2000 2001 2002 2003 2004 2005 3Q06
SF in
Milli
ons

50
FUNDAMENTAL MARKET ANALYSIS
Source: Cushman & Wakefield
According to Cushman & Wakefield as of Q3-2006, the weighted average net asking warehouse rental rate in the Meadowlands was $7.00/SF. This rent remained basically unchanged from the year-end 2005 asking rent of $7.01/SF. My own survey of active industrial brokers in the Meadowlands, including representatives of the area’s largest landlord, Hartz Mountain, indicated that while asking rents have remained firm for the most part, actual deals were being done at rent levels that are no higher than last year, and in most cases, rents are off about 5% from 2005. The following table illustrates historic industrial availabilities in the Meadowlands by space type. As the table illustrates, there was 4.9 million square feet of warehouse space available as of Q3-2006.
Meadowlands Inustrial Direct Average Asking Rents by Space Type
$7.00
$9.35$7.01
$6.52$6.51$6.41$6.86$6.48
$5.84$5.53$5.09$4.99$4.77
$5.05$5.56$5.54$5.42
$7.17
$4.95$6.48
$6.00$3.74$4.49$4.02
$3.28
$8.99$8.72
$10.53$11.90
$14.08
$11.39
$7.24$6.74$8.10
$6.87$6.97
$0.00
$4.00
$8.00
$12.00
$16.00
1995 1996 1997 1998 1999 2000 2001 2002 2003 2004 2005 3Q06
$/SF
W/D Manufacturing HT/Flex

51
FUNDAMENTAL MARKET ANALYSIS
Source: Cushman & Wakefield
Note that Cushman & Wakefield tracks an industrial inventory of approximately 76.3 million square feet with an estimated overall vacancy rate of 7.6% as of Q3-2006. Conversely, Costar tracks an inventory of 103.6 million square feet as of year-end 2006 with a similar overall vacancy rate estimated at 7.7%. Forecasting New Construction – Historical Comparison Method: In order to forecast new building construction, a general inference of market demand based on marginal demand can be made in order to gauge the strength of the market. During the last three years, 1,452,970 square feet of industrial space was built in the MSA (loosely defined as the Central Bergen, Hudson Waterfront, Meadowlands, Northern Bergen, NW Frontier and Rt. 46/23/3-I markets), translating to 363,242 SF per year on average. As stated earlier, employment in the MSA grew by 2,710 new jobs per year on average over the last 10 years, although annual new job growth was forecasted at 4,750, or 75% more jobs, over the next 10 years. If new construction responds accordingly, there will be 75% more newly constructed SF, or 2,542,698 SF during the next four years, or 635,674 SF per year on average. Market Equilibrium/Disequilibrium – Marginal Demand: To facilitate forecasting future demand for industrial space in the market, marginal demand must be analyzed by comparing data on existing and future competitive supply with the estimates of current and anticipated demand. Marginal demand exists when demand remains after all available space in the market is subtracted from the projected demand for space. The second consideration is how long it will take to absorb all existing and under construction SF in the market. The following tables show the segmentation method and ratio method for forecasting demand for industrial space.
Meadowlands Industrial Historical Available Space by Space Type
6,65
2,65
8
4,88
4,29
4
1,15
8,31
6
792,
846
300,
330
448,
896
311,
426
193,
158
115,
133
51,9
00
140,
726
181,
393
343,
693
513,
653
99,3
40
293,
743
271,
276
93,7
26
66,5
37
344,
912
241,
545
576,
952
290,
727
595,
763
521,
819
484,
533
6,78
9,91
8
5,55
3,22
6
6,12
4,20
7
4,34
3,50
9
4,03
1,33
6
5,86
1,05
7
4,75
5,03
8
6,92
7,78
3
8,69
9,33
9
9,01
6,62
1
0
2,500,000
5,000,000
7,500,000
10,000,000
1995 1996 1997 1998 1999 2000 2001 2002 2003 2004 2005 3Q06
SF
Ava
ilabl
e
W/D MF HT

52
FUNDAMENTAL MARKET ANALYSIS
Line Forecast New Demand Current year End Year 1 Year 2 Year 3 Year 4 Year 5 1 Total employment in MSA 973,750 978,500 983,250 988,000 992,750 997,500
2 Forecast yearly increase of new
employment (all categories) in MSA 4,500 4,500 4,500 4,500 4,500
3
Percentage employment in manufacturing,
warehousing, transportation and wholesale trade 20.8% 20.8% 20.8% 20.8% 20.8% 20.8%
4 Estimated warehouse
and wholesale employment 202,540 203,528 204,516 205,504 206,492 207,480 5 Average SF per employee 1,245 1,245 1,245 1,245 1,245 1,245
6 Total occupied demand
for warehouse/distribution space 252,162,300 253,392,360 254,622,420 255,852,480 257,082,540 258,312,600 Competition Analysis 7 Total existing industrial space 259,591,684 259,905,474 260,541,148 261,176,822 261,812,496 262,448,170
8 Current space under construction in MSA 313,790
9 Planned new space 635,674 635,674 635,674 635,674 635,674 Residual Demand Analysis
10 Estimated year-end
vacant space in MSA 7,429,384 6,513,114 5,918,728 5,324,342 4,729,956 4,135,570
11 Estimated vacancy rate via
segmentation method 2.9% 2.5% 2.3% 2.0% 1.8% 1.6%
Line Forecast New Demand Current year End Year 1 Year 2 Year 3 Year 4 Year 5 1 Total employment in MSA 973,750 978,500 983,250 988,000 992,750 997,500
2 Forecast yearly increase of
new employment (all categories) in MSA 4,500 4,500 4,500 4,500 4,500
3 Ratio of occupied industrial
SF per total jobs in MSA 245.70 241.52 237.42 233.38 229.41 225.51
4 Total occupied demand
for warehouse/distribution space 239,250,375 236,330,353 233,440,469 230,580,541 227,750,387 224,949,820 Competitive Analysis 5 Total existing industrial space 259,591,684 259,905,474 260,541,148 261,176,822 261,812,496 262,448,170 6 Current space under construction in MSA 313,790 7 Planned new space 635,674 635,674 635,674 635,674 635,674 8 Residual Demand Analysis 9 Estimated year-end vacant space in MSA 20,341,309 23,575,121 27,100,679 30,596,281 34,062,109 37,498,350 Estimated vacancy rate via ratio 7.8% 9.1% 10.4% 11.7% 13.0% 14.3%
Marginal Demand Reconciliation: Both the Segmentation and Ratio methods show the market to be oversupplied over the next few years, although the ratio method appears most in-line with current year-end vacancy statistics and more representative of current market conditions. The forecasted oversupply to the market should result in increased competition for tenants, exerting downward pressure on rental rates. Market-wide vacancies should remain between 8%-12% over the next three years.

53
FUNDAMENTAL MARKET ANALYSIS
Market Penetration Forecast – Inferred Method: Growth trends in the subject’s Meadowland’s Industrial submarket are positive, as evidenced by a year-to-date 664,266 SF positive net absorption and an 181,440 SF under construction, however, market vacancies in the 8%-12% range are forecasted for the next few years. In contrast, the subject property rating was above average in comparison to other submarkets within its competitive node, tempering drops in future rent and occupancies in contrast to lower rated areas. Market Penetration Forecast – Capture Rate: The first step in this analysis is to establish the current and future capture rate for the subject’s Meadowlands Industrial market illustrated in the charts below.
Metro Area Total Warehouse
Space (SF) Warehouse Built in
Last Four years (SF) New Bldg. as % of
Total New Construction Meadowlands Ind (Subject) 103,635,513 1,045,742 52.89%
Hudson Waterfront Ind 38,027,887 503,180 25.45% Rt. 46/23/3-I Ind 52,807,922 408,444 20.66%
Central Bergen Ind 35,385,752 20,010 1.01% Newark Ind 45,169,937 0 0.00%
West Essex Ind 33,848,050 0 0.00% Total Defined Macro Area 308,875,061 1,977,376 1.00%
Method Capture Rate Comment Percentage of new building in Meadowlands Industrial in last 4 years 53.00%
Current capture rate for Meadowlands Industrial 39.00% Occupied space / Total current occupied demand
(avg. of segmentation & ratio methods) Capture rate for Meadowlands Industrial by rank score 24.00% Macro market competitiveness chart Average capture rate for Meadowlands Industrial 39.00% Average of above three capture indications
After projecting the current capture rate, which was calculated at 39% by reconciling the three methods of forecasting current demand, the next step is to apply the Meadowlands Industrial area capture rate to the Bergen-Hudson-Passaic MSA’s (Central Bergen, Hudson Waterfront, Meadowlands Industrial, Northern Bergen, NW Frontier and Rt. 46/23/3-I markets, delineated by CoStar and estimated to encompass the Bergen-Hudson-Passaic geographic MSA) total demand estimates discussed previously. The following chart displays this analysis, in which the outlook for the Meadowlands Industrial market shows stability as the area should continue to have moderate vacancy, due in part to limited new construction (1 building totaling 181,440 SF).

54
FUNDAMENTAL MARKET ANALYSIS
Line Forecast New Demand
Current year end Year 1 Year 2 Year 3 Year 4 Year 5 Comment/Source
1 Total occupied
demand in MSA 245,706,338 245,711,088 245,715,838 245,720,588 245,725,338 245,730,088 Avg. of Segmentation
and Ratio Methods
2 Meadowlands Industrial
capture rate 39% 39% 39% 39% 39% 39%
3 Meadowlands Industrial total occupied demand 95,825,472 95,827,324 95,829,177 95,831,029 95,832,882 95,834,734
4
Current industrial space in Meadowlands Industrial
area 103,635,513 103,635,513 103,816,953 103,969,515 104,122,077 104,274,639
5 Expected opening of space under construction/forecast 181,440 152,562 152,562 152,562 152,562
6 Total industrial space in
Meadowlands Industrial area 103,635,513 103,816,953 103,969,515 104,122,077 104,274,639 104,427,201
Location rating of 24% forecasted new
construction
7 Residual demand
for industrial space -7,810,041 -7,989,629 -8,140,338 -8,291,048 -8,441,757 -8,592,467
8
Indicated percentage occupied for Meadowlands Industrial
area 92.5% 92.3% 92.2% 92.0% 91.9% 91.8% Subject Capture Rate – Pro Rata Share Analysis: The property being appraised consists of a 146,342-square-foot single-story, single-tenant industrial warehouse vacant as of the date of value. If the subject were 100% occupied, based on the current 95,704,937 SF of occupied industrial space in the Meadowlands Industrial market, the subject’s current capture rate would be 0.153% (146,342/95,704,937). The Meadowlands Industrial market has 1,457 separate industrial buildings, resulting in an average size of 71,129 SF. The subject is 146,342 SF, or 2.06 times as big as the average building. The subject pro rata share on a building basis is 0.07% (1/1,457), although the subject is 2.06 times larger, thus the pro rata share, adjusted upwards 2.06, results in an indicated pro rata share capture rate of 0.14%. The pro rata share method as outlined above assumes that all buildings are equal. The general locations are similar, all being within the Meadowlands Industrial market, although each will vary slightly by submarket, site location, building design, functionality and condition.
The following chart illustrates the subject pro rata share analysis, with adjustments based on property and micro-location ratings outlined previously.
Line Forecast New Demand Current Year
End Year 1 Year 2 Year 3 Year 4 Year 5
1 Current industrial space in Meadowlands Industrial area 103,635,513 103,640,263 103,821,703 103,974,265 104,126,827 104,279,389
2 Expected opening of space under construction/forecast 181,440 152,562 152,562 152,562 152,562
3 Total industrial space in Meadowlands Industrial area 103,635,513 103,821,703 103,974,265 104,126,827 104,279,389 104,431,951
4 Subject size 146,342 146,342 146,342 146,342 146,342 146,342 5 Subject pro rata share 0.141% 0.141% 0.141% 0.141% 0.140% 0.140%
6 Less/Add: property rating adjustment (above/below avg.) -1% -1% -1% -1% -1% -1%
7 Less/Add: micro-location rating adjustment (above/below avg.) 7% 7% 7% 7% 7% 7%
8 Subject adjusted capture rate 0.149% 0.149% 0.149% 0.149% 0.148% 0.148%

55
FUNDAMENTAL MARKET ANALYSIS
Subject Capture Reconciliation: The rating and pro rata share methods yielded results similar to the current capture rate. As such, the current capture rate is given most weight because it reflects how the current market actually rates the subject. This capture rate is adjusted moderately for the changing pro rata share as new construction delivers to the market. The following exhibit displays the results of applying this capture rate to the forecasted demand.
Line Forecast New Demand Current Year
End Year 1 Year 2 Year 3 Year 4 Year 5
1 Total occupied demand in MSA 245,706,338 245,711,088 245,715,838 245,720,588 245,725,338 245,730,088
2 Meadowlands Industrial capture rate 39% 39% 39% 39% 39% 39%
3 Meadowlands Industrial total occupied demand 95,825,472 95,827,324 95,829,177 95,831,029 95,832,882 95,834,734
4 Subject capture rate 0.149% 0.149% 0.149% 0.149% 0.148% 0.148%
5 Estimated subject market occupancy 142,780 142,783 142,785 142,788 141,833 141,835
6 Size of subject 146,342 146,342 146,342 146,342 146,342 146,342
7 Estimated subject market occupancy rate 97.6% 97.6% 97.6% 97.6% 96.9% 96.9% Summary and Conclusion The long term outlook for the Meadowlands and Hudson County industrial markets are positive based on their strategic location, along with the State Government's efforts in providing incentives to bring industry back to New Jersey. It is my opinion that market rents generally declined during 2006, while market values increased due to easy credit and demand for well located properties by institutional investors. On a short-term basis, it is my opinion property values can be expected to remain stable. The subject, as a vacant building, would be well-suited for purchase by an owner/user, where significant demand currently exists.

56
HIGHEST AND BEST USE
Highest and best use may be defined as: "That reasonably probable and legal use of vacant land or an improved property, which is physically possible, appropriately supported, financially feasible, and that results in the highest value."1 In arriving at the highest and best use of the subject property, it was necessary to carefully examine the area in which the property is located and the actions of the market, past, present and future. The highest and best use of a property generally sets the parameter within which that property is valued or evaluated. In order for the subject site to fulfill it’s highest and best use, that use must meet four criteria. It must be: (1) physically possible, (2) legally permissible, (3) financially feasible and (4) maximally productive. The tests of legal permissibility and physical possibility can occur in either order but these two must occur before proceeding to the remaining tests Highest and Best Use – As Though Vacant Legally Permissible: The primary legal restraint on the subject property is related to its zoning. The subject is situated within the zoning jurisdiction of the Hackensack Meadowlands Development Commission, situated in a Light Industrial and Distribution A zone, permitting a wide variety of light industrial, warehouse and office uses, light public utility uses, child care centers, self-storage facilities, business services and Class A recycling facilities. Conditionally permitted uses include automobile service stations, governmental uses, heavy public utility uses, helistops, hotels and motels, restaurants, retail uses, radio, television and microwave transmission towers, hospitals, clinics, medical facilities, indoor recreation, auto maintenance facilities and social service uses. The maximum permitted floor area ratio is 2.5 and maximum lot coverage is 50%. Physically Possible: The size, shape, location, utility, availability and terrain impose physical restraints upon the type of uses possible for the subject property. Any use incompatible with the utility, capacity, or constraints imposed by the size, shape or terrain is not physically possible. The subject site has basically level topography and is rectangular in shape (487.29’ x 600’), with 487.29 feet of road frontage with good access to area highways. The site area is 6.712+ acres. The site has good road access, visibility and is connected to all necessary public utilities. No obvious adverse subsoil conditions were observed.
1The Appraisal of Real Estate, Tenth Edition, Appraisal Institute, 1992. Page 45.

57
HIGHEST AND BEST USE
According to the National Flood Insurance Program Flood Insurance Rate Map, Community Panel Number 340226B, dated March 25, 1983, the property is situated in a non-flood hazard zone “C”, which has no detrimental effect on the usability of the site. According to Appraising Industrial Properties, the typical land to building ratio for industrial properties is between 2.5 and 3.5.2 Based on a land area of 6.712 acres or 292,375 square feet, an ideal industrial property would contain 84,000 to 117,000 square feet. The Urban Land Institute’s Guide to Classifying Industrial Property indicates light industrial buildings have an average building site coverage of 40% or less.3 A building site coverage of 40% yields approximately an 117,000 square foot building on the subject land. If the site were vacant it could be developed with a wide variety of property types. The current zoning permits a maximum lot area coverage of 50%. Based on a 50% limit on building area, the current zoning permits a building of the subject’s size of 146,342 square feet. Financially Feasible: The cost of the land limits the uses that are financially feasible for a site. Any use of the subject site that provides a financial return to the land in excess of the cost of the land and the amortized cost of capital is financially feasible. As discussed, the permissible uses by right include a wide variety of light industrial uses, warehouse uses, office uses, light public utility uses, child care centers, self-storage facilities, business services uses and Class A recycling facilities. There are few, if any, residential, retail, office and hospitality uses in the subject’s neighborhood, and such would not conform to the area, which is an exclusive industrial neighborhood. As previously discussed, the Meadowlands Industrial market contains 103.64 million square feet, with a vacancy rate of 7.7%. The average asking rent is $6.69, triple net, as displayed in the market analysis section. At present, there is no alternative use for the subject site or improvements that would warrant demolition or major reconfiguration of the existing improvements. Due to the industrial nature of the neighborhood, if the site were vacant, development to the highest density with a light industrial warehouse building would be the likely development type. Below, I have estimated the time period until new development, based on a build-out of the site to the maximum allowed under the zoning, becomes feasible.
2 The Appraisal Institute, Appraising Industrial Properties, 29. 3 The Urban Land Institute, Guide to Classifying Industrial Property, 2nd ed., 40.

58
HIGHEST AND BEST USE
*Includes Entrepreneurial Incentive As shown, based on the analysis above, development to the maximum FAR could be financially feasible within 15 years.
Maximally Productive: Taking all of the aforementioned factors into consideration, based on the preceding feasibility study, the highest and best use as if vacant is to hold the site for development until the ideal improvement (determined to be a similar industrial building developed to the highest allowable density) becomes financially feasible.
Highest and Best Use – As Though Vacant
Based on the above, it is my opinion that the highest and best use of the site, as though vacant, is to hold vacant for industrial development.
Highest and Best Use – As Improved
The analysis indicated the highest and best use as improved was for the continuation of its current use as a warehouse industrial building. The subject is currently vacant, however, the overall warehouse industrial vacancy rate in the Meadowlands submarket is just 7.4% and a tenant will probably be found for the subject within a period of six to 12 months. There is strong demand from investors and owner users. The highest and best use of the property as improved is concluded to be continued warehouse industrial use.

59
COST APPROACH
The employment of the cost approach in the valuation process is based on the principle of substitution. The principle may be stated as follows: "No one is justified in paying more for a property than that amount by which he can obtain,
by purchase of a site and construction of a building, without undue delay, a property of equal desirability and utility. In the case of a building that is new, the disadvantages of deficiencies of the existing building are compared with a new building that must be evaluated."
The cost approach typically consists of four steps: 1. The estimate of the land's value as though vacant. 2. The estimate of the current cost of replacing the existing improvements. 3. The estimate and deduction of depreciation from all causes, if applicable. 4. The addition of the value of the land and the depreciated value of the improvements. Replacement cost is defined as the cost of creating a similar building or improvement on the basis of current price using modern materials. As determined in the highest and best use analysis, the highest and best use as vacant is currently for industrial use. The ideal improvement is for an industrial use building maximizing the development potential of the site, with development occurring as market conditions permit. To arrive at an estimated land value for the subject site, the appraiser analyzed actual sales of comparable industrial properties in the subject’s Hackensack Meadowlands District. The sales presented are considered to have the highest degree of comparability to the subject of the recent sales in the market, and provide a strong basis for my value conclusion. A typical market oriented unit of comparison for commercial properties of this type, within this area, is price per square foot of maximum buildable site coverage area, as industrial properties are typically built to a single level (unlike office properties built vertically to a maximum SF-FAR), maximizing ceiling height for ideal warehousing capacity. The comparable sales demonstrate a range in unadjusted unit prices between approximately $7.89 and $36.25 per square foot of buildable area. Following is a discussion of each land sale and the appropriate adjustments applied to each in comparison to the subject.

60
COST APPROACH
Comparable Industrial Land Sale 1
Location: 10 Caesar Place Moonachie, New Jersey
Parcel: 37-00063.00-00005.00 Grantor: Martin Rappaport Grantee: LPS Industries Sale Price: $2,375,000 Sale Date: July 27, 2006 Recorded: 9123-0528 Financing: Cash to seller Site Area: 448,668 Square feet Frontage/Depth: 913 Feet on Caesar Place
535 Feet on W Commercial Avenue Description: A corner, rectangular development site located
on the east side of Caesar Place in the Borough of Moonachie, Bergen County, New Jersey. The site is located just south of Teterboro Airport. All utilities are available to the site, which is improved with a two-story industrial warehouse building to be razed.
Zoning: LI–B Light Industrial Buildable Area: Maximum 50% of total land area
224,334 Square feet Price/SF Buildable Area $10.59 Price/SF Land Area $5.29

61
COST APPROACH
Comparable Industrial Land Sale 1 10 Caesar Place

62
COST APPROACH
Comparable Industrial Land Sale 2
Location: 310 Secaucus Road Secaucus, New Jersey
Parcel: 09-00062.00-00013.00 Grantor: Burnt Tavern II, LP Grantee: Cinelli Iron and Metal Co. Sale Price: $1,582,500 Sale Date: March 30, 2005 Recorded: HDC-64841 Financing: Cash to seller Site Area: 165,354 Square feet Frontage/Depth: 200 Feet on Secaucus Road Description: A midblock, rectangular development site
located on the east side of Secaucus Road in the town of Secaucus, Hudson County, New Jersey. The previously improved site was acquired by an owner/user for development of a steel and metal recycling complex. The lot has all utilities available to the site.
Zoning: HI Heavy Industrial Buildable Area: Maximum 50% of total land area
82,677 Square feet Price/SF Buildable Area $19.14 Price/SF Land Area $9.57

63
COST APPROACH
Comparable Industrial Land Sale 2 310 Secaucus Drive

64
COST APPROACH
Comparable Industrial Land Sale 3
Location: 230 Secaucus Road Secaucus, New Jersey
Parcel: 09-00062-0000-00003-0002-H-000M Grantor: Choice Property Management LLC Grantee: John Sherger LLC Sale Price: $1,500,000 Sale Date: October 4, 2006 Recorded: 8058-0224 Financing: Cash to seller Site Area: 82,764 Square feet Frontage/Depth: 280 Feet on Secaucus Drive Description: A midblock, rectangular development site
located on the east side of Secaucus Road in the town of Secaucus, Hudson County, New Jersey. All utilities are available to the site.
Zoning: HI Heavy Industrial Buildable Area: Maximum 50% of total land area
41,382 Square feet Price/SF Buildable Area $36.25 Price/SF Land Area $18.12

65
COST APPROACH
Comparable Industrial Land Sale 3 230 Secaucus Drive

66
COST APPROACH
Comparable Industrial Land Sale 4
Location: 700 & 900 Penhorn Avenue Secaucus, New Jersey
Parcel: 09-00046.00-00001.00-H-000M 09-00046.00-00002.01-H-000M
Grantor: Mend Realty Corp Grantee: Sinai Associates, Inc. Sale Price: $1,575,000 Sale Date: January 10, 2005 Recorded: 7458-0261 Financing: Cash to seller Site Area: 399,480 Square feet Frontage/Depth: 851 Feet on Penhorn Avenue Description: A midblock, irregular development site located
on the east side of Penhorn Avenue (secondary access road) in the town of Secaucus, Hudson County, New Jersey. The site represents raw land bounded on two sides by Penhorn Creek, placing the site within a high flood risk zone. The site has limited access/frontage.
Zoning: LI-B Light Industrial Buildable Area: Maximum 50% of total land area
199,740 Square feet Price/SF Buildable Area $7.89 Price/SF Land Area $3.94

67
COST APPROACH
Comparable Industrial Land Sale 4 700 & 900 Penhorn Drive

68
COST APPROACH
Comparable Industrial Land Sale 5 Location: County Road
Jersey City, New Jersey Parcel: 06-01002.00-00002.00
06-01100.00-00001.00 06-01101.00-00001.00
Grantor: Southern Region Industrial Realty, Inc Grantee: Rock Hudson, LLC (Rockefeller Group Development Corp.) Sale Price: $15,273,720 Sale Date: December 28, 2005 Recorded: 7793-0145 Financing: Cash to seller Site Area: 1,722,188 Square feet Frontage/Depth: 1,418 Feet on County Road Description: A large raw vacant irregular development site located on the
east side of County Road in Jersey City, Hudson County, New Jersey, at the border of Jersey City and Secaucus. The site was acquired with intentions to develop a complex identified as the “Meadowlands Industrial Park”. The buyer is pursuing Foreign Trade Zone status for the site.
Zoning: IB Intermodel B Buildable Area: Maximum 40% of total land area
688,875 Square feet Price/SF Buildable Area $22.17 Price/SF Land Area $8.87

69
COST APPROACH
Comparable Industrial Land Sale 5 County Road

70
COST APPROACH
Land Sale Comparables Map

71
COST APPROACH Comparable Land Sale Summary:
# Location Sale Date Price Zoning Site Size (SF)
Maximum Buildable Area
(SF)
$/SF Buildable Area
$/SF Site Area
1 10 Caesar Place 7/27/06 $2,375,000 LI-B 448,668 224,334 $10.59 $5.29 2 310 Secaucus Road 3/30/05 $1,582,500 HI 165,354 82,677 $19.14 $9.57 3 230 Secaucus Road 10/4/06 $1,500,000 HI 82,764 41,382 $36.25 $18.12
4 700 & 900 Penhorn Avenue
1/10/05
$1,575,000
LI-B
399,480
199,740
$7.89
$3.94
5 County Road 12/28/05 $15,273,720 IB 1,722,188 688,875 $22.17 $8.87 All of the sales represent the fee simple interest in development sites in Northern New Jersey, and specifically, within the subject’s Hackensack Meadowlands District, overseen by the New Jersey Meadowlands Commission. The price-per developable square foot for the comparables ranges from $7.89 to $36.25, before adjustment. The comparables are adjusted as follows: Property Rights Conveyed: To the best of my knowledge, none of these sales were encumbered with any adverse easements, conditions, or deed restrictions. Each of the sales represents the fee simple interest in the site. No adjustments for property rights are required. Financing: All of the sales represent cash paid to the seller. No non-market oriented financing terms were associated with any of the sales, requiring no adjustments. Conditions of Sale: All of the sales represent normal conditions of sale. All of the sales were exposed to the market and are arms-length transactions. No adjustments are required. Market Conditions: All of the sales have occurred within approximately the last two years. Those sales closed in 2005 have been adjusted upward to account for appreciation in industrial land values. After consideration of the above-cited factors, I have analyzed the sales relative to the subject property with regard to the primary adjustment criteria. In this instance, adjustments were considered for the following factors:
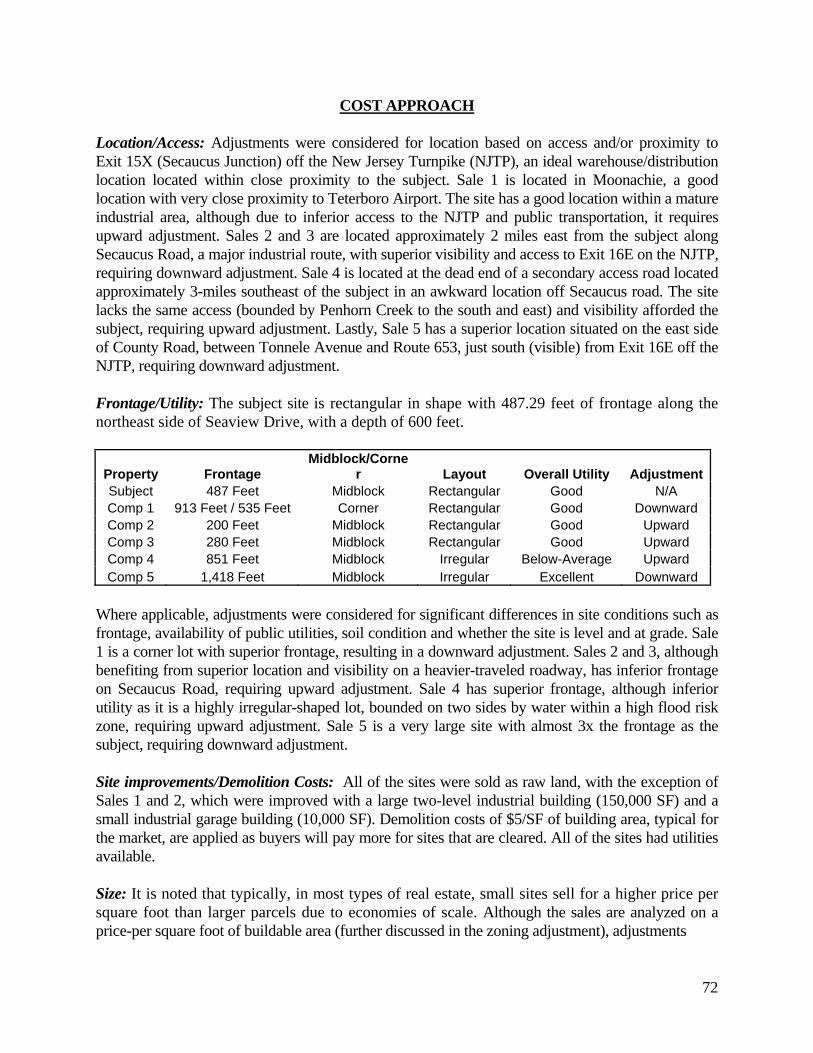
72
COST APPROACH Location/Access: Adjustments were considered for location based on access and/or proximity to Exit 15X (Secaucus Junction) off the New Jersey Turnpike (NJTP), an ideal warehouse/distribution location located within close proximity to the subject. Sale 1 is located in Moonachie, a good location with very close proximity to Teterboro Airport. The site has a good location within a mature industrial area, although due to inferior access to the NJTP and public transportation, it requires upward adjustment. Sales 2 and 3 are located approximately 2 miles east from the subject along Secaucus Road, a major industrial route, with superior visibility and access to Exit 16E on the NJTP, requiring downward adjustment. Sale 4 is located at the dead end of a secondary access road located approximately 3-miles southeast of the subject in an awkward location off Secaucus road. The site lacks the same access (bounded by Penhorn Creek to the south and east) and visibility afforded the subject, requiring upward adjustment. Lastly, Sale 5 has a superior location situated on the east side of County Road, between Tonnele Avenue and Route 653, just south (visible) from Exit 16E off the NJTP, requiring downward adjustment. Frontage/Utility: The subject site is rectangular in shape with 487.29 feet of frontage along the northeast side of Seaview Drive, with a depth of 600 feet.
Property Frontage Midblock/Corne
r Layout Overall Utility AdjustmentSubject 487 Feet Midblock Rectangular Good N/A Comp 1 913 Feet / 535 Feet Corner Rectangular Good Downward Comp 2 200 Feet Midblock Rectangular Good Upward Comp 3 280 Feet Midblock Rectangular Good Upward Comp 4 851 Feet Midblock Irregular Below-Average Upward Comp 5 1,418 Feet Midblock Irregular Excellent Downward
Where applicable, adjustments were considered for significant differences in site conditions such as frontage, availability of public utilities, soil condition and whether the site is level and at grade. Sale 1 is a corner lot with superior frontage, resulting in a downward adjustment. Sales 2 and 3, although benefiting from superior location and visibility on a heavier-traveled roadway, has inferior frontage on Secaucus Road, requiring upward adjustment. Sale 4 has superior frontage, although inferior utility as it is a highly irregular-shaped lot, bounded on two sides by water within a high flood risk zone, requiring upward adjustment. Sale 5 is a very large site with almost 3x the frontage as the subject, requiring downward adjustment. Site improvements/Demolition Costs: All of the sites were sold as raw land, with the exception of Sales 1 and 2, which were improved with a large two-level industrial building (150,000 SF) and a small industrial garage building (10,000 SF). Demolition costs of $5/SF of building area, typical for the market, are applied as buyers will pay more for sites that are cleared. All of the sites had utilities available. Size: It is noted that typically, in most types of real estate, small sites sell for a higher price per square foot than larger parcels due to economies of scale. Although the sales are analyzed on a price-per square foot of buildable area (further discussed in the zoning adjustment), adjustments

73
COST APPROACH were applied to sales with large discrepancies in size compared to the subject. As a result, Sales 1, 4 and 5 were adjusted upward for their larger site sizes. Conversely, Sales 2 and 3 are adjusted downward as they are nearly half the size of the subject or less. Zoning: The subject property is located in the HMDC Light Industrial & Distribution A zoning district as promulgated by the Hackensack Meadowlands Development Commission. Principle permitted uses in the Light Industrial & Distribution A District include a wide range of light industrial, warehouse, office uses, light public utility uses, child care centers, self-storage facilities, business services and Class A recycling facilities. All of the comparables are also zoned under the jurisdiction of the HMDC with nearly identical allowable uses and development rights. The subject has a maximum allowable FAR of 2.5, although more importantly, a maximum lot coverage area of 50%. Except for Sale 5, each of the sales also permit a maximum coverage area of 50% with similar FAR restrictions, requiring no adjustment. Sale 5 permits a slightly inferior 40% lot coverage area, requiring upward adjustment. Based on the adjustments discussed above, the grid on the following table quantifies the adjustments to the comparables.
Sales Adjustment Grid Adjustment Criteria 1 2 3 4 5 Sale Price/SF-GBA $10.59 $19.14 $36.25 $7.89 $22.17 Conditions of Sale = = = = = Financing = = = = = Property Rights = = = = = Sale Price/SF-FAR $10.59 $19.14 $36.25 $7.89 $22.17 Market Conditions = 10% = 10% 5% Sale Price/SF-FAR $10.59 $21.05 $36.25 $8.68 $23.28 Location/Access 10% -10% -10% 10% -10% Frontage/Utility -5% 5% 5% 10% -10% Site Improvements 32%* 1%* = = = Size 5% -5% -10% 5% 15% Zoning = = = = 5% Net Adjustments 42% -9% -15% 25% 0% Net Adjusted Price $15.04 $19.16 $30.81 $10.85 $23.28
*Approximately $5/SF demolition cost

74
COST APPROACH After applying the appropriate adjustments, it appears the market value of the subject site should fall between $10.85/SF-GBA and $30.81/SF-GBA.The average of the comparables is $19.83/SF-GBA and the median is $19.16/SF-GBA. Given the subject’s mid-block orientation and good location, a price towards the middle of the range is appropriate. I also placed the most emphasis on Sale #2, due to its similarity in size, location, access, condition and functional utility. I am also under the assumption that the subject’s current building area is the maximum allowable by the Hackensack Meadowlands Development Commission. Therefore, I am incorporating the subject’s 146,342 SF into my final calculation. Based on the information previously stated, a unit value of $20/SF-GBA appears reasonable. The value of the subject site is calculated below:
Price/SF-GBA X Size (SF) = Value Estimate $20/SF X 146,342 = $2,926,840
Rounded = $2,900,000 Cost Estimates The second step involved in the cost approach is an estimation of the cost of the subject improvements. Two forms of costs are available; reproduction and replacement costs. Reproduction cost is the cost of construction at current prices of an exact duplicate or replica using the same materials, construction status, design, layout, and quality of workmanship, embodying all of the deficiencies, super-adequacies, and obsolescence of a building. Replacement cost is defined as the cost of construction at current prices of a building having the utility equivalent to the building being appraised, but built with modern materials and according to current standards, design, and layout. Below is an estimate of the cost to reproduce the subject improvements. Within this valuation, the reproduction cost of the subject is used rather than the replacement cost. Reproduction cost reproduces what is actually in place, while replacement cost replaces the existing function, but does not necessarily replicate the existing improvements. Both direct costs (hard costs) and indirect costs (soft costs) must be considered in the estimate of reproduction costs. Direct costs relate to labor and materials used in the construction of improvements. Direct costs are costs for the work done or supervised by the general contractor. Soft costs relate to expenditures on items other than labor and materials. These costs may include administrative and professional fees, financing costs, taxes, insurance, and sales and lease-up costs. The following estimate, shown on the next two pages, was derived from the Marshall Valuation Service Segregated Estimator, an online cost service from Marshall & Swift which estimates the reproduction cost of each of the components of a building. This is referred to as the unit-in-place method. The cost units derived from the Marshall and Swift Valuation Service includes:

75
COST APPROACH 1) Architect and engineering fees; 2) Normal interest on building funds during period of construction and processing fee or
service charge; 3) Sales tax on materials; and, 4) Contractor's overhead and profit including job supervision, workmen's compensation, fire
and liability insurance, unemployment insurance, etc. The appropriate costs for each of the subject components is considered in the cost estimate below. The valuation is based on the gross building area of 146,342 square feet on the ground level. Occupancy: Industrial Warehouse Class: Composite Concrete-Steel, Class B Cost Range Rating: 2.0 Average Cost Floor Area: 146,342 SF Component Units (SF) Cost/SF Cost New Excavation & Site Preparation: Excavation, Bulk (cubic feet) 146,342 $0.32 $46,829 Site Preparation (SF of site) 292,375 $0.25 $73,094 Subtotal $119,923 Foundation: Concrete, Class C Bearing Wall 146,342 $2.27 $332,196 Frame: Composite Concrete-Steel 146,342 $11.78 $1,723,909 Frame Height Adjustment 146,342 $4.71 $689,271 Subtotal $2,413,180 Floor Structure: Concrete Lift Slab 146,342 $9.37 $1,371,225 Floor Cover: Sealed Concrete (warehouse) 131,842 $0.75 $98,882 Carpet and Pad (office) 14,500 $2.55 $36,975 Subtotal $135,857 Ceiling: Insulated Panel (warehouse) 131,842 $4.00 $527,368 Acoustical Ceilings (office) 14,500 $6.30 $91,350 Subtotal $618,718 Interior Construction: Warehouses, Storage 146,342 $1.10 $160,976

76
COST APPROACH Plumbing: Warehouses, Storage 146,342 $1.23 $180,001 Fire Protection: Sprinklers 146,342 $1.59 $232,684 Heating, Cooling & Ventilation: Radiant Gas Heat Suspended (wrhs.) 131,842 $1.54 $203,037 Package Heating & Cooling (office) 14,500 $5.69 $82,505 Subtotal $285,542 Electrical: Warehouses, Storage 146,342 $1.93 $282,440 Exterior Wall: Concrete Curtain Walls 146,342 $26.00 $3,804,892 Thickness= 6 Inches Hangar Doors: Steel Doors 3,000 $20.00 $60,000 Roof Structure: Steel Joists, Steel Deck 146,342 $5.46 $799,027 Roof Cover: Insulated Rubber Tile 146,342 $3.65 $534,148 Reproduction Cost New 146,342 $77.43 $11,330,809 Source: Marshall & Swift Segregated Estimator, March 2006 The Marshall Valuation Service Segregated Estimator has estimated the reproduction cost for the subject at $11,330,809 or $77.43/SF. Soft Costs During construction, there are certain soft costs, which include property taxes, insurance and other fees, commissions, and overhead that are not reflected in the Marshall Valuation figures. Below, I have identified four development projects (ground-up construction), with their ratio of hard costs to soft costs.
Generally, market participants have indicated that soft costs range from 10% to 20% of hard costs, which is consistent with the comparables shown above. I have utilized 15% in soft costs for the subject, based on the comparables, totaling $1,699,621, which is input in my analysis.

77
COST APPROACH Entrepreneurial Profit If the Cost Approach is to provide a reliable indication of value, the appraiser must add to the direct and indirect costs a figure that represents the entrepreneurial or developers profit that is reflected in the market. It is a return to the investor based on his entrepreneurial skills and abilities. An investor in real property, especially a developer, gives up a certain amount of liquidity in development, and his risk is based upon his past experience in the field, his forecasting ability with respect to the real estate/business cycle, his expertise in management, and timing. These items are somewhat speculative and tend to be within a fairly wide profit range depending upon a combination of the preceding items. Essentially, entrepreneurial profit is a market-derived figure that reflects the amount that the entrepreneur, or developer, expects to receive in addition to costs. Depending on market practice, this type of profit may be measured as a percentage of (1) direct costs, (2) direct and indirect costs, (3) direct and indirect costs plus land value, or (4) the value of the completed project. Appraisers often derive an appropriate figure for profit expectation from market analysis. By analyzing recent sales of new properties in the same market, the appraiser can calculate entrepreneurial profit as the difference between the sale price and the sum of direct costs, indirect costs, and current market land value. An appraiser can also survey developers to determine entrepreneurial profit. However, the amount of entrepreneurial profit varies with factors such as economic conditions and property type, so a typical relationship between this profit and other costs is difficult to establish. In conversations with developers of similar types of properties, an expected profit range would be 10% to 20% of the overall cost of the improvements. I shall use 15% of the total cost of the improvements, direct and indirect, as an indication of the entrepreneurial profit for the subject property. This is in-line with the projected yield on the investment as determined in the Income Capitalization Approach. Based on the preceding analysis, the total estimated cost new of the subject, inclusive of entrepreneurial profit is as follows:
Reproduction Cost New: $11,330,809 Soft Costs @ 15.0%: $1,699,621 Adjusted Reproduction Cost New: $13,030,430 Plus Entrepreneurial Profit @ 15%: $1,954,565 Reproduction Cost, Including Profit: $14,984,995

78
COST APPROACH Accrued Depreciation Accrued depreciation is a loss in value from the reproduction or replacement cost of improvements due to any cause as of the date of appraisal. It may also be defined as the difference between reproduction or replacement cost of an improvement and its market value as of the date of appraisal. The value difference may emanate from physical deterioration, functional obsolescence, external obsolescence, or any combination of these sources. In the Cost Approach, depreciation from all causes, including physical, functional and external, is subtracted from current replacement or reproduction cost. However, depreciation is a penalty only insofar as it is recognized by the market as a loss in value. Physical Deterioration Curable This involves an estimate of deferred maintenance and is applicable to items subject to current repair. This includes all items of rehabilitation, if by accomplishing this, would bring the structure to optimum condition. The subject improvements consist of a single-tenant warehouse structure that was built in 1978. No significant items of deferred maintenance were noted upon inspection. Incurable This reflects loss in value due to the wearing out of physical parts of the structure. I will use the Age-Life Method of estimating the physical incurable depreciation for the existing buildings of the subject property. The Age-Life Method employs the actual or effective age of the improvements versus their estimated economic life and expresses the ratio by a percentage. To estimate physical incurable depreciation with the economic age-life method, the ratio of a building's effective physical age to its total economic life is applied to the current cost of the improvements to obtain a lump-sum deduction for physical incurable depreciation. The subject improvements consist of a warehouse structure that built in 1978. The building has an effective age of approximately 31 years and a useful life of 55 years. Therefore, a 56% deduction is taken. Functional Obsolescence This reflects lost in value due to poor plan, outmoded style or design, architectural super-adequacy, or inadequacy, or otherwise. If incurable functional obsolescence exists, one must charge off additional cost of ownership in the replacement method, if any. For the subject property, I have not made any adjustments for functional obsolescence, nor was such obsolescence noted upon inspection. The curable and incurable aspects of functional obsolescence were considered. External Obsolescence This is a loss of value that can accrue to both land and buildings and is a form of obsolescence arising from factors external to the property. This form of obsolescence is almost always incurable.

79
COST APPROACH A neighborhood and area analysis revealed the property is in-line with the surrounding competition and has remained in high demand. No obsolescence is noted. The estimated value via the Cost Approach (as presented below) is $9,500,000.
COST APPROACH SUMMARY Marshall Swift Replacement Cost New: Total Replacement Cost NEW $13,030,430 Entrepreneurial Profit @ 15% $1,954,565
TOTAL Replacement Cost NEW $14,984,995
Accrued Depreciation: Physical Deterioration- Incurable @ 56% ($8,391,597) Physical Deterioration- Curable @ 0% $0 Functional Obsolescence $0 External Obsolescence $0 TOTAL Accrued Depreciation ($8,391,597) Depreciated Value of Improvements $6,593,398 Land Value $2,900,000 Indicated Value via COST APPROACH $9,493,398 ROUNDED: $9,500,000
Therefore, the retrospective market value estimate for the fee simple estate in the subject property, as derived through the Cost Approach, as of February 28, 2007, is:
NINE MILLION FIVE HUNDRED THOUSAND DOLLARS ($9,500,000)

80
INCOME CAPITALIZATION APPROACH Introduction A value estimate pursued through the Income Capitalization Approach requires an analysis of the competing market for the type of property being appraised and a determination of market oriented rents, vacancy, and expenses for that property, as well as an analysis of current investment parameters among today's income property investor. The subject property represents income producing real estate, which would be purchased for the purpose of generating a cash flow (net income), to ownership. In other words, net income would be the primary benefit of ownership and is the basis for determining value when value is recognized as the present worth of future benefits arising out of ownership to typical users or investors. The Income Capitalization Approach is a technique or method wherein the future benefits of ownership are transformed through capitalization into a present worth or value estimate. When estimating value by this approach, the appraisers must determine and clearly define future benefits and identify today's typical user or investor. There are two primary methods of used in the Income Capitalization Approach: 1) direct capitalization of a stabilized upcoming year's income; or 2) through the use of a discounted cash flow analysis. More rudimentary methods, such as the use of gross rent multipliers or gross income multipliers, might also be utilized in some situations. In both techniques, future benefits are estimated by forecasting the gross earnings potential of the property under prevailing and foreseeable market conditions. Appropriate allowances for credit/vacancy loss and operating expenses are then deducted from gross earnings resulting in an estimate of net monetary benefits to ownership. This can then be converted into an estimate of present value through the use of an appropriate capitalization rate. Direct capitalization applies a market oriented capitalization rate to the projected net income for an upcoming, stabilized year. The discounted cash flow analysis projects the anticipated net income from a property over a market oriented holding period (typically 5 to 10 years). These annual income projections, along with the expected reversionary value, are discounted to present value at an appropriate yield rate, in order to provide a present value indication. In this instance, the subject property is a large warehouse industrial building that is currently vacant. Market evidence suggests that the likely purchaser for this type of property would be a pension fund, a REIT, or some other type of institutional investor. This type of purchaser will usually employ a discounted cash flow analysis in valuing an asset. In this instance, I have performed both a discounted cash flow analysis and a direct capitalization analysis in the valuation of the subject property. More weight is being afforded to the discounted cash flow procedure. Market Rent Analysis: As discussed in my Industrial Market Analysis, the subject enjoys a good location just off Exit 15X on the New Jersey Turnpike (I-95), one of the nation’s busiest shipping/distribution routes. In order to estimate the market rent for the subject property, I have performed a survey of recent industrial transactions within northern New Jersey, and more specifically, Secaucus. These transactions provide insight into market rent for the subject property.

81
INCOME CAPITALIZATION APPROACH Comparable Rental No. 1
Location: 2 Emerson Lane, Secaucus, NJ (Northeast corner of Emerson Lane and Enterprise Avenue North) Use: Warehouse Year Built: 1980 Square Footage: 283,215 Square feet Design: Two-story Ceiling Height: 20-24 Feet Office Build-out: 0% Dock Doors: 21 Floor Load: 250 Lbs per square foot Parking Ratio: 3.27 spaces per 1,000 SF Tenant: Children’s Places Size: 245,000 Square feet Lease Term: 15 Years Base Rent 2/2007 – 1/2012: $1,842,400 Per year ($7.52/SF) 2/2012 – 1/2017: $1,413,650 Per year ($5.77/SF) 2/2017 – 1/2022: $1,808,100 Per year ($7.38/SF) Reimbursements: Triple Net; Tenant is submetered for electricity, water/sewer and fuel.
They also pay their pro-rata share of real estate taxes and insurance charges.
Concessions: No free rent, no tenant improvement allowance Frontage: Good Layout: Rectangular

82
INCOME CAPITALIZATION APPROACH Comparable Rental No. 2
Location: 4 Emerson Lane, Secaucus, NJ (Northeast corner of Emerson Lane and Syms Way) Use: Warehouse Year Built: 1980 Square Footage: 166,356 Square feet Design: Single-story Ceiling Height: 24 Feet Office Build-out: 12% Parking Ratio: Ample Tenant: Rose Brand Stage Curtains Size: 126,000 Square feet Lease Term: 15 Years Lease Date: 7/2006 Base Rent: $5.90/SF, $6.60/SF Average over lease term Reimbursements: Triple Net; Tenant is submetered for electricity, water/sewer and fuel.
They also pay their pro-rata share of real estate taxes and insurance charges.
Concessions: Two months free rent, no tenant improvement allowance Frontage: Good Layout: Rectangular

83
INCOME CAPITALIZATION APPROACH Comparable Rental No. 3
Location: 350 Meadowlands Parkway, East Rutherford, NJ (Intersection of Meadowlands Parkway and Seaview Drive) Use: Warehouse Square Footage: 130,000 Square feet Design: Single-story Ceiling Height: 22 Feet Office Build-out: 10% Dock Doors: 6 Parking Ratio: Ample Tenant: ZT Group Size: 130,000 Square feet Lease Term: 5 Years Base Rent 6/2005 – 5/2010: $715,000 Per year ($5.50/SF) flat over lease term Reimbursements: Triple Net; Tenant is submetered for electricity, water/sewer and fuel.
They also pay their pro-rata share of real estate taxes and insurance charges.
Concessions: One month free rent, no tenant improvement allowance Frontage: Good Layout: Rectangular

84
INCOME CAPITALIZATION APPROACH Comparable Rental No. 4
Location: 165 Polito Avenue (Westside of Polito Ave. between Valley Brook Ave. and Wall St. West) Use: Warehouse Square Footage: 144,000 Square feet Design: Single-story Ceiling Height: 26 Feet Office Build-out: 10% Dock Doors: 18 Parking Ratio: Ample Tenant: Theory Apparel Size: 144,000 Square feet Lease Term: 12 Years Base Rent: $5.75/SF, $7.75/SF average over lease term Reimbursements: Triple Net; Tenant is submetered for electricity, water/sewer and fuel.
They also pay their pro-rata share of real estate taxes and insurance charges.
Concessions: No free rent, no tenant improvement allowance Frontage: Good Layout: Rectangular

85
INCOME CAPITALIZATION APPROACH Comparable Rental No. 5
Location: 75-85 Metro Way (Eastside of Metro Way between County Ave. and Enterprise Ave South) Use: Warehouse Year Built: 1978 Square Footage: 140,000 Square feet Design: Single-story Ceiling Height: 24 Feet Office Build-out: 10% Dock Doors: 7 Parking Ratio: Ample Tenant: Jimmy Jazz Apparel Size: 65,000 Square feet Lease Term: 10 Years Base Rent 4/2006 – 3/2011: $357,500 Per year ($5.50/SF) 4/2011 – 3/2016: $393,250 Per year ($6.05/SF) Reimbursements: Triple Net; Tenant is submetered for electricity, water/sewer and fuel.
They also pay their pro-rata share of real estate taxes and insurance charges.
Concessions: Two months free rent, no tenant improvement allowance Frontage: Good Layout: Irregular

86
INCOME CAPITALIZATION APPROACH
Comparable Rentals Map

87
INCOME CAPITALIZATION APPROACH
Comparable Rentals Summary # Tenant/Location Start/Term Size Base Rent Expenses 1 Children’s Places
2 Emerson Lane Secaucus, NJ
02/07 15 Yrs. 245,200 SF
$7.52/SF Yrs. 1-5 $5.77/SF Yrs. 6-10
$7.38/SF Yrs. 11-15 NNN Lease
2 Rose Brand Stage Curtains 4 Emerson Lane Secaucus, NJ
07/06 15 Yrs. 126,000 SF $5.90/SF Yr. 1
$6.60/SF Avg. NNN Lease
3 ZT Group 350 Meadowlands Parkway East Rutherford
06/05 5 Yrs. 130,000 SF $5.50/SF Flat NNN Lease
4 Theory Apparel 165 Polito Avenue Lyndhurst, NJ
12/05 12 Yrs. 144,000 SF $5.75/SF Yr. 1
$7.75/SF Avg. NNN Lease
5 Jimmy Jazz Apparel 75 Metro Way Secaucus, NJ
04/06 10 Yrs. 65,000 SF $5.50/SF Yrs. 1-5
$6.05/SF Yrs. 6-10 NNN Lease
Market Rent Analysis The comparable data has been denominated on the basis of dollars per square foot of net rentable area, which is virtually identical to gross building. I observe that each of the comparable leases are triple-net, requiring the tenant to pay for their pro-rata share of real estate taxes and all operating expenses, except structural repairs and property management. The comparables indicate a relatively tight range in base rent from $5.50/SF to $6.89/SF (average for comp #1).
In order to ascertain the appropriate market rent level for the subject property, I will consider differences between the comparable properties and the subject property that would be perceived in the marketplace. Adjustments are then applied to the comparable data, in order to reflect these differences. Initially, I considered adjustments for differences in lease provisions, market conditions and concessions.
In terms of market conditions, as mentioned in the market analysis section of this report, the Cushman & Wakefield Q3-2006 industrial rent survey indicated that the weighted average net asking warehouse rental rate in the Meadowlands was $7.00/SF. This rent remained basically unchanged from the year-end 2005 asking rent of $7.01/SF. Furthermore, my own survey of active industrial brokers in the Meadowlands included representatives from the area’s largest landlord, Hartz Mountain. The brokers indicated that market rates have remained mostly unchanged over the last two years, and as a result, none of the comparables require adjustment for market conditions.
Although the subject is currently vacant, the property was previously leased to Nippon Express U.S.A. under a triple-net leasing provision wherein the tenant was responsible for either directly paying or reimbursing ownership for their pro-rata share of all operating expenses. As displayed by the comparables, this type of lease is typical within the marketplace for warehouse space. All of the comparables are leased on a triple-net basis, and thus, no adjustment is required for lease provisions.

88
INCOME CAPITALIZATION APPROACH Regarding concessions, it is typical for a tenant to receive some minimal free rent prior to occupancy, usually 1-2 months during the build-out of their space. This is considered a function of downtime between leases. In this instance, there are no atypical concessions that need to be accounted for through the adjustment process.
The primary adjustment criteria account for differences in physical characteristics (clear ceiling height, condition of space and size of leased area). No location adjustments are necessary as each of the comparables is situated in a similar location within the subject’s submarket. Each of the comparables is also similar to the subject regarding on-site parking and loading capacity. The adjustment process, as it relates to each comparables is described below:
Comparable Rental #1 is the recent lease of a 245,200 square foot portion of a 282,499 square foot warehouse industrial building situated in the subject’s neighborhood. This is a 2-story building with 133,000 square feet on the second floor. The lease extends for a term of 15 years with an initial base rent of $7.52/SF for the first five years, then the rent declines to $5.77/SF in year six, increasing to $7.38/SF in year 11. The rent over the term is 6.89/SF. The building has clear ceiling heights of 20’ to 24’. The building is 100% air conditioned, although contained no finished office space. The unit was leased “as is” with the tenant planning to renovate the building into a mix of office, warehouse and retail showroom space. No free rent was provided. This rental requires a small positive adjustment to reflect its larger size. A positive functional utility adjustment is also required for a superior number of dock doors and for the conditioned space. Overall, a positive adjustment to the average rent of $6.89/SF is warranted.
Comparable Rental #2 is a recent lease of a 126,000 square foot portion of a 166,356 square foot one-story warehouse building with 24’ clear ceilings, six dock doors and 12% finished office space. The property is situated in the subject’s neighborhood, in a similar location. The base rent starts at $5.90/SF and averages $6.60/SF over the 15 year term. The lease included two months free rent. The space was leased basically “as is” with minimal tenant improvement allowance. Overall, no net adjustment is warranted.
Comparable Rental #3 is a June 2005 lease of a 130,000 square foot one-story warehouse building with 22’ clear ceilings, six dock doors and 10% finished office space. The base rent remained level at $5.50/SF over the 5-year term. Negative income characteristic adjustments are warranted to the initial base rent to reflect the flat rent level over the lease term. The lease included one month free rent. The space was leased basically “as is” with minimal tenant improvement allowance. Overall positive functional utility adjustment is warranted for the lower clear ceilings and number of dock doors. Overall, no net adjustment is warranted.
Comparable Rental #4 is a December 2005 lease of a 144,000 square foot one-story warehouse building with 26’ clear ceilings, 18 dock doors and 10% finished office space. The base rent starts at $5.75/SF, averaging $7.75/SF over the 12-year term. The lease included no free rent. Positive income characteristic adjustment is warranted to the initial base rent to reflect the above average rent steps over the term. A small negative functional utility adjustment is warranted for the slightly higher clear ceilings and superior number of dock doors. Overall, no net adjustment is warranted.

89
INCOME CAPITALIZATION APPROACH Comparable Rental #5 is an April 2006 lease of a 65,000 square foot portion of a one-story warehouse building with 24’ clear ceilings, 7 dock doors, 1 drive-in door and 10% finished office space. The base rent starts at $5.50/SF and averages $5.78/SF over the 10-year term. The lease included two months free rent. This rental requires a negative adjustment to reflect its smaller size. A small upward functional utility adjustment is warranted for a superior number of dock doors. Overall, no net adjustment is warranted. The chart below illustrates the adjustment process.
Adjustment Criteria 1 2 3 4 5 Unit Price $/SF NRA $6.89 $5.90 $5.50 $5.75 $5.50 Leasing provisions = = = = = Concessions = = = = = Adjusted Unit Price $6.89 $5.90 $5.50 $5.75 $5.50 Market Conditions = = = = = Adjusted Unit Price $6.89 $5.90 $5.50 $5.75 $5.50 Location = = = = = Building Size +5% = = = -5% Functional Utility +5% = 5% -5% +5% Income Characteristics = = -5% 5% = Total Adjustment 10% 0% 0% 0% 0% Adjusted Unit Price $7.58 $5.90 $5.50 $5.75 $5.50
After adjustment, the comparable data reflects a range between $5.50 and $7.58 per square foot, with an average of $6.05/SF and a median of $5.75/SF. Based on the above analysis, placing most weight on Comparables 2 and 3, which are most similar to the subject in terms of location, size, and functional utility, I project a market rent of $6.00 per square foot on a triple-net basis. The following information summarizes the projected market rent and terms that were applied to the subject property: Market Rent Summary: Base Rent: $6.00/SF Landlord Expenses: Structural repairs and property management Annual Escalations: 3.0% Annually Market Rent Growth: 3.0% Annually Lease Term: 10 Years TI Allowance: $2.00/SF (covers office renovation and miscellaneous repairs) Downtime: 9 Months Renewal Probability: 65% Concessions: 2 Months free new; 0 Months free renewal Leasing commissions: 6% New – 3% Renewals

90
INCOME CAPITALIZATION APPROACH Potential Gross Rental Revenue Because the subject property is vacant I have applied market rent to the rentable area to project stabilized potential gross rental revenue of $878,052. Reimbursement Income In addition to the base rent, the subject property is expected to receive income from expense reimbursements. Future leases are assumed to be structured on a triple-net basis wherein tenants will be expected to reimburse the landlord for real estate taxes and operating expenses including insurance, nonstructural maintenance and repairs and utilities. The only expenses that are borne by the landlord are for structural repairs and property management. Vacancy and Collection Loss As discussed in my market analysis, rental conditions for industrial space in the subject’s competitive market area of Secaucus and surrounding areas of Northern New Jersey have been relatively strong. At present, overall vacancy among industrial properties in these submarkets are cited at approximately 7.7%. The general market perception is that the current low rate of new construction should continue for the foreseeable future. In projecting these factors within the discounted cash flow process, vacancy is accounted for through the holding period at rollover of the lease terms, as a function of the projected downtime between leases and the tenant retention probability. In light of the available information, I concluded that the appropriate stabilized vacancy/credit loss factor for the subject property would approximate 5%. As such, I included a 5% vacancy/collection loss factor in the direct capitalization process and for the reversion year cash flow projection. Absorption I have projected a 9-month absorption period (nine months of lost rent) to lease the subject property to a single tenant. EXPENSE ANALYSIS Typical deductions from the calculated effective gross income (EGI) fall into three categories: fixed, variable and non-operating. Fixed expenses are those that are incurred regardless of the subject's occupancy level and are also known as carrying costs. Variable expenses vary according to occupancy levels, but not necessarily directly or proportionately. Non-operating expenses are those costs that are incurred by the property, but do not result in its day-to-day operation. With the exception of real estate taxes, the subject’s expenses are expected to increase at a rate of 3% annually. Real estate taxes are projected to grow at a rate of 4% annually. In order to appropriately project the subject’s expenses for the upcoming year, I have examined the subject’s operating expense history for the period 2005 and 2006. The following table illustrates the subject’s operating history.

91
INCOME CAPITALIZATION APPROACH
Subject Operating History 2005-2006 Year 2006 2005 Budget $/SF Actual $/SF Income Rent $737,030 $5.04 $884,435 $6.04 Reimbursements $342,962 $2.34 $210,062 $1.44 Total Income $1,079,992 $7.38 $1,094,497 $7.48 Expenses Repairs/Maintenance/Utilities ($160,739) ($1.10) 0 0 Insurance ($5,467) ($0.04) ($5,273) ($0.04) Real Estate Taxes ($205,465) ($1.40) ($207,350) ($1.42) Manage. & Admin. ($20,321) ($0.14) ($12,553) ($0.09) Total Expenses ($391,992) ($2.68) ($225,176) ($1.54) Net Operating Income $688,000 $4.70 $869,321 $5.94
Source: Property Manager
My analysis and conclusions pertaining to the appropriate expense projections for the subject property are described in the following paragraphs. This data is being analyzed on the basis of dollars per square foot, which is typically how this type of property is analyzed by market participants.
FIXED EXPENSES
Real Estate Taxes As previously discussed, the official 2007 tax rates have not yet been published. For the upcoming year, I will utilize the existing 2006 assessed value applied to the existing 2006 tax rate plus a four percent inflation factor. This results in a first year real estate tax projection of $213,684 or $1.46/SF.
Insurance The subject’s operating statements indicate a 2006 insurance expense of approximately $0.04 per square foot, which appears to be relatively low, possibly due to the nature of the subject ownership. Based on my knowledge of the operating histories of similar properties, an insurance expense of $0.05 per square foot or $7,317 is more reasonable and will be utilized in my projection.
VARIABLE EXPENSES
Repairs and Maintenance This expense includes the maintenance associated with the daily operation of the subject property, such as HVAC systems, electrical systems, landscaping, plumbing maintenance, common area maintenance and other miscellaneous maintenance items. This category includes supplies and contract labor, but not expenses allocated to cleaning, tenant improvements, capital items or replacement of expensive long-lived items. The subject is a single tenant property, and as such, the tenant pays directly for all nonstructural repairs and maintenance. Therefore no repairs and maintenance expense is deducted in my projection.

92
INCOME CAPITALIZATION APPROACH Utilities All of the subject utilities are paid directly by the tenant. Therefore, no utilities costs are deducted in my projection. Management Typically, this expense is based on a percentage of effective rental income, generally ranging from 2% to 4%. The subject’s operating statements indicate a management expense equal to approximately 1.4% to 1.7% of base rental revenue. Given the size and single-tenant nature of the subject property, which results in most expenses being paid directly by the tenant, a management expense at the low end of the typical range or 2.0% of effective gross rental income is considered reasonable for the subject. Management expenses are not assumed to be reimbursed by future tenants. Total Operating Expenses The subject’s total projected first year operating expenses in the discounted cash flow analysis for real estate taxes, insurance and property management are projected at $238,562 or $1.63 per square foot. This figure includes $1.46/SF in real estate taxes, $0.05/SF for insurance and $0.13/SF for management.
First Year Projected Expenses Expenses
Real Estate Taxes $213,684 Insurance $7,317 Management $17,561 Total Operating Costs $238,562
Non-Operating Expenses In addition to the above listed expenses, industrial properties incur other expenses that are usually considered capital in nature. These costs include leasing commissions, tenant improvements and a reserve for replacement allowance. Such expenses are generally deducted from a building's cash flow after the calculation of net operating income. As such, these projected costs are being deducted prior to the estimation of annual cash flows in the discounted cash flow analysis and in the direct capitalization method. Replacement Reserves This cost is intended to account for costs associated with the replacement of long-lived depreciable structural items, primarily the property’s roof. These costs would fall outside of standard repairs and maintenance expenses. Based on information contained in the Fourth Quarter 2006 Korpacz Real Estate Investor Survey, most investors will include replacement reserves between $0.05 and $0.25 per square foot when analyzing industrial properties. I considered the overall condition of the subject property and concluded that a $0.20 per square foot allowance would be appropriate for the valuation of the subject property.

93
INCOME CAPITALIZATION APPROACH Leasing Commissions Leasing commissions in this market typically range between 5%-7% of the total lease amount for new leases. Lease renewals are often completed without brokers and frequently cause owners to incur lower commission expenses. I have estimated 3rd party leasing commissions for the office space at rollover based under a blended rate analysis. In the market leasing scenario, I have assigned a 65% renewal probability. The resulting blended rate is as follows: Percentage Average Commission Weighted Rate 65% Renew @ 3.00% = 1.95% 35% Vacate @ 6.00% = 2.10% Blended Rate: 4.05% Tenant Improvements Interviews with brokers in the subject market indicate that tenant improvements are typically limited to repairing any deferred maintenance and renovating existing offices. Major tenant improvements are typically amortized over the term of the lease. My market rent projections assume that all future leasing will be basically “as is” with the landlord assumed to pay a total of $2.00/SF upon lease expirations simply to cure any deferred maintenance and renovate the office space. No tenant improvements are assumed for renewals. Therefore, the weighted average TI considering the projected 65% renewal probability is $0.70/SF. This cost is projected to grow at an inflation rate of 3.0% through the holding period.
DISCOUNTED CASH FLOW AND CAPITALIZATION METHODOLOGY
As stated, I have employed both a discounted cash flow analysis and the direct capitalization procedure in this valuation process. The income and expenses cited above reflect my projections of an upcoming year’s stabilized income. This information was utilized as the basis for my direct capitalization analysis, as well as in the cash flow analysis.
In the discounted cash flow analysis, the subject’s income and expenses are projected over a typical holding period in order to account for fluctuations in the income stream. The projected annual cash flows, along with the anticipated reversionary value are discounted to present value and added together in order to reflect the present value of the asset. A holding period of 5 to 10 years would be typical among most investors purchasing a stabilized property of this size and quality. I have utilized a 12-year holding period in my DCF analysis to allow for a stabilized net operating income during the reversion year.
In order to establish the financial parameters for my analysis, I have analyzed information obtained from national investor surveys, as well as information obtained from local building sales and through discussions with market participants.
Investor Survey I have studied the results from National Investor Surveys published by the Korpacz Company (Fourth Quarter 2006). The subject property is considered to be an investment grade industrial building. The following survey reflects investor thoughts pertaining to investments of similar quality industrial product.

94
INCOME CAPITALIZATION APPROACH
Source: Korpacz Real Estate Investor Survey, Fourth Quarter 2006
With regard to the above data, the subject property is of sufficient size and investment quality to attract interest from many national, institutional type investors. As such, the responses from these surveys are considered very relevant to the subject’s valuation.

95
INCOME CAPITALIZATION APPROACH Capitalization Rate Selection The National Investor Survey cited above indicates that institutional investors predominantly anticipate going-in capitalization rates ranging from 5.00% to 8.50%, averaging 6.82%. The average residual capitalization rate is 81 basis points higher. The following chart depicts information gathered on recent industrial building sales considered relevant to the subject.
Comparable Sale Capitalization Rates Property Sale
Date Size (NRA) $/SF Cap Rate
903 Castle Road, Secaucus 08/06 100,000 SF $71.57 7.00% 350 Secaucus Road, Secaucus 03/06 80,000 SF $75.00 6.52% 35 UPS Drive 08/06 74,172 SF $70.00 7.00%
As indicated, the going-in capitalization rates demonstrated by these recent sales range from 6.52% to 7.0%. Within the direct capitalization process, I considered that the subject property is vacant. In selecting the overall capitalization rate for use in this analysis, I concluded that the appropriate range would be between 6.50% and 7.50%. In this instance, I applied a 7.00% overall capitalization rate in my direct capitalization analysis. This rate is applied to stabilized net operating income derived by applying market rent. Within the discounted cash flow analysis, the capitalization rate is applied to the year following the end of the projected holding period, in order to estimate reversion. I observed that investors will typically add 25 to 50 basis points to their reversionary capitalization rate, in order to account for additional risk over the holding period from changes in market conditions, property depreciation and alike. Within the discounted cash flow analysis, I used a terminal (reversionary) capitalization rate of 7.50%. Yield Rate Selection An estimate of an appropriate yield factor (IRR) should be based upon the current demand for industrial buildings within the subject's market, alternative sources of investment, present occupancy levels, prospective development in the marketplace and property specific features such as tenant quality and above, or below market lease rates. The national investor survey indicates that the typical yield rates for use in the valuation of investment grade industrial properties range from 5.50% to 11.00%, averaging 8.09%. In the discounted cash flow analysis, I considered the increased risk associated with a vacant building. I considered this factor and determined that the appropriate unleveraged yield rate (IRR) for use in this analysis would be approximately 8.50%.

Software: ARGUS Ver. 12.0.0 (Build: 12000-A) Date: 2/9/07File: 60 Seaview Drive Secaucus Time: 4:39 pmProperty Type: Office/Industrial Ref#: ABMPortfolio: Page: 1
Year 1 Year 2 Year 3 Year 4 Year 5 Year 6 Year 7 Year 8 Year 9 Year 10 Year 11 Year 12 Year 13For the Years Ending Feb-2008 Feb-2009 Feb-2010 Feb-2011 Feb-2012 Feb-2013 Feb-2014 Feb-2015 Feb-2016 Feb-2017 Feb-2018 Feb-2019 Feb-2020
__________ __________ __________ __________ __________ __________ __________ __________ __________ __________ __________ __________ __________POTENTIAL GROSS REVENUE Base Rental Revenue $317,074 $951,223 $951,223 $951,223 $951,223 $1,001,725 $1,102,728 $1,102,728 $1,102,728 $1,102,728 $1,117,364 $1,316,715 $1,316,715 Absorption & Turnover Vacancy (275,682.00) (106,530.00) (219,453.00) Base Rent Abatements (158,537.00) (64,326.00) (76,808.00)
__________ __________ __________ __________ __________ __________ __________ __________ __________ __________ __________ __________ __________ Scheduled Base Rental Revenue 158,537.00 951,223.00 951,223.00 951,223.00 951,223.00 661,717.00 1,102,728.00 1,102,728.00 1,102,728.00 1,102,728.00 1,010,834.00 1,020,454.00 1,316,715.00
Expense Reimbursement Revenue Real Estate Taxes 71,228.00 222,231.00 231,121.00 240,365.00 249,980.00 194,984.00 270,378.00 281,194.00 292,441.00 304,139.00 289,946.00 274,131.00 342,115.00 Insurance 2,439.00 7,537.00 7,763.00 7,996.00 8,235.00 6,362.00 8,737.00 8,999.00 9,269.00 9,547.00 9,014.00 8,440.00 10,432.00
__________ __________ __________ __________ __________ __________ __________ __________ __________ __________ __________ __________ __________ Total Reimbursement Revenue 73,667.00 229,768.00 238,884.00 248,361.00 258,215.00 201,346.00 279,115.00 290,193.00 301,710.00 313,686.00 298,960.00 282,571.00 352,547.00
__________ __________ __________ __________ __________ __________ __________ __________ __________ __________ __________ __________ __________TOTAL POTENTIAL GROSS REVENUE 232,204.00 1,180,991.00 1,190,107.00 1,199,584.00 1,209,438.00 863,063.00 1,381,843.00 1,392,921.00 1,404,438.00 1,416,414.00 1,309,794.00 1,303,025.00 1,669,262.00 General Vacancy (83,463.00)
__________ __________ __________ __________ __________ __________ __________ __________ __________ __________ __________ __________ __________EFFECTIVE GROSS REVENUE 232,204.00 1,180,991.00 1,190,107.00 1,199,584.00 1,209,438.00 863,063.00 1,381,843.00 1,392,921.00 1,404,438.00 1,416,414.00 1,309,794.00 1,303,025.00 1,585,799.00
__________ __________ __________ __________ __________ __________ __________ __________ __________ __________ __________ __________ __________OPERATING EXPENSES Real Estate Taxes 213,684.00 222,231.00 231,121.00 240,365.00 249,980.00 259,979.00 270,378.00 281,194.00 292,441.00 304,139.00 316,305.00 328,957.00 342,115.00 Insurance 7,317.00 7,537.00 7,763.00 7,996.00 8,235.00 8,483.00 8,737.00 8,999.00 9,269.00 9,547.00 9,834.00 10,129.00 10,432.00 Management 6,341.00 19,024.00 19,024.00 19,024.00 19,024.00 20,035.00 22,055.00 22,055.00 22,055.00 22,055.00 22,347.00 26,334.00 26,334.00
__________ __________ __________ __________ __________ __________ __________ __________ __________ __________ __________ __________ __________TOTAL OPERATING EXPENSES 227,342.00 248,792.00 257,908.00 267,385.00 277,239.00 288,497.00 301,170.00 312,248.00 323,765.00 335,741.00 348,486.00 365,420.00 378,881.00
__________ __________ __________ __________ __________ __________ __________ __________ __________ __________ __________ __________ __________NET OPERATING INCOME 4,862.00 932,199.00 932,199.00 932,199.00 932,199.00 574,566.00 1,080,673.00 1,080,673.00 1,080,673.00 1,080,673.00 961,308.00 937,605.00 1,206,918.00
__________ __________ __________ __________ __________ __________ __________ __________ __________ __________ __________ __________ __________LEASING & CAPITAL COSTS Tenant Improvements 292,684.00 118,755.00 141,800.00 Leasing Commissions 275,855.00 220,697.00 263,524.00 Structural Reserves 29,268.00 30,146.00 31,051.00 31,982.00 32,942.00 33,930.00 34,948.00 35,996.00 37,076.00 38,189.00 39,334.00 40,514.00 41,730.00
__________ __________ __________ __________ __________ __________ __________ __________ __________ __________ __________ __________ __________TOTAL LEASING & CAPITAL COSTS 597,807.00 30,146.00 31,051.00 31,982.00 32,942.00 373,382.00 34,948.00 35,996.00 37,076.00 38,189.00 39,334.00 445,838.00 41,730.00
__________ __________ __________ __________ __________ __________ __________ __________ __________ __________ __________ __________ __________CASH FLOW BEFORE DEBT SERVICE ($592,945) $902,053 $901,148 $900,217 $899,257 $201,184 $1,045,725 $1,044,677 $1,043,597 $1,042,484 $921,974 $491,767 $1,165,188 & TAXES ========== ========== ========== ========== ========== ========== ========== ========== ========== ========== ========== ========== ==========
SCHEDULE OF PROSPECTIVE CASH FLOWIn Inflated Dollars for the Fiscal Year Beginning 3/1/2007

96
INCOME CAPITALIZATION APPROACH Cost of Sale A 2.5% factor has been deducted from the reversion to cover the seller's anticipated cost of legal, accounting, recording and potential sales commissions at reversion. Discounted Cash Flow Analysis The annual discounting of the cash flows and the reversion is illustrated in the following table.
Year
Fiscal Year End
Cash Flow
(8.50% IRR) Discount Factor
PV of Cash Flow
1 02/08 -$592,945 0.921659 -$546,493 2 02/09 $902,053 0.849455 $766,254 3 02/10 $901,148 0.782908 $705,516 4 02/11 $900,217 0.721575 $649,573 5 02/12 $899,257 0.665045 $598,047 6 02/13 $201,184 0.612947 $123,315 7 02/14 $1,045,725 0.564927 $590,757 8 02/15 $1,044,677 0.520669 $543,932 9 02/16 $1,043,597 0.479879 $500,801 10 02/17 $1,042,484 0.442285 $461,075 11 02/18 $921,974 0.407637 $375,830 12 02/19 $491,767 0.375701 $184,758
Total $4,953,365 Year 11 NOI $1,165,188 Residual Value Capitalized at 7.50% $15,535,840 Less Cost of Sale at 2.5% ($388,396) Net Proceeds $15,147,444 Present Value of Residual $5,690,910 Total Present Value of Cash Flows $4,953,365 Indicated Value $10,644,275 Rounded $10,600,000
Therefore, the estimated retrospective fee simple market value via the discounted cash flow analysis is $10,600,000.

97
INCOME CAPITALIZATION APPROACH Direct Capitalization Method In the direct capitalization method I have chosen to process the market rent, deducting the present value of lost rent resulting from downtime and/or existing below market leases. The following is my projection of the subject’s stabilized operating statement utilizing market rents.
Stabilized Operating Statement Income Market Rent (146,342 SF @ $6.50/SF) $951,223 RE Tax Reimbursement 213,684 Insurance Reimbursement 7,317 Potential Gross Income $1,172,224
Less Vacancy & Credit Loss (5.0%) ($58,611) Effective Gross Income $1,113,613
Expenses Real Estate Taxes $213,684 Insurance 7,317 Management 22,272
Structural Reserves 29,268 Total Operating Costs & Reserves ($272,541)
Stabilized Net Operating Income $841,072
Fee simple Market Value Estimate NOI / OAR = Market Value
$841,072 / 7.00% = $12,015,314 As Stabilized Market Value Rounded $12,000,000 Less: Lost Rent & Reimb. During Absorption ($793,760) Less: Tenant Improvements ($292,684) Less: Leasing Commissions ($263,416) As Is Market Value $10,650,140 As Is Market Value Rounded $10,700,000
Applying an overall rate of 7.00% produces an “as is” fee simple market value of $10,700,000, rounded.
The discounted cash flow analysis produced a value conclusion of $10,600,000. The direct capitalization method resulted in a value opinion of $10,700,000. I relied most heavily on the discounted cash flow analysis in my reconciliation of market value through the Income Capitalization Approach. Therefore, the retrospective market value estimate for the fee simple estate in the subject property, as derived through the Income Capitalization Approach, as of February 28, 2007, is:
TEN MILLION SIX HUNDRED THOUSAND DOLLARS ($10,600,000)

98
SALES COMPARISON APPROACH The Sales Comparison Approach is based upon the assumption that a prudent buyer would not pay more for a property than it would cost to acquire a comparable substitute property. This approach involves a direct comparison of the property being appraised to other similar type properties that have sold, or those currently being offered for sale. This technique is based on the principle of substitution and assumes that the price a typical purchaser pays is usually the result of an extensive market investigation in which available alternatives are compared. Hence, verified and analyzed data will generally provide good evidence of value as it represents typical actions and reactions of buyers and sellers active in the marketplace. The appraisers researched the subject's market area in an attempt to locate recent sales of properties that are similar to the subject property in terms of size, location, condition and overall investment quality. Through conversations with market participants, a review of public records and through information contained in local publications, I determined that there is an active market for this type of property throughout the Northern New Jersey area. I discovered that there has been a significant amount of sales activity involving industrial buildings throughout the region. The sales selected for direct comparison to the subject property are described on the following pages. After presentation of the sale data, I present a map depicting these sales in relation to the subject. Lastly, I will perform a comparative analysis between the comparable sales and the subject property, in order to estimate the appropriate market value for the asset.
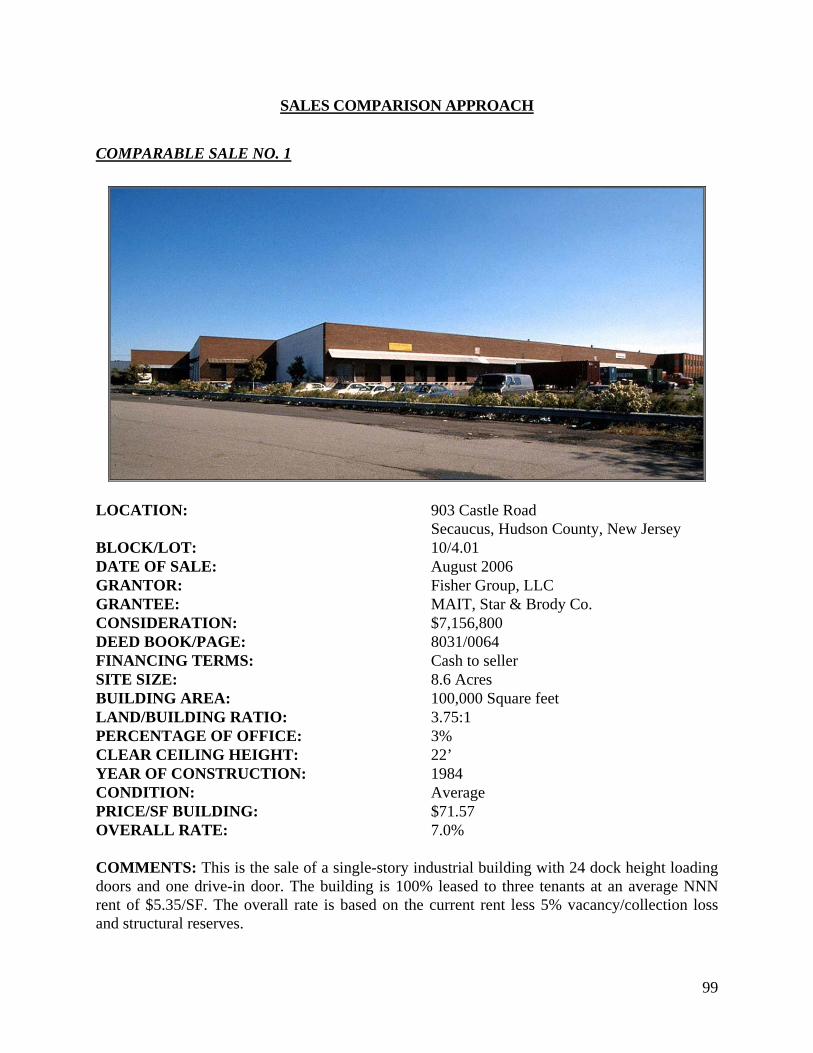
99
SALES COMPARISON APPROACH COMPARABLE SALE NO. 1
LOCATION: 903 Castle Road Secaucus, Hudson County, New Jersey BLOCK/LOT: 10/4.01 DATE OF SALE: August 2006 GRANTOR: Fisher Group, LLC GRANTEE: MAIT, Star & Brody Co. CONSIDERATION: $7,156,800 DEED BOOK/PAGE: 8031/0064 FINANCING TERMS: Cash to seller SITE SIZE: 8.6 Acres BUILDING AREA: 100,000 Square feet LAND/BUILDING RATIO: 3.75:1 PERCENTAGE OF OFFICE: 3% CLEAR CEILING HEIGHT: 22’ YEAR OF CONSTRUCTION: 1984 CONDITION: Average PRICE/SF BUILDING: $71.57 OVERALL RATE: 7.0% COMMENTS: This is the sale of a single-story industrial building with 24 dock height loading doors and one drive-in door. The building is 100% leased to three tenants at an average NNN rent of $5.35/SF. The overall rate is based on the current rent less 5% vacancy/collection loss and structural reserves.

100
SALES COMPARISON APPROACH COMPARABLE SALE NO. 2
LOCATION: 350 Secaucus Road Secaucus, Hudson County, New Jersey BLOCK/LOT: 62/14 DATE OF SALE: March 2006 GRANTOR: Vance Wilson GRANTEE: 350 Secaucus, LLC CONSIDERATION: $6,000,000 DEED BOOK/PAGE: 7868/0254 FINANCING TERMS: Cash to seller SITE SIZE: 3.92 Acres BUILDING AREA: 80,000+ Square feet LAND/BUILDING RATIO: 2.13:1 PERCENTAGE OF OFFICE: 15% CLEAR CEILING HEIGHT: 21’ YEAR OF CONSTRUCTION: 1971 CONDITION: Average PRICE/SF BUILDING: $75.00 OVERALL RATE: 6.52% COMMENTS: This is a recent sale of a single-story industrial building purchased by an owner/user. Loading facilities consist of 10 dock height loading doors and one drive-in door. The overall rate is based on a market rent of $5.25/SF, estimated by the selling broker.

101
SALES COMPARISON APPROACH COMPARABLE SALE NO. 3
LOCATION: 35 UPS Drive Secaucus, Hudson County, New Jersey BLOCK/LOT: 58/8 DATE OF SALE: August 2006 GRANTOR: AMB Institutional Alliance Fund II LP GRANTEE: 35 Real Estate, LP CONSIDERATION: $5,192,400 DEED BOOK/PAGE: 7979/0171 FINANCING TERMS: Cash to seller SITE SIZE: 2.51 Acres BUILDING AREA: 74,172 Square feet LAND/BUILDING RATIO: 1.47:1 PERCENTAGE OF OFFICE: 7% CLEAR CEILING HEIGHT: 18’ YEAR OF CONSTRUCTION: 1972 CONDITION: Average PRICE/SF BUILDING: $70.00 OVERALL RATE: 7.0% COMMENTS: This property consists of a concrete single-story industrial building. The building has adequate loading facilities with six dock doors and two drive-in doors. The building was in average condition at the time of sale. The property was 100% leased to Daisy Bakery, Inc. at the time of sale. The overall rate was provided by the selling broker, Alex Previdi of Binswanger/Klatskin.

102
SALES COMPARISON APPROACH COMPARABLE SALE NO. 4
LOCATION: 7 Caesar Place Moonachie, Bergen County, New Jersey BLOCK/LOT: 64.02/3 DATE OF SALE: September 2006 GRANTOR: Usdan Associates GRANTEE: Johnny LLC CONSIDERATION: $8,950,000 DEED BOOK/PAGE: 9156/325 FINANCING TERMS: Cash to seller SITE SIZE: 5.90 Acres BUILDING AREA: 104,000 Square feet LAND/BUILDING RATIO: 2.47:1 PERCENTAGE OF OFFICE: 10% CLEAR CEILING HEIGHT: 21’ YEAR OF CONSTRUCTION: 1975 CONDITION: Average PRICE/SF BUILDING: $86.06 OVERALL RATE: N/A COMMENTS: This is the sale of a single-story industrial building that was purchased vacant by an owner/user. The overall rate indicated was estimated by the selling broker based on market rent. The building contains adequate loading facilities including 9 dock doors and five drive-in doors.

103
SALES COMPARISON APPROACH COMPARABLE SALE NO. 5
LOCATION: 120 Moonachie Avenue Moonachie, Bergen County, New Jersey BLOCK/LOT: 62/9 DATE OF SALE: July 2006 GRANTOR: Textile Impressions Inc. GRANTEE: PK Holdings Moonachie CONSIDERATION: $6,541,500 DEED BOOK/PAGE: 9122/579 FINANCING TERMS: Cash to seller SITE SIZE: 3.6 Acres BUILDING AREA: 71,500 Square feet LAND/BUILDING RATIO: 2.19:1 PERCENTAGE OF OFFICE: 18% CLEAR CEILING HEIGHT: 22’ YEAR OF CONSTRUCTION: 1965 CONDITION: Average PRICE/SF BUILDING: $91.49 OVERALL RATE: N/A COMMENTS: This is the sale of a single-story industrial building that was purchased vacant by an owner/user. The building contains adequate loading facilities including 5 dock doors and 3 drive-in doors.

104
SALES COMPARISON APPROACH COMPARABLE SALE NO. 6
LOCATION: 99 Avenue A Bayonne, Hudson County, New Jersey BLOCK/LOT: 333.01/4-6, 333.02/1, 310/1 & 311.1/1 DATE OF SALE: February 2006 GRANTOR: Unilever Bestfoods North America GRANTEE: A 99, LLC CONSIDERATION: $13,500,000 DEED BOOK/PAGE: 7841/0204 FINANCING TERMS: Cash to seller SITE SIZE: 35 Acres BUILDING AREA: 175,700 Square feet LAND/BUILDING RATIO: 8.68:1 PERCENTAGE OF OFFICE: 13% CLEAR CEILING HEIGHT: 25’ YEAR OF CONSTRUCTION: 1986 CONDITION: Average PRICE/SF BUILDING: $76.84 OVERALL RATE: N/A COMMENTS: This is the sale of a single-story industrial building that was purchased vacant by an owner/user. The site contains expansion potential of up to 100,000 square feet. The building contains adequate loading facilities including 15 dock doors and one drive-in door.

105
SALES COMPARISON APPROACH Comparable Sales Map

106
SALES COMPARISON APPROACH Summary and Analysis of Comparable Sales: #
Address
Date
Price
NRA (SF)
Price/ SF
NOI/ SF
1. 903 Castle Road, Secaucus 08/06 $7,156,800 100,000 $71.57 $5.01 2. 350 Secaucus Road, Secaucus 03/06 $6,000,000 80,000 $75.00 $4.89 3. 35 UPS Drive, Secaucus 08/06 $5,192,400 74,172 $70.00 $4.90 4. 7 Caesar Place, Moonachie 09/06 $8,950,000 104,000 $86.06 N/A 5. 120 Moonachie Avenue, Moonachie 07/06 $6,541,500 71,500 $91.49 N/A 6. 99 Avenue A, Bayonne 02/06 $13,500,000 175,700 $76.84 N/A Analysis of Comparable Improved Sales The sales cited on the previous pages were selected for use in this analysis due to their physical and locational similarities in comparison to the subject property. In order to properly complete the Sales Comparison Approach, one must measure the comparable sales against the subject property, adjusting the sale prices of the comparables to reflect differences that would be perceived by the market. For the purpose of completing this procedure, the sales are denominated on the basis of dollars per net rentable area. The primary adjustment criteria consists of location, physical characteristics (building quality and age/condition), excess land, functional characteristics and economic characteristics (occupancy, tenant quality, above-or-below market rents, etc). Prior to adjustment for these items, I have considered such factors as conditions of sale, market conditions, financing and property rights conveyed. Each of the transactions reflects an arms-length transaction, requiring no adjustment for conditions of sale or atypical financing. All of the sales have taken place over the last 12 months, a period of modestly increasing pricing for industrial real estate, requiring a slight upward market condition adjustment for Sales #2 and #6. A discussion of the adjustment process, as it relates to each of the comparables, is outlined below. Comparable Sale #1 is the August 2006 sale of a single-story masonry industrial building purchased fully leased to three tenants. The property is situated in a similar location compared to the subject. The building has slightly inferior clear ceiling heights of 22’, warranting positive adjustment. This sale has a greater land-to-building area ratio, warranting negative adjustment. The building has a smaller net rentable area, warranting a negative property size adjustment. Overall, negative net adjustment is required.

107
SALES COMPARISON APPROACH Comparable Sale #2 is the March 2006 sale of a single-story masonry industrial building purchased by an owner user. The property is situated in a similar location. The property has a lower clear ceiling height of 21’, warranting positive adjustment. The building has a much smaller net rentable area, warranting a negative property size adjustment. Overall, a small net negative adjustment is required. Comparable Sale #3 is the August 2006 sale of a single-story masonry warehouse industrial building purchased by an investor fully leased. The property is situated in a similar location compared to the subject. The comparable has lower clear ceiling heights of 18’, warranting positive adjustment. Positive adjustment was also applied to account for the comparable’s smaller land-to-building area ratio. The building has a smaller net rentable area, warranting a negative property size adjustment. Overall, positive net adjustment is required. Comparable Sale #4 is the September 2006 sale of a single-story masonry industrial building that was purchased by an owner/user. The property is situated in a superior location in Moonachie, in neighboring Bergen County, warranting negative location adjustment. The property has lower clear ceiling heights of 21’, warranting positive adjustment. The building has a smaller net rentable area, warranting a negative property size adjustment. Overall, negative net adjustment is required. Comparable Sale #5 is the July 2006 sale of a single-story masonry industrial building that was purchased by an owner/user. The property is also situated in Moonachie, warranting negative location adjustment. The property has lower clear ceiling heights of 22’, warranting positive adjustment. The building has a much smaller net rentable area, warranting a negative property size adjustment. Overall, negative net adjustment is required. Comparable Sale #6 is the February 2006 sale of a single-story masonry industrial building that was purchased vacant by an owner/user. The location is considered generally similar to the subject. The property is generally similar to the subject with the exception of land-to-building area ratio, warranting negative adjustment. Overall, negative net adjustment is required. Analysis of Comparable Improved Sales The sales cited on the previous pages were selected for use in this analysis due to their physical and locational similarities in comparison to the subject property. The chart on the following page outlines the adjustment process.

108
SALES COMPARISON APPROACH
Adjustment Criteria 1 2 3 4 5 6 Unit Price $/SF NRA $71.57 $75.00 $70.00 $86.06 $91.49 $76.84 Conditions of Sale = = = = = = Financing = = = = = = Property Rights = = = = = = Adjusted Unit Price $71.57 $75.00 $70.00 $86.06 $91.49 $76.84 Market Conditions = +5% = = = +5% Adjusted Unit Price $71.57 $78.75 $70.00 $86.06 $91.49 $80.68 Location = = = -15% -15% = Clear Ceilings +5% +5% +10% +5% +5% = % Office/Loading = = = = = = Land Bldg. Ratio -10% = +5% = = -15% Property Size -5% -10% -10% -5% -10% = Age/Condition = = = = = = Total Adjustment -5% -5% +5% -15% -20% -15% Adjusted Unit Price $67.99 $74.81 $73.50 $73.15 $73.19 $68.58
After adjustment, the comparables display a range in unit prices from $67.99 to $74.81 per square foot, with an average of $71.87 per square foot and a median of $71.17 per square foot of rentable area. In this instance, each of the comparables is deemed to provide insight into the subject’s market value. As such, I have placed equal weight on each of the sales and conclude to a value near the center of the range. Conclusion: Based on the available market data, I have estimated the subject’s fee simple unit value to be $71.00 per square foot of net rentable area. This equates to a fee simple market value estimate of $10,400,000 (146,342 SF x $71.00/SF = $10,390,282, rounded to $10,400,000). Therefore, the retrospective market value estimate for the fee simple estate in the subject property, as derived through the Sales Comparison Approach, as of February 28, 2007, is:
TEN MILLION FOUR HUNDRED THOUSAND DOLLARS
($10,400,000)

109
RECONCILIATION AND FINAL VALUE ESTIMATE The appraiser considered the three traditional approaches to value in my estimation of market value for the subject property. The resulting estimates are presented below: Income Capitalization Approach: $10,600,000 Sales Comparison Approach: $10,400,000 Cost Approach: $9,500,000 The value indicated by the Income Capitalization Approach is a reflection of a prudent investor's analysis of an income producing property. In this approach, income is analyzed in terms of quantity, quality, and durability. After a projection of gross economic rental, rental concessions, estimated expenses, and vacancy allowance are deducted to arrive at a net cash flow, which is discounted to present value. Due to the fact that the subject is income producing in nature, this approach has been deemed the most appropriate method of valuing the subject property, and it has been primarily relied upon in my value conclusion. The Sales Comparison Approach reflects an estimate of market value as indicated by the sales of comparable suburban office buildings. In this approach, the appraisers search the local market for transfers of similar type properties. There have been few recent sales of similar properties, as such, secondary consideration was afforded this procedure. The Cost Approach is, on occasion, one of the main steps of the appraisal process. The value indicated by this approach is derived by first estimating the value of the land. Next, the reproduction cost of the improvement, less depreciation from all causes, is deducted. In essence, value by this approach consists of land value plus the depreciated cost of the improvements. Due to the subjectivity associated with estimating accrued depreciation (from all sources) and the limited number of recent land sales in the immediate area, the Cost Approach has limited applicability in determining market value for the subject property. Due to the subjectivity of extracting depreciation from the marketplace, this analysis has been given the least weight. In the final analysis of the subject property, the appraisers have considered the influence of each approach. Since investment purchasers are primarily interested in the monetary benefits of ownership, it has been concluded that the Income Capitalization Approach to value is the most reliable value estimating technique. Based on the available market evidence, I have concluded that the retrospective market value for the fee simple estate in the subject property, as of February 28, 2007, is:
TEN MILLION SIX HUNDRED THOUSAND DOLLARS ($10,600,000)