Embed Size (px)
Citation preview

An Anomaly Behavior Analysis IntrusionDetection System for Wireless Networks
Item Type text; Electronic Thesis
Authors Satam, Pratik
Publisher The University of Arizona.
Rights Copyright © is held by the author. Digital access to this materialis made possible by the University Libraries, University of Arizona.Further transmission, reproduction or presentation (such aspublic display or performance) of protected items is prohibitedexcept with permission of the author.
Download date 27/05/2018 21:53:46
Link to Item http://hdl.handle.net/10150/595654

1
AN ANOMALY BEHAVIOR ANALYSIS
INTRUSION DETECTION SYSTEM
FOR
WIRELESS NETWORKS
By
Pratik Satam
A Dissertation Submitted to the Faculty of the
DEPARTMENT OF ELECTRICAL AND COMPUTER ENGINEERING
In Partial Fulfillment of the Requirements
For the Degree of
MASTER OF SCIENCE
In the Graduate College
THE UNIVERSITY OF ARIZONA
2015

2
STATEMENT BY AUTHOR
This dissertation has been submitted in partial fulfillment of requirements for an advanced
degree at the University of Arizona and is deposited in the University Library to be made
available to borrowers under the rules of the library.
Brief quotations from this dissertation are allowable without special permission, provided that
accurate acknowledgement of the source is made. Requests for permission for extended
quotation from or reproduction of this manuscript in whole or in part may be granted by the
author.
SIGNED: Pratik Satam
APPROVAL BY THESIS DIRECTOR
This thesis has been approved on the date shown below:
__________________________ October 26, 2015
Salim Hariri Date
Electrical and Computer Engineering

3
Contents
List of Figures ............................................................................................................................................ 6
Abstract ........................................................................................................................................................ 8
Chapter 1: Introduction ........................................................................................................................... 10
1.1 Introduction ...................................................................................................................................... 10
1.2 Problem Statement ........................................................................................................................... 12
1.3 Research Objectives .......................................................................................................................... 13
1.4 Dissertation Organization ................................................................................................................. 14
Chapter 2: Background And Related Work ........................................................................................... 15
2.1 Introduction ...................................................................................................................................... 15
2.2 Overview of the Intrusion Detection System Taxonomies: .............................................................. 15
2.2.1 Anomaly Based Intrusion Detection Systems: ............................................................................... 15
2.2.1.1 Self Learning: ............................................................................................................................... 16
2.2.1.2 Programmed: .............................................................................................................................. 16
2.2.2 Signature Based Intrusion Detection Systems: .............................................................................. 17
2.2.3 Compound Detection Systems: ...................................................................................................... 17
2.3 System Characteristics of Intrusion detection Systems: ................................................................... 18
2.3.1 Time of detection: .......................................................................................................................... 18
2.3.2 Granularity of Detection: ............................................................................................................... 18
2.3.3 Source of Audit Data: ..................................................................................................................... 18
2.3.4 Response to detected intrusions: .................................................................................................. 19
2.3.4.1 Passive Response Systems: ......................................................................................................... 19
2.3.4.2 Active Response Systems: ........................................................................................................... 19
2.3.5 Locus of Data Processing: .............................................................................................................. 19
2.3.7 Security: ......................................................................................................................................... 19
2.3.8 Degree of Inter-Operability: ........................................................................................................... 20
2.4 Data Mining: ...................................................................................................................................... 21
Chapter 3: Wi-Fi protocol ........................................................................................................................ 26
3.1 The IEEE 802.11 Standard: ................................................................................................................ 26
3.1.1 IEEE 802.11b: ................................................................................................................................. 26
3.1.2 IEEE 802.11a: .................................................................................................................................. 27
3.1.3 IEEE 802.11g: .................................................................................................................................. 27

4
3.1.4 IEEE 802.11n: ................................................................................................................................. 27
3.1.5 IEEE 802.11ac: ................................................................................................................................ 27
3.2 Architectural Overview: .................................................................................................................... 29
3.2.1 Physical Layer: ................................................................................................................................ 29
3.2.2 Data Link Layer and Frame Structure: ........................................................................................... 32
3.3 Wi-Fi State Machine: ......................................................................................................................... 40
3.4 Related Wi-Fi work: ........................................................................................................................... 41
Chapter 4: Architecture ........................................................................................................................... 43
4.1 Definitions: ........................................................................................................................................ 43
4.1.1 Ngram: ........................................................................................................................................... 43
4.1.2 Wireless Flow: ................................................................................................................................ 45
4.2 Intrusion Detection System with cluster tracking Architecture: ...................................................... 48
4.2.1 Architecture of the system deployed on the Access points: ......................................................... 48
4.2.1.1 Sniffer Module: ........................................................................................................................... 49
4.2.1.2 Behavior Authentication module: ............................................................................................... 49
4.2.1.3 APn location tracking Module: .................................................................................................... 50
4.2.2 Architecture for the system on the Central Controller: ................................................................. 50
4.2.3 Operation Phases of the System: ................................................................................................... 51
4.2.3.1 Training Phase: ............................................................................................................................ 52
4.2.3.2 Detection Phase: ......................................................................................................................... 55
4.3 Intrusion Detection System with tracking using classification algorithm Architecture: ................... 56
4.3.1 Architecture of the system deployed on the Access points: ......................................................... 56
4.3.1.1 Sniffer Module: ........................................................................................................................... 57
4.3.1.2 Behavior Authentication module: ............................................................................................... 57
4.3.1.3 Communication Module: ............................................................................................................ 58
4.3.2 Architecture for the system on the Central Controller: ................................................................. 58
4.3.3 Operation Phases of the System: ................................................................................................... 59
4.3.3.1 Training Phase: ............................................................................................................................ 60
4.3.3. 2 Detection Phase: ........................................................................................................................ 60
4.4 Configurations of Operation of the proposed Architecture: ............................................................ 62
Chapter 5: Experiments and Results ...................................................................................................... 64
5.1 Test Bed: ........................................................................................................................................... 64

5
5.1.1 User Devices: .................................................................................................................................. 68
5.1.2 Attack Devices: ............................................................................................................................... 69
5.1.3 RADIUS SERVER/CENTRAL CONTROLLER: ...................................................................................... 70
5.2 Attacks: ............................................................................................................................................. 71
5.2.1 Aircrack-ng: .................................................................................................................................... 71
5.2.2 Modified Attack: ............................................................................................................................ 71
5.3 Experimentation of the Attack detection and Classification System:............................................... 72
5.3.1 Single Access point Test Bed: ......................................................................................................... 72
5.3.1.1 Training: ...................................................................................................................................... 72
5.3.1.2 Detection Evaluation: .................................................................................................................. 73
5.3.1.2.1 Experiment 1: ........................................................................................................................... 74
5.3.1.2.2 Experiment 2: ........................................................................................................................... 75
5.3.1.2.3 Experiment 3: ........................................................................................................................... 76
5.3.1.2.4 Experiment 4: ........................................................................................................................... 76
5.3.1.2.5 Experiment 5: ........................................................................................................................... 78
5.3.2 Distributed Access point Test Bed: ................................................................................................ 79
5.3.2.1 Training: ...................................................................................................................................... 79
5.3.2.2 Detection Evaluation: .................................................................................................................. 80
5.4 Experimentation of the Power tracking System: .............................................................................. 82
5.4.1 Power tracking Module of Architecture 1: .................................................................................... 82
5.4.1.1 Training: ...................................................................................................................................... 82
5.4.1.2 Detection Evaluation: .................................................................................................................. 83
5.4.2 Power tracking Module of Architecture 2: .................................................................................... 84
5.4.2.1 Training: ...................................................................................................................................... 84
5.4.2.2 Detection Evaluation: .................................................................................................................. 85
Chapter 6: Conclusion and Future Work ............................................................................................... 87
6.1 Conclusion: ........................................................................................................................................ 87
6.2 Future Work: ..................................................................................................................................... 88
References .................................................................................................................................................. 89

6
List of Figures
Figure 1.1: Attack Sophistication vs. Intruder Technical Knowledge
Figure 2.1: Decision Tree
Figure 2.2: Clustering Example
Figure 3.1: Wi-Fi Protocol Architecture
Figure 3.2: 2.4GHz band Channels.
Figure 3.3: Wi-Fi Spectral Mask
Figure 3.4: Wi-Fi Frame structure
Figure 3.5: Wi-Fi Header
Figure 3.6: Wi-Fi State machine.
Figure 4.1: 4 n-gram extraction from the flow.
Figure 4.2: WFlows at different sampling rates
Figure 4.3: IDS and cluster tracking architecture
Figure 4.4: Central Controller Architecture
Figure 4.5: IDS and cluster tracking architecture
Figure 4.6: Central Controller Architecture
Figure 4.7: Mode1 Single Access Point
Figure 4.8: Mode2 Distributed Wi-Fi Network.
Figure 5.1: Test Bed(Single Access Point)
Figure 5.2: Test Bed (Distributed Access Point)
Figure 5.3: NIC
Figure 5.4: TP Link TLSG 1008D Switch
Figure 5.5: User Devices
Figure 5.6: Attacking Device
Figure 5.7. False Negative versus Frame drop rate.
Figure 5.8. Flowscore value to rule comparison.
Figure 5.9: Correct Attack Classification(percentage) versus Frame drop rate.
Figure 5.10: Flowscore value to rule comparison
Figure 5.11: Central Controller Combined Power Map
Figure 5.12: Rules
7
List of Tables
TABLE2.1: Classification Rules
TABLE3.1: IEEE 802.11 Physical Layer Standards
TABLE3.2: Wi-Fi Frame Types
TABLE 5.1: Intrusion Detection System Rules
TABLE 5.2: Wireless Attacks
TABLE 5.3: Intrusion Detection System Rules
TABLE 5.4: Intrusion Detection System Rules
TABLE 5.5: Wireless Attacks used for Power tracking module Evaluation

8
ABSTRACT
Wireless networks have become ubiquitous, where a wide range of mobile devices are connected
to a larger network like the Internet via wireless communications. One widely used wireless
communication standard is the IEEE 802.11 protocol, popularly called Wi-Fi. Over the years, the
802.11 has been upgraded to different versions. But most of these upgrades have been focused
on the improvement of the throughput of the protocol and not enhancing the security of the
protocol, thus leaving the protocol vulnerable to attacks. The goal of this research is to develop
and implement an intrusion detection system based on anomaly behavior analysis that can detect
accurately attacks on the Wi-Fi networks and track the location of the attacker.
As a part of this thesis we present two architectures to develop an anomaly based intrusion
detection system for single access point and distributed Wi-Fi networks. These architectures can
detect attacks on Wi-Fi networks, classify the attacks and track the location of the attacker once
the attack has been detected. The system uses statistical and probability techniques associated
with temporal wireless protocol transitions, that we refer to as Wireless Flows (Wflows). The
Wflows are modeled and stored as a sequence of n-grams within a given period of analysis. We
studied two approaches to track the location of the attacker. In the first approach, we use a
clustering approach to generate power maps that can be used to track the location of the user
accessing the Wi-Fi network. In the second approach, we use classification algorithms to track
the location of the user from a Central Controller Unit. Experimental results show that the attack
detection and classification algorithms generate no false positives and no false negatives even
when the Wi-Fi network has high frame drop rates. The Clustering approach for location
tracking was found to perform highly accurate in static environments (81% accuracy) but the

9
performance rapidly deteriorates with the changes in the environment. While the classification
algorithm to track the location of the user at the Central Controller/RADIUS server was seen to
perform with lesser accuracy then the clustering approach(76% accuracy) but the system’s ability
to track the location of the user deteriorated less rapidly with changes in the operating
environment.

10
CHAPTER 1: INTRODUCTION
1.1 Introduction
Defense of computer networks has become an extremely important issue due to the exponential
growth in attack’s complexity, sophistication and speed. With the advent of Internet of
Things(IoT)[9][10] [11] [12] [13] [14] and the Cloud Computing[15][16][17] [18] and mobile
computing[2], gone are the days when the user would depend on an Ethernet connection to a
computer network via a desktop computer. Most of current users access computer networks via
wireless technologies that are ubiquitously available to their mobile devices (e.g., smart phones).
Cisco predicts that mobile data traffic will increase 10- fold between 2014 and 2019 reaching
24.3 Exabytes per month by 2019[1]. According to a statistical analysis by Mike Roberts, Wi-Fi
continues to be a critical network, wherein accounting for 70% of data usage of smart phones [2].
Infroma.com[3] predicts that the number of Wi-Fi hotspots will be hitting 5.8 million by the year
2015. Also there has been a growth in the number of public Wi-Fi hotspots deployed globally
and Distributed Wi-Fi hotspots in various institutional campuses. This ever-growing size of the
computer networks has also been companioned by an increase in attack’s sophistication. This
increase in network size and availability has also resulted in easy of availability of attack tools
and knowledge to attackers. Thus an attacker with little or no technical knowledge can
effectively execute sophisticated attacks with the help of tools obtained over the computer
networks like the Internet[4].This trend has been highlighted by Figure 1.1 below,

11
Figure 1.1: Attack Sophistication vs. Intruder Technical Knowledge
This ever-growing growth of Wi-Fi networks and ever increasing attack sophistication needs the
development of an intrusion detection system that is able to detect attacks on the Wi-Fi networks.

12
1.2 Problem Statement
In this thesis we study the following problems:
“We pursue to build an intrusion detection system for distributed Wi-Fi networks that uses
anomaly based detection approach which can detect accurately new and modified attacks with no
false positives and no false negatives. Also, our approach can detect the location of the actual
user who launched the detected attack on the distributed Wi-Fi network.”
Hamid el at. [5] assumed that different protocols follow a stateful approach and that any
unwarranted state transitions of the protocol could be classified as an attack. We use this
approach for the Wi-Fi protocol, where in the Wi-Fi network follows a stateful approach and any
unwarranted state transitions made by the protocol is classified as an attack. Hamid el at [1]
implemented this approach on a Wi-Fi network with a single access point. As a part of this
research, we have expanded this approach to a distributed Wi-Fi network. We have used
machine-learning algorithms to analyze normal behaviors and generate rules to detect attacks on
these networks. Moreover as a part of this research, we were able to expand this approach to
detect the location of the actual user once the attack had been launched over the network.

13
1.3 Research Objectives
The main research objectives are twofold 1) Development of an anomaly based intrusion
detection system for single access point and distributed Wi-Fi networks, that is highly accurate in
detection, is able to detect new and zero day attacks and has low false positives and no false
negatives; and 2) Development of a tracking system that is able to track the location of the actual
user and is able to separate the location of the attacker from the normal users using machine
learning approach.
The proposed approach will result in the development of online runtime monitoring modules that
will monitor illegal exploitations of existing vulnerabilities in the IEEE 802.11 protocol and use
the rules obtained during the machine learning stage to detect an attack, classify the attack and
then detect the location of the attacker.

14
1.4 Dissertation Organization
The remaining chapters of the dissertation are as follows:
Chapter 2 describes the background and the related work to intrusion detection systems and data
mining. In Chapter 3, we review the IEEE 802.11 (Wi-Fi protocol) in depth. In Chapter 3 we
also discuss other intrusion detection systems for the Wi-Fi protocol. In Chapter 4, we discuss
the architectures that were designed as a part of this research. In Chapter 5, we discuss
experimental results pertaining to the presented architectures. In Chapter 6, we discuss
conclusion and future work.

15
CHAPTER 2: BACKGROUND AND RELATED WORK
2.1 Introduction
In this dissertation we present two architectures for an anomaly based intrusion detection system
for single access point and distributed Wi-Fi networks. In this chapter we present related work
and background for these architectures. We review intrusion detection systems, various types of
classification techniques, machine learning approaches and algorithms.
2.2 Overview of the Intrusion Detection System Taxonomies:
Axelsson, el at. [6] presented a completed taxonomy of intrusion detection systems. According to
Axelsson, Intrusion Detection Systems are like ‘Burglar Alarms’, which are built with the aim of
protecting the system against attacks by sounding a warning system on detection of an attack.
He suggested that intrusion detection systems can be of three major types.
2.2.1 Anomaly Based Intrusion Detection Systems:
In case of anomaly based intrusion detection systems [28][29][30][31], the intrusion detection
system is designed such that it has an understanding of the normal behavior of the system. Such
systems also make an inherent assumption that any abnormal behavior that is observed is a threat
to the network. Designing and implementation of this kind of systems generally begins with
collection of information on what constitutes normal behavior for the network and what
constitutes abnormal behavior for the network. Anomaly based intrusion detection systems can

16
be classified into two types depending on the method in which the previously mentioned
behavior analysis takes place. The two types are discussed below.
2.2.1.1 Self Learning:
Self-learning systems as the name suggests perform the task of learning the normal behavior and
the abnormal behavior on their own. They observe the network at the runtime and have the
capabilities to judge the parameters that are characteristics of the network for normal behavior
and abnormal behavior in accordance with the model on which the intrusion detection system has
been designed. The systems that fall in this category may use different approaches to model the
normal behavior and the abnormal behavior of the network. Some of the approaches involve the
use of stochastic modeling, which may involve formulation of rules that are able to mark the
conditions of normality of the systems or the use of distance vectors to measure the difference of
certain traffic parameters that is measured at the runtime with the traffic parameters that are
measured during the learning process. Some other approaches involve measuring the operation
of the network keeping into account timed behavior of the network. This can be done modeling
the network as an artificial neural network, which is able to learn the normal behavior of the
system and the abnormal behavior of the system.
2.2.1.2 Programmed:
In case of a programmed intrusion detection system, a third party other than the original intrusion
detection system itself, teaches the system by feeding it with information to detect abnormal

17
events. This is generally done by feeding the system with different parameters that have
statistical values that help deciding if the system is operating normally or not.
2.2.2 Signature Based Intrusion Detection Systems:
The signature based intrusion detection system [19][20][21][22][23][24][25][26][27]operate on
the knowledge obtained from analyzing the behavior of known intrusions on the network. In
such a system, the system checks for signs of previously known attacks or intrusions where their
signatures are stored in its database. On a match, the intrusion detection system gives an alert. In
a signature based intrusion detection system, the system does not have information regarding the
normal and the abnormal behavior of the network. The Intrusion detection systems of this type
are programmed intrusion detection systems, where in the intrusions are programmed as either
state based models, or audit event (string matching models).
2.2.3 Compound Detection Systems:
Compound detectors are built of a composite of a signature based intrusion detection system and
an anomaly based intrusion detection system. These systems generally use signature based
detection on normal traffic.

18
2.3 System Characteristics of Intrusion detection Systems:
System characteristics of intrusion detection systems are independent of the type of detection the
intrusion detection system performs. These characteristics are discussed below.
2.3.1 Time of detection:
Intrusion Detection Systems can be either Real Time(Near Real Time) Intrusion Detection
Systems or Non Real Time Intrusion Detection Systems. The Real Time detection Systems are
systems that check for Intrusions at runtime and thus respond to attacks in a timely manner.
However, these systems must run their algorithms with low overhead to be deployed. Non Real
Time Intrusion Detection Systems analyze network traffic offline and can run very sophisticated
models to improve detection and accuracy.
2.3.2 Granularity of Detection:
Granularity of Detection is the smallest unit of Data that is processed by the Intrusion Detection
System. The Intrusion Detection System can process data continuously or in small groups or
batches.
2.3.3 Source of Audit Data:
Source of Audit Data is the data input source for the Intrusion Detection system. Source of Audit
Data is either network packets tapped directly from the network interface or system logs like
Kernel logs that are maintained by the operating system.

19
2.3.4 Response to detected intrusions:
Based on the Response to detected intrusions, Intrusion Detection Systems can be of two types:
Passive and Active systems, which are discussed below.
2.3.4.1 Passive Response Systems:
Passive response systems are Intrusion Detection Systems that respond to detection of an
Intrusion on the network by sending an Alarm. They warn the user of the attack but they do not
take any preventive or countermeasures against the detected attacks.
2.3.4.2 Active Response Systems:
Active Response Systems are Intrusion Detection Systems that respond to detection of an
Intrusion on the network by sending an alarm and then taking counter measures against the
detected attack. The counter measures range from closing of the network connections, to even
attacking the resources used by the attacker.
2.3.5 Locus of Data Processing:
The data processed in the Intrusion Detection System can be either performed at a central
location or at distributed locations.
2.3.6 Security:
This is to measure the security of the Intrusion Detection System itself from attacks.
20
2.3.7 Degree of Inter-Operability:
This is a measure of the Intrusion Detection Systems ability to operate with other Intrusion
Detection Systems.

21
2.4 Data Mining:
The amount of data that is collected in databases today is growing exponentially. This increase in
the amount of data that is collected in databases can be attributed to many reasons, such as the
increasing computing power, the increase in the channel capacity of computer networks, faster
memory devices, to just mention a few. It has been observed that as the size of data increases, the
ability of a human to make sense out of the data decreases rapidly. This brought about the need
for means to process the data and obtain knowledge from mining and analyzing the collected
data.
Data Mining is the process of finding patterns in data sets by the means of use of various data
mining algorithms. The data mining process can be automatic or semi-automatic involving
human interference. These algorithms are used to learn patterns from the data and thus learn
conditions or patterns of behavior that help in prediction of a behavior of another data set having
similar patterns.
The event space in data mining algorithms [32][33][34][35]represents the space or the set that
holds all the events or the data points that are to be analyzed. Data mining could be viewed as a
search to look for conditional statements that are able to group all the elements of the set with
correct descriptions.
Machine learning algorithms are given inputs in the form of files that hold data in the form of
rows and columns. The rows describe specific instances, while the columns describe different
attributes. The attributes that are selected to represent the data set to be used by the data mining
algorithm are typically defined by a process called Attribute Selection[36].
Once the processing of the data in the databases is completed by the use of data mining
algorithms, the obtained results need to be represented in a readable format. There are a number
22
of means by which the results of data mining on a particular data set can be represented. The
methods in which these results can be represented are discussed below.
Decision tables are the easiest means to represent the output of the learning algorithms. It is a
table with conditions in the first column and the result of the machine learning algorithm in the
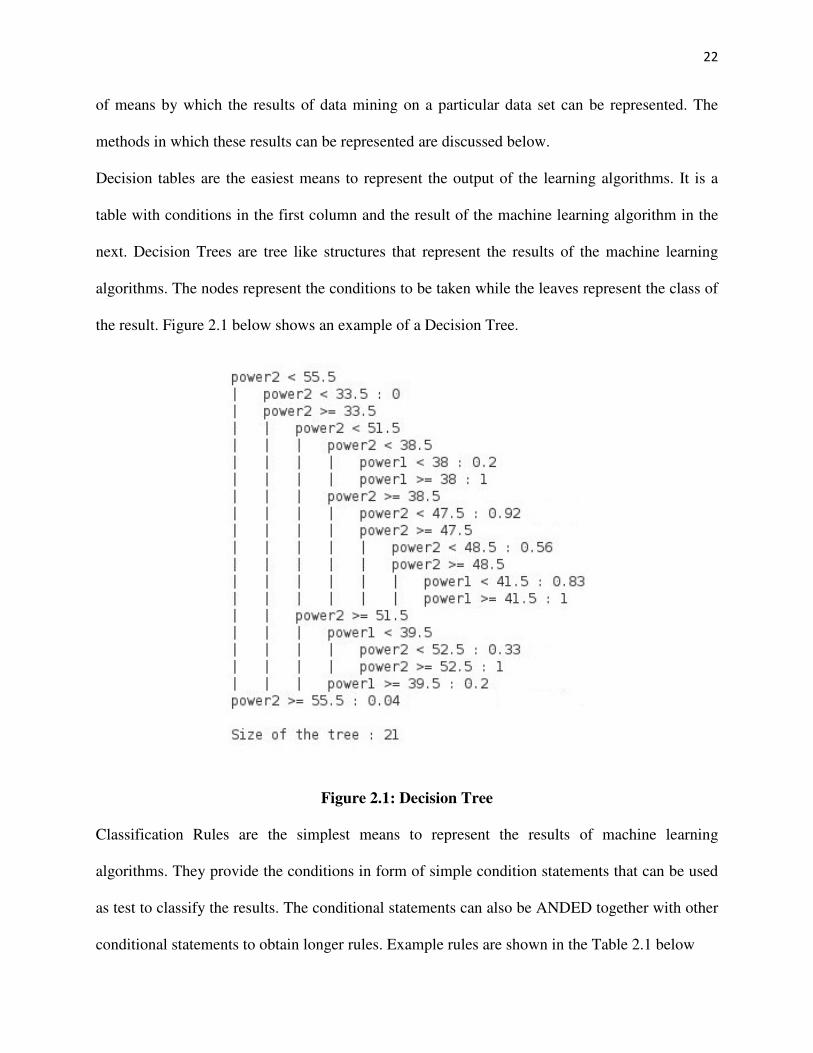
next. Decision Trees are tree like structures that represent the results of the machine learning
algorithms. The nodes represent the conditions to be taken while the leaves represent the class of
the result. Figure 2.1 below shows an example of a Decision Tree.
Figure 2.1: Decision Tree
Classification Rules are the simplest means to represent the results of machine learning
algorithms. They provide the conditions in form of simple condition statements that can be used
as test to classify the results. The conditional statements can also be ANDED together with other
conditional statements to obtain longer rules. Example rules are shown in the Table 2.1 below

23
Table 2.1: Classification Rules
RULES: IF FS1<97 AND FS2> 279732 AND FS3>1020 THEN TRAFFIC IS NORMAL;
Clusters are obtained as a result of machine learning when a clustering algorithm is used instead
of a classification algorithm. The Clusters that are obtained help representing the distance of the
instance from the center of the cluster. Clusters can be mapped in two dimensional space which
is the simplest form to represent the cluster. The clusters could also be represented in multi
dimensional space. Figure 2.2 below shows an example of a cluster representation.

24
Figure 2.2: Clustering Example
Learning Types:
According to Witten and Frank el at[7] three different types machine learning approaches. The
choice of the approach used depends on the type of data that is being processed and the
application of the resulting conditions or rules from machine learning. These machine learning
approaches are discussed below.

25
Classification Learning:
Classification learning involves using algorithms to understand the conditions which allow
classification of unseen examples into predefined classes. Thus classification learning allows
default classification of the unseen data into different classes.
Association Learning:
Association Learning allows the building of associations between different unseen examples by
predicting attributes as well as classes. Association learning helps in learning strong rules of
association between attributes and not just their classes. Association learning involves use of
different algorithms like Apriori Algorithm[37], Eclat Algorithm[38], FP-growth Algorithm [39].
Clustering:
Clustering is the process of grouping together objects that are similar to each other more than
other objects. Clustering is generally distance based, where in the clusters are judged depending
on the center of the clusters. Clustering is generally Centroid based clustering, Distribution-
based clustering or Density-based clustering. Some of the clustering methods include k-means
clustering[40][41].

26
CHAPTER 3: WI-FI PROTOCOL
Wi-Fi protocol also known as the IEEE802.11[42] [43][44][45][46][47] is a wireless local area
network protocol. It is the Ethernet’s equivalent for wireless networks. The protocol was first
formalized in the year 1997. This protocol over the years of its existence has been upgraded and
has faced many changes. But most of these upgrades have been to enhance the data rate and the
link quality of the network and little has been done to improve the security of the network.
3.1 The IEEE 802.11 Standard:
The Wi-Fi protocol[42] operates in the 2.4 GHz UHF and the 5 GHz SHF bands both of which
fall under the category of ISM bands and hence have been sanctioned for unlicensed use. The
original Wi-Fi protocol that was declared in the year 1997 specified bit rates of 1 or 2 Mbits/s
while specifying 3 alternate physical layer configurations which were Diffuse infrared at 1Mbps,
Frequency Hopping Spread Spectrum (FHSS) at 1 Mbps or 2 Mbps, Direct Sequence Spread
Spectrum (DSSS) at 1 Mbps or 2 Mbps.
3.1.1 IEEE 802.11b:
This specification of the protocol [44] supports a maximum data rate of 11 Mbps using the same
physical specifications as the original Wi-Fi protocol. This protocol supported the use of the
DSSS in the 2.4 GHz UHF ISM band. Carrier Sense Multiple Access/ Collision Avoidance
(CSMA/CA) is the protocol that is used to manage the media access.

27
3.1.2 IEEE 802.11a:
This standard was added to the original 802.11 protocol in the year 1999[43]. This standard
specified the operations of the Wi-Fi in the 5 GHz SHF supporting 52 subcarrier Orthogonal
Frequency Division Multiplexing supporting data rates upto 54Mbps.
3.1.3 IEEE 802.11g:
This standard was ratified to the original 802.11 protocol in the year 2003[45]. This standard
increased the data rate in the 2.4GHz UHF ISM band to 54Mbps. This was done by the adoption
of the use of Orthogonal Frequency Division Multiplexing (OFDM).
3.1.4 IEEE 802.11n:
This enhancement to the 802.11 protocol enhanced the data rates up to 600Mbps[46]. This
increase in data rate is achieved by the use of multiple data streams with channels widths of
40MHz. It can operate in the 2.4GHz UHF ISM band and the 5 GHz SHF band. Moreover one of
the enhancements that have been added includes the use of multiple antennas that allows
seamless maintenance of simultaneous data streams.
3.1.5IEEE 802.11ac:
This standard was approved in the year 2014[47]. This protocol processes that each single link to
have a throughput of 500 Mbps while overall throughput for a multi-station WLAN would be at
least 1 Gbps. This increase in throughput is achieved by the use of wider channels, and up to 8
MIMO spatial streams and use of 256 QAM.
28
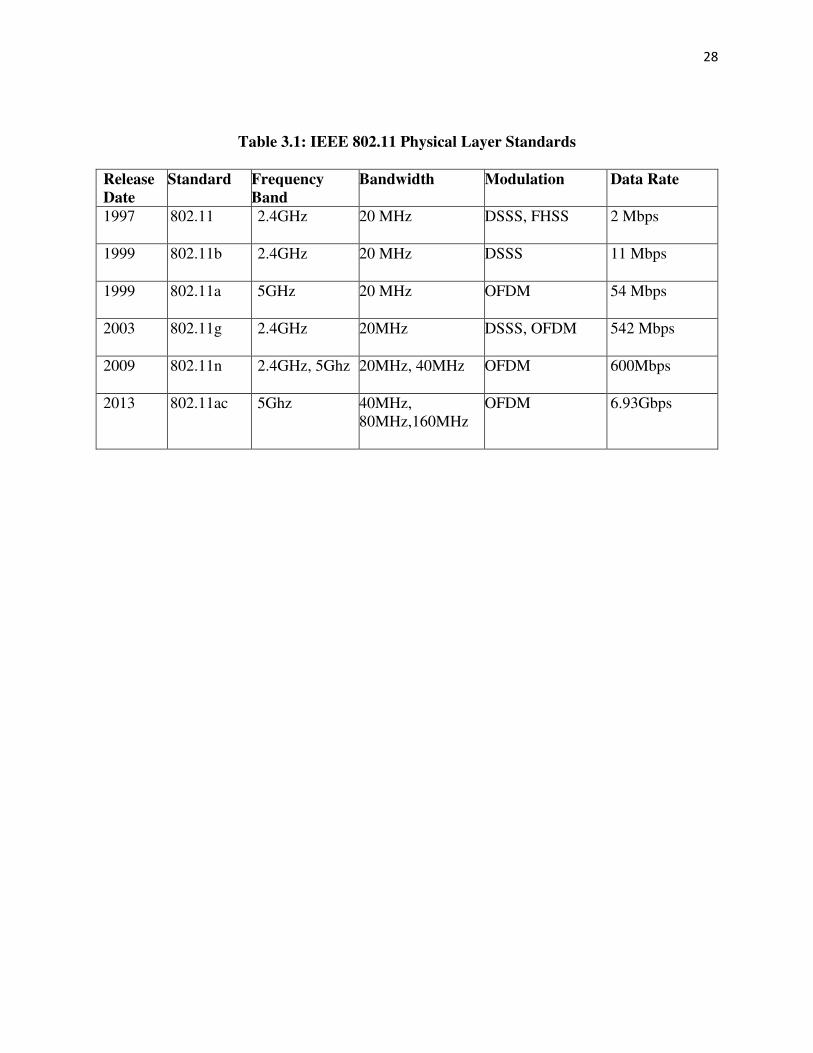
Table 3.1: IEEE 802.11 Physical Layer Standards
Release
Date
Standard Frequency
Band
Bandwidth Modulation Data Rate
1997
802.11 2.4GHz 20 MHz DSSS, FHSS 2 Mbps
1999
802.11b 2.4GHz 20 MHz DSSS 11 Mbps
1999
802.11a 5GHz 20 MHz OFDM 54 Mbps
2003
802.11g 2.4GHz 20MHz DSSS, OFDM 542 Mbps
2009
802.11n 2.4GHz, 5Ghz 20MHz, 40MHz OFDM 600Mbps
2013
802.11ac 5Ghz 40MHz,
80MHz,160MHz
OFDM 6.93Gbps
29
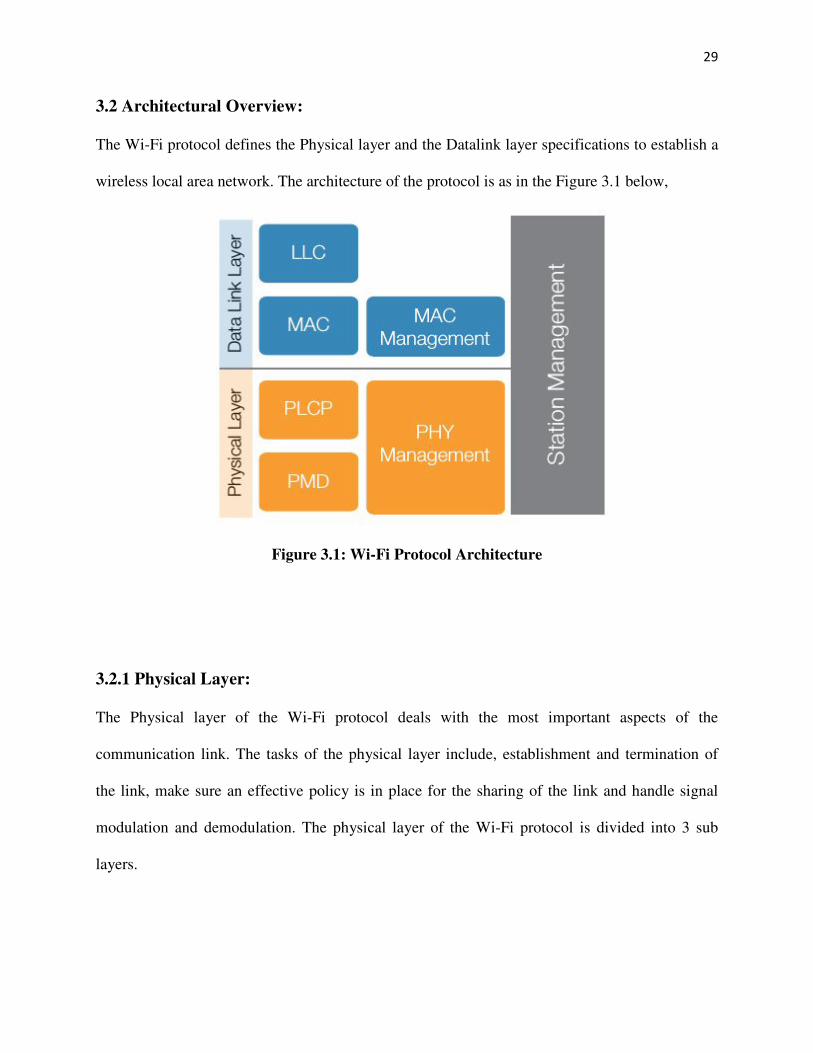
3.2 Architectural Overview:
The Wi-Fi protocol defines the Physical layer and the Datalink layer specifications to establish a
wireless local area network. The architecture of the protocol is as in the Figure 3.1 below,
Figure 3.1: Wi-Fi Protocol Architecture
3.2.1 Physical Layer:
The Physical layer of the Wi-Fi protocol deals with the most important aspects of the
communication link. The tasks of the physical layer include, establishment and termination of
the link, make sure an effective policy is in place for the sharing of the link and handle signal
modulation and demodulation. The physical layer of the Wi-Fi protocol is divided into 3 sub
layers.

30
a. Physical layer Convergence Procedure (PLCP):
This is the layer that hides the lower physical layer activities like the modulation types and the
channel data rates from the upper layer of the OSI model. It is also responsible to ensure proper
channel sharing and packet building.
b. Physical Medium Dependent (PMD):
This is the layer that varies according to the IEEE 802.11 standard variation and is responsible
for implementation of modulators, demodulators and the coding techniques.
c. The Physical Management layer:
The Physical Management Layer is involved in the task of link management. It ensures proper
tuning of the modulators and the demodulators to the required frequencies.
d. Channel Allocation and Bandwidths:
The 802.11b, 802.11g, and the low frequency part of the 802.11n, use the 2.4GHz band located
in the ISM spectrum, while 802.11a, 802.11ac, use the 5GHz band. The 2.4 GHz band is
subdivided into 14 overlapping subbands each space 5MHz apart as shown in the Figure 3.2
below.

31
Figure 3.2: 2.4GHz band Channels.
The 5GHz band is split into different sub bands depending on the country of operation. The
bandwidths of each of the channels is either 20MHz for the lower frequency band and 40 MHz
for the higher frequency bands. In the case of the 802.11ac which supports 80MHz channels two
adjacent 40MHz channels are used as a single channel.
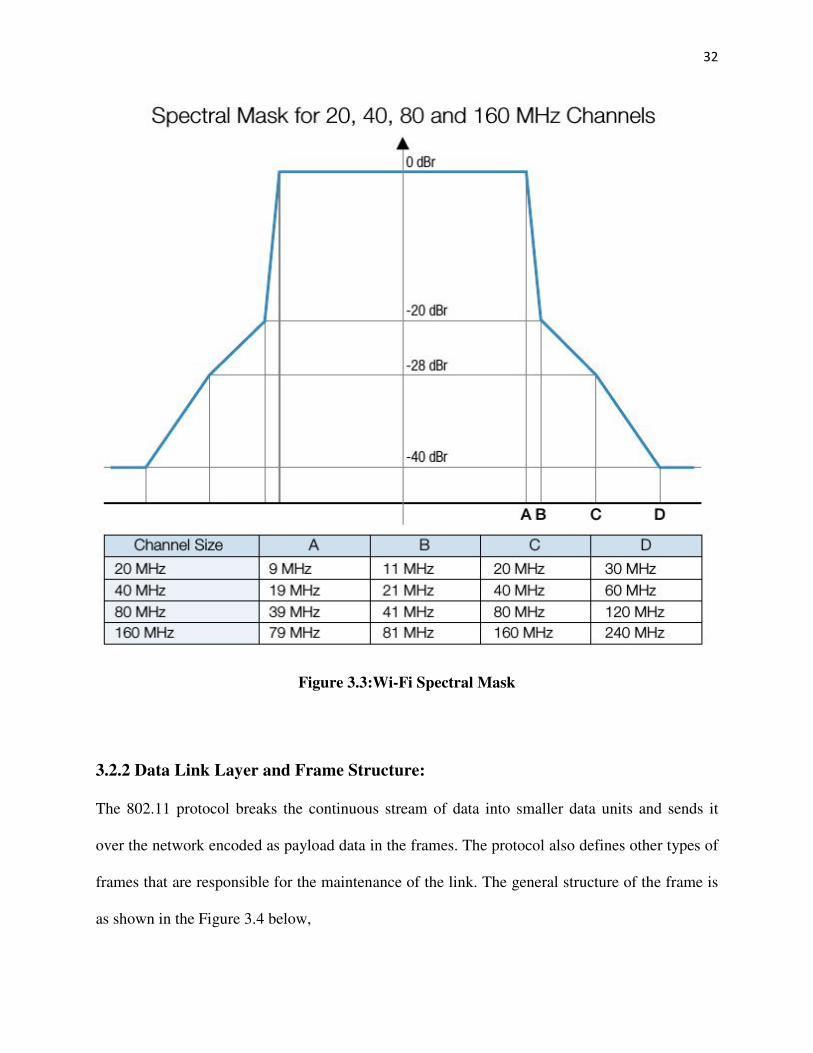
e. Spectral Masks:
The 802.11 is a protocol that operates in unlicensed band of communication. Thus to ensure error
free operation of multiple links in the same band, the protocol specifies a spectral mask which
describes the manner in which the signal strength should attenuate with frequency offsets from
the central frequency. The OFDM spectral mask used by 802.11 a/g/n/ac is specified in the
Figure 3.3 below.
32
Figure 3.3:Wi-Fi Spectral Mask
3.2.2 Data Link Layer and Frame Structure:
The 802.11 protocol breaks the continuous stream of data into smaller data units and sends it
over the network encoded as payload data in the frames. The protocol also defines other types of
frames that are responsible for the maintenance of the link. The general structure of the frame is
as shown in the Figure 3.4 below,

33
Figure 3.4: Wi-Fi Frame structure
a. Preamble:
The preamble is the first set of bit sequence that follows the actual header. The preamble marks
the start of the frame. The preamble allows the receiver frequency synchronization and receiver
time synchronization. This helps the receiver extract the header and the data from the modulated
signals that are sent over the channel.
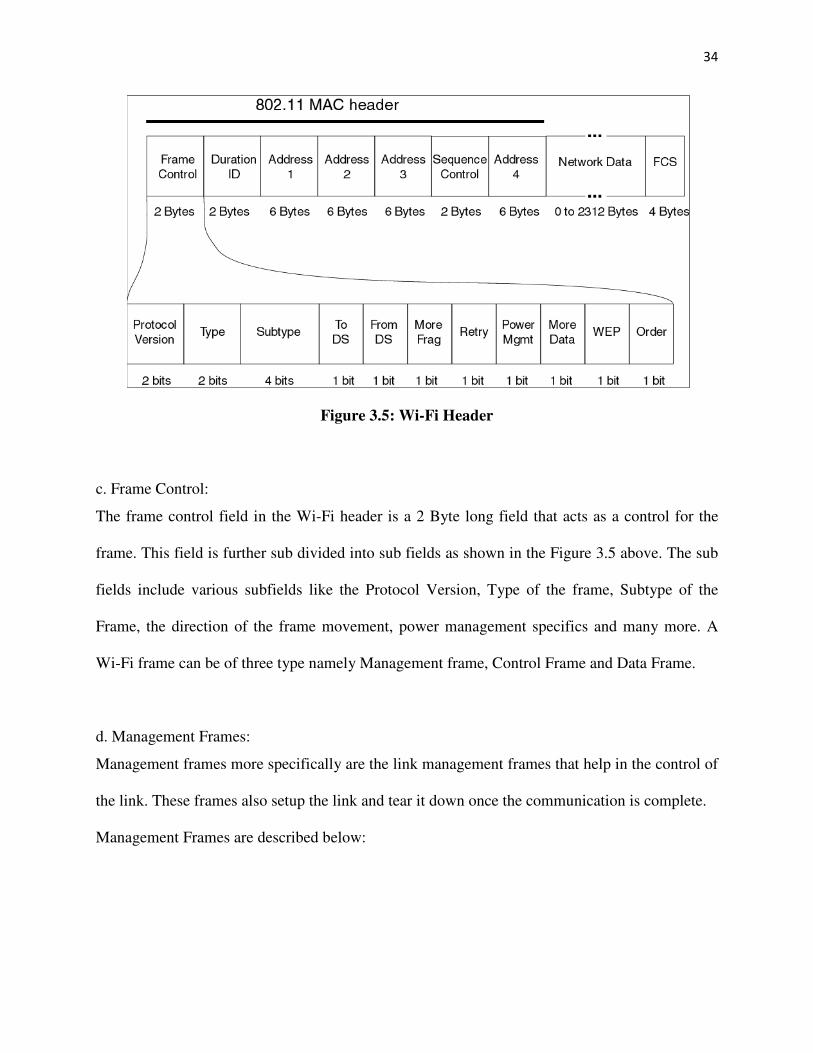
b. Header:
The Wi-Fi Header is made up of a 2 Byte frame control field, a 2 Byte Duration ID, 48 bit long
address fields which include the source and the destination address fields. The structure of the
Wi-Fi frame header is as shown in the Figure 3.5 below.
34
Figure 3.5: Wi-Fi Header
c. Frame Control:
The frame control field in the Wi-Fi header is a 2 Byte long field that acts as a control for the
frame. This field is further sub divided into sub fields as shown in the Figure 3.5 above. The sub
fields include various subfields like the Protocol Version, Type of the frame, Subtype of the
Frame, the direction of the frame movement, power management specifics and many more. A
Wi-Fi frame can be of three type namely Management frame, Control Frame and Data Frame.
d. Management Frames:
Management frames more specifically are the link management frames that help in the control of
the link. These frames also setup the link and tear it down once the communication is complete.
Management Frames are described below:

35
e. Authentication Frame:
An exchange of authentication frame takes place with an access point when the link setup
between the access point and the user device takes place. It helps in establishment of the identity
of the device connecting to the network.
f. Association Request Frame:
This Frame informs the access point that the device is ready to send data on the network and
hence the access point allocates resources for the device.
g. Association Response Frame:
This frame is sent by the access point in response to the Association Request Frame. The
response frame may be a positive response or a negative response to the device.
i. Beacon Frame:
This is the frame that is broadcast by the access point after a fixed interval of time. This frame
informs the devices that are trying to connect to the access point of the various characteristics of
the access point, like the name, the operating frequency, the transfer rates, Type of encryption
scheme used and more.
j. De-Authentication Frame:
De-Authentication Frame is a complement of the Authentication frame. It is the frame that is sent
over the network by the user device to the access point when the user device wants to disconnect
from the network.

36
k. Disassociation Frame:
Disassociation Frame is a complement of the Association Frame. It informs the access point that
it can de-allocate the resources that it had allocated for the device as the device no longer plans
to use the network.
l. Probe Request Frame:
This frame is sent from a station to another station to get information of that station.
m. Probe Response Frame:
Probe response frame is the response sent by a station for the probe request.
n. Reassociation Request Frame:
Reassociation Request Frame is a frame that is sent when a device moves out of the range of one
access point and moves into the range of another. The device sends a Reassociation request to
another access point with signal strength more than the current access point.
o. Reassociation Response Frame:
This is the response frame that is sent in response to the Reassociation Request. The response
may be a positive response or a negative response.
p. Control Frame:
The control frames are sent over the network and control the contention issues of the network.
q. Acknowledgement (ACK) Frame:
On the reception of a data frames the device sends an acknowledgement frame to the source.

37
r. Request to Send (RTS) Frame:
It is the request to send that acts as an optional contention control over the network.
s. Clear to Send (CTS) Frame:
It is the optional Clear to Send Frame that is sent in response to the Request to Send Frame.
t. Data Frame:
The Data frames are the frames that are used to move the data from the source to the destination.
They generally carry higher level protocols in their data sections.
Table 3.2: Wi-Fi Frame Types
Frame Name Frame Type/Subtype
Association Request Frame 0
Association Response Frame 1
Reassociation Request Frame 2
Reassociation Response Frame 3
Probe Request Frame 4
Probe Response Frame 5
Beacon Frame 8
Announcement traffic indication map(ATIM)
Frame
9
Disassociate Frame 10
Authentication Frame 11
Deauthentication Frame 12

38
Action Frame 13
Block ACK Request Frame 24
Block ACK Frame 25
Power Save Poll Frame 26
Request to Send Frame 27
Clear to Send Frame 28
ACK Frame 29
Contention Free Period End Frame 30
Contention Free Period End ACK Frame 31
Data + Contention Free ACK Frame 33
Data + Contention Free Poll Frame 34
Data + Contention Free ACK + Contention
Free Poll Frame
35
NULL Data Frame 36
NULL Data + Contention Free ACK Frame 37
NULL Data + Contention Free Poll Frame 38
NULL Data + Contention Free ACK +
Contention Free Poll Frame
39
QOS Data Frame 40
QOS Data + Contention Free ACK Frame 41
QOS Data + Contention Free Poll Frame 42
QOS Data + Contention Free ACK +
Contention Free Poll Frame
43

39
NULL QOS Data Frame 44
NULL QOS Data + Contention Free Poll
Frame
46
NULL QOS Data + Contention Free ACK +
Contention Free Poll Frame
47

40
3.3 Wi-Fi State Machine:
The Wi-Fi protocols is a stateful protocol that is, each transition in the protocol follows state
machine. The Wi-Fi state machine is as shown below.
Figure 3.6: Wi-Fi State machine.

41
As seen in Figure 3.6 above the Wi-Fi state machine has 3 different states. State1 is the
unauthenticated and unassociated state. In this state of operation of the Wi-Fi- device, it is not
connected to the network. State2 is the Authenticated and Unassociated state. In this state of
operation of the device is connected to the network but the access point has no resources
allocated to for that device in the access point. In the state3 of operation, the device is
Authenticated and is also Associated to the network. This allows the device to send the traffic
over the network.
3.4 Related Wi-Fi work:
Depending on the layer on which the Intrusion Detection System (IDS) focuses on, we can
classify them into 3 types: 1) physical layer based IDS[48][49][50][51][52], 2) MAC layer based
IDS [53][54][55][56], and 3) physical layer and data link layer based IDS [57]. Most of the
approaches to detect the physical layer attacks on the Wi-Fi network involve the use of signal
strength or multiple antennas to detect the angle of the attack on the Wi-Fi network. This method
can efficiently detect attacks on the physical layer of the Wi-Fi network such as network
jamming or detect attacks on the data link layer as in MAC address spoofing. This approach is
complex because it takes into account the effects of signal fading, noise, changes in the medium,
and effects due to the movement of the target. This may negatively affect the performance of the
intrusion detection system. The intrusion detection systems that operate on the data link layer use
the data obtained from the Wi-Fi frame to detect attacks. Open source intrusion detection
systems like Snort and most of the commercial Intrusion detection systems available like
AirMagnet[58] and some detection engines in Air Defense[59] use the misuse detection
approach to detect Wi-Fi attacks. But as this approach involves the use of attack signatures to
detect attacks, modified attacks or zero day attacks cannot be detected by these methods. Alipour

42
el at[60] proposed an anomaly based intrusion detection system to detect attacks on Wi-Fi
networks with single access points. In this method, he uses the normal traffic of the network and
machine learning to detect attacks on the system. In this paper we extend the work in [60] and
present an anomaly based intrusion detection system that uses not only the normal traffic but also
uses known attack traffic to detect attacks on distributed Wi-Fi networks. This approach achieves
a high attack detection rate with low false positives against a wide range of Wi-Fi attacks. Also
this extension contains an architecture that is able to track the location of the attacker and the
actual user once the attack has been detected.
In [61] the authors focus on the use of the round trip time (RTT) of the signal to track down the
location of the user from the access point. In [49] the authors use the signal strength of the
received signal to track spoofing attacks. In their work, the authors profile the received signal
using Gaussian Mixture models. Then the profiles that are generated by the use of these models
for each transmitter used to detect spoofing attacks on the networks. In this paper we present a
similar approach to track the location of the attacking device. The system uses the signal strength
to track the location of the attacker once the attack on the network has been detected. In our
method, we use machine learning algorithms to generate profiles for different access points.

43
CHAPTER 4: ARCHITECTURE
Below we present two anomaly based intrusion detection system for a Wi-Fi network. The
intrusion detection systems uses machine learning to understand the behavior of the network.
These two intrusion detection systems use two different architectures to track the location of the
attacking device once the attack on the network has been detected. Each of the intrusion
detection systems can operate in two modes. In the first mode the intrusion detection system is
able to detect attacks and track the location of the attackers when the network in a non
distributed Wi-Fi networks. In the second mode of operation the intrusion detection system is
able to detect attacks on distributed Wi-Fi networks and track the location of the attacker. In the
second mode of operation, the intrusion detection systems are deployed on each of the
accesspoints that are deployed in the test environment.
4.1 Definitions:
Presented below are some common definitions of terms that are used in the architecture.
4.1.1 Ngram:
As stated in the section 3.3 the Wi-Fi protocol is a stateful protocol. Hence Wi-Fi follows a
specific state machine and moves from the one state to another in a predictive manner. We use
the n-gram concept [60] to model the temporal transitions of Wi-Fi frames among the finite state
diagram shown in Figure 3.6.This modeling allows the Intrusion Detection System to track the
transition of the protocol along the state machine, thus allowing the IDS to monitor the behavior

44
of the state machine. Each n-gram has a predefined size where in the size of the n-gram gives the
amount of previous transitions the n-gram tracks. For example, a 2-gram, represents two
consecutive transitions of Wi-Fi frames.
For the Wi-Fi protocol the overall type of the frame is used to decide the state of the protocol.
The overall type of a Wi-Fi frame is decided by the combination of frame type and the frame
subtype field in the Wi-Fi protocol header. For example a De-Authentication frame is of type 8.
Each Wi-Fi frame has its type which is decided by combining the frame type and subtype fields
in the Wi-Fi header.
Hence an n-gram of size n has n types of consecutive Wi-Fi frame types in it. For example 4
consecutive beacon frames will form a 4-gram with following sequence 8888. The concept of
formation of an n-gram from a flow of Wi-Fi frames is as shown in the Figure 4.1 below.

45
Figure 4.1: 4 n-gram extraction from the flow.
4.1.2 Wireless Flow:
There is a continuous flow of Wi-Fi frames in a Wi-Fi link between the access point and the
network device. The frames that constitute this flow of traffic are of the three types of Wi-Fi
frames. These flows of frames help track the state transition of the Wi-Fi state machine. This
continuous flow of frames is sampled at a rate� is represented by a data structure called as the
WirelessFlow(Wflow).
The sampling rate of the traffic affects the size of the WirelessFlow and sensitivity of the
Intrusion Detection System(IDS) to attacks. A slower sampling rate increases the number of

46
frames that constitute a flow thus increasing the size of the data structure Wflow but at the same
time also increases the sensitivity of the Intrusion Detection System and helps it detect slow
attacks. On the other hand a high sampling rate decreases the number of frames that constitute a
flow and thus decrease the size of the data structure Wflow but at the same time it also makes the
system less sensitive to slow attacks. More over a slower sampling rate also increases the
response time of the Intrusion Detection System to the detected attacks as the IDS has to wait for
the time period of the sample to complete before the detection of the attack takes place. The
above mentioned issue of delayed detection can be circum-navigated by the use of multiple flows
of different sizes in the system as proposed by Youssif, et al.[8]. In [8] the author proposed the
use of flows with varying sampling rates and using multiple flows as a part of the Intrusion
Detection System. The Figure 4.2 below shows Wflows with varying sampling rates and their
effects on the ensuing flow analysis.

47
Figure 4.2: WFlows at different sampling rates

48
4.2 Intrusion Detection System with cluster tracking Architecture:
Below is the description of the Architecture of the Intrusion Detection System that is deployed
on the distributed access points and the architecture of the system deployed on the Central
Controller.
4.2.1 Architecture of the system deployed on the Access points:
The Figure 4.3 below shows the general architecture of the system that is deployed on each of
the access points/IDS devices that make up the network. The three main modules of the system
are discussed below
Figure 4.3: IDS and cluster tracking architecture
49
4.2.1.1 Sniffer Module:
The Sniffer Module is the module that does the task of collection of frames from the wireless
medium. It collects the frames from the wireless medium and performs the task of information
extraction from the collected frame. The information extraction sub module extracts the collected
frame type and the received radiotap signal strength from the frame and passes the information to
the Behavior Authentication Module.
4.2.1.2 Behavior Authentication module:
The Behavior Authentication Module is the module that performs the task of classifying if the
traffic that is collected by the sniffer module is normal or abnormal. The Behavior
Authentication Module receives the extracted information from the sniffer module and passes the
frame parameters to the Flow Generator and the pgram and the ngram generator sub modules.
The flow generator generates the Wflow for each connected device and the access point pair and
passes the Wflow to the pgram and the ngram generator module. The pgram and the ngram
generator module uses the Wflow to create the pgrams and the ngrams. The ngrams are then
compared with the normal and the abnormal ngram traffic databases to score the amount of
normality and abnormality of each ngram which is in turn used to judge the normality and the
abnormality of the Wflow. This characteristic information is then forwarded to the detection and
classification unit. The detection and the classification unit, compares the Wflow characteristics
with the conditions presented but the machine learning algorithms to classify if the Wflow is
normal or abnormal. On detection of an abnormal Wflow, the module also classifies the type of
abnormality by using number of different frame types in the Wflow to classify the attack.

50
4.2.1.3 APn location tracking Module:
On detection of attack in the Behavior Authentication Unit the Wflow is passed to the APn
location tracking Module which extracts the average power of the Wflow. This average power is
then compared with the local power map of the APn. After the comparison of the average power
of the flow to the power map, the average power is sent to the Central Controller for a
centralized analysis of the power signal. While the local Apn logs the results of the local design
process.
4.2.2 Architecture for the system on the Central Controller:
The Central Controller which also acts as the Radius Server for the distributed Wi-Fi network
acts as the central control when the attack detection happens. On detection of attacks each of the
access point’s location tracking module sends the average power of the Wflow it detected to the
Central Controller. The Central Controller then compares powers from all the access points with
its power map to decide the location of the attack. The Architecture of the Central Controller is
shown in the Figure 4.4 below.

51
Figure 4.4: Central Controller Architecture
4.2.3Operation Phases of the System:
The System that has been developed is an anomaly based intrusion detection system, thus it
operates in two phases. The two phases of operation are Training Phase and the Detection Phase.
These phases are described below.

52
4.2.3.1Training Phase:
In the training phase, the system train’s on the local Wi-Fi network and understands the normal
behavior for the system. The training involves collection of the traffic that flows through the Wi-
Fi network. Traffic is collected when the network is under normal operations and when the
network is under some known attacks. The knowledge of the operations of the network when it is
under known attacks, helps reduce the unknown event space and thus reduce the false positives
during attack detection. This reduces the false positives that are generated by the system by
reducing the amount of unknown event space. The training of the system happens in 3 stages.
a. Training Phase - Stage 1:
In this stage, we monitor the network to obtain all the possible n-grams in the Wi-Fi network.
This stage is used to build two databases. The first database is for all the normal n-grams in the
network. To ensure that attack traffic is not passed as normal traffic while building the database,
the network is carefully monitored to filter out any known attack traffic.
The second database is for all the n-grams obtained from known attack libraries. This approach
of having partial attack traffic helps us better shape the event space to differentiate between
normal and abnormal traffic.
In addition to storing the n-grams that characterize the normal and abnormal behavior of the Wi-
Fi frames, we also store information about:
1. Occurrence Rate (OR) – It measures the ratio of the number of occurrences of the n-gram
during the training to the total number of n-grams obtained during the training,
2. Modulo of total N-grams (MG): It measures the modulo (remainder from division) of
number of occurrences of the n-gram during the training with the total number of n-
grams.

53
The values of OR and MG for each of the n-gram in both the normal and the attack database can
be used to accurately characterize the normal and abnormal traffic of Wi-Fi network.
Let us denote receiving an n-gram of Wi-Fi frames by an event �� where the n-gram is the ���n-
gram,
And the set of n-grams used during the training stage is denoted as �
Then, ����
� = � ���� �� ����� �� ��� �� ���� �� Ε
�� = � ���� �� ����� �� ��� �� % ���� �� Ε
b. Training Phase - Stage 2:
In this stage of the training, the network is monitored first with normal traffic in the network and
then with abnormal traffic in the network to calculate four metrics(Wflow1, Wflow2, Wflow3,
Wflow4) for each of the wireless flows(Wflows) that are observed. The four wireless flow scores
are computed as follows,
If we assume that a particular wireless flow has n n-grams,
Then:
���� 1 = (# �)%&
%' &()*+,
���� 2 = (# ��%&
%')&()*+,

54
���� 3 = (# �)%&
%' +//+01
���� 4 = (# ��%&
%')+//+01
Where in values of the OR and MG for each n-gram are obtained from the normal and abnormal
n-gram databases obtained in Stage 1.
This obtained set of 4 metrics for each of the Wflows is stored in a database called flow_score
database with a binary entry added in front of each flow marking if the traffic that was observed
was normal or abnormal. The abnormal traffic is generated as mentioned earlier by the use of
known attack libraries.
Machine learning is performed in the flow_score database by the use of classification algorithms
to obtain the conditions in which the 4 Wflow metric’s represent normal and abnormal traffic. In
the system that was developed as a proof of concept, a simple Conjunctive Rule algorithm was
used to get the conditions of abnormal operation. This algorithm learns a single rule that predicts,
nominal class value. In this algorithm, the uncovered test instances are assigned the default class,
and the knowledge gain on occurrence of each of the antecedent is computed. The rule pruning is
done by the use of reduced error pruning. The rules thus obtained are used in the Detection Phase
of the system to detect attacks on the Network.
c. Training Phase - Stage 3:
During this stage of operation, a power map is created for each of the access points in its area of
operation. This is done by monitoring the signals received at the access point when the source of

55
the signal is placed at different locations. The power map for the Central Controller is obtained
by combining the maps of each of the access points.
4.2.3. 2 Detection Phase:
The detection phase is the final operational phase of the system. In the detection phase, the rules
that were learnt in Stage 2 of the training phase are used to detect the abnormal wireless traffic
(wireless flows (Wflows)). In addition to detecting the abnormal Wflows, we also classify the
type of attack and the location of the attacker.
For the attack location detection, each of the access points detects attacks independently. Each of
the access points compares the values of the four metrics (Wflow1, Wflow2, Wflow3, Wflow4),
with the ones that are obtained in the Stage 2 of the training to detect if an attack was performed
on the network. Each access point then classifies the attacks that are happening over the network,
by counting the different types of frames that are present in the anomalous wireless flow and
associating the type of frame with the type of attack.
The access points that detect the attack activate their location tracking module, which compares
the mean value of the power signal in the wireless flow with the power map for the access point.
Thus enabling the access point to estimate the location of the actual user, assuming that the
number of frames sent by the user is more than the number of frames sent by the attacker. Also
the access points forward the mean power of the anomalous wireless flow to the Central
Controller. The Central Controller then combines the mean power from the different access
points and compares the power values to its power map to estimate the location of the user.

56
4.3 Intrusion Detection System with tracking using classification algorithm
Architecture:
Below we present, an architecture of an intrusion detection system for a distribute Wi-Fi network
that uses classification based machine learning algorithms to classify the traffic flowing through
the network as normal or abnormal. And in case of occurrence of abnormal traffic uses
classification algorithms to classify the location of the abnormal traffic.
4.3.1 Architecture of the system deployed on the Access points:
The Figure 4.5 below shows the general architecture of the system that is deployed on each of
the access points/IDS devices that make up the network. The three main modules of the system
are discussed below
Figure 4.5: IDS and cluster tracking architecture

57
4.3.1.1 Sniffer Module:
The Sniffer Module collects the frames that flow over the Wi-Fi network. This module contains
two sub modules. The N/W sniffer sub module sniffs the network for the frames. The second
module that is the Information Extractor module extracts characteristic information from the
frames sniffed by the N/W Sniffer sub module. The extractor module extracts the received signal
strength from the Radiotap header, the frame type and the frame sub-type from the Wi-Fi frame.
It passes this information on to the Behavior authentication Module.
4.3.1.2 Behavior Authentication module:
The Behavior Authentication Module is the module that classifies the normality and the
abnormality of the traffic. It is made up of 4 sub modules. The Flow Generator receives the
extracted data from the Sniffer Module. The data that is received from the sniffer module
includes the power information of the received frame, the frame type and subtype of the received
frame and a time stamp of the time of receiving of the frame.
The Flow Generator module uses the time stamp to group the received frames into Wflows. The
information pertaining to the power of the received frames is passed on to the Mean flow power
extractor sub module in the Communications module and the ngram generator sub module in the
Behavior Authentication Unit. The ngram generator sub module converts the Wflow into a
stream of ngrams which are compared with Normal ngram database and Abnormal ngram
database. The results of the comparison are fed to the detection and the classification sub
module. The Detection and the Classification sub module have the conditions that classify the
traffic normal or abnormal. Also the Classification unit classifies the type of attack on the Wi-Fi

58
network. On detection of anomalous activity by the Behavior Authentication Module(BAU) the
Communication Module is activated.
4.3.1.3 Communication Module:
On detection of attack in the Behavior Authentication Module, the Communication module is
activated. The communication module calculates the average signal strength in the Wflow and
the size of the Wflow which are framed into a packet and sent to the Central Controller.
4.3.2 Architecture for the system on the Central Controller:
The Central Controller acts as the main control unit that performs the task of tracking the
location of the attack in this architecture. The Central Controller receives average power for the
Wflow and the Wflow size received by each of the access points in case of detection of an attack.
The Central Controller combines the average power and the Wflow sizes received from each of
the access points and then uses the conditional statements learnt by the use of classification
machine learning algorithms to classify the location of the attacker.

59
Figure 4.6: Central Controller Architecture
4.3.3Operation Phases of the System:
The System that has been developed is an anomaly based intrusion detection system, thus it
operates in two phases. The two phases of operation are Training Phase and the Detection Phase.
These phases are described below.

60
4.3.3.1 Training Phase:
The training phase of this architecture similar to the training of the previous architecture. The
training happens in three stages. The first two stages of the system are the same. The training of
the architecture varies in the third stage.
During the third stage of training, average Wflow signal strength and Wflow size is collected for
each of the access points when the Wi-Fi device is operating at different locations in the network
air space. This dataset is then used to train with the help of classification algorithms to obtain
conditions that give location of the network device.
4.3.3. 2 Detection Phase:
The detection phase is the final operational phase of the system. In the detection phase, the rules
that were learnt in Stage 2 of the training phase are used to detect the abnormal wireless traffic
(wireless flows (Wflows)). In addition to detecting the abnormal Wflows, we also classify the
type of attack and the location of the attacker.
For the attack location detection, each of the access points detects attacks independently. Each of
the access points compares the values of the four metrics (Wflow1, Wflow2, Wflow3, Wflow4),
with the ones that are obtained in the Stage 2 of the training to detect if an attack was performed
on the network. Each access point then classifies the attacks that are happening over the network,
by counting the different types of frames that are present in the anomalous wireless flow and
associating the type of frame with the type of attack.
The access points that detect the attack activate their Communication Modules. In the
Communication Module the average Wflow signal strength and the Wflow size is calculated and
sent to the Central Controller. The Central Controller compares the received signal strength and

61
Wflow size from each of the access points with the conditional statements to track the location of
the attackers.

62
4.4 Configurations of Operation of the proposed Architecture:
The proposed Architectures support 2 modes of operation. The system can operate with a single
access point in the network(non distributed network) and with multiple access points in the
network. The Figure 4.7 below describes these operational configurations.
Figure 4.7: Mode1 Single Access Point
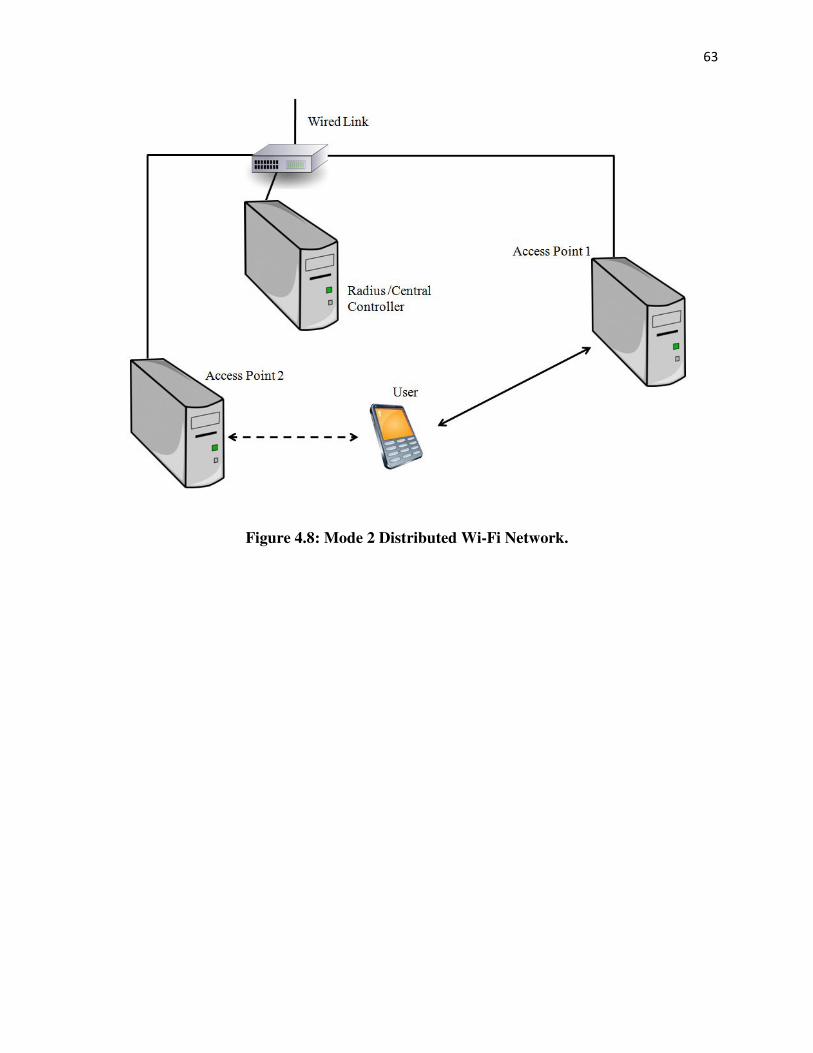
63
Figure 4.8: Mode 2 Distributed Wi-Fi Network.
64
CHAPTER 5: EXPERIMENTS AND RESULTS
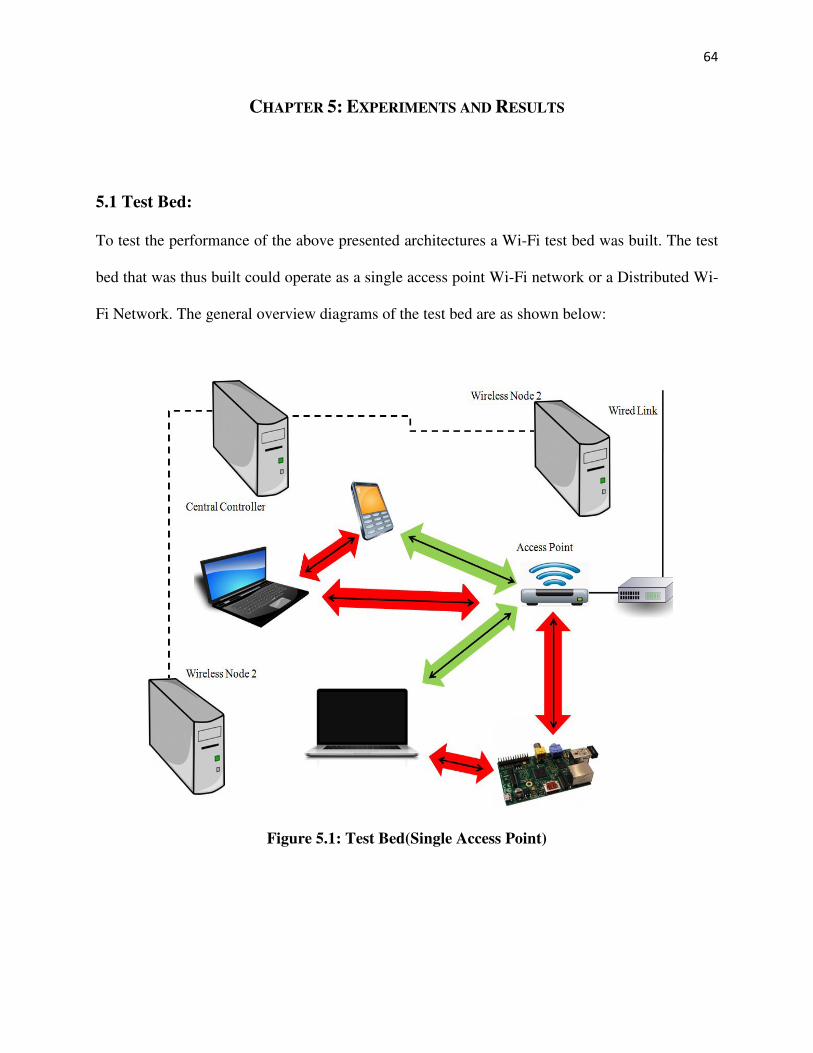
5.1 Test Bed:
To test the performance of the above presented architectures a Wi-Fi test bed was built. The test
bed that was thus built could operate as a single access point Wi-Fi network or a Distributed Wi-
Fi Network. The general overview diagrams of the test bed are as shown below:
Figure 5.1: Test Bed(Single Access Point)
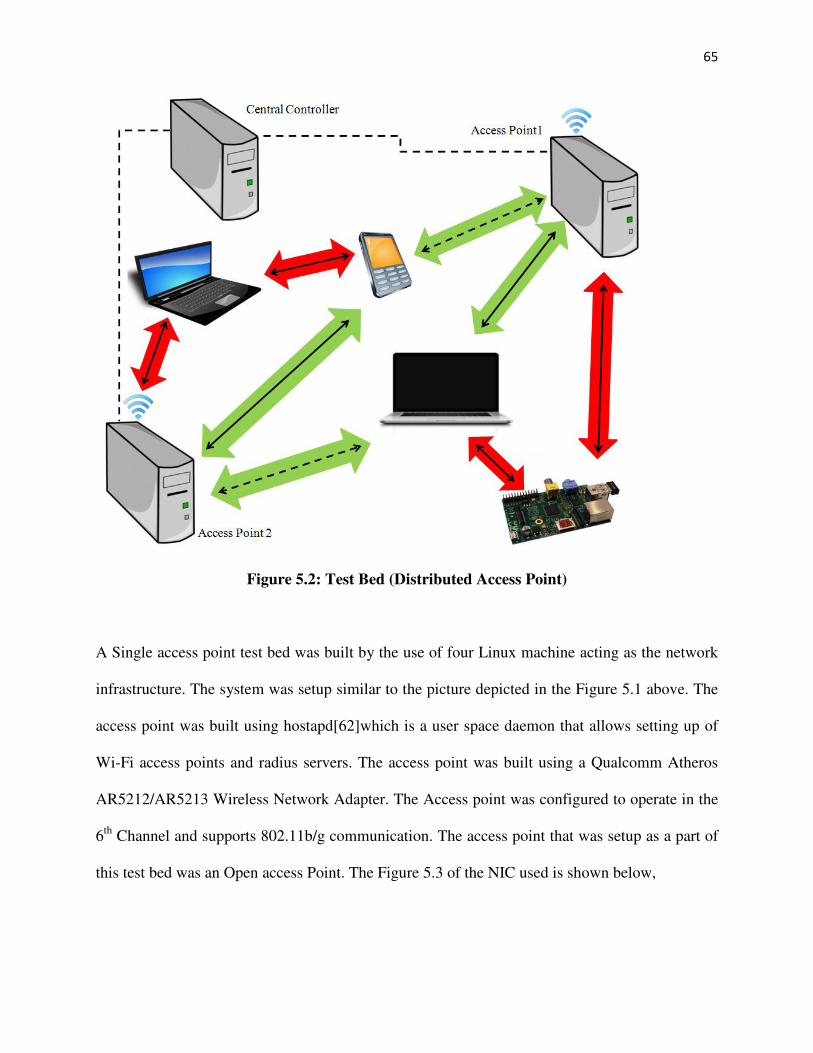
65
Figure 5.2: Test Bed (Distributed Access Point)
A Single access point test bed was built by the use of four Linux machine acting as the network
infrastructure. The system was setup similar to the picture depicted in the Figure 5.1 above. The
access point was built using hostapd[62]which is a user space daemon that allows setting up of
Wi-Fi access points and radius servers. The access point was built using a Qualcomm Atheros
AR5212/AR5213 Wireless Network Adapter. The Access point was configured to operate in the
6th
Channel and supports 802.11b/g communication. The access point that was setup as a part of
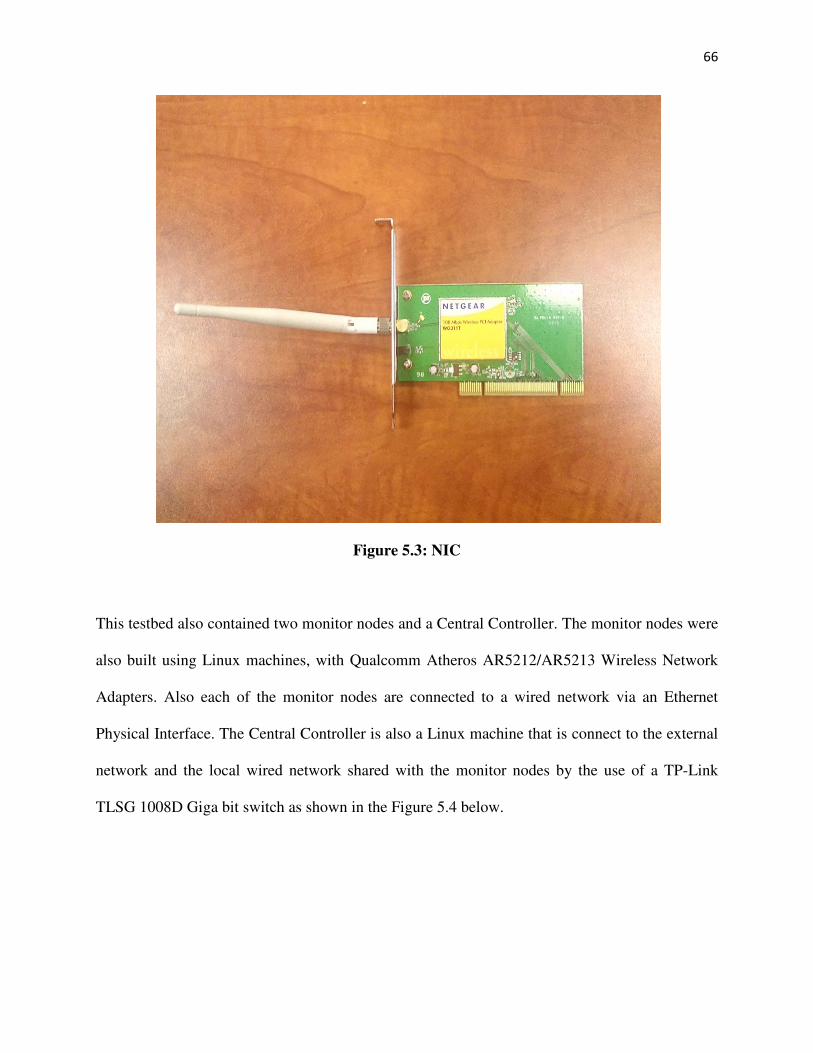
this test bed was an Open access Point. The Figure 5.3 of the NIC used is shown below,
66
Figure 5.3: NIC
This testbed also contained two monitor nodes and a Central Controller. The monitor nodes were
also built using Linux machines, with Qualcomm Atheros AR5212/AR5213 Wireless Network
Adapters. Also each of the monitor nodes are connected to a wired network via an Ethernet
Physical Interface. The Central Controller is also a Linux machine that is connect to the external
network and the local wired network shared with the monitor nodes by the use of a TP-Link
TLSG 1008D Giga bit switch as shown in the Figure 5.4 below.
67
Figure 5.4: TP Link TLSG 1008D Switch
5.1.2 Distributed Access Point Test Bed:
A Distributed Access Point Test bed was built to test the performance of the proposed
architectures in the Distributed Environment. The Test bed consisted of 3 Linux machines of
which two of the machines act as the access points. The access points were configured using the
hostapd[62]. Each of the access points uses a Qualcomm Atheros AR5212/AR5213 Wireless
Network Adapter for the Wi-Fi network. They use an Ethernet network to connect to the Radius
Server/Central Controller. In each of the access points the Wi-Fi adapter and the Ethernet adapter
are bridged together using a virtual bridge. Also each of the access points have the previously
declared architectures running on the network using a virtual Wi-Fi interface. The access points
that have thus been setup support 802.11 b/g communications over a WPA2-EnterpriseWi-Fi
network. The Radius server that handles the authentication and pre authentication of the user

68
devices to the network is connected to the local network by Ethernet by a TP Link TLSg 1008D
Giga bit switch.
5.1.3 User Devices:
The Test bed has many user devices connected to it. The set of user devices connected to the
network include a Samsung Galaxy SDuos2 Smart phone, multiple Linux based computers and a
T61 Think pad using Ralink Tech Corp. RT-5370 Wi-Fi dongle. The Power tracking training for
the above mentioned systems was done for this Lenovo T61 Think pad.

69
Figure 5.5: Devices using the network.
5.1.4 Attack Devices:
A multiple attack devices have been employed as a part of this test bed. This includes two Linux
Desktop, T61 Think pad laptop and a Raspberry Pi. The Linux Desktops are equipped with
Qualcomm Atheros AR5212/AR5213 Wireless Network Adapters, while the T61 is equipped
with Intel PRO/Wireless 3945ABG Wireless Network card and the Raspberry Pi had Tp Link T
WN-722N Wi-Fi dongle connected to it. The Raspberry Pi’s use the Raspbian which is a Debian
Linux based operating system.

70
Figure 5.6: Attacking Device
5.1.5 RADIUS SERVER/CENTRAL CONTROLLER:
In the distributed Wi-Fi network a Linux machine acts as the RADIUS server. The RADIUS
server uses FreeRADIUS to support authentication of the Wi-Fi users. The Radius Server is
connected to the access points and the Internet through Ethernet. In case of the single access
point network, the RADIUS server is present on the access point, while the Central Controller is
a Linux desktop which is connected to the controller nodes and the internet through Ethernet.

71
5.2 Attacks:
The proposed architectures were tested against multiple attacks. Aircrack-ng was the know
attack library that was used to test the system.
5.2.1 Aircrack-ng:
Aircrack-ng is an advanced Wi-Fi attack library that was used as a part of this testing process.
The Aircrack-ng attack library can perform a number of attacks on the Wi-Fi network. Some of
the attacks that can be performed include WEP and WPA-PSK key cracking. Some the other
attacks that can be performed by the attack library include Caffe Latte attack, De-Authentication
attack, Fake Authentication attack, Injection Flooding attack. The attack library can also be used
to spoof handmade Wi-Fi frames over the network.
5.2.2 Modified Attack:
As a part of this test procedure to prove that our approach can detect modified and zero day
attacks, we created a small Wi-Fi attack library that could perform a modified De-authentication
attack which could be varied dynamically in the number of frames sent over the network, the
rates at which frames are sent over the network. This attack was also modified a bit to allow the
attackers to perform a Man in the Middle attack. The Library was built for Linux based operating
system supporting Little Endean machines. The low level networking library Libpcap was used
to develop this attack library.
72
5.3 Experimentation of the Attack detection and Classification System:
Both of the presented architectures have similar approach for attack detection and classification.
Hence the experimentation and the training for the attack detection and classification systems
was done together.
5.3.1 Single Access point Test Bed:
These experiments were performed with a single access point in the network. Hence the testbed
looked similar to the diagram in Figure 5.1.These experiments were performed in this
configuration as the aim was to test the performance of the detection and the classification
system under worst conditions of operation.
5.3.1.1 Training:
The training of the system was done at the Autonomic Computing Lab(ACL) at the University of
Arizona by monitoring the traffic on the channel 1. The traffic was supervised to ensure that no
know attack would slip through the training traffic when the system was training for normal
behavior of the network.
For sampling of the signal, we have experimented with two time windows: 10 and 2 seconds.
During the tests it was observed that the system with a time window of 10 seconds performs
better than the system that has a time window of 2 seconds. The reasons could be attributed to
the fact that most of the processes that are a part of the Wi-Fi protocol occur in less than 10
seconds. Also the 10 second time window allows the system to detect attacks that are slow and

73
affect over a period of time. The training to understand the normal behavior of the Wi-Fi
protocol tool place for 1.5 weeks, in which the IDS was extensively trained to gain a complete
understanding of the normal behavior of the protocol. The IDS was trained for 1 day on know
attack traffic to gain partial knowledge of the attack traffic. Conjunctive Rule algorithm which is
a classification based machine learning algorithm was used to obtain the conditional rules that
classified the events in the protocol or the state changes of the Wi-Fi protocol as normal or
abnormal. The rules obtained are presented in the Table 5.1 below.
TABLE 5.1: Intrusion Detection System Rules
Flowscore Condition
1. Flowscore 1 (FS1) Flowscore1 should be less than 97(FS1<97)
2.Flowscore 2 (FS2) Flowscore2 should be greater than 279732 (FS2 > 279732)
3.Flowscore 3 (FS3) Flowscore3 should be greater than 1020. (FS3>1020)
4. Flowscore 4 (FS4)
For the current environment, the abnormal condition is independent
of flowscore4. (FS4=NA)
5.3.1.2 Detection Evaluation:
Multiple wireless attacks were performed on the distributed Wi-Fi network. Some of the attacks
were performed using the aircrack-ng attack library. Some modified attacks were also performed
on the network. The attacks in the aircrack-ng attack library include flooding attacks of
management frames and denial of service attacks. The modified attacks developed include the
modified de-authentication attacks. A complete list of the attacks that are used to evaluate our

74
approach is shown in Table 5.2. We have evaluated our approach by conducting the following
five experiments:
TABLE 5.2: Wireless Attacks
Attack Type Description
1.De-Authentication Attack This attack involves the flooding of the target with De-
Authentication frames.
2.Fake Authentication This attack involves fake authenticating to an access point.
3. Minimal De-Authentication
This attack is performed to De-Authenticate a user from a
network with just 15 frames.
4. Disassociation Attack
This attack involves sending a Disassociation frame to both
the access point and the target.
5. Man in the middle Attack
This attack results in a man in the middle on the Layer two
of the network.
5.3.1.2.1 Experiment 1:
This experiment is designed to evaluate the percentage rise in the number of false positives given
by the system due to the increase in the frame drop rate due to interference and wireless channel
related issues when the network is not under attack.
To ensure frame dropping due to interference and wireless channel issues, small modules that
enabled dropping of frames at random were inserted in the sniffer module. In these inserted
75
modules the frame drop rate could be increased or decreased as per the users choice. During this
experiment, the frame drop rate was increased from 1% frame drop rate to frame drop rates as
high as 96%. At frame drop rates as high as 96% the Wi-Fi network is virtually non existent.
The result of this experiment was that no false positives were observed even at very high drop
rates of 95-100%. Essentially at these high drop rates a network can be considered useless. But
even at these high drop rates the percentage of false positives observed was 0%.
5.3.1.2.2 Experiment 2:
This experiment has been designed to detect the percentage rise in the number of false positives
given by the system as the frame drop rate of the system increases when the system is under
attack. The increase in the frame drop rate could be a result of interference and other channel
noises. To simulate this interference, the received frames were randomly dropped by the packet
sniffer unit. The percentage of the frames dropped was increased gradually over a period of time.
It was observed that the intrusion detection system gives zero false positives till the frame drop
percentage reaches 80%. Then there is a steady increase in the false positives till the system
stops performing at 93% frame drop rate. The results of this experiment are presented as a graph
in the Figure 5.7 below. Thus this experiment shows that the system performs exceptionally well
even in an environment of high atmospheric and network interference.

76
Figure 5.7. False Negative versus Frame drop rate.
5.3.1.2.3 Experiment 3:
This experiment has been designed to detect the ability of the system to detect new or modified
attacks on the distributed Wi-Fi network. Modified De-Authentication attack and man-in-the-
middle attack were launched several times against the network. Our detection algorithm was able
to detect and classify both attacks successfully every time. The system was observed to classify
two modified De-Authentication attacks on the access point and the same user, as one single
attack if both the attacks were performed under 10 seconds (Wflow window size).
5.3.1.2.4Experiment 4:
It has been designed to demonstrate how each of the four Wireless flowscore values for the
attacks listed in Table 5.2differ from the normal WFlow values (obtained during training) by a

77
large margin. This large margin enables us to detect attacks accurately with low false alarms.
Also this high sensitivity of our detection algorithm to the Wireless traffic can justify the results
of Experiment 2 shown in Figure 5.7, where it is observed that the detection algorithm works
even when the frame drop rate is as high as 80%.Table 5.3shows the rules used to detect
anomalous behavior due to Wi-Fi network attacks.
TABLE 5.3: Intrusion Detection System Rules
Flowscore Condition
1. Flowscore 1 (FS1) Flowscore1 should be less than 97(FS1<97)
2.Flowscore 2 (FS2) Flowscore2 should be greater than 279732 (FS2 > 279732)
3.Flowscore 3 (FS3) Flowscore3 should be greater than 1020. (FS3>1020)
4. Flowscore 4 (FS4)
For the current environment, the abnormal condition is independent
of flowscore4. (FS4=NA)
The results of the experiment are shown in Figure5.8. It also highlights the minimum difference
between the condition for the anomalous behavior and the normal flowscore values.

78
Figure 5.8. Flowscore value to rule comparison.
5.3.1.2.5 Experiment 5:
This experiment has been designed to evaluate the accuracy of attack classification algorithm as
the frame drop rate increases. The increase in frame drop rate is due to the nature of the wireless
physical layer being prone to error, interference and noise. Thus this experiment helps in
identifying the maximum threshold beyond which the algorithm cannot effectively classify the
attacks.
It is observed that the algorithm can classify all the attacks correctly at all times till the frame
drop rate is as high as 66%. After that, we observe a steady decline in the algorithm ability to
classify attack accurately as shown in Figure5.9.

79
Figure 5.9: Correct Attack Classification(percentage) versus Frame drop rate.
5.3.2 Distributed Access point Test Bed:
The following experiments were performed on the Detection and the Classification Module in
the Distributed Access point Test bed.
5.3.2.1 Training:
The Intrusion Detection System was trained in the Autonomic Computing Lab (ACL) at the
University of Arizona. The system was trained on the first channel of the Wi-Fi network. In the
previous experimentation for the Single access point testbed it was observed that a 10 second
time window allowed the IDS to detect fast and slow moving attacks with high efficiency hence

80
as a part of this training a 10 second time window was chosen depending on the previous
experience.
The training to understand the normal behavior of the distributed Wi-Fi network lasted for 2
weeks. In this period of two weeks the IDS gained complete understanding of the normal
behavior operation of the distributed Wi-Fi network. While the IDS was trained for 2 days to
understand the behavior of the system when under attack. A Conjunctive Rule classification
algorithm was used to train to for the conditions of normal and abnormal behavior of the
Distributed Wi-Fi network. The rules thus obtained are in the Table 5.4 below.
TABLE 5.4: Intrusion Detection System Rules
Wireless Flowscore Condition
1. Flowscore 1 (FS1) Flowscore1 should be less than and equal to 1881(FS1<1881)
2.Flowscore 2 (FS2) Flowscore2 should be greater than 591472(FS2 >591472)
3.Flowscore 3 (FS3)
For the current environment, the abnormal condition is
independent(FS3==NA)
4. Flowscore 4 (FS4) Flowscore4 should be greater than 505. (FS4>505)
5.3.2.2 Detection Evaluation:
The detection and the classification algorithm was tested on the Distributed Access point testbed.
The Wireless flowscore values for the normal behavior of a distributed Wi-Fi network are
presented in the Table 5.4.

81
The difference in the values of the normal wireless flowscore values and the attack flowscore
values are shown in the Figure 5.9 below which shows that there is a huge margin between the
wireless flowscore values of the rules and the values of the wireless flowscores observed when
attacks are performed. Showing that the approach can easily detect attacks on a distributed Wi-Fi
network.
Figure 5.10: Flowscore value to rule comparison

82
5.4 Experimentation of the Power tracking System:
Two different approaches to track the locations were presented as two different architectures in
this thesis. Both the architectures perform similarly on the Single access point testbed and the
Distributed access point test bed respectively. That is, the first architecture has same results on
the Single access point test bed and the Distributed access point test bed. Hence each of the
architectures required only one training.
5.4.1 Power tracking Module of Architecture 1:
This Architecture as stated previously uses a clustering approach to track the location of the
attack by the use of power maps. Where in each of the individual nodes/ access points provided
with a location. Moreover the Central Controller also had a combined power map which was
used by the Central Controller to give location of the attacker.
5.4.1.1 Training:
The training for the power tracking system for the Architecture 1 was performed in the
Autonomic Computing Lab (ACL) at the University of Arizona. The power mapping was
performed with the client device (T61 Think pad) using a Ralink Tech Corp RT-5370 wireless
network card. The lab was divided into 8 small sectors and the signal strength for each of the
sectors was measured by both the nodes/access points. The signal strengths were then used to
create power maps that helped in clustering the location of the attacker. The combined power
map that was obtained as a part of this training is shown in the Figure 5.10 below.

83
Figure 5.11: Central Controller Combined Power Map
5.4.1.2 Detection Evaluation:
The Power-tracking module for this architecture was evaluated by attacking the Wi-Fi network
(on both the test beds) with multiple attacks. Then the locations provided by the architecture
were observed. The attacks listed in Table 5.5 below were used as a part of this experiment. It
was observed that the locations given by the individual access points were accurate 70% of the
time while the locations given by the Central Controller were accurate 81% of the time. Also it

84
was observed that this approach worked particularly well when the operating environment was
static, and the performance degraded rapidly once the environment was changed.
TABLE 5.5: Wireless Attacks used for Power tracking module Evaluation
Attack Type Description
1.De-Authentication Attack This attack involves the flooding of the target with De-
Authentication frames.
2. Minimal De-Authentication
This attack is performed to De-Authenticate a user from a
network with just 15 frames.
5.4.2 Power tracking Module of Architecture 2:
This power tracking architecture as stated previously uses a classification algorithm. Wherein
each of the access point/ node sends packets that contain wirelessflow average power and the
Wflow size. The central Controllers compares the values received from each of the access
points/nodes with the classification rules learnt in the training phase to conclude on the location
of the attacker.
5.4.2.1 Training:
The training for this system was performed in the Autonomic Computing Lab(ACL lab). As part
of this training, average power and wflow size was collected at various different locations in the
lab. This training data was then trained on by the use of WEKA. Bagging algorithm which is a
classification algorithm was used. The tree containing the rules of the algorithm is presented
below.
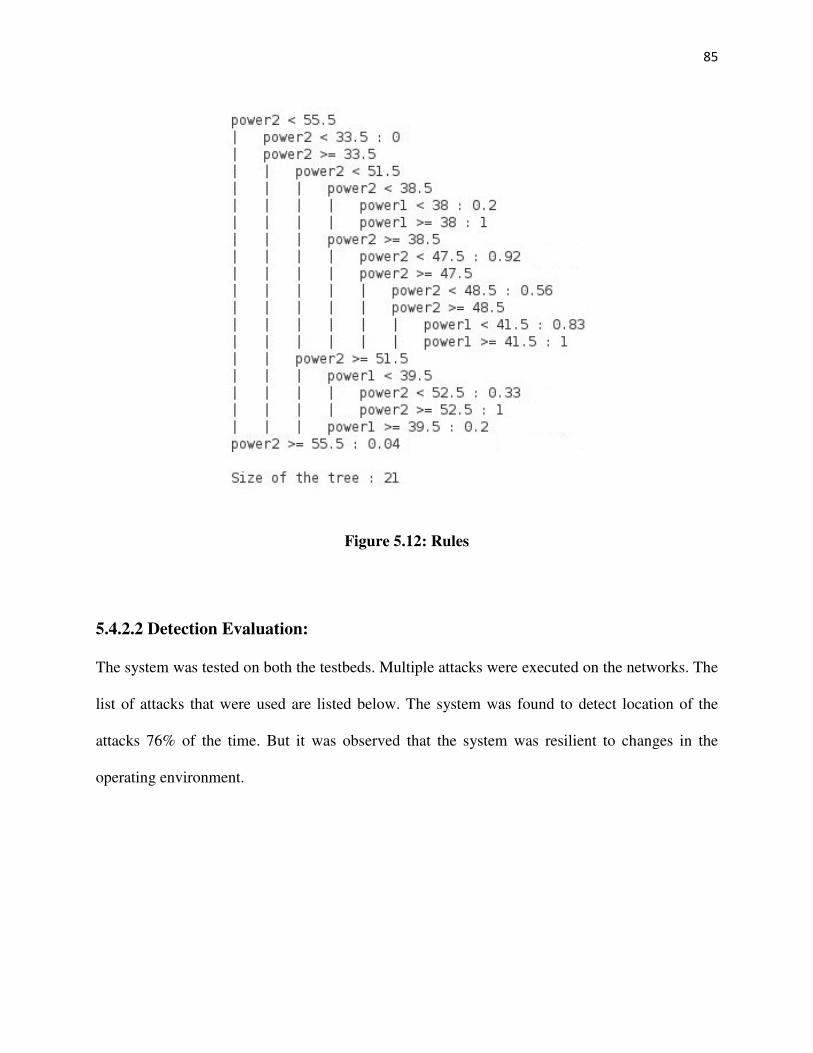
85
Figure 5.12: Rules
5.4.2.2 Detection Evaluation:
The system was tested on both the testbeds. Multiple attacks were executed on the networks. The
list of attacks that were used are listed below. The system was found to detect location of the
attacks 76% of the time. But it was observed that the system was resilient to changes in the
operating environment.

86
TABLE 5.5: Wireless Attacks used for Power tracking module Evaluation
Attack Type Description
1.De-Authentication Attack This attack involves the flooding of the target with De-
Authentication frames.
2. Minimal De-Authentication
This attack is performed to De-Authenticate a user from a
network with just 15 frames.

87
CHAPTER 6: CONCLUSION AND FUTURE WORK
6.1 Conclusion:
In this thesis we reviewed the concepts of machine learning, Intrusion detection system
Taxonomies and the IEEE 802.11 protocol. We discussed the protocol in depth and also
discussed the security issues associated with the protocol. Moreover the thesis presented two
architectures of Intrusion Detection Systems for Single access point Wi-Fi Networks as well as
Distributed Wi-Fi Networks.
The proposed architectures use supervised learning to gain information of the normal operation
of the system. They also train with some known attacks to get a better understanding of the event
space. The presented approach detects attack with no false positives and no false negatives. The
attack was tested to detect not only the known attacks but also modified and zero day attacks.
The architectures use classification algorithms to classify if the attack is normal or abnormal.
The architectures also have location tracking modules that are able to track the location of the
attacker, once the attack is executed. In case of the first architecture, the location tracking
module uses a clustering approach to obtain the location of the attacker. This architecture is able
to obtain the location at each of the access points / nodes in the network or at the Central
Controller/Radius. In case of the second architecture, the location tracking module uses a
classification algorithm to obtain the location of the attack at the Central Controller/ Radius
Server. The differences between the approaches being that the 1starchitecture operates with 70%
efficiency at each of the nodes/access points while the Central Controller/ Radius Server operates
with 81% efficiency while the 2nd
architecture has an efficiency of 76%. Moreover the first

88
architecture is highly effective in a static environment, while the second architecture is effective
in a changing environment. It was also observed that it is easier to add or remove access points/
nodes to the first architecture while the second architecture requires massive amount of
retraining in case of modification to the number of nodes or access point in the network.
6.2 Future Work:
This work can be further expanded to include unsupervised machine learning making the system
truly autonomous. Future work can address the following issues:
• Development of testing the approaches in different operating environments that cover
large geographic areas and highly cluttered environments.
• Extend the research to cover outdoor Wi-Fi networks.
• Extend the existing architectures to allow their operations in dynamically changing
environments.
• The current experimentation of the location tracking module was performed in a small
room with little distance separating the multiple access points or wireless nodes. This
results in not much variation in the signal strength as the user device moves around the
operational cell. Hence experimentation needs to be performed with larger cell sizes. It is
believed that a larger cell size will increase the signal strength variation as the user moves
around the cell, thus increasing the accuracy of the location tracking algorithms.

89
REFERENCES
1. The Zettabyte Era- Trends and Analysis “
http://www.cisco.com/c/en/us/solutions/collateral/service-provider/visual-networking-
index-vni/VNI_Hyperconnectivity_WP.html. [August 26, 2015].
2. M. Roberts, “Smartphone & tablet usage trends & insights: 4G LTE and Wi-Fi powering
data consumption”, www.ovum.com. 2015.
3. “Wi-Fi hotspots set to more than triple by 2015”, http://www.informa.com/media/press-
releases--news/latest-news/wifi-hotspots-set-to-more-than-triple-by-2015/# [August 26,
2015].
4. Digital Security- Cyber Security and Fraud Prevention (CTI)
5. H. Alipour, “An Anomaly Behavior Analysis Methodology For Network-Centric
System,” M.S thesis, ECE, University of Arizona, Tucson, Az 2015.
6. S. Axelsson, “Intrusion Detection Systems: A Survey and Taxonomy,” 2000.
7. I. Witten, E. Frank, “Data Mining: Practical Machine Learning Tools and Techniques”,
2005.
8. Y Al-Nashif, A Kumar, S. Hariri, Y. Luo, F Szidarovsky, G. Qui, “Multi-Level Intrusion
Detection System (ML-IDS),” Autonomic Computing, 2008. ICAC ’08, 131-140,
10.1109/ICAC.2008.25.
9. H. Suo, J. Wan, C. Zou, J. Liu, “Security in the Internet of Things: A Review,” Computer
Science and Electronics Engineering (ICCSEE), 2012, 648-651,
10.1109/ICCSEE.2012.373.
90
10. J. Jin, G. Jayavardhana, S. Marusic, M. Palaniswami, “An Information Framework for
Creating a Smart City through Internet of Things,” Internet of Things Journal, 112 – 121,
April 2014
11. K. Kim, “ROAFTS: A Middleware Architecture for Real-time Object-oriented Adaptive
Fault Tolerance Support,” High-Assurance Systems Engineering Symposium, 1998.
Proceedings. Third IEEE International, 50 – 57, 10.1109/HASE.1998.731595.
12. M. Palattela, N. Accettura, X. Vilajosana, T. Watteyene, L. Grieco, G. Boggia, M.
Dohler, “Standardized Protocol Stack for the Internet of (Important) Things,”
Communications Surveys & Tutorials, 1389 – 1406, July 31 2013.
13. J. Stankovic, “Research Direction for the Internet of Things,” Internet of Things Journal,
IEEE (Volume:1 , Issue: 1 ), 3-9, Feb. 2014.
14. F. Tao, Y. Cheng, L. Xu, L. Zhang, B. Li, “CCIoT-CMfg: Cloud Computing and Internet
of Things-Based Cloud Manufacturing Service System,” Industrial Informatics, IEEE
Transactions on (Volume:10 , Issue: 2 ), 1435 – 1442, May 2014.
15. H. Qui, A. Gani, “Research on mobile cloud computing: Review, trend and perspectives,”
Digital Information and Communication Technology and it's Applications (DICTAP),
195 – 202, 10.1109/DICTAP.2012.6215350.
16. M. Dikaiakos, G. Pallis, D. Katsaros, P. Mehra, A. Vakali, “Cloud Computing:
Distributed Internet Computing for IT and Scientific Research,” Internet Computing,
IEEE (Volume:13 , Issue: 5 ), 10-13, Sept.-Oct. 2009.

91
17. R. Buyya, C. Yeo, S. Venugopal, J. Broberg, I. Brandic, “Cloud computing and emerging
IT platforms: Vision, hype, and reality for delivering computing as the 5th utility,” Future
Generation Computer Systems Volume 25, Issue 6, 599–616, June 2009.
18. S. Marston, Z. Li, S. Bandyopadhyay, J. Zhang, A. Ghalsasi, “Cloud computing — The
business perspective,” Decision Support Systems Volume 51, Issue 1, 176–189, April
2011,
19. M. Roesch, “Snort- Lightweight Intrusion Detection for Networks”, 13th
Systems
Administration Conference- LISA 1999.
20. K. Ilgun, “USTAT: A Real- Time Intrusion Detection for UNIX”, Master Thesis,
University of California, Santa Barbara, November 1992.
21. G. Vigna and R Kemmerer, “ NetSat: A Network-Based Intrusion Detection Approach”,
In proceedings of the 14 Annual Information Theory: 50 Years of Discovery Computer
Security Application Conference, Dec 1998.
22. U. Lindquist, P. A. Porras, “Detecting Computer and Network Misuse through the
Production-Based Expert System Toolset(P-BEST)”, In proceeding of the 1999 IEEE
Symposium on Security and Privacy. 146-161.
23. D. Barbara, N. Wu, and S. Jajodia, “Detecting novel intrusions using bayes estimators”,
In Proceedings of First SIAM Conference on Data Mining, Chicago, IL, 2001.
24. M. Joshi and V. Kuma, “Credos: classification using ripple down structure (a case for
rare classes)”, In Proceedings of 19th
International Conference on Data Engineering,
Bangalore, India, 2003.

92
25. R. Agarwal and M. V. Joshi, “PNrule: A new framework for learning classifiers models
in data mining (a case-study in network intrusion detection )”, Technical Report TR 00-
015, Department of Computer Science, University of Minnesota, 2000.
26. M. V. Joshi, V. Kumar, and R. C. Agarwal, “Evaluating boosting algorithms to classify
rare classes: Comparison and improvements”, In ICDM, 257-264, San Jose, CA, 2001.
27. A. Lazarevic, N. V. Chawala, L. O. Hall, and K. W. Bowyer, “Smoteboost: Improving
the prediction of minority class in boosting”, Technical Report 2002- 136, AHPCRC,
2002.
28. L. Ertoz, E. Eilertson, A. Lazarevic, P. Tan, J. Srivastava, V. Kumar, and P/ Dokas, “The
MINDS- Minnesota Intrusion Detection System”, Next Generation Data Mining, MIT
press 2004.
29. D. Denning, “An intrusion-detection model”, IEEE Transactions on Software
Engineering, SE-13:222-232, 1987.
30. H. Javitz and A. Valdes, “The nides statistical component: Description and justification”,
Technical report, computer Science Laboratory, SRI International, 1993.
31. P. Garcia-Teodoro, J. Diaz-Verdejo, G. Marcia-Fernandez, E. Vazquez, “Anomaly- based
network intrusion detection: Techniques, system and challenges”, Computers & Security,
Volume 28, Issues 1–2, February–March 2009,18–28.
32. U. Fayyad, G Piatetsky-Shapiro, P. Smyth, “From Data Mining to Knowledge discovery
in Databases”, AI Magazine, Volume 17, No 3,
http://dx.doi.org/10.1609/aimag.v17i3.1230.

93
33. E. Frank, M. Hall, L. Trigg, G. Holmes and I. Witten, “Data mining in bioinformatics
using Weka”, Bioinformatics, Volume 20, Issue 15, 2479-2481,
10.1093/bioinformatics/bth261.
34. G. Holmes, A. Donkin, I. Witten, “WEKA: a machine learning workbench”, Intelligent
Information Systems,1994. Proceedings of the 1994 Second Australian and New Zealand
Conference, 357 – 361, 10.1109/ANZIIS.1994.396988.
35. M. Hall, E. Frank, G. Holmes, B. Pfahringer, P. Reutemann, I. Witten, “The WEKA data
mining software: an update”, ACM SIGKDD Explorations Newsletter, Volume 11 Issue
1, 10-18, 10.1145/1656274.1656278.
36. I. Kononenko, “Estimating attributes: Analysis and extensions of relief”, Proceedings of
the Seventh European Conference on Machine Learning. 1994, 171-182
37. C. Aflori, M. Craus, “Grid implementation of the Apriori algorithm”, Advances in
Engineering Software, Volume 38, Issue 5, 295–300, 10.1016/j.advengsoft.2006.08.011.
38. L. Schmidt-Thieme, “Algorithmic Features of Eclat”, FIMI, Volume 126 of CEUR
Workshop Proceedings, CEUR-WS.org, 2004.
39. C. Borgelt, “An implementation of the FP-growth algorithm”, OSDM '05 Proceedings of
the 1st international workshop on open source data mining: frequent pattern mining
implementations, 1-5, 10.1145/1133905.1133907.
40. A. Likas, N. Vlassis, J. Verbeek, “The global k-means clustering algorithm”, Pattern
Recognition Volume 36, Issue 2, 451–461, 10.1016/S0031-3203(02)00060-2.
41. A. Ding, X. He, “K-means clustering via principal component analysis”, ICML '04
Proceedings of the twenty-first international conference on Machine learning,
10.1145/1015330.1015408.
94
42. IEEE Std 802.11-1997 Information Technology- telecommunications And Information
exchange Between Systems-Local And Metropolitan Area Networks-specific
Requirements-part 11: Wireless Lan Medium Access Control (MAC) And Physical Layer
(PHY) Specifications. 1997.
43. "802.11a-1999 High-speed Physical Layer in the 5 GHz band", IEEE, 1999.
44. "802.11b-1999 Higher Speed Physical Layer Extension in the 2.4 GHz band", IEEE,
1999.
45. "IEEE 802.11g-2003: Further Higher Data Rate Extension in the 2.4 GHz Band", IEEE.
2003.
46. "IEEE 802.11n-2009—Amendment 5: Enhancements for Higher Throughput". IEEE-SA.
29 October 2009. doi:10.1109/IEEESTD.2009.5307322.
47. "IEEE Std 802.11ac 2013 - 22.5 Parameters for VHT-MCSs" IEEE. 2013.
48. A. Sheth, C. Doerr, D. Grunwald, R. Han, and D. Sicker, “ MOJO: a distributed physical
layer anomaly detection system for 802.11 WLANs”, In Proceedings of the 4th
international conference on Mobile systems, applications and services, June 19-22, 2006,
Uppsala, Sweden .
49. Sheng, Y., Tan, K., Chen, G., Kotz, D. and Campbell, A. 2008. Detecting 802.11 MAC
Layer Spoofing Using Received Signal Strength. In Proceeding IEEE 27th Annual
Conference on Computer Communications (INFOCOM), April 2008.
50. D. Madory, “New methods of spoof detection in 802.11 wireless networking.” Master's
thesis, Dartmouth College, Hanover, New Hampshire, June 2006.
95
51. A.G. Fragkiadakis, V.A. Siris, and A.P. Traganitis, "Effective and robust detection of
jamming attacks," Future Network and Mobile Summit, 2010 , vol., no., pp.1-8, 16-18
June 2010.
52. J. Yang, Y. Chen, W. Trappe, J. Cheng, "Detection and Localization of Multiple
Spoofing Attackers in Wireless Networks," Parallel and Distributed Systems, IEEE
Transactions on , vol.24, no.1, pp.44,58, Jan. 2013.
53. Q. Li, and W. Trappe, “Detecting Spoofing and Anomalous Traffic in Wireless
Networks via Forge-Resistant Relationships”. Information Forensics and Security, IEEE
Transactions on , vol.2, no.4, pp.793-808, Dec. 2007.
54. D. Dasgupta, F. Gonzalez, K. Yallapu. and M. Kaniganti, “Multilevel monitoring and
detection systems (MMDS)”. In Proceedings of the 15th Annual Computer Security
Incident Handling Conference, Ottawa, Canada, 2003.
55. F. Guo, and T. Chiueh, “Sequence number-based MAC address spoof detection” in
Proceedings of the 8th International Symposium on Recent Advances in Intrusion
Detection (RAID’05), Seattle, U.S.A., 2005.
56. R. Gill, J. Smith, A. Clark, “Specification-Based Intrusion Detection in WLANs”,
Computer Security Applications Conference, 2006.ACSAC '06. 22nd Annual , vol., no.,
pp.141-152, Dec. 2006.
57. S. Fayssal, S. Hariri, and Y. B. Al-Nashif, “Anomaly-Based Behavior Analysis of
Wireless Network Security”, In Proceeding of the 4th
Annual International Conference on
Mobile and Ubiquitous Systems: Networking &Services.MobiQuitous 07. Aug. 2007.
58. Airmagnet,(December 2014) http://www.flukenetworks.com/enterprise-
network/wireless-network/AirMagnetEnterprise
96
59. Airdefence, (December 2014) http://www.airdefense.net
60. AlipourH,Al-Nashif Y.B, Hariri S, “IEEE 802.11 Anomaly-based Behavior Analysis”,
Computing, Networking and Communications (ICNC),pp 369-373, Jan 2013.
61. F. Izquierdo, “Performance evaluation of a TOA-based trilateration method to locate
terminals in WLAN”, Wireless Pervasive Computing, pp 1- 6, January 2006.
62. Hostapd, (October 2015) https://w1.fi/hostapd/