Embed Size (px)
Citation preview

Rev. Integr. Bus. Econ. Res. Vol 1(1) 33
Copyright 2012 Society of Interdisciplinary Business Research (www.sibresearch.org)
AN ANALYSIS ON THE EFFICIENCY OF TAKAFUL AND INSURANCE COMPANIES IN MALAYSIA: A NON-PARAMETRIC APPROACH Norma Md. Saad ([email protected]) Dept of Economics, Kulliyyah of Economics and Management Sciences, International Islamic University Malaysia, 53100 Gombak, Selangor, Darul Ehsan, Malaysia. Tel: 03 6196 4649, Fax: 03 6196 4850
ABSTRACT
This study examines the efficiency of general or non-life takaful and insurance industry in Malaysia during the period 2007 to 2009. In order to measure their efficiencies, the output-input data consists of a panel of 28 general or non-life takaful and insurance companies are used. The most commonly used non-parametric approach, namely, Data Envelopment Analysis (DEA) is adopted to measure the efficiency of the Malaysian takaful and insurance companies. In the DEA technique, efficiency is measured by the Malmquist index. The Malmquist efficiency measures are decomposed into two components: efficiency change and technical change index. Efficiency change is again decomposed into pure efficiency and scale efficiency. It is found that, on average, the TFP of the non-life takaful and insurance industry in Malaysia is mainly due efficiency change and the main sources of the efficiency change are both scale efficiency and pure efficiency. Keywords: Data Envelopment Analysis (DEA); Malmquist index; Insurance efficiency; Takaful efficiency. 1. INTRODUCTION The birth of takaful industry in Malaysia was due to the prevailing needs of the Muslim population for an Islamic alternative to conventional insurance. It was also intended to complement the operation of the Islamic banking system in Malaysia. In 1984, the fisrt takaful company, Syarikat Takaful Malaysia was established with a paid-up capital of RM10 million. The encouraging demand demand for takaful products has initiated the set-up of three more takaful companies during the period of 1993 to 2003. In January 2006, the Central Bank of Malaysia awarded licenses for five more companies to operate takaful business in Malaysia. The new takaful licenses are offered to joint ventures or consortiums with strong financial background and experience in Islamic banking, takaful, and conventional insurance business. The study of efficiency of takaful companies is important for the Malaysian dual financial system where the takaful operators are operating in parallel with their conventional
Rev. Integr. Bus. Econ. Res. Vol 1(1) 34
Copyright 2012 Society of Interdisciplinary Business Research (www.sibresearch.org)
counterparts. Furthermore, the landscape of Malaysian financial system has undergone major structural changes in the era of globalisation with various liberalisation measures being introduced during the last decade. These factors are expected to have an impact on the efficiency of the insurance companies and the takaful operators. This study investigates efficiency of the non-life takaful companies for the period 2007-2009 and compares the performance of takaful companies with their conventional counterparts in Malaysia. For the takaful operators, the information obtained on the evaluation of the institutions’ performance may be used to improve its overall efficiency of operations and in turn, may contribute towards achieving its competitive edge. In this context, the objective of this study is to analyze the sources of efficiency and technical changes of all the life insurance companies in Malaysia. By using a non-parametric approach of Data Envelopment Analysis (DEA) together with Malmquist Index, we isolate the contributions of technical change, efficiency change, the pure and scale changes to total factor productivity growth of different takaful and insurance companies in Malaysia. Buoyed by the increase in the public awareness in Islamic finance, the takaful industry in Malaysia continues to enhance its competitiveness. In terms of new business, the general takaful business in Malaysia continues to experience a higher growth rate of 21.9% in the year 2009 compared to 13.5% in the previous year. The main contributor for the growth of contribution income came from the motor and fire lines of business. In order to enhance the resilience of the takaful industry in facing challenging operating environment, six key areas have been highlighted. One of the key areas is enhancing operational efficiency of takaful sector (Takaful Annual Report, 2005). Having this in mind, this study hopes to identify the determinants of efficiency of the takaful industry and therefore seeks to provide recommendations to further strengthen the resilience of takaful sector in the Malaysian financial system landscape. The paper is organized as follows. Section 2 presents the literature review and followed by a discussion on the methodology of DEA and Malmquist Index in Section 3. Section 4 presents the results and analysis and finally, Section 5 concludes. 2. LITERATURE REVIEW The question of the efficiency of the firms in insurance industry is very important in order to determine how the insurance industry will respond to various challenges and which firms are likely to survive (Berger et. al, 1993). The findings from the expanding body of literature on efficiency in insurance for both developed and emerging economies, have important implications for both insurance operators in improving their competitive edge and the policymakers as well as the regulators of insurance companies in order to improve the stability of the financial institutions and to enhance further the effectiveness of the monetary system as a whole. While there have been numerous international studies on the performance of other financial services industries, especially deposit-taking institutions, only a handful have been

Rev. Integr. Bus. Econ. Res. Vol 1(1) 35
Copyright 2012 Society of Interdisciplinary Business Research (www.sibresearch.org)
concerned with the insurance industry. A study on the performance of the insurance industry is crucial since the said industry is currently facing many challenges, including increased competition, consolidation, solvency risks, and a changing regulatory environment. The question of the efficiency of the firms in this industry is clearly important in order to determine how the industry will respond to these challenges and which firms are likely to survive (Berger et. al, 1993). Due to the increased competition, consolidation and a changing regulatory environment that have characterized the insurance industry in recent years, it is imperative for the insurance operators to always seek for ways and methods to improve their operating performance. The findings from the expanding body of literature on efficiency in insurance for both developed and emerging economies, have important implications for both insurance operators in improving their competitive edge and the policymakers as well as the regulators of insurance companies in order to improve the stability of the financial institutions and to enhance further the effectiveness of the monetary system as a whole. The measurement of insurance efficiency is mostly focused on the efficient frontier approach. This has been used widely to assess the efficiency levels as both approaches allow the use of multiple inputs and outputs from a sample of institutions to develop an efficiency frontier and evaluate the efficiency of a decision-making unit (DMU) relative to other DMUs in the sample. According to a survey conducted by Berger and Humphrey (1997) on 130 past studies that apply frontier efficiency analysis to financial institutions in 21 countries, there are various methods used to measure efficiency. These methods are divided into two approaches namely parametric and non-parametric. The most commonly used parametric approaches are the Stochastic Frontier Approach (composed error), Distribution Free Approach (different composed error) and the Thick Frontier Approach. For non-parametric approaches, the most commonly used are the Data Envelopment Analysis and the Free Disposable Hull [Cummins et al. (1999); Cummins and Zi (1998)]. Among the methods, the two main ones that have been widely used in the literature to measure the efficiency of the insurance industry are Stochastic Frontier Analysis (SFA) and Data Envelopment Analysis (DEA). The SFA which is also known as the Econometric Frontier Approach was developed by Aigner et al., (1977). This approach specifies a functional form for cost, profit or production relationship among inputs, outputs, and environmental factors and allows for random error (Berger and Humphrey, 1997). The functions are used to estimate the distance that a firm is from the optimizing envelope (Seale, 2000).
Data Envelopment Analysis (DEA) or the mathematical programming approach was introduced by Charnes et al. (1978) and draws upon the efficiency concept in Farrell (1957). According to Charnes et al. (1978), DEA estimates efficiency under the assumption of constant returns to scale, while Banker et al. (1984) assumed variable returns to scale. This approach constructs the frontier of the observed input-output ratios by linear programming. It assumes that linear substitution is possible between observed input combinations on an isoquant. In other words, DEA is a model that combines all the input and output

Rev. Integr. Bus. Econ. Res. Vol 1(1) 36
Copyright 2012 Society of Interdisciplinary Business Research (www.sibresearch.org)
information on the firm into a single measure of productive efficiency that lies between zero (i.e. a completely inefficient firm) and unity (i.e. a completely efficient firm). In addition, the DEA effectively estimates the frontier by finding a set of linear estimates that bound (envelop) the observed data (Leong et al., 2003). Thus, this technique is a benchmarking technique in the sense that the ‘best practice’ firms lie on the frontier and ‘envelop’ other inefficient firms (Neal, 2004).
Previous studies on the insurance industry’s efficiency using DEA provided evidence to understand the performance of the insurance sector in certain countries, e.g. those studies which analyze insurance in national markets such as the case in the United States done by Berger et al. (1997), Cummins et al. (1999), Meador et al. (2000), Gardner and Grace (2002), and Cummins and Weiss (2002), Cummins et al. (2010) and the insurance industries in other countries like in Japan, Italy, United Kingdom, Australia, Spain, and Germany have been studied by Fukuyama (1997), Cummins et al. (1996), Diacon (2001), Worthington and Hurley (2002), Cummins and Rubio-Misas (2001), and Mahlberg and Url (2010) respectively. Besides that, there are also studies that conduct analyses of the insurance industry in multi-markets such as Rees and Kessner (2000) and Diacon et al. (2002) where they have conducted studies by internationally comparing the efficiency of insurance companies in Europe.
A study undertaken by Cummins et al. (1996) measured technical efficiency and productivity growth in the Italian insurance market by estimating production frontiers based on a sample of 94 Italian insurers for the period 1985-1993. In this study, they found that technical efficiency in the Italian insurance industry ranged from 70 to 78 percent and measured total factor productivity gains of about 3.4 percent during the sample period. There was almost no efficiency change over the sample period, i.e. on average, Italian insurers operated at about the same distance from the production frontier throughout the sample period. However, productivity declined significantly over the sample period, with a cumulative decline of about 25 percent. The decline was attributable almost exclusively to technological regress, implying that the Italian insurers needed more inputs to produce their outputs at the end of the sample period than at the beginning. Another study on the effect of deregulation and consolidation on financial services markets by analyzing the Spanish insurance industry was done by Cummins and Rubio-Misas (2001). They analyzed a sample consisting of nearly all insurers reporting to the Spanish regulatory authority over the period 1989-1998 by estimating the “best practice” production and cost frontiers using the data envelopment analysis (DEA), while total factor productivity growth was analyzed using the Malmquist index methodology to draw inferences about the relationship between consolidation and productivity gains or losses in the industry. They found that cost efficiency was relatively low in the Spanish insurance market, averaging only 22.7 percent in 1998 which was primarily caused by allocative inefficiency, i.e. the failure to choose the optimal mix of inputs. Average allocative efficiency in 1998 was only 41.2 percent, whereas pure technical efficiency averaged 60 percent. Thus, Spanish firms on average are more successful in employing technology than in choosing optimal inputs. In addition, the Malmquist analysis showed that Spanish insurers experienced average total factor productivity growth over the sample period ranging from 0.6 to 2.6 percent per year, while the change in total factor productivity was

Rev. Integr. Bus. Econ. Res. Vol 1(1) 37
Copyright 2012 Society of Interdisciplinary Business Research (www.sibresearch.org)
attributable primarily to the technical efficiency growth rather than favorable technical change. Thus, the authors conclude that consolidation had improved efficiency in the Spanish insurance market, but on average, firms have not succeeded in achieving technical improvements. Fukuyama (1997) investigated productive efficiency and productivity changes of Japanese life insurance companies by focusing primarily on the ownership structures (mutual and stock) and economic conditions (expansion and recession) where he found that productive efficiency and productivity performances differ from time to time across the two ownership types under different economic conditions. Fukuyama (1997) found that stock and mutual life insurers in Japan have approximately equal technical efficiency scores. For the sample period 1989-1992, Fukuyama (1997) found the average technical efficiency in the Japanese life insurance industry to be about 0.91 (Cummins et al., 1996) and a total factor productivity gains of about 19 percent. Comparing the results of the three countries’ insurance industries with their United States counterparts, in terms of total factor productivity growth which is measured by the Malmquist index, the Japanese life insurers (Fukuyama, 1997) and the Italian life and property-liability insurers (Cummins et al., 1996) indicate efficiency gains that are considerably higher than in the U.S. In the case of the Spanish insurance industry, Cummins and Rubio-Misas (2001) found that cost efficiencies for Spanish insurers are low compared to the U.S insurers. Besides studies on a country-level basis, there are studies on the international comparison on the efficiency of insurance companies such as in Europe. Rees and Kessner (2000) found that the average efficiency level of the German firms was about 48 percent and the average efficiency level of the British firms was markedly higher, with a mean of around 57 percent and median of 52 percent. On the other hand, Diacon et al. (2002) found that, when a comparison was made between insurance companies in the U.K., Spain, Sweden and Denmark, U.K. insurers appear to have particularly low levels of scale and mix efficiencies. While studies of efficiency of the insurance industries in the United States and European countries are quite numerous, only few studies could be found in the case of Asian countries. Dutta and Sengupta (2010) conducted a study to investigate the impact of technological innovation on the efficiency of Indian insurance industry. Dutta and Sengupta (2010) examined whether increasing investment on IT-infrastructure which is resulting a technological innovation in business operation of the private companies has positive impact on efficiency changes or not. They used a panel data set of 12 life insurance companies over the period 2006-2009 to evaluate their efficiency scores by applying Data Envelopment Analysis and calculating the scale efficiency. The study concluded that increasing investment on IT-infrastructure has a positive impact on scale and technical efficiency change under constant and variable returns to scale assumptions. A prior study on the efficiency of the Malaysian insurance industry by Abu Mansor and Radam (2000) was conducted by using the non-parametric Malmquist Index approach to measure the productivity of the life insurance industry in Malaysia. In measuring the efficiency performance, they evaluated the Malmquist Index of a sample of 12 Malaysian

Rev. Integr. Bus. Econ. Res. Vol 1(1) 38
Copyright 2012 Society of Interdisciplinary Business Research (www.sibresearch.org)
insurance companies over the 1987 to 1997 period. Abu Mansor and Radam found that the overall productivity growth of the insurance industry in Malaysia was contributed by both technical efficiency and technical progress. A more recent empirical study on the efficiency of Malaysian insurance companies as well as other insurance companies around the world was conducted by Eling and Luhnen (2010). In this study Eling and Luhnen (2010) examined the efficiency of 3,831 companies from 91 countries using DEA and SFA techniques. Their sample includes 28 firm-years of life insurance companies and 113 firm-years of non-life insurance companies from Malaysia. In addition, considering the Malaysian dual financial system environment where the Takaful operators are operating in parallel with their conventional counterparts, another study was undertaken by Md. Saad et al. (2007) to analyze the sources of efficiency and technical changes of all the life insurance companies and compare the performance results with that of the Takaful operators in Malaysia. Using a sample of 13 Malaysian insurance companies over a period of 2002 to 2005, they used a non-parametric approach of DEA together with the Malmquist Index to isolate the contributions of technical change, efficiency change, the pure and scale changes to the total factor productivity growth of different life insurance companies and the Takaful operators. On the basis of the findings, the authors found that on average, the total factor productivity growth of the insurance industry in Malaysia is mainly due to technical change while efficiency change contributed a negative change. While Takaful presents a below average in total factor productivity but slightly above average for technical change as well as an equal to industry average in scale efficiency. However, this result is still inconclusive on the Takaful industry as a whole since only one takaful company is included in the study. Against this backdrop, the motivation of our paper is to investigate the efficiency of the general or non-life takaful and insurance industry in Malaysia using the nonparametric approach. We also hope to shed some light on the performance of the Takaful operators (whose operations are based on profit-sharing basis) as compared to the conventional insurance companies during the period of analysis. 3. DATA SOURCES AND METHODOLOGY This study utilizes data in the form of two inputs and outputs to investigate efficiency of non-life takaful and insurance firms in Malaysia. The inputs are commission and management expenses and the outputs are premium and net investment income. These inputs and outputs are used to investigate efficiency of 28 insurance firms in Malaysia, in which six of them are Islamic insurance firms. The firms under study are CIMB Aviva Takaful Berhad, Etiqa Takaful Bhd, Hong Leong Tokio Marine Takaful Bhd, MAA Takaful, Prudential BSN Takaful Bhd, Takaful Ikhlas, ACE, AM Assurance, AXA, Berjaya, Commerce, Hong Leong, ING, Kurnia, Lonpac, MAA, MCIS Zurich, MGAB, Multipurpose, OAC, OCA, P&O, Pacific, Pan Global, Progressive, Prudential, QBE, RHB, Tokio Marine, and Uni Asia General. Data on inputs and outputs are collected from period of 2007 to 2009. The study is limited to this period since most of the takaful companies were given licenses to conduct takaful

Rev. Integr. Bus. Econ. Res. Vol 1(1) 39
Copyright 2012 Society of Interdisciplinary Business Research (www.sibresearch.org)
business in 2006. The study has excluded Syarikat Takaful Malaysia since the company is the only one that has used cash basis of income recognition whereas other insurance and takaful companies used accrual basis. If this company is selected, then the data will not be consistent with others. In addition, the company is also the only company that has not used agents. Since the study has selected commission expenses as one of the inputs and no data is available on commission expenses, Syarikat Takaful has to be dropped. In exploring the contributions of technical and efficiency change to the growth of productivity in the Malaysian non-life insurance industries the generalized output-oriented Malmquist index, developed by Fare et al. (1989) is adopted in this study. The Malmquist indexes are constructed using the Data Envelopment Approach (DEA) and estimated using Coelli’s (1996) DEAP version 2.1. Malmquist index was chosen as there are a number of desirable features for this particular study. The DEA does not only require input prices or output prices in their construction, which make the method particularly useful in situations in which prices are not available publicly or non-existent, but it also does not require a behavioral assumption such as cost minimization or profit maximization in the case where the producers’ objectives differ, unknown or unachieved. This is first demonstrated by Fare et al. (1989) using the geometric mean formulation of the Malmquist index. Following this, Forsund (1991) derived the decomposition of the simple version of the Malmquist productivity index into technical change and efficiency change. Fare et al. (1994b) listed several traditional methods to calculate the Malmquist productivity index. But most of them require specification of a function form for technology. Charnes et al. (1978) proposed the DEA to construct a best-practice frontier without specifying production technology. Unlike traditional analysis techniques that look for the average path through the middle points of a series of data, DEA looks directly for a best-practice frontier within the data. Using a non-parametric linear programming technique, DEA takes into account of all the inputs and outputs as well as differences in technology, capacity, competition, and demographics and then compares individual with the best-practice (efficiency) frontier. According to Ali and Seiford (1993), DEA is a well-established non-parametric efficiency measurement technique which has been used extensively in over 400 studies of efficiency in management sciences during the last decade.
To date, the Malmquist productivity indexes and DEA have been used in a variety of studies. These studies include aggregate comparisons of productivity between countries (Fare et al., 1994a) as well as various economic sectors such as agriculture by Tauer (1998) and Mao and Koo (1996), airlines by Alam and Sickles (1995), telecommunications industry by Asai and Nemoto (1999) and Calabrese et al. (2001), banking by Tulkens and Malnero (1996), universities by Avkiran (2001), insurance by Cummins et al. (1999), Abu Mansor and Radam (2000), and Diacon et al. (2002).

Rev. Integr. Bus. Econ. Res. Vol 1(1) 40
Copyright 2012 Society of Interdisciplinary Business Research (www.sibresearch.org)
Following Fare et al. (1989), the Malmquist index of total factor productivity growth is written as follows:
( ) ( )( )
( )( )
( )( )
21
1111
1111111
,,
,,
,,,,,
×= ++++
+++++++
ttto
ttto
ttto
ttto
ttto
tttotttt
o yxDyxD
yxDyxD
yxDyxDyxyxM (1)
where the notations ( )11 , ++ ttt
o yxD , represents the distance from the period t+1 observation to the period t technology. The first ratio on the right hand side of equation (1) measures the change in relative efficiency (i.e., the change in how far observed production is from maximum potential production) between years t and t+1. The second term inside the brackets (geometric mean of the two ratios) captures the shift in technology (i.e., movements of the frontier function itself) between the two periods evaluated at xt and xt+1
. Essentially, the change in relative efficiency measures how well the production process converts inputs into outputs (catching up to the frontier) and the later reflects improvement in technology. According to Fare et al. (1994a), improvements in productivity yield Malmquist index values greater than unity. Deterioration in performance over time is associated with a Malmquist index less than unity. The same interpretation applies to the values taken by the components of the overall TFP index. Improvement in the efficiency component yielded index values greater than one and is considered to be evidence of catching up (to the frontier). Values of the technical change component greater than one are considered to be evidence of technological progress.
Consistent with Fare et al. (1994a), this study uses an enhanced decomposition of the Malmquist index, decomposing the efficiency-change component, calculated relative to constant-returns-to-scale technology, into a pure efficiency component (calculated relative to the variable returns to scale (VRS) technology) and a scale-efficiency change component which captures changes in the deviation between the VRS and constant-returns-to-scale (CRS) technology. The subset of pure efficiency change measures the relative ability of operators to convert inputs into outputs, while scale efficiency measures the extent to which the operators can take advantage of returns to scale, by altering its size in the direction of the optimal scale. 4. FINDINGS OF THE STUDY
4.1. Descriptive Statistics
Table 1 above reports the descriptive statistics of the outputs and inputs of 28 general or non-life takaful and insurance firms in Malaysia during the period of study. It seems that Kurnia has the highest amount of output, both premium and net investment income within the period of analysis, while Hong Leong are having the lowest amount of outputs, both premium and net investment income. As for the inputs, Kurnia and Prudential BSN Takaful Bhd seem to have the highest amount of inputs, commission and management expenses,

Rev. Integr. Bus. Econ. Res. Vol 1(1) 41
Copyright 2012 Society of Interdisciplinary Business Research (www.sibresearch.org)
respectively. Hong Leong, on the other hand, seems to have the lowest commission whereas Takaful Ikhlas records the lowest management expenses. On average, the amount of premium and net investment income within the period of study are RM242,084,597 and RM15,581,393, respectively. Meanwhile, the average of commission and management expenses are RM25,208,373 and RM45,348,145, respectively.
Table 1: Descriptive Statistics, 2007-2009
OUTPUT INPUT
Premium Net Investment Income Commission Management
Expenses Mean 242,084,597 15,581,393 25,208373 45,348,145 Std Dev. 234,872,821 15,049,986 23,909,378 38,767,888
Minimum 6,232,000
1,637,000 82,000
2,274,665
Maximum 1,015,768,000 85,584,000 229,505,000
229,505,000 4.2. Production Frontier and Efficiency Since the basic component of the Malmquist productivity index is related to measures of efficiency, the study initially reports efficiency change for the 28 firms from 2007-2009 in Tables 2 and 3 under constant returns to scale (CRS) and variable returns to scale (VRS), respectively. The values of unity imply that the firm is on the industry frontier in the associated year, while the values less than unity imply that the firm is below the frontier or technically inefficient. Thus, the lower the values from unity, the more inefficient it is compared to the values closer to one. For the years reported in Tables 2 and 3, Hong Leong Tokio Marine Takaful Bhd, Progressive, and Prudential are consistently efficient, both under constant returns to scale (CRS) and variable returns to scale (VRS). Kurnia is consistently efficient under VRS but not under CRS. Prudential BSN Takaful Bhd is the least efficient firm for CRS and VRS versions respectively. The estimates also indicate that Commerce, MAA, and Pan Global have successfully kept pace with technically feasible production possibilities and improving their distance to the industrial production frontier for both versions of technology. The values in Tables 2 and 3 show the percentage of the realized output level compared to the maximum potential output level at the given input mix. For example, in 2002, CIMB Aviva Takaful Berhad produced 37 percent of its potential output level and Lonpac produced 84.6 percent of its potential output under CRS. Under VRS of the same year, CIMB Aviva Takaful Berhad produced 47.1 percent of its potential output and Lonpac produced at its maximum potential output, 100 percent.

Rev. Integr. Bus. Econ. Res. Vol 1(1) 42
Copyright 2012 Society of Interdisciplinary Business Research (www.sibresearch.org)
As indicated by the weighted geometric mean in Tables 2, the average efficiency for the whole industry reduces for the period 2007 to 2008, but shows an increase in 2009. Under VRS, the overall geometric mean increases from 72.8 percent in 2007 to 78.8 percent in 2008, however, it decreases to 75.6 percent in 2009. On average, efficiency performance of the Malaysia’s takaful and insurance industry is relatively higher based on VRS than CRS.
Table 2: Efficiency of the Takaful and Insurance Companies, 2007-2009 (Constant Returns to Scale)
No. Takaful Company 2007 2008 2009
1 CIMB Aviva Takaful Berhad 0.370 0.272 0.267
2 Etiqa Takaful Bhd 1.000 0.724 1.000 3 Hong Leong Tokio Marine Takaful Bhd 1.000 1.000 1.000 4 MAA Takaful 0.498 0.363 0.357 5 Prudential BSN Takaful Bhd 0.121 0.154 0.295 6 Takaful Ikhlas 1.000 0.269 0.429 Geomean 0.529 0.379 0.479
No.
Insurance Company 7 ACE 0.365 0.348 0.346 8 AM Assurance 0.502 0.538 0.744 9 AXA 0.544 0.573 0.600 10 Berjaya 0.724 0.558 0.705 11 Commerce 0.420 0.387 1.000 12 Hong Leong 0.403 0.422 0.475 13 ING 0.573 0.505 0.612 14 Kurnia 0.523 0.527 0.602 15 Lonpac 0.846 0.721 0.745 16 MAA 0.419 0.507 0.748 17 MGAB 0.599 0.656 0.558 18 Multipurpose 0.460 0.633 0.595 19 OAC 0.782 0.680 0.653 20 P&O 1.000 0.729 0.854 21 Pacific 0.481 0.513 0.542 22 Pan Global 0.299 0.396 1.000 23 Progressive 1.000 1.000 1.000 24 Prudential 1.000 1.000 1.000 25 QBE 0.719 0.701 0.609 26 RHB 0.586 0.571 0.555 27 Tokio Marine 0.420 0.451 0.555 28 Uni Asia General 0.568 0.561 0.634
Geomean 0.569 0.569 0.652 Overall Geomean 0.615 0.563 0.660

Rev. Integr. Bus. Econ. Res. Vol 1(1) 43
Copyright 2012 Society of Interdisciplinary Business Research (www.sibresearch.org)
Table 3: Efficiency of the Takaful and Insurance Companies, 2007-2009 (Variable Returns to Scale)
No. Takaful Company 2007 2008 2009
1 CIMB Aviva Takaful Berhad 0.471 0.453 0.269
2 Etiqa Takaful Bhd 1.000 1.000 1.000 3 Hong Leong Tokio Marine Takaful Bhd 1.000 1.000 1.000 4 MAA Takaful 0.514 0.447 0.368 5 Prudential BSN Takaful Bhd 0.174 0.287 0.310 6 Takaful Ikhlas 1.000 0.448 0.478 Geomean 0.590 0.544 0.495
No. Insurance Company 7 ACE 0.496 0.551 0.460 8 AM Assurance 0.855 1.000 0.928 9 AXA 0.676 0.800 0.780 10 Berjaya 0.842 0.851 0.881 11 Commerce 0.616 0.764 1.000 12 Hong Leong 0.586 0.705 0.642 13 ING 0.574 0.609 0.618 14 Kurnia 1.000 1.000 1.000 15 Lonpac 1.000 1.000 0.976 16 MAA 0.715 0.876 1.000 17 MGAB 0.772 0.996 0.746 18 Multipurpose 0.494 0.821 0.669 19 OAC 0.985 0.974 0.719 20 P&O 1.000 1.000 1.000 21 Pacific 0.481 0.646 0.542 22 Pan Global 0.411 0.585 1.000 23 Progressive 1.000 1.000 1.000 24 Prudential 1.000 1.000 1.000 25 QBE 0.725 0.898 0.609 26 RHB 0.604 0.744 0.616 27 Tokio Marine 0.581 0.750 0.747 28 Uni Asia General 0.803 0.836 0.821
Geomean 0.711 0.823 0.786 Overall Geomean 0.728 0.787 0.756
4.3. Productivity Performance of Individual Company Tables 4 to 6 report the performance of the firms from 2007 to 2009 in terms of TFP change and its two subcomponents, technical change and efficiency change respectively. Note that a value of the Malmquist TFP productivity index and its components of less than

Rev. Integr. Bus. Econ. Res. Vol 1(1) 44
Copyright 2012 Society of Interdisciplinary Business Research (www.sibresearch.org)
one imply a decrease or a deterioration in productivity. Conversely, values greater than one indicate improvements of productivity in the relevant aspect. Subtracting 1 from the number reported in the table gives an average increase or decrease per annum for the relevant time period and relevant performance measure. Also note that these measures capture performance relative to the best practice in the relevant performance or relative to the best practice in the sample.
Table 4: Insurance Firms Relative Malmquist TFP Change between Time Period t and t + 1, 2007-2009
No. Takaful Company 2007-2008
2008-2009
Mean
1 CIMB Aviva Takaful Berhad 0.561 0.635
0.597
2 Etiqa Takaful Bhd 0.419 0.987 0.643 3 Hong Leong Tokio Marine Takaful Bhd 0.400 0.704 0.531 4 MAA Takaful 0.694 0.692 0.693 5 Prudential BSN Takaful Bhd 0.941 1.389 1.143 6 Takaful Ikhlas 0.105 1.119 0.343 Mean 0.431 0.883 0.617
No. Insurance Company
7 ACE 0.865 0.958 0.910 8 AM Assurance 1.021 1.043 1.032 9 AXA 1.081 0.976 1.027 10 Berjaya 0.776 1.033 0.895 11 Commerce 0.948 2.578 1.563 12 Hong Leong 1.038 0.999 1.018 13 ING 0.906 1.213 1.048 14 Kurnia 1.026 1.070 1.048 15 Lonpac 0.889 0.965 0.926 16 MAA 1.265 1.426 1.343 17 MGAB 1.113 0.790 0.938 18 Multipurpose 1.412 0.885 1.118 19 OAC 0.886 0.863 0.874 20 P&O 0.740 0.935 0.832 21 Pacific 1.091 1.014 1.052 22 Pan Global 1.331 4.683 2.497 23 Progressive 1.122 1.020 1.070 24 Prudential 1.013 1.055 1.034 25 QBE 1.023 0.801 0.905 26 RHB 1.000 0.905 0.951 27 Tokio Marine 1.069 0.998 1.033 28 Uni Asia General 1.016 1.001 1.008
Mean 1.017 1.164 1.088 Overall Geomean 0.846 1.056 0.945

Rev. Integr. Bus. Econ. Res. Vol 1(1) 45
Copyright 2012 Society of Interdisciplinary Business Research (www.sibresearch.org)
Table 4 displays calculated changes in the Malmquist-based Total Factor Productivity index. As evidenced in the results, ING, Pan Global, Progressive, and Prudential have positive productivity changes for the years in the period of study. In contrast, AXA, Berjaya, Kurnia, Lonpac, MAA, MGAB, Multipurpose, OAC, P&O, Pacific, QBE, RHB, and Uni Asia General record deterioration in TFP for years 2007 to 2009. However, there are some improvements of TFP change for Etiqa Takaful Bhd, Hong Leong Tokio Marine Takaful Bhd, Takaful Ikhlas, and ACE. In addition, Pan Global has the highest average TFP growth at an annual average rate of 149.7 percent, Commerce follows next with an annual rate of 56.3 percent, and then MAA is ranked third with an annual rate of 34.3 percent. Overall, all the firms have not increased their TFP on average for the period of 2007-2009. The TFP change, on average, shows some growth of 5.6 percent in the period 2008-2009. The Malmquist TFP index is further decomposed into its two components, technical change and efficiency change. The results of technical change and efficiency change are reported in Tables 5 and 6. Table 5 presents the index values of technical progress/regress as measured by average shifts in the best-practice frontier from period t to t+1. According to the results, ING, Pan Global, Progressive, and Prudential are the firms that experienced technical progress from year 2007 to 2009, while the other firms experienced both technical progress and regress. Over the period of analysis, Progressive records the highest change in technical progress (12.2 percent) in the year 2007-2008 and Prudential records the highest technical progress in year 2008-2009 (5.5 percent). Table 5 also displays that technical progress has been experienced by 18 firms in 2007-2008 and 4 firms in 2008-2009. On the average, the takaful and insurance firms recorded technical regress of -9 percent for the period 2007-2008 and -11.2 percent for the year 2008-2009. Over the period of analysis, Pan Global is found as the most technical progressive firm (36.6 percent), while Takaful Ikhlas is found as the most technical regressive firm (-47.6 percent).

Rev. Integr. Bus. Econ. Res. Vol 1(1) 46
Copyright 2012 Society of Interdisciplinary Business Research (www.sibresearch.org)
Table 5: Insurance Firms Relative Technical Change between Time Period t and t + 1,
2007-2009
No. Takaful Company 2007-2008
2008-2009
Mean
1 CIMB Aviva Takaful Berhad 0.765 0.647
0.704
2 Etiqa Takaful Bhd 0.578 0.715 0.643 3 Hong Leong Tokio Marine Takaful Bhd 0.400 0.704 0.531 4 MAA Takaful 0.952 0.704 0.817 5 Prudential BSN Takaful Bhd 0.740 0.726 0.733 6 Takaful Ikhlas 0.391 0.702 0.524 Mean 0.604 0.699 0.650
No. Insurance Company
7 ACE 0.908 0.963 0.935 8 Am Assurance 0.952 0.755 0.848 9 AXA 1.026 0.931 0.977 10 Berjaya 1.005 0.819 0.907 11 Commerce 1.030 0.997 1.034 12 Hong Leong 0.991 0.888 0.931 13 ING 1.029 1.000 1.014 14 Kurnia 1.019 0.936 0.977 15 Lonpac 1.043 0.934 0.987 16 MAA 1.046 0.967 1.006 17 MGAB 1.016 0.928 0.971 18 Multipurpose 1.026 0.942 0.983 19 OAC 1.020 0.899 0.958 20 P&O 1.015 0.799 0.901 21 Pacific 1.023 0.960 0.991 22 Pan Global 1.007 1.853 1.366 23 Progressive 1.122 1.020 1.070 24 Prudential 1.013 1.055 1.034 25 QBE 1.050 0.922 0.984 26 RHB 1.026 0.931 0.977 27 Tokio Marine 0.994 0.812 0.898 28 Uni Asia General 1.028 0.885 0.954
Mean 1.017 0.948 0.982 Overall Geomean 0.910 0.888 0.900

Rev. Integr. Bus. Econ. Res. Vol 1(1) 47
Copyright 2012 Society of Interdisciplinary Business Research (www.sibresearch.org)
Table 6: Changes in Firms Relative Efficiency between Time Period t and t + 1, 2007-2009
No. Takaful Company 2007-2008
2008-2009
Mean
1 CIMB Aviva Takaful Berhad 0.734 0.983
0.849
2 Etiqa Takaful Bhd 0.724 1.381 1.000 3 Hong Leong Tokio Marine Takaful Bhd 1.000 1.000 1.000 4 MAA Takaful 0.729 0.983 0.847 5 Prudential BSN Takaful Bhd 1.271 1.913 1.559 6 Takaful Ikhlas 0.269 1.593 0.655 Mean 0.714 1.263 0.950
No. Insurance Company
7 ACE 0.953 0.994 0.973 8 AM Assurance 1.072 1.382 1.217 9 AXA 1.054 1.048 1.051 10 Berjaya 0.772 1.262 0.987 11 Commerce 0.920 2.584 1.542 12 Hong Leong 1.047 1.126 1.086 13 ING 0.880 1.213 1.033 14 Kurnia 1.007 1.142 1.072 15 Lonpac 0.853 1.033 0.939 16 MAA 1.209 1.475 1.335 17 MGAB 1.096 0.851 0.966 18 Multipurpose 1.375 0.940 1.137 19 OAC 0.869 0.960 0.913 20 P&O 0.729 1.171 0.924 21 Pacific 1.067 1.056 1.061 22 Pan Global 1.321 2.527 1.827 23 Progressive 1.000 1.000 1.000 24 Prudential 1.000 1.000 1.000 25 QBE 0.975 0.868 0.920 26 RHB 0.975 0.972 0.973 27 Tokio Marine 1.076 1.229 1.150 28 Uni Asia General 0.988 1.130 1.057
Mean 1.000 1.170 1.082 Overall Geomean 0.930 1.189 1.052
Table 6 displays changes in relative efficiency for each individual company. The results indicate considerable variation across companies and times. Only 3 firms (Hong Leong Tokio Marine Takaful Bhd, Progressive, and Prudential) are found to be efficient (and therefore showed no change in efficiency) in all periods from 2007 to 2009. For the other
Rev. Integr. Bus. Econ. Res. Vol 1(1) 48
Copyright 2012 Society of Interdisciplinary Business Research (www.sibresearch.org)
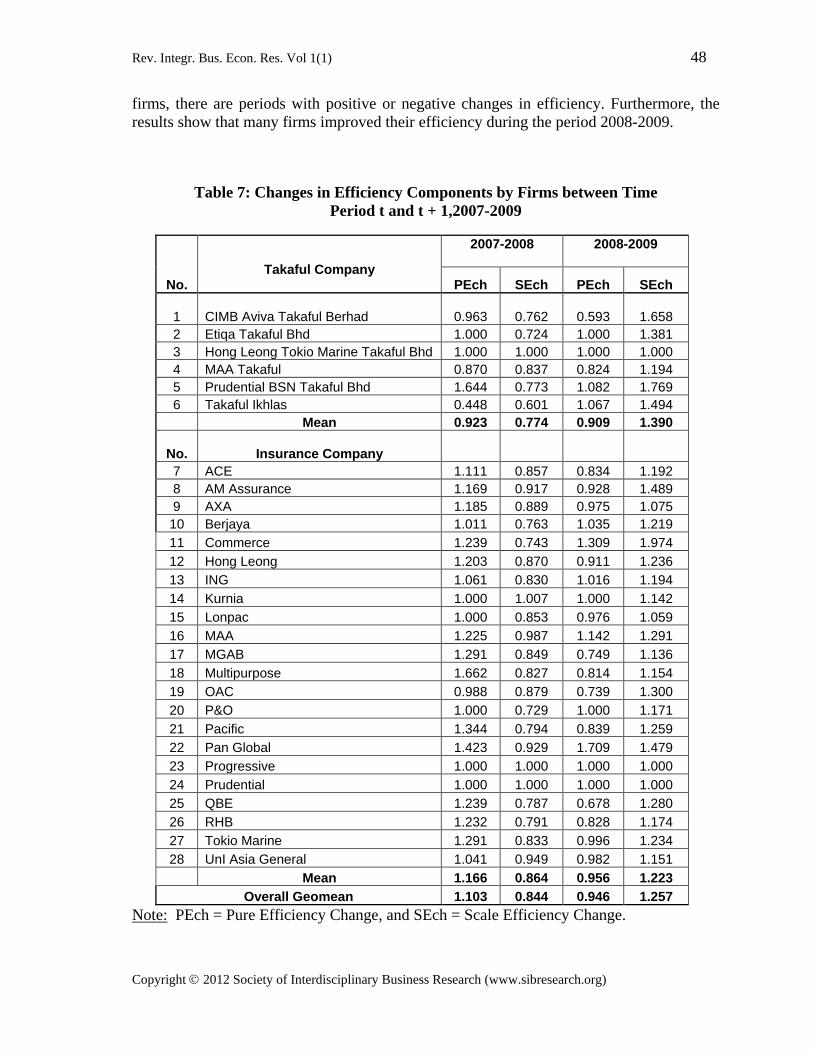
firms, there are periods with positive or negative changes in efficiency. Furthermore, the results show that many firms improved their efficiency during the period 2008-2009.
Table 7: Changes in Efficiency Components by Firms between Time Period t and t + 1,2007-2009
No. Takaful Company
2007-2008
2008-2009
PEch SEch PEch SEch
1 CIMB Aviva Takaful Berhad 0.963 0.762 0.593 1.658
2 Etiqa Takaful Bhd 1.000 0.724 1.000 1.381 3 Hong Leong Tokio Marine Takaful Bhd 1.000 1.000 1.000 1.000 4 MAA Takaful 0.870 0.837 0.824 1.194 5 Prudential BSN Takaful Bhd 1.644 0.773 1.082 1.769 6 Takaful Ikhlas 0.448 0.601 1.067 1.494 Mean 0.923 0.774 0.909 1.390
No. Insurance Company 7 ACE 1.111 0.857 0.834 1.192 8 AM Assurance 1.169 0.917 0.928 1.489 9 AXA 1.185 0.889 0.975 1.075 10 Berjaya 1.011 0.763 1.035 1.219 11 Commerce 1.239 0.743 1.309 1.974 12 Hong Leong 1.203 0.870 0.911 1.236 13 ING 1.061 0.830 1.016 1.194 14 Kurnia 1.000 1.007 1.000 1.142 15 Lonpac 1.000 0.853 0.976 1.059 16 MAA 1.225 0.987 1.142 1.291 17 MGAB 1.291 0.849 0.749 1.136 18 Multipurpose 1.662 0.827 0.814 1.154 19 OAC 0.988 0.879 0.739 1.300 20 P&O 1.000 0.729 1.000 1.171 21 Pacific 1.344 0.794 0.839 1.259 22 Pan Global 1.423 0.929 1.709 1.479 23 Progressive 1.000 1.000 1.000 1.000 24 Prudential 1.000 1.000 1.000 1.000 25 QBE 1.239 0.787 0.678 1.280 26 RHB 1.232 0.791 0.828 1.174 27 Tokio Marine 1.291 0.833 0.996 1.234 28 UnI Asia General 1.041 0.949 0.982 1.151
Mean 1.166 0.864 0.956 1.223 Overall Geomean 1.103 0.844 0.946 1.257
Note:
PEch = Pure Efficiency Change, and SEch = Scale Efficiency Change.

Rev. Integr. Bus. Econ. Res. Vol 1(1) 49
Copyright 2012 Society of Interdisciplinary Business Research (www.sibresearch.org)
During the entire period of the study, our results show that, on the average, Pan Global records the highest efficiency change with 82.7 percent, followed by Prudential BSN Takaful Bhd with 55.9 percent, Commerce with 54.2 percent, AM Assurance with 21.7 percent and Tokio Marine with 15.0 percent. Takaful companies, namely, Takaful Ikhlas, MAA Takaful, and CIMB Aviva Takaful Berhad are found to have experienced the most efficiency deterioration with -34.5 percent, -15.3 percent and 15.1 percent, respectively. Overall, there was an improvement of changes in relative efficiency throughout these years from deterioration of -7.0 percent to improvement of efficiency of 18.9 percent. In order to identify a change in scale efficiency, the efficiency change is further decomposed into two subcomponents, namely pure efficiency change and scale efficiency change in which the results are reported below. The results in Table 7 show that the pure efficiency and scale efficiency appear to be equally important source of growth to efficiency change. Three firms (Hong Leong Tokio Marine Takaful Bhd, Progressive, and Prudential) record no changes in annual growth for both the scale and pure efficiencies during the period 2007 to 2009. Relative to other insurance firms, Takaful Ikhlas records the highest deterioration of scale efficiency of -39.9 percent in 2007-2008. It is interesting to note that Commerce is found to have the highest growth in scale efficiency with 97.4 percent in 2008-2009. In terms of pure efficiency, again Takaful Ikhlas Bhd records the highest deterioration by -55.2 percent in 2007-2008. On the other hand, Pan Global records the highest growth in pure efficiency with 70.9 percent in the period 2008-2009. During the entire period of study, the year between 2007-2008 is identified as the year of pure efficiency improvement, while the year between 2008-2009 is recorded to be the year of scale efficiency improvement. 4.4. Productivity Performance of the Industry Table 8 summarizes the performance of Malmquist productivity index of the insurance industry in Malaysia between 2007 and 2009. On the average, Pan Global records the highest growth in TFP with 149.6 percent, efficiency and technical changes with 82.7 and 36.6 percent, respectively. Takaful Ikhlas, on the other hand, records the lowest growth in TFP with -65.7 percent, which is mainly due to technical regress (-47.6 percent). Together with Takaful Ikhlas, four other takaful companies, namely, MAA Takaful, Etiqa Takaful Bhd, CIMB Aviva Takaful Berhad, Tokio Marine are ranked the lowest in terms of TFP growth. The results show that only one takaful company, Prudential BSN Takaful Bhd, records a positive growth in TFP in the period of study. On average, the TFP of the insurance industry in Malaysia is mainly due to efficiency change (5.2 percent) while technical change contributed a negative change (-10.1 percent). Furthermore, the efficiency change is largely contributed by both scale efficiency (3 percent) and pure efficiency (2.1 percent). Our finding of substantial regress in technical components suggests that the decline in TFP of the takaful and insurance industry in

Rev. Integr. Bus. Econ. Res. Vol 1(1) 50
Copyright 2012 Society of Interdisciplinary Business Research (www.sibresearch.org)
Malaysia is due a lack of technical innovation. This further suggests that takaful and insurance companies could improve their productivity through technical innovation.
Table 8: Summary of Malmquist Productivity Index of Insurance Firms, 2007-2009
No. Takaful/Insurance company TFPch EFFch TECch PEch SEch 1 Pan Global 2.496 1.827 1.366 1.559 1.172 2 Commerce 1.563 1.542 1.013 1.274 1.211 3 MAA 1.343 1.335 1.006 1.182 1.129 4 Prudential BSN Takaful Bhd 1.143 1.560 0.733 1.333 1.170 5 Multipurpose 1.118 1.137 0.983 1.163 0.977 6 Progressive 1.070 1.000 1.070 1.000 1.000 7 Pacific 1.052 1.061 0.991 1.061 1.000 8 ING 1.048 1.033 1.014 1.038 0.995 9 Kurnia 1.048 1.073 0.977 1.000 1.073 10 Prudential 1.034 1.000 1.034 1.000 1.000 11 Tokio Marine 1.033 1.150 0.899 1.134 1.014 12 AM Assurance 1.032 1.217 0.848 1.042 1.169 13 Commerce 1.027 1.051 0.977 1.075 0.978 14 Hong Leong 1.018 1.086 0.938 1.047 1.037 15 Uni Asia General 1.008 1.057 0.954 1.011 1.045 16 RHB 0.951 0.974 0.977 1.010 0.964 17 MGAB 0.938 0.966 0.971 0.983 0.982 18 Lonpac 0.926 0.939 0.987 0.988 0.950 19 ACE 0.910 0.973 0.935 0.963 1.011 20 QBE 0.905 0.920 0.984 0.917 1.004 21 Berjaya 0.896 0.987 0.907 1.023 0.965 22 OAC 0.875 0.914 0.957 0.855 1.069 23 P&O 0.832 0.924 0.900 1.000 0.924 24 MAA Takaful 0.693 0.846 0.819 0.847 1.000 25 Etiqa Takaful Bhd 0.643 1.000 0.643 1.000 1.000 26 CIMB Aviva Takaful Berhad 0.597 0.849 0.703 0.755 1.124 27 Tokio Marine 0.530 1.000 0.530 1.000 1.000 28 Takaful Ikhlas 0.343 0.655 0.524 0.692 0.947
Mean 0.945 1.052 0.899 1.021 1.030

Rev. Integr. Bus. Econ. Res. Vol 1(1) 51
Copyright 2012 Society of Interdisciplinary Business Research (www.sibresearch.org)
Figure 1 reports the average changes in TFP and its components. In 2008, takaful companies performed worse than their conventional insurance counterparts as shown by lower average changes in TFP and its components. In 2009, the performance of takaful companies improved tremendously, as indicated by positive average changes in TFP and its components, efficiency, technical efficiency, and scale efficiency. Overall, the conventional insurance companies are found to perform better than takaful companies during under review period.
Figure 1: Changes in Mean TFP and its Components, 2003-2005

Rev. Integr. Bus. Econ. Res. Vol 1(1) 52
Copyright 2012 Society of Interdisciplinary Business Research (www.sibresearch.org)

Rev. Integr. Bus. Econ. Res. Vol 1(1) 53
Copyright 2012 Society of Interdisciplinary Business Research (www.sibresearch.org)
Notes: TFPi, EFFi, TEi, PEi, and SEi refer to the total factor productivity, efficiency, technical efficiency, pure efficiency and scale efficiency of the conventional insurance firms, while TFPt, EFFt, TEt, PEt, and SEt refer to the total factor productivity, efficiency, technical efficiency, pure efficiency and scale efficiency of the takaful firms. 5. CONCLUSION This paper investigates the efficiency of non-life takaful and conventional insurance companies in Malaysia over the period 2007 to 2009. As mentioned earlier, the study of efficiency of takaful companies is important for the Malaysian dual financial system where the takaful operators are operating in parallel with their conventional counterparts. The input-output data, consisting of a panel of non-life takaful and insurance companies, are analyzed in order to measure the efficiencies of these companies using the DEA approach. Overall, the efficiency of the takaful companies is found to be below their conventional counterparts. Only one takaful company, namely, Prudential BSN Takaful Bhd recorded TFP performances above the industrial average. The remaining five takaful companies are ranked the lowest among the twenty eight companies in terms of TFP performance. These findings should assist the takaful companies in improving their efficiency, in order to gain a competitive edge over their conventional counterparts. The results have important implications for the insurance and takaful companies in Malaysia. During the period of analysis, on average, the Malaysian takaful and insurance industry experienced a deterioration of TFP, mainly due to deterioration in technical efficiency. Efficiency change, however, contributed positively to TFP. Our findings of substantial regress in the technical components and positive growth in efficiency, imply that the deterioration of TFP in the takaful and insurance industry in Malaysia is due to the deficiency of innovation in technical components. This result indicates that the Malaysia’s
Rev. Integr. Bus. Econ. Res. Vol 1(1) 54
Copyright 2012 Society of Interdisciplinary Business Research (www.sibresearch.org)
takaful and insurance industry has to increase its TFP through an improvement in technical component such as optimizing the use of information and communication technology in providing good services to customers. The study is limited to only six takaful companies and the findings are thus indicative, but not conclusive of the Malaysian takaful and insurance industry as a whole. Since more companies have been issued licenses by the Central Bank to operate takaful business in Malaysia, further comprehensive studies are needed to examine the efficiency of takaful companies vis-à-vis their conventional counterparts.
REFERENCES Abu Mansor, S, and Radam, A. 2000. Productivity and efficiency performance of the
Malaysian life insurance industry. Jurnal Ekonomi Malaysia, 34: 93-105. Afriat, S.N. 1972. Efficiency estimation of production functions. International Economic
Review, 13(3): 568-598. Aigner, D.J.; Lovell. C.A.K. and Schmidt. P. (1977). “Formulation and estimation of
stochastic frontier production function models”. Journal of Econometrics. 6: 21-37. Alam, I., and Sickless, R. 1995. Long run properties of technical efficiency in the U.S.
airline industry. Rice University, Mimeo. Ali, A.I., and Seiford, L.M. 1993. “The Mathematical Programming to Efficiency
Analysis”, in H.O.Fried, C.A.K. Lovell, and S.S. Schmidt (eds), The Measurement of Productive Efficiency: Techniques and Applications. New York: Oxford University Press, pp.120-159.
Asai, S., and Nemoto, J. 1999. Measurement of efficiency and productivity in regional telecommunications business. Institute for Post and Telecommunications Policy Discussion Paper, No. 3, June 25.
Avkiran, N. 2001. Investigating technical and scale efficiencies of Australian universities trough Data Envelopment Analysis. Socio-Economic Planning Sciences, 35: 57-80.
Banker, R.D., Charnes, A. and Cooper, W.W. (1984), “Some Models for Estimating Technical and Scale Inefficiencies in Data Envelopment Analysis”. Management Science. 30(9): 1078-1092.
Berger, A.N., Cummins, J. D., and Weiss, M. A. 1997. The coexistence of multiple distribution systems for financial services: the case of property-liability insurance. Journal of Business, 70 (4): 261-292.
Berger, A.N., and Humphrey, D.B. 1997. Efficiency of financial institutions: International survey and direction for future research. European Journal of Operational Research, 98: 175-212.
Berger, A.N., Hunter, W.C., and Timme, S.G. 1993. The efficiency of financial institutions: A review and preview of research past, present and future. Journal of Banking & Finance, 17(2&3): 221-250.
Calabrese, A., Campisi, D., and Paolo, M. 2001. Productivity change in the telecommunications industries of 13 OECD countries. International Journal of Business and Economics, 1 (33): 209-223.

Rev. Integr. Bus. Econ. Res. Vol 1(1) 55
Copyright 2012 Society of Interdisciplinary Business Research (www.sibresearch.org)
Charnes, A., W.W. Cooper, and E. Rhodes. 1978. Measuring the efficiency of decision making units, European Journal of Operational Research 2, 429-444.
Coelli, T. 1996. A guide to DEAP version 2.1 Data Envelopment Analysis (Computer) program. CEPA Working Paper 96/98. Armidale: University of New England, CEPA.
Cummins, J. D., Turchetti, G.,and Weiss, M. A. 1996. Productivity and technical efficiency in the italian insurance industry, Working Paper Series, The Wharton, University of Pennsylvania.
Cummins, D. and H. Zi. 1998. Comparison of frontier efficiency methods: an application to the u.s. life insurance industry. Journal of Productivity Analysis, 10: 131-152.
Cummins, J.D., Tennyson, S, and Weiss, M.A. 1999. Consolidation and efficiency in the U.S. life insurance industry. Journal of Banking & Finance, 23: 325-357.
Cummins, J. D., Weiss, M., and H. Zi. 1999. Organizational form and efficiency: an analysis of stock and mutual property-liability insurers. Management Science, 45: 1254-1269.
Cummins, J.D. and Weiss, M.A., (2002). “Analysing Firm Performance in the Insurance Industry, using Frontier efficiency Methods”. In Dionne, G. (ed), Handbook of Insurance Economics. Kluwer, Boston, 767-829
Cummins, J. D. and Rubio-Misas, M. 2001. Deregulation, consolidation, and efficiency: evidence from the spanish industry, Working Paper Series, The Wharton School, University of Pennsylvania.
Cummins J. D., Weiss M. A., Xiaoying Xie , and Hongmin Zi, 2010. Economies of scope in financial services: A DEA efficiency analysis of the US insurance industry, Journal of Banking & Finance,Vol. 34, No. 7 , 1525–1539.
Diacon, S.R. (2001), “The Efficiency of UK General Insurance Companies”. CRIS Discussion paper Series. Centre for Risk & Insurance Studies. The University of Nottingham.
Diacon, S.R., Starkey, K, and O’Brien, C. 2002. Size and efficiency in European long-term insurance companies: an international comparison. The Geneva Papers on Risk and Insurance, 27 (3): 444-466.
Dutta, A. and Sengupta P. P. 2010. Impact of Technological Innovation on Efficiency – An Empirical Study of Indian Life Insurance Industry, A paper presented at the International Conference on Education and Management Technology, ICEMT 2010.
Eling, M., Luhnen, M., 2010. Efficiency in the international insurance industry: A cross-country comparison, Journal of Banking & Finance, Vol. 34, No. 7, 1497–1509.
Fare, R., Shawna, G., Bjorn, L., and Ross, P. 1989. Productivity development in Swedish hospitals: A Malmquist output index approach, Mimeo.
Fare, R., Shawna, G., Mary, N., and Zhongyang, Z. 1994a. Productivity growth, technical progress and efficiency change in industrialized countries. American Economic Review, 84: 66-83.
Fare, R., Shawna, G., and Knox, L. 1994b. Production Frontiers. New York: Cambridge University Press.
Forsund, F. 1991. The Malmquist productivity index. Paper presented at the 2nd European Workshop on Efficiency and Productivity Measurement. Berlgium: Centre of Operations Research & Econometrics, University Catholique de Louvain, Lauvain-la-Neuve.
Rev. Integr. Bus. Econ. Res. Vol 1(1) 56
Copyright 2012 Society of Interdisciplinary Business Research (www.sibresearch.org)
Fukuyama, H. 1997. Investigating productive efficiency and productivity changes of Japanese life insurance companies. Pacific-Basin Finance Journal, 5: 481-509.
Gardner, L.A. and Grace, M. F., (1993). “X-efficiency in the US life insurance industry”. Journal of Banking and Finance, 17: 497-410.
Leong, W.H., Dollery, B., and Coelli, T. (2003), “Measuring Technical Efficiency of Banks in Singapore for the period 1993-1999: An Application and Extension of the Bauer et al. (1997) Technique. ASEAN Economic Bulletin, 20(3): 195-210.
Mahlberg, B and Url, T., 2010. Single Market effects on productivity in the German insurance industry, Journal of Banking & Finance Vol. 34, No. 7, 1540–1548.
Mao, W., and Koo, W. 1996. Productivity growth, technology progress and efficiency change in Chinese agricultural production from 1984 to 1993. Agricultural Economics Report, No. 362. North Dakota Sate University.
Meador, J. W., Ryan, H. E., and Schellhorn, C. D. 2000. “Product Focus Versus Diversification: Estimates of X-Efficiency for the U.S. Life Insurance Industry,” in Harker, P. T. and Zenios, S. A. (eds), Performance of Financial Institutions: Efficiency, Innovation, Regulation. Cambridge University Press, 175-198.
Neal, P. (2004). “X-Efficiency and Productivity Change in Australian Banking”. Australian Economic Papers, 13(2), 174-191.
Rees, R. and Kessner, E. 2000. Regulation and efficiency in European insurance markets, Economic Policy, 29, Centre for Economic Policy Research, London.
Seale, Jr. J.L. (2000), “Stochastic Frontier Analysis”. Journal of Economics Literature. 38(4): 936-991.
Takaful Annual Report. 2005. Bank Negara. Tauer, L. 1998. Productivity of New York Dairy Farms measured by non-parametric
indices. Journal of Agricultural Economics, 49 (2): 234-249. Tulkens, H., and Malnero, A. 1996. “Non-parametric Approach to the Assessment of the
Relative Efficiency of Bank Branches”, in David. M (eds), Sources of Productivity Growth. Cambridge: Cambridge University Press.
Worthington, Andrew and Hurley, Emily (2002), “Cost Efficiency In Australian General Insurers: A Non-Parametric Approach”. British Accounting Review 34(1): 89-108.


![Takaful Insurance final for print out [Read-Only]€¦ · What is Takaful Insurance ? • Takaful—“bear ye one another’s burden.” Takaful insurance is based on the concept](https://img.dokumen.tips/doc/110x75/5f09a9447e708231d427e84c/takaful-insurance-final-for-print-out-read-only-what-is-takaful-insurance-a.jpg)