Embed Size (px)
Citation preview
An Analysis of U.S. Tropical Cyclone Flood Insurance Claim Losses: Storm Surge vs.
Freshwater
Gina Tonn ([email protected]) Risk Management and Decision Processes Center,
Wharton School, University of Pennsylvania
Jeff Czajkowski Risk Management and Decision Processes Center,
Wharton School, University of Pennsylvania
December 2018 Working Paper # 2018-12
_____________________________________________________________________ Risk Management and Decision Processes Center The Wharton School, University of Pennsylvania
3730 Walnut Street, Jon Huntsman Hall, Suite 500
Philadelphia, PA, 19104 USA Phone: 215-898-5688
Fax: 215-573-2130 https://riskcenter.wharton.upenn.edu/
___________________________________________________________________________

THE WHARTON RISK MANAGEMENT AND DECISION PROCESSES CENTER
Established in 1985, the Wharton Risk Management and Decision Processes Center develops and promotes effective corporate and public policies for low-probability events with potentially catastrophic consequences through the integration of risk assessment, and risk perception with risk management strategies. Natural disasters, technological hazards, and national and international security issues (e.g., terrorism risk insurance markets, protection of critical infrastructure, global security) are among the extreme events that are the focus of the Center’s research.
The Risk Center’s neutrality allows it to undertake large-scale projects in conjunction with other researchers and organizations in the public and private sectors. Building on the disciplines of economics, decision sciences, finance, insurance, marketing and psychology, the Center supports and undertakes field and experimental studies of risk and uncertainty to better understand how individuals and organizations make choices under conditions of risk and uncertainty. Risk Center research also investigates the effectiveness of strategies such as risk communication, information sharing, incentive systems, insurance, regulation and public-private collaborations at a national and international scale. From these findings, the Wharton Risk Center’s research team – over 50 faculty, fellows and doctoral students – is able to design new approaches to enable individuals and organizations to make better decisions regarding risk under various regulatory and market conditions.
The Center is also concerned with training leading decision makers. It actively engages multiple viewpoints, including top-level representatives from industry, government, international organizations, interest groups and academics through its research and policy publications, and through sponsored seminars, roundtables and forums.
More information is available at https://riskcenter.wharton.upenn.edu/
.

1
An Analysis of U.S. Tropical Cyclone Flood Insurance Claim Losses: Storm Surge vs. Freshwater
Gina Tonn and Jeffrey Czajkowski
December 10, 2018
Abstract:
Despite persistent record-breaking flood losses from tropical cyclones (TC), the U.S. continues to be inadequately prepared for these TC flood events, with the lack of residential flood insurance in place being a prime representation of this. One way to address this is through a better TC flood risk understanding of both the probability of the flood hazard (freshwater flooding and storm surge) as well as its expected damage impacts, facilitated by data analysis and dissemination. Here we analyze actual residential flood claim data from the National Flood Insurance Program for the full set of all 28 significant U.S. landfalling TC related flood events from 2001 to 2014 which we further split by storm-surge and freshwater. We illustrate key differences between the numbers of claims, paid claim amounts, and damage for freshwater and surge claims, as well as evaluate differences in flood claims and damage associated with flood zone, geography, TC event, and flood depth and duration. The findings provide important insights for flood loss and insurance considerations as well as for the mitigation and management of TC flood risk. 1. Introduction The record-breaking losses associated with U.S. landfalling tropical cyclones (TCs) in recent decades including the catastrophic events of 2017 continue to highlight that the United States remains highly vulnerable to TC risk. While wind and storm surge flooding risk are prevalent for landfalling TCs, recent work has highlighted the corresponding significant risk of freshwater flooding stemming from the associated TC heavy precipitation. Freshwater flooding from TCs has been shown to have substantial socio-economic impacts, killing hundreds and causing billions of dollars in damage (Pielke and Klein 2005, Changnon 2008, Jonkman et al. 2009, Czajkowski et al. 2013, Rappaport 2014, Czajkowski et al. 2017), affecting large U.S. geographic areas that are not limited to the coast (Villarini et al. 2004, Villarini et al. 2014, Czajkowski et al. 2017, Aryal et al. 2018), and potentially having the most severe effects hundreds of kilometers away from the center of circulation (Colle, 2003; Villarini et al. 2004; Atallah et al, 2007; Czajkowski et al. 2013; Czajkowski et al., 2017). The heavy rainfall and flooding caused by Hurricane Harvey (2017), Hurricane Irma (2017), and Hurricane Matthew (2016) are the latest prominent reminders of this reality. In fact, of all natural hazards, floods remain among the greatest threats to property and safety in the U.S., with economic losses in the billions of dollars annually (Kousky et al. 2018). Moreover, TC flood hazards – storm surge and freshwater - are expected to become more frequent in the future due to population growth, urban development, and climate change (Knutson et al. 2010). However, the U.S. continues to be inadequately prepared for these TC flood events, with the lack

2
of residential flood insurance in place being a prime representation of this. For example, initial estimates of Hurricane Harvey’s total residential flood losses ranged from $25 billion to $37 billion, of which 70% are estimated to be uninsured 1 . Residential flood loss estimates for Hurricane Irma range from $25 to $38 billion, with only $5-$8 billion of the loss insured2. And this TC “flood insurance gap” is not unique to the events of 2017 either, as Swiss Re (2017) estimates that of the $15 billion in annual damage, only 33% is insured. One way this substantial flood insurance gap can be addressed is through a better understanding of the TC flood risk by the public and the insurance industry, facilitated by data analysis and dissemination, leading to increased demand and supply for both flood insurance as well as flood risk mitigation. Flood risk by definition is the combination of both the probability of the flood hazard as well as its expected damage impacts. Therefore, achieving a better understanding of flood risk must address both of these components. However, most research on the public’s perception of flood risk has focused on the probability of the flood hazard component, not the expected damage outcome component (Botzen al. 2015). Botzen et al. (2015) in their survey of New York City homeowners showed that while residents overestimated the probability of a flood occurring, more than 60% of residents underestimated the associated expected damages to their home. They hypothesized that this underestimation of damages is a key factor in the lack of insurance uptake and flood risk mitigation in the study area as residents will believe that taking these actions is not cost-effective. From an insurance industry perspective, there is a continued push for more private market participation given that the majority of flood insurance policies in the U.S. are underwritten by the federal government through the National Flood Insurance Program (NFIP). Critical to making private flood coverage more viable is the ability to adequately assess and thus price flood risk through the development of flood catastrophe models (NRC 2015).3 Flood catastrophe models use state-of-the-art technical and statistical capabilities to model flood risk, with model outcomes calibrated to available flood claim data. At the time of this writing a number of flood catastrophe models have recently been, or are in the process of being developed in the U.S. including vendor models from AIR, CoreLogic, KatRisk, Impact Forecasting, and RMS, as well as a model being developed by the State of Florida. However, for industry acceptance of these models, validation is necessary, especially in regard to inland (i.e., freshwater) flooding (Wright 2017). Given the U.S. flood models’ relative infancy compared to other industry-modeled hazards, as well as their inherent technical complexity and varying assumptions, this is an on-going process (Wright 2017). For example, results from a U.S. flood model showcase4 based upon a similar set of hypothetical exposures demonstrated modeled event losses for Hurricane Harvey ranging from $497 million (from 43,000 claims) to $986 million (from 11,000 claims), with standard deviations of losses
1 http://www.brinknews.com/legacy-of-harvey-and-irma-turns-on-femas-post-disaster-response/?utm_source=BRINK+Subscribers&utm_campaign=4ec1d0a3d6-EMAIL_CAMPAIGN_2017_09_14&utm_medium=email&utm_term=0_c3639d7c98-4ec1d0a3d6-110213237 2 http://www.businessinsider.com/r-corelogic-estimates-hurricane-irma-property-damage-at-425-65-billion-2017-9 3 Here we are only referring to the technical ability to assess and price flood risk. The setting of risk-based premiums also has significant regulatory and political considerations as well. 4 In November 2017, a U.S. flood model showcase was put on in London by Lloyd’s of London and Argo Global. This showcase compared four main U.S. flood catastrophe modelers – AIR, KatRisk, Impact Forecasting (Aon), and CoreLogic.

3
ranging from $46 million to $637 million (Wright 2017). Consequently, insight into residential property flood vulnerability through realized claims analyses is an important facet of this validation process. Further, there has been very little published research available on flood damage claims to assist with the corroboration of these newly developed models. In this context, the purpose of our study is twofold: 1) to extend the recent research on TC freshwater flood risk by assessing residential freshwater flooding dollar loss amounts, i.e., the impact side of TC freshwater risk; 2) to further analyze residential surge flood risk in order to simultaneously provide further insight into the overall expected damage component of residential TC flood risk by analyzing the differences in, as well as drivers of, TC freshwater and storm-surge residential claim dollar losses. We use actual claim data from the NFIP for the full set of all 28 significant U.S. landfalling TC related flood events (https://www.fema.gov/significant-flood-events) having occurred from 2001 to 2014 (Czajkowski et al. 2017). This allows for an analysis of roughly 465,000 total NFIP TC residential flood claims which we further split by storm-surge and freshwater. While the physical address for each claim is unavailable, location is identified by NFIP community number. We seek to understand how realized TC flood damages differ based on several characteristics including: 1) geography, 2) individual TC event, 3) the TC flood hazard - storm surge or freshwater, 4) designated NFIP flood risk zone, and 5) flood depth and duration. Our hypothesis is that the number and amount of TC claims and damages varies primarily based on these key characteristics. Flood loss analysis of this kind has been deemed important for the insurance and reinsurance industries, for the evaluation of cost-effectiveness of flood mitigation measures, and for community preparedness (Thieken et al. 2005). The American Academy of Actuaries Flood Insurance Work Group has in fact raised the question of whether properties subject to either inland or storm surge flooding should be treated differently (AAAFIWG 2017). Therefore, we believe that a better understanding of the variations in NFIP TC claim loss amounts along these characteristics can help in making decisions about mitigating and managing TC flood risk including insuring properties subject to TC flood damage, as well as in assisting in the validation of existing flood catastrophe model loss amounts. The remainder of the paper is organized as follows: Chapter 2 provides background on residential flood insurance in the U.S. and an overview of the existing academic flood damage and flood claim research. Chapter 3 describes in more detail the NFIP data we use for the analysis as well as our methodologies. Chapter 4 presents our descriptive analytical results and Chapter 5 presents our statistical model results. Chapter 6 provides our concluding comments. 2. Background 2.1 Tropical Cyclone Flood Damage and Residential Flood Insurance in the U.S. During the first decade of the 21st century, there has been an increase in North Atlantic TC activity, with most of the ten costliest U.S. TCs of all time also occurring around this timeframe including Katrina, Sandy, and Ike (Blake et al. 2011). While wind-related damages were certainly substantial for these events, massive TC flood damages also ensued. The Federal Emergency Management Agency (FEMA), which administers the National Flood Insurance Program (NFIP) - the main provider of flood insurance in the U.S. – tracks the most significant flood events to have occurred since 1978 (fema.gov/significant-flood-events). Figure 1 illustrates the natural log of the total

4
amount of claims paid, as well as the natural log of the number of paid losses for each of the 49 TC events (tropical storm or hurricane) recorded in their database from 1978 to 2016. Clearly, over time we see an increase in both the total amount and number of losses paid per event due to TC flooding. Furthermore, the amount paid is increasing faster than the number of claims, indicating a rise in loss per claim.
Figure 1: Tropical Cyclone significant flood events in the U.S. from 1978 to 2016
Data modified from fema.gov/significant-flood-events (Note that this includes all NFIP losses, not just single-family residential). Y-axis is the natural log of the total amount of claims paid, as well as the natural log of the number of paid losses; X-axis are the 49 TC events over time starting from 1979 to 2016
One way for residential property owners to manage this TC flood risk is through the purchase of flood insurance. While the purchase of flood insurance does not eliminate or reduce the probability of a flood event occurrence, or even the actual damage incurred if an event does occur, it transfers the risk of financial loss to a third party, covering the costs of a portion of the incurred damage. In the U.S., the majority of residential flood insurance policies are purchased through the NFIP which was established in 1968 with the passage of the National Flood Insurance Act. Through the NFIP, single family residential property owners can purchase up to $250,000 in building coverage as well as an additional $100,000 of contents coverage. The NFIP has developed Flood Insurance Rate Maps (FIRMs) for all NFIP-participating communities to set risk-
0
5
10
15
20
25
1979
1979
1980
1982
1983
1985
1985
1985
1985
1989
1989
1989
1991
1992
1995
1996
1996
1996
1996
1998
1998
1998
1998
1999
1999
2001
2001
2002
2002
2003
2004
2004
2004
2004
2005
2005
2005
2005
2005
2006
2008
2008
2009
2011
2011
2012
2012
2012
2016
Nat
ural
log
of p
aid
loss
am
ount
and
num
ber o
f pai
d lo
sses
Year of Occurrence
AMOUNT PD ($) # PD LOSSES Linear (AMOUNT PD ($)) Linear ( # PD LOSSES)

5
based insurance premiums for each $100 of property (building and content) coverage purchased. These NFIP risk-based insurance premiums are primarily driven by two key components of the FIRM - the location of the structure in a particular flood hazard area designated on the FIRM, as well as the structure’s lowest floor elevation in relation to the FIRM’s base flood elevation, or the “PELV” and “DELV” components respectively in the NFIP rate formula (NRC 2015)5. In terms of different flood hazard areas (i.e., PELVs), the NFIP has defined high, moderate, minimal, and undetermined flood risk zones. High flood risk zones – or Special Flood Hazard Areas (SFHAs) - are areas that will be inundated by the flood event having a 1-percent chance (100-year flood) of being equaled or exceeded in any given year with coastal high risk areas also having an additional hazard associated with breaking waves of three feet or more; moderate flood risk zones are areas between the limits of the 1-percent-annual-chance and the 0.2-percent-annual-chance (or 500-year) flood; minimal flood risk zones are areas outside the 0.2-percent-annual-chance flood; and undetermined flood risk zones have not had a flood hazard analysis performed but flood hazard risk may exist (https://snmapmod.snco.us/fmm/document/fema-flood-zone-definitions.pdf). While for SFHAs the NFIP rate formula is explicitly used, for flood hazard areas outside of the SFHAs “risk-based rates in these zones are based on extrapolations of the hydrologic method, along with other actuarial and engineering judgments and underwriting experience” (NRC 2015 pg. 21). In terms of the damage to the property resulting from flood hazard inundation depth (i.e., DELVs), depth-damage functions are commonly used to ascertain this loss amount. The United States Army Corps of Engineers (USACE) and FEMA have developed depth-damage curves associated with different structure types and regions. For these developed curves, as flood depth increases so do damage and dollar loss amounts increase, but at varying rates across the various developed curves. An example of one such curve is shown as Figure 2. This curve was developed by the USACE for 1.5 story (i.e., split-level) residential structures without basements and provides a percent structural damage associated with varying flood depths. For instance, at 4 feet of water, estimated damage would be 23% of the structure value, while at 10 feet the estimated damage would be 49% of the structure value.
5 PELV is the annual probability that flood waters will reach or exceed a given depth relative to the base flood elevation; DELV is the damage to the property, expressed as a percentage of the total property value, resulting from that level of flood water (NRC 2015).

6
Fig. 2: USACE-IWR Depth Damage Curve, 1.5 story residential, structure
(Source: FEMA Multi-Hazard Loss Estimation Methodology, Flood Model, HAZUS-MH Technical Manual - https://www.fema.gov/media-library-data/20130726-1820-25045-8292/hzmh2_1_fl_tm.pdf)
The flood hazard and flood damage components are matched to estimate dollar losses for the identified base flood elevation6 inundation levels for the relevant flood hazard risk zone, forming a damage-exceedance probability function which is the basis then for the NFIP insurance rate (NRC 2015). Of course, in addition to these two key components, premium rates are also based on structural characteristics such as the number of floors, whether or not it has a basement, and whether it was constructed pre-FIRM or post-FIRM (i.e., built after the FIRM had been developed). Table 1 provides an illustration of residential building coverage flood insurance rates from the October 1, 2017 NFIP rating manual (https://www.fema.gov/media-library-data/1503239106510-30b35cc754f462fe2c15d857519a71ec/05_rating_508_oct2017.pdf) associated with V, A, and X zones for a regularly rated, post-FIRM, one-floor structure at variations elevation differences to the base flood elevation (BFE). Also we note that for all zones, rates provided in Table 1 are not the same for the total possible $250,000 in building coverage, but rather are distinct (signified by the forward slash) for the first $60,000 in coverage (basic coverage) and the next $190,000 in coverage (additional coverage). Table 1: Example NFIP Flood Insurance Rates (Regular Program – Post-FIRM Construction Rates; annual rate per $100 coverage)
Elevation of lowest floor compared to BFE
V-zone* A-zone** X-zone***
+4 5.13 / .90 .28 / .08 1.06 / .29 +3 5.13 / .90 .32 / .08 1.06 / .29 +2 5.13 / .90 .47 / .09 1.06 / .29
6 The 1% annual chance flood elevation at a given location within the SFHA.

7
+1 5.13 / .90 .87 / .13 1.06 / .29 0 5.13 / .90 2.02 / .20 1.06 / .29 -1 9.72 / 5.13 5.26 / .25 1.06 / .29 -2 --- 7.51 / .52 1.06 / .29 -3 --- 9.25 / .91 1.06 / .29 -4 --- 10.24 / 1.67 1.06 / .29
(Source: Modified from NFIP October 1, 2017 Rating Manual Tables 3B, 3D, and 3A for “V”, “A”, and “X” zones, respectively) * = FIRM ZONES ’75–’81, V1–V30, VE — BUILDING RATES, 1 FLOOR No Basement/ Enclosure/ Crawlspace ** = FIRM ZONES AE, A1–A30 — BUILDING RATES, 1 FLOOR No Basement/ Enclosure/ Crawlspace *** = FIRM ZONES A99, B, C, X, SINGLE FAMILY No Basement/Enclosure --- Standard rate not available From Table 1 we see that in general, premium rates are higher for the higher risk zones, as would be expected. For example, at 0 elevation difference to the BFE we see that basic coverage for the V-zone is 5.13 per $100 of coverage as compared to 2.02 for the A-zone, and 1.06 for the X-zone. In other words, at this 0 elevation difference V-zone rates are nearly 2.5 times the A-zone, and 5 times as much as the X-zone. While not all rate differences between zones for all rating tables in the NFIP manual are as substantial as these, V-zone rates are typically higher than comparable A-zone and X-zone rates. Therefore, we will compare differences in claim dollar losses by different flood zone locations. Similarly, the changes in rates associated with different elevations, as compared to the BFE, vary by zone and structure type. As illustrated in Table 1, V-zone and A-zone insurance rates increase as the difference between the building’s lowest floor elevation and BFE becomes more negative. For V-zone properties, structures with an elevation of 1-foot below the BFE pay almost twice the premium for basic coverage that structures with an elevation at the BFE pay (9.72 vs. 5.13). For A-zone properties, the premium for basic coverage is more than double for a structure with an elevation 1-foot below BFE versus at BFE (5.26 vs. 2.02). Likewise, an A-zone property with elevation 1-foot above the BFE pays less than half the premium for basic coverage that a structure with elevation at BFE would pay (0.87 vs. 2.02). Thus, we will compare differences in claim dollar losses by different flood depth levels, including depths in relation to the BFEs. 2.2. Past studies of flood damage and claims A series of studies inside and outside of the U.S. have investigated the drivers of flood damage using self-reported survey data or aggregate reported loss values. Thieken et al. (2005), based on data collected through phone surveys of 1,697 flood affected households in Germany, found that water level, flood duration, and contamination are the most influential indicators for self-reported building and contents damage. Building size and value variables are next in importance with precautionary measures such as information gathering, flood insurance, and building retrofit also playing a role in determining the amount of damage in some cases. Kreibich et al. (2005) interviewed 1,200 German households affected by a 2002 flood concerning their losses and the effectiveness of precautionary measures. They found that precautionary measures (e.g., household

8
elevation, water barriers, waterproof sealing, and fortification) were mainly effective during small events, but led to average damage reduction of 53% during an extreme flood in 2002. In the U.S., Brody et al. (2008) focused on the relationship between the built environment and flood impacts in eastern Texas with loss data obtained from the Spatial Hazard Event and Loss Database, US (SHELDUS). They found that flood damage is driven by rainfall, but is also a function of scale and type of development, and situation of the development within an ecological system. Additionally, a further study of ecological indicators of flood damage in counties along the Gulf of Mexico found that certain features of the natural environment help to mitigate economic flood consequences. These ecological indicators include floodplain area, soil porosity, naturally occurring wetlands, and pervious surfaces (Brody et al. 2012). Merz et al. (2010) provide a review of modeling tools for flood damage estimation, with models of residential flood damage including water depth, flood duration, building type, age, and quality, precautionary measures, and social class of the occupants as parameters. Based on a review of flood damage estimation models, Olesen et al. (2017) note that inundation depth, flood duration, contamination, velocity, and level of warnings prior to a flood are the characteristics that determine the degree of flood damage. In terms of analyses of actual flood insurance claims in the U.S., Michel-Kerjan and Kousky (2010) analyzed NFIP claims in Florida only from 1977 through 2005 and found that claims are higher in 100-year floodplains and are lower when a property is elevated, has more than one floor, or has a basement. They also found that claims are lower in communities that have undertaken flood mitigation activities and that hurricanes are responsible for the majority of claims in Florida. Kousky and Michel-Kerjan (2015) further analyzed all NFIP claims for the entire U.S. from 1978-2012 for single-family homes. The study found that the costliest claim years were associated with hurricanes - 2005 (Katrina), 2012 (Sandy), and 2008 (Ike). Variables correlated with structural paid claim amounts for single-family structures included flood zone, pre-FIRM construction, repetitive loss status, whether the structure is elevated, whether the structure has more than one floor, whether the structure has a basement, whether the claim was caused by storm surge, whether the claim was associated with Hurricane Katrina, Community Rating System, (CRS) class, as well as state, year and catastrophic fixed effects7 (Kousky and Michel-Kerjan 2015). Table 2 provides some key data from this study.
Table 2: Summary of results from Kousky and Michel-Kerjan (2015) report
Years Mean Paid Claim Median Paid Claim Number of paid claims 1980-2012 $34,478 $12,555 1,119,274 1980-1989 $16,355 $7,735 228,275 1990-1999 $21,795 $9,900 321,913 2000-2009 $54,506 $21,740 456,255 2005 $91,911 $72,887 177,100 2012 $34,080 $20,000 105,434
7 In the NFIP database, catastrophe numbers are assigned for all identified significant flood events, i.e., having more than 1,500 paid losses (fema.gov/significant-flood-events), which are more than just tropical cyclone related flood events.

9
For their entire study period they found that the mean damage per claim was $34,478 with the median damage per claim being $12,555. They also found that these values have been steadily increasing over time. In addition, information regarding the nature of claims was uncovered through their statistical analyses. From their main results, they found that on average A-zone claims are 20-25% higher than non-SFHA claims, while V-zone claims are 35 to 36% higher than non-SFHA claims. Pre-FIRM claims are 42 to 45% higher than post-FIRM, and claims for repetitive loss structures are 5 to 20% higher than for non-repetitive loss properties. Surge claims were found to be 8 to 20.5% higher than non-surge claims depending on whether the catastrophe code fixed effect was included or not, respectively. They hypothesize that the catastrophe code fixed effect, when included, picks up much of the localized nature of the event, thus lowering the surge coefficient impact. While their analysis was the first to provide insights on surge versus non-surge claim dollar loss values, it was focused on historical claims from all flood events, not only claims resulting from TCs. Additionally, Czajkowski et al. (2013, 2017) have shown that accounting for freshwater claims versus surge claims across the entire storm impacted area is critical when assessing TC flood risk. However, these TC flood risk analyses were limited to assessing the number of claims, not the variation in claim and damage amounts. We will address both of these aspects here to provide further insight into the expected damage component of overall residential TC flood risk by analyzing the differences in, as well as drivers of, TC freshwater and storm-surge NFIP residential claim dollar losses. Understanding these difference for TC flood risk is important as some current thinking wonders whether “properties that are subject to different types of flooding should be treated differently”, especially for coastal flooding which is believed to be driven primarily by storm surge (AAAFIWG, 2017). However, some caution should be noted when dealing with NFIP claim data as we utilize here given that this data have been shown to be highly variable (NRC 2015). For example, the distribution of damage ratios (i.e., damage as percentage of total insured exposure) for the two prominent hurricane years of 2005 and 2012 were shown to vary significantly between 0 to 100% for the same two feet of inundation depth (NRC 2015). Likewise, mean damage ratios in 2005 and 2012 were also shown to vary significantly for range of inundation depth above the first floor elevation (NRC 2015) with 2012 values typically 30 to 50% lower for every water inundation level. They hypothesize that these differences could be due to factors beyond flood depth driving damage, poor data quality, or “unrecognized variability within a structure class” (NRC 2015). In terms of poor data quality, larger NFIP claim sample sizes are critical (NRC 2015). With these limitations in mind, the NFIP is still the main provider of flood insurance in the U.S. and their claims data is in fact being used to calibrate the existing flood CAT models (Wright 2017). Consequently, additional clarity and insight drawn from this NFIP claim loss data is critical, especially from a TC damage perspective. 3. Data and Methods 3.1. Data

10
Following from Czajkowski et al., (2017), the initial dataset for this study includes roughly 465,000 NFIP TC flood claims for single-family properties for the set of all 28 significant U.S. landfalling TC related flood events having occurred from 2001 to 2014.8 Claims for multi-unit properties can differ substantially from those for single-family houses, and for consistency, our analysis was limited to claims for single-family houses. The initial dataset includes all claims filed, including claims that have been closed, claims that are still open, and claims that have been closed without payment. Claims are closed when FEMA makes a determination and related payment (if applicable) for the claim. An open claim is still under evaluation. A claim may be closed without payment due to an expired policy, for instance. We evaluated the number of claims that fall within each of these categories to understand which set should be included in our analysis. Approximately 19% of the claims are open, 64% are closed, and 17% are closed without payment. Of the claims closed without payment, 67% were for policies not currently in effect (future, cancelled, or expired policies). We use two views of the claims data with the focus on structural (i.e., building) paid claims and damage, with paid claim and damage amounts for contents excluded. The first is paid claims, which includes all claims where the structure payment amount exceeded $0. The second is claims with damage, which include all claims where a structural damage amount was listed. The claims dataset provides information on the amount that FEMA paid out for a claim, taking into account policy limits and deductibles, whereas the damage dataset reflects total reported damage. To remove data with potential errors, claims with paid building claim amounts greater than $250,000 were removed when analyzing paid claim amounts. Claims with damage amounts greater than $10 million were removed when analyzing damage amounts. Many claims provided in the NFIP dataset have paid claim amounts of $0 or paid damage amounts of $0, and these are also not utilized in the analysis. Many claims belong to both the paid claims and claims with damage datasets, while some belong to just one or the other. An overview of the number of claims in each set by the 28 TCs is provided in Table 3. Excluding Hurricane Katrina, roughly 232,000 claims include paid claim amounts and 223,000 claims include damage amounts. These non-zero claims were used for analysis in this study.
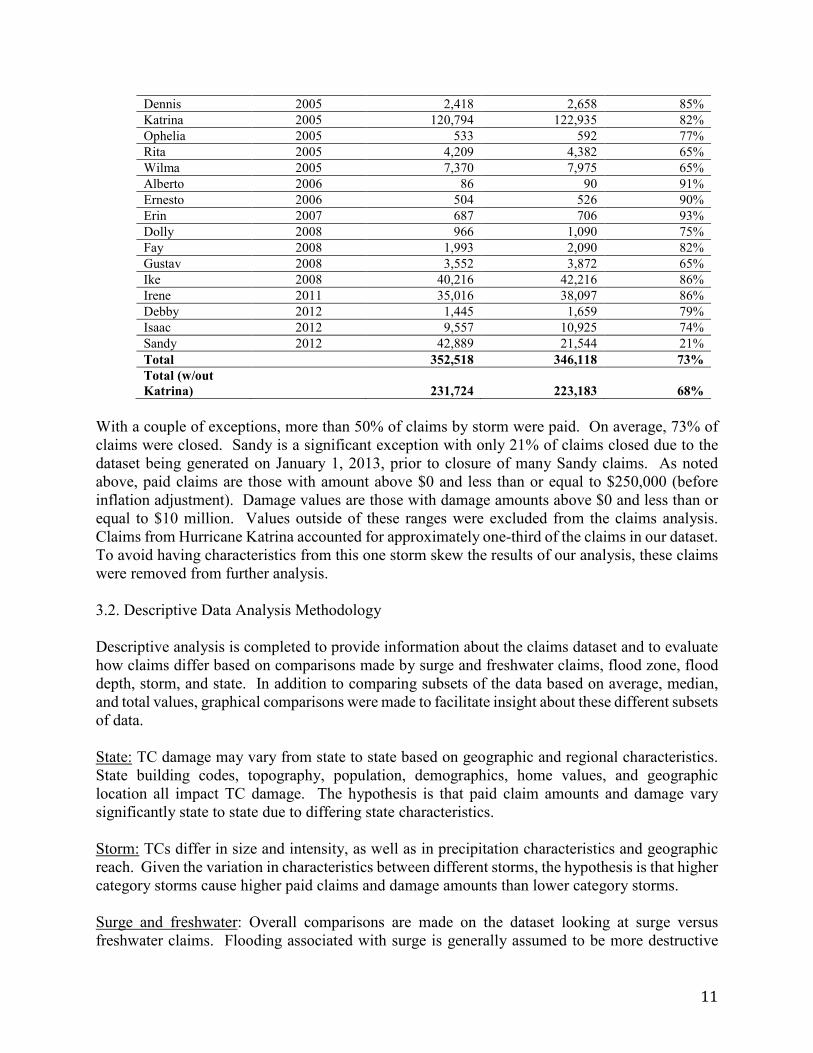
Table 3: Number of Claims by Storm
Storm Storm Year Number of Paid Claims
Number of Claims with Damage
Percent Closed Claims
Allison 2001 26,899 27,646 90% Barry 2001 3 5 43% Gabrielle 2001 1,446 1,608 75% Isidore 2002 6,482 7,119 79% Lili 2002 2,126 2,523 66% Claudette 2003 889 1,106 74% Isabel 2003 18,025 19,170 86% Alex 2004 168 216 56% Charley 2004 1,401 1,620 57% Frances 2004 2,148 2,320 63% Ivan 2004 18,048 18,563 91% Jeanne 2004 2,648 2,865 70%
8 While we include all FEMA significant TC events from 2001 to 2014, the NFIP claims dataset is from December 31, 2012. No significant TC events were listed in 2013 or 2014.
11
Dennis 2005 2,418 2,658 85% Katrina 2005 120,794 122,935 82% Ophelia 2005 533 592 77% Rita 2005 4,209 4,382 65% Wilma 2005 7,370 7,975 65% Alberto 2006 86 90 91% Ernesto 2006 504 526 90% Erin 2007 687 706 93% Dolly 2008 966 1,090 75% Fay 2008 1,993 2,090 82% Gustav 2008 3,552 3,872 65% Ike 2008 40,216 42,216 86% Irene 2011 35,016 38,097 86% Debby 2012 1,445 1,659 79% Isaac 2012 9,557 10,925 74% Sandy 2012 42,889 21,544 21% Total 352,518 346,118 73% Total (w/out Katrina) 231,724 223,183 68%
With a couple of exceptions, more than 50% of claims by storm were paid. On average, 73% of claims were closed. Sandy is a significant exception with only 21% of claims closed due to the dataset being generated on January 1, 2013, prior to closure of many Sandy claims. As noted above, paid claims are those with amount above $0 and less than or equal to $250,000 (before inflation adjustment). Damage values are those with damage amounts above $0 and less than or equal to $10 million. Values outside of these ranges were excluded from the claims analysis. Claims from Hurricane Katrina accounted for approximately one-third of the claims in our dataset. To avoid having characteristics from this one storm skew the results of our analysis, these claims were removed from further analysis. 3.2. Descriptive Data Analysis Methodology Descriptive analysis is completed to provide information about the claims dataset and to evaluate how claims differ based on comparisons made by surge and freshwater claims, flood zone, flood depth, storm, and state. In addition to comparing subsets of the data based on average, median, and total values, graphical comparisons were made to facilitate insight about these different subsets of data. State: TC damage may vary from state to state based on geographic and regional characteristics. State building codes, topography, population, demographics, home values, and geographic location all impact TC damage. The hypothesis is that paid claim amounts and damage vary significantly state to state due to differing state characteristics. Storm: TCs differ in size and intensity, as well as in precipitation characteristics and geographic reach. Given the variation in characteristics between different storms, the hypothesis is that higher category storms cause higher paid claims and damage amounts than lower category storms. Surge and freshwater: Overall comparisons are made on the dataset looking at surge versus freshwater claims. Flooding associated with surge is generally assumed to be more destructive

12
due to the velocity of the floodwater, which is reflected in higher V-zone NFIP insurance rates as discussed in Section 2. The hypothesis is that paid claims and damage amounts are higher for surge versus freshwater claims and that the characteristics of the claim differ given the different nature of flooding. Because one of the key goals of our analysis was to evaluate differences between surge and freshwater claims, only claims that clearly fit into one of these categories, based on FEMA’s cause of loss codes, were included. Claims designated as tidal water overflow represent surge claims in our study. Freshwater claims include claims associated with overflow from a stream, river, or lake and claims associated with accumulation of rainfall or snowmelt. Claims with other cause of loss codes were removed from the study and are not included in the claims numbers presented in Table 3. Flood zone: Damage is compared based on FEMA flood hazard zone including V-zone, A-zone, and X-zone. One might expect the majority of damage from TCs to be in V-zones, which are associated with coastal hazards. As illustrated in Table 1, V-zone flood insurance rates are typically higher than comparable A-zone and X-zone rates. Therefore, given that risk-based rates are set based upon expected dollar losses, we hypothesize that V-zone TC claim dollar loss amounts will be significantly higher on average than A-zone and X-zone TC claim dollar loss amounts. For each flood insurance claim used in our study we specify a flood zone (V-zone, A-zone, or X-zone) to analyze claim dollar loss amounts in light of these flood zones to identify differences and to evaluate whether differences in claims are comparable to differences in the NFIP rates. Flood depth and duration: Flood claims are analyzed based on flood depth, with the hypothesis that a higher water depth should equate to higher paid claim and damage amounts. As illustrated in Table 1, V-zone and A-zone insurance rates increase as the difference between building lowest floor elevation and BFE becomes more negative. Flood depth is provided in feet, in the NFIP dataset, and claims that had a flood depth specified were analyzed to understand how damage and claim amounts relate to depth. In our study, we compare differences in claim dollar losses by different flood depths. We are interested in understanding whether these differences are proportional to differences in premiums. While our dataset does not include data on flood duration, negative versus positive elevation of structures was used as a proxy for flood duration. This assumes that negatively elevated structures (those with elevation below the BFE) endure longer duration flooding than positively elevated structures (those with elevation at or above the BFE).
3.3. Statistical Analysis Methodology While the descriptive data analysis is able to provide insights into the various data claim loss relationships, it is only able to do this in a mostly bivariate fashion, not simultaneously controlling for a host of other relevant factors. Therefore, in addition to the descriptive data analysis, statistical analysis was performed to better understand the multivariate relationships between the characteristics of communities and properties with paid claim amounts. First, a regression analysis is performed on a community-by-storm basis to identify how community and storm characteristics are statistically related to the number of paid claims in a community. The dependent variable for the community analysis is number of paid claims for the community for each storm (ln). The independent variable data came from the claims dataset, GIS data for NFIP communities, and storm severity. Independent community variables (Xc) include population, impervious surface,

13
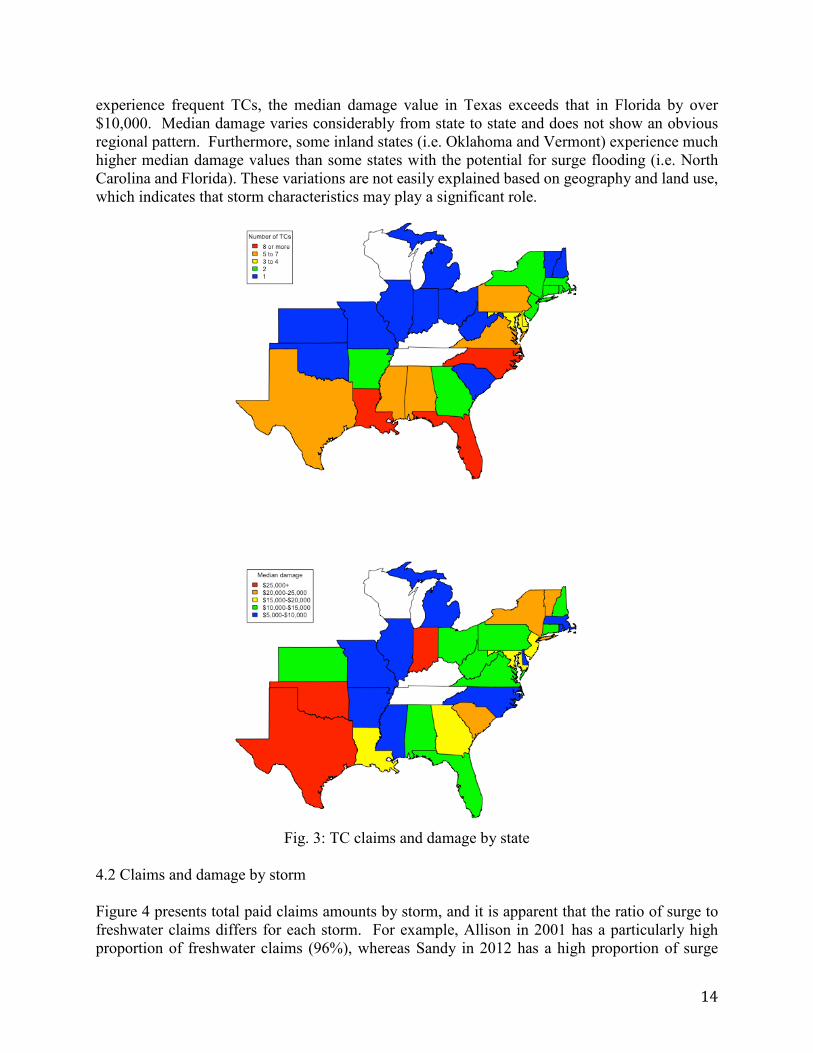
distance from coast, and region. Independent storm variables (Xs) include storm severity and year fixed effect. ΣClaim i,c,s = f(Xc,Xs) [1] Second, a further regression analysis is performed on individual single-family residential property claims to identify how individual property characteristics are statistically related with paid claim and damage amounts for individual properties. The individual claim analysis is run both with dependent variable as the ratio of paid claim amount to coverage (ln) and as the ratio of damage to replacement cost value (ln). Independent claim variables (Xi) include structure characteristics and flood zone. Independent community variables (Xc) include region and distance to coast. Independent storm variables (Xs) include storm severity and year fixed effect. Claimi,c,s = f(Xi, Xc,Xs) [2] Claims dataset: This data included the paid claim amount and replacement cost value of structural damage amount for each claim. Also included were the storm and flood depth for each claim, as well as the NFIP community and state that the structure is located in. Data about the structure included flood zone, pre-FIRM or post-FIRM construction, whether the structure is repetitive loss, whether the structure is elevated, the number of stories, whether the structure has a basement, and the replacement cost value of the structure. GIS data: GIS data were generated for each NFIP community including distance from the community to the coast, percent impervious surface, and population in 2010. Storm severity: To evaluate the differences in claims and damage based on the severity of the storm, storms in the dataset were designated as Tropical Storm, Minor Hurricane (category 1 or 2) or Major Hurricane (category 3 or above) (Czajkowski et al. 2017). 4. Descriptive Data Results 4.1 Claims by state TC claims and damage vary by state based on geographic location, as TCs most commonly impact Florida, the Gulf Coast, and the Southeast. Other state characteristics, which are not accounted for in insurance rates, but can significantly affect damage include state building codes, topography, population, demographics, and home values. State mitigation actions and expenditures vary greatly, and can also have a significant impact on state-level flood claims and damage. The hypothesis is that paid claim amounts and damage vary significantly state to state due to differing state characteristics. Figure 3 illustrates the number of TCs and the median damage by state (dollar losses are adjusted to 2012 values). Florida had claims from the greatest number of the 28 storms at 15, with Louisiana and North Carolina also experiencing a high number of TCs over the period of analysis. Median damage amounts vary considerably from state to state. This can be attributed to differences in geography, land use policies, and in storms affecting the states. While Florida and Texas both
14
experience frequent TCs, the median damage value in Texas exceeds that in Florida by over $10,000. Median damage varies considerably from state to state and does not show an obvious regional pattern. Furthermore, some inland states (i.e. Oklahoma and Vermont) experience much higher median damage values than some states with the potential for surge flooding (i.e. North Carolina and Florida). These variations are not easily explained based on geography and land use, which indicates that storm characteristics may play a significant role.
Fig. 3: TC claims and damage by state
4.2 Claims and damage by storm Figure 4 presents total paid claims amounts by storm, and it is apparent that the ratio of surge to freshwater claims differs for each storm. For example, Allison in 2001 has a particularly high proportion of freshwater claims (96%), whereas Sandy in 2012 has a high proportion of surge

15
claims (68%). Damage from Allison was due to a high amount of precipitation in Texas, whereas Sandy struck the northeast region and storm surge was a major driver of damage. We find that only six of the 28 TCs studied had more surge than freshwater paid claims – Alex (75%), Barry (75%), Charley (70%), Ivan (54%), Ophelia (56%), and Sandy (68%).
Figure 4: Total paid claim amounts by storm Table 4 provides a summary of claims and damage for each storm considered in our analysis (dollar losses are adjusted to 2012 values). These storms vary considerably in average, median, and total paid claims and damage. These differences can be attributed to differences in storm characteristics and in the communities and geography that they impact. The highest number of paid claims was recorded for Sandy (42,889), while the total paid claim amount was the highest for Ike ($1.7 billion), which was just short of a Category 3 when making landfall in the vicinity of Galveston, Texas. Some Sandy claims were still being processed at the time that this dataset was generated, and Sandy claims may have been generated or paid subsequent to this dataset. Average claims and damage were the highest for Ivan ($46,150 and $121,664), which made landfall as a Category 3 hurricane, impacting Florida and Alabama. Rita made landfall between Texas and Louisiana, in areas previously impacted by Hurricane Katrina, and while the total damage was not the highest ($188 million), the average and median paid claims and damage were relatively high ($44,653 and $35,269). Hurricane Dennis made landfall as a Category 3 storm, but damage was limited to Florida due to the storm’s quick speed and compact size (Czajkowski and Done 2014). Jeanne made landfall as a Category 3 storm, with impacts in Florida and the Mid-Atlantic region (Delaware, Maryland), however average and total claims and damages were lower than some other Category 3 storms ($18,435 and $49 million).

16
Table 4: Claims and Damage by storm Claims Damage
Storm Year
Cat.* Number of claims
Primarily Surge or
Freshwater Average Median Total Average Median Total Allison 2001 TS 26,899 Freshwater $32,440 $27,289 $873M $67,190 $32,362 $1,858M Barry 2001 TS 3 Surge $9,675 $5,198 <$1M $8,501 $6,727 <$1M Gabrielle 2001 TS 1,446 Freshwater $13,337 $7,733 $19M $31,666 $8,667 $51M Isidore 2002 TS 6,482 Freshwater $12,973 $6,094 $84M $32,115 $7,193 $229M Lili 2002 1 2,126 Freshwater $13,199 $6,516 $28M $23,314 $6,810 $59M Claudette 2003 1 889 Freshwater $9,858 $5,571 $9M $33,786 $6,141 $37M Isabel 2003 2 18,025 Freshwater $23,918 $12,482 $431M $95,201 $14,581 $1,825M Alex 2004 2 168 Surge $11,462 $4,707 $2M $29,829 $5,642 $6M Charley 2004 4 1,401 Surge $12,671 $7,046 $18M $91,953 $8,052 $149M Frances 2004 2 2,148 Freshwater $27,473 $12,111 $59M $64,771 $12,819 $150M Ivan 2004 3 18,048 Surge $46,150 $18,796 $833M $121,664 $21,932 $2,258M Jeanne 2004 3 2,648 Freshwater $18,435 $6,965 $49M $62,528 $8,076 $179M Dennis 2005 3 2,418 Freshwater $23,566 $10,053 $57M $59,721 $10,043 $159M Ophelia 2005 1 533 Surge $13,893 $7,454 $7M $44,874 $8,118 $27M Rita 2005 3 4,209 Freshwater $44,653 $35,269 $188M $98,790 $42,365 $433M Wilma 2005 3 7,370 Freshwater $34,188 $15,647 $252M $96,503 $16,862 $770M Alberto 2006 TS 86 Freshwater $17,758 $13,158 $2M $23,279 $14,610 $2M Ernesto 2006 TS 504 Freshwater $14,914 $11,435 $8M $42,113 $12,749 $22M Erin 2007 TD 687 Freshwater $23,310 $19,125 $16M $92,756 $20,727 $65M Dolly 2008 1 966 Freshwater $16,397 $8,028 $16M $28,835 $7,649 $31M Fay 2008 TS 1,993 Freshwater $18,336 $7,615 $37M $97,587 $8,669 $204M Gustav 2008 2 3,552 Freshwater $18,200 $9,337 $65M $37,683 $10,285 $146M Ike 2008 2 40,216 Freshwater $43,118 $25,455 $1,734M $120,667 $27,700 $5,094M Irene 2011 1 35,016 Freshwater $23,201 $12,464 $812M $25,099 $13,724 $956M Debby 2012 1 1,445 Freshwater $18,962 $10,176 $27M $20,031 $10,138 $33M Isaac 2012 1 9,557 Freshwater $32,997 $19,937 $315M $32,780 $15,870 $358M Sandy 2012 1 42,889 Surge $20,659 $12,500 $886M $37,954 $23,485 $818M
*Category at US landfall: TS = tropical storm, TD = tropical depression [Czajkowski et al. 2017] As Table 4 illustrates, differences in claim numbers and amounts cannot be attributed solely to storm category. However, storm characteristics and geographic characteristics of the impact area are key drivers of flood damage. For all storms, the median paid claim and damage amounts are less than the average amounts, indicating that there are high value claim and damage amounts that inflate the averages. For many storms, the average value is roughly twice the median. To further investigate how damage varies from storm to storm, the fraction damaged (ratio of damage to property value) for two TCs is compared in Figure 5. Hurricanes Ike and Ivan were chosen for comparison purposes because they each have a relatively significant proportion of both surge and freshwater claims. For both storms, the ratio of damage to property value is the highest in communities that are adjacent to the coast. However, differences exist between the ratios for the two storms, indicating that storm characteristics and geographic considerations are important. The ratio generally declines as distance from the coast increases. This indicates that the nature of the claims – surge versus freshwater – may be significant, and at least partially responsible for the higher values of the coastal claims.

17
Figure 5: Hurricanes Ike and Ivan a) track - Hurricane Ike9, b) track - Hurricane Ivan9, c) box
plot distribution of damage ratio by distance from coast – Hurricane Ike10, d) box plot distribution of damage ratio by distance from coast – Hurricane Ivan
4.3 Surge and freshwater claims Table 5 provides a summary of paid claims and damage for surge and freshwater claims (dollar losses are adjusted to 2012 values). In the dataset, surge claims account for about 36% of the number of paid claims and freshwater claims account for 64% of the number of paid claims. Due to inherent data inconsistencies within the NFIP claims dataset, some claims in the dataset include a paid claim amount, some include a damage amount, and some include both amounts. While surge claims make up 38% of the total paid claim amount, surge claims account for 49% of the 9 Map from National Hurricane Center report 10 For all boxplots in this paper, the bold black line represents the median, the box represents interquartile range (IQR, 25-75 percentile range), and the whiskers extend to the 1.5 times the IQR or to the minimum or maximum value if no points exceed the IQR.
a) b)
c) d)
18
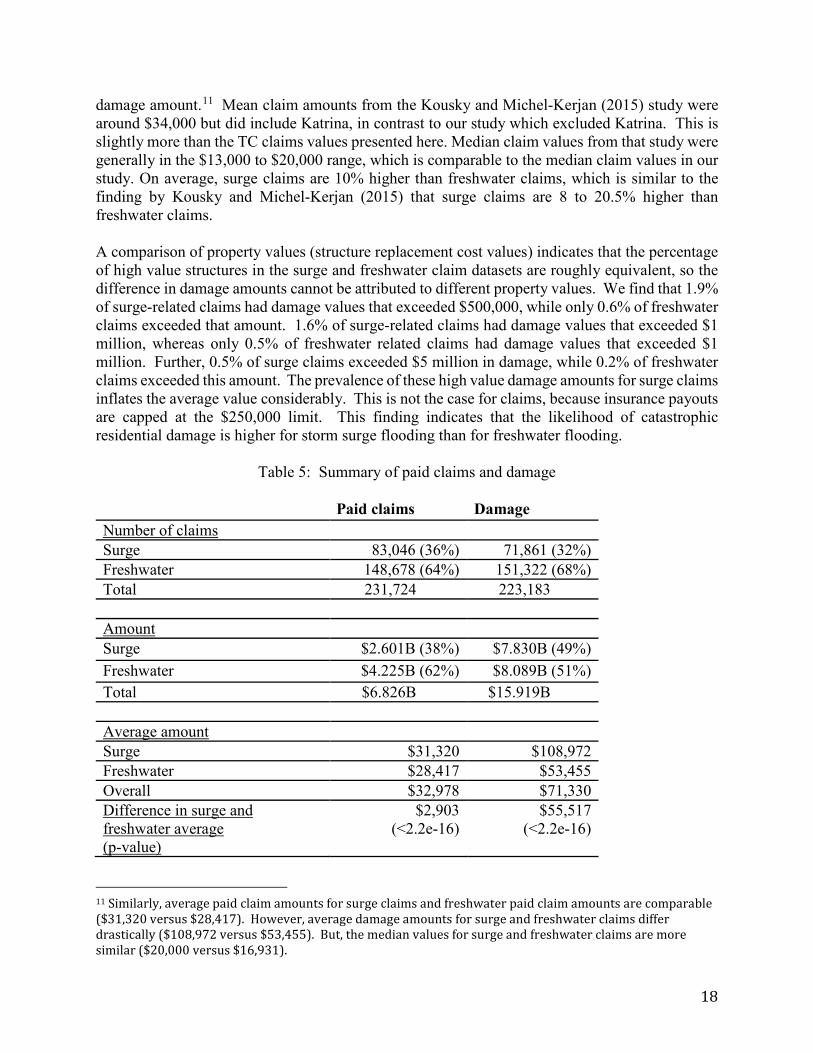
damage amount.11 Mean claim amounts from the Kousky and Michel-Kerjan (2015) study were around $34,000 but did include Katrina, in contrast to our study which excluded Katrina. This is slightly more than the TC claims values presented here. Median claim values from that study were generally in the $13,000 to $20,000 range, which is comparable to the median claim values in our study. On average, surge claims are 10% higher than freshwater claims, which is similar to the finding by Kousky and Michel-Kerjan (2015) that surge claims are 8 to 20.5% higher than freshwater claims. A comparison of property values (structure replacement cost values) indicates that the percentage of high value structures in the surge and freshwater claim datasets are roughly equivalent, so the difference in damage amounts cannot be attributed to different property values. We find that 1.9% of surge-related claims had damage values that exceeded $500,000, while only 0.6% of freshwater claims exceeded that amount. 1.6% of surge-related claims had damage values that exceeded $1 million, whereas only 0.5% of freshwater related claims had damage values that exceeded $1 million. Further, 0.5% of surge claims exceeded $5 million in damage, while 0.2% of freshwater claims exceeded this amount. The prevalence of these high value damage amounts for surge claims inflates the average value considerably. This is not the case for claims, because insurance payouts are capped at the $250,000 limit. This finding indicates that the likelihood of catastrophic residential damage is higher for storm surge flooding than for freshwater flooding.
Table 5: Summary of paid claims and damage Paid claims Damage Number of claims Surge 83,046 (36%) 71,861 (32%) Freshwater 148,678 (64%) 151,322 (68%) Total 231,724 223,183 Amount Surge $2.601B (38%) $7.830B (49%) Freshwater $4.225B (62%) $8.089B (51%) Total $6.826B $15.919B Average amount Surge $31,320 $108,972 Freshwater $28,417 $53,455 Overall $32,978 $71,330 Difference in surge and freshwater average (p-value)
$2,903 (<2.2e-16)
$55,517 (<2.2e-16)
11 Similarly, average paid claim amounts for surge claims and freshwater paid claim amounts are comparable ($31,320 versus $28,417). However, average damage amounts for surge and freshwater claims differ drastically ($108,972 versus $53,455). But, the median values for surge and freshwater claims are more similar ($20,000 versus $16,931).

19
Median amount Surge $15,000 $20,000 Freshwater $15,000 $16,931 Overall $15,000 $17,883
4.4 Flood zones Figure 6a illustrates the number of paid freshwater claims for coastal and inland areas, both inside the special flood hazard area (SFHA) and outside the SFHA. Note that both A-zones and V-zones are included in the SFHA. For our purposes here we define a community as coastal if it is situated within 25 miles from the coast. We find that the majority (65%) of freshwater claims come from areas designated as a coastal SFHA (Figure 6a). This indicates that freshwater flood risk is a significant TC threat in coastal communities. While the coastal SFHA freshwater claims represent 65% of the total paid freshwater claims, the realized freshwater claim loss dollar amounts do not differ significantly by flood zone (Figure 6c). Average paid freshwater claims amounts are only slightly higher for coastal versus inland claims, and for SFHA versus nonSFHA claims. Average values are $29,960 for Coastal-SFHA, $26,322 for Coastal-NonSFHA, $24,157 for Inland-SFHA, and $23,829 for Inland-NonSFHA. While NonSFHA properties generally pay significantly lower premiums, the average claim values are not substantially lower. The plots are very similar for number of claims with damage and damage amounts (Figures 6b and 6d).
Figure 6: Inland (I) and coastal (C) freshwater claims a) number of paid claims b) number of claims with reported damage, c) amount of paid claims, d) amount of damage
a) b)
c) d)
20
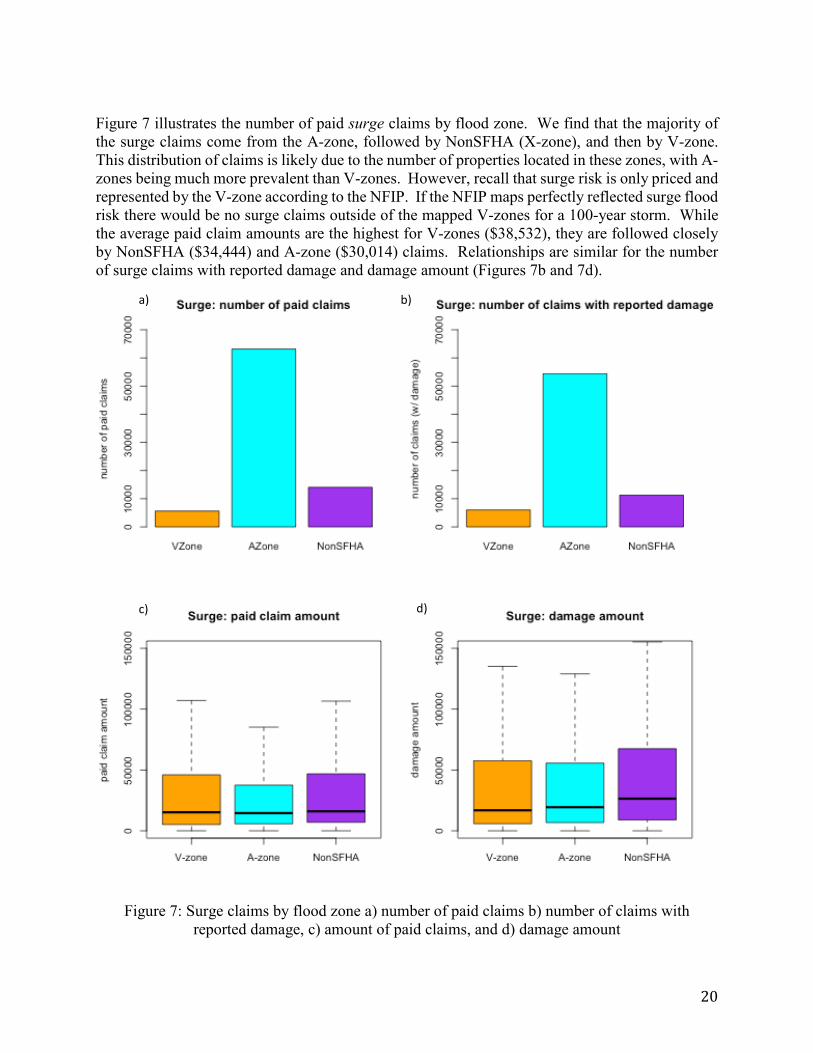
Figure 7 illustrates the number of paid surge claims by flood zone. We find that the majority of the surge claims come from the A-zone, followed by NonSFHA (X-zone), and then by V-zone. This distribution of claims is likely due to the number of properties located in these zones, with A-zones being much more prevalent than V-zones. However, recall that surge risk is only priced and represented by the V-zone according to the NFIP. If the NFIP maps perfectly reflected surge flood risk there would be no surge claims outside of the mapped V-zones for a 100-year storm. While the average paid claim amounts are the highest for V-zones ($38,532), they are followed closely by NonSFHA ($34,444) and A-zone ($30,014) claims. Relationships are similar for the number of surge claims with reported damage and damage amount (Figures 7b and 7d).
Figure 7: Surge claims by flood zone a) number of paid claims b) number of claims with
reported damage, c) amount of paid claims, and d) damage amount
a) b)
c) d)

21
As discussed in Sections 2.1 and 3.2, A-zone and NonSFHA properties generally pay significantly lower flood insurance premiums than comparable V-zone properties. For preFIRM structures, V-zone rates are 40% higher on average than A-zone rates. For postFIRM structures, V-zone rates are 66% higher. V-zone claims make up only 4% of freshwater paid claims and 5% of the total freshwater paid claim amount. Conversely, A-zone and NonSFHA properties make up a large percentage of the paid surge claims (75% and 17%, respectively) and a large percentage of the claims amounts (29% and 33%, respectively), yet are paying much lower rates which do not reflect the surge risk at these properties. For claims with recorded damage values, 28% of surge damage was from A-zone properties, and 32% of surge damage was from NonSFHA properties. 4.5 Flood depth and Duration 4.5.1 Flood Depth Figures 8 and 9 provide boxplots of freshwater and surge paid claim amounts by flood depth. As expected, paid claim amounts increase as the flood depth associated with the claim increases. Below 1-foot depth, values are relatively comparable for freshwater (mean $21,812, median $11,043) and surge claims (mean $25,037, median $9,642). From 1 to 3 foot depth, values are also comparable for freshwater (mean $29,738, median $18,294) and surge (mean $29,167 and $13,702) claims. Values of surge claims exhibit a wider range than freshwater claims as depths increase into the 3- to 9-foot range. For instance, in the 6 to 9-foot range, the mean freshwater claim amount is $38,380 and mean surge claim is $43,030.
Figure 8: Boxplot of freshwater paid claim amounts by depth

22
Figure 9: Boxplot of surge paid claim amounts by depth
Figure 10 provides a comparison of coastal versus inland depth-damage amounts for freshwater claims accounting for the building exposure value. With the exception of a few discrepancies, inland and coastal depth-damage amounts are comparable when grouped by depth. Figure 4 illustrated that on average, coastal freshwater paid claim amounts exceed inland freshwater paid claim amounts. This points to the conclusion that the depth of coastal claims tends to be higher than the depth of inland claims, which results in the higher average amount for coastal claims.

23
Figure 10: Boxplot of freshwater depth-damage ratio by depth, coastal (C) and inland (I) Figure 11 provides a comparison of depth-damage for surge claims, separated by V-zone, A-zone, and NonSFHA (X-zone) again accounting for the building exposure value. At lower flood depths (less than 6 feet), the range of NonSFHA depth-damage ratios tends to exceed the range for SFHA ratios. Above the 6-foot depth range, V-zone depth-damage values tend to exceed those for A-zone and NonSFHA properties.
Figure 11: Boxplot of surge depth-damage by flood zone
Figures 12 and 13 provide boxplots of fraction damaged (damage/structure value) by depth for freshwater and surge claims, respectively. As we are interested in understanding how the claim

24
analysis would corroborate with catastrophe flood models, a USACE depth-damage curve is overlaid on these plots for comparison. The claims in our dataset come from a mix of one- and two-story properties, and the 1.5 story property curve (from Figure 2) is illustrated in Figures 12 and 13. The percent damaged generally increases with depth for both surge and freshwater claims. The exception is in the 9-24 foot range for surge claims. This discrepancy could potentially be due to some improperly recorded flood claims depth (i.e. 24 inches instead of 24 feet). The USACE depth-damage curves align relatively well with both surge and freshwater depth damage amounts up to around the 3- to 6-foot range. At higher depths of flooding the USACE curves are at the high end of the range exhibited by this dataset. For instance, in the 6 to 9-foot depth range USACE values range from 36% to 56%. For this depth range, freshwater depth-damage amounts tend to be in the 6% to 35% range and surge depth-damage amounts tend to be in the 7% to 50% range for our dataset.
Figure 12: Depth-damage ratio for freshwater claims with USACE depth-damage curve.

25
Figure 13: Depth-damage ratio for surge claims with USACE depth-damage curve.
4.5.2 Flood Duration Beyond flood depth, there are a number of other physical characteristics of flood events such as flood duration that may contribute to flood damage and therefore may cause different damage amounts at similar flood depths (NRC 2015). While our NFIP dataset does not have information on flood duration, it does contain information on the elevation difference of the property (the difference between the lowest floor and the base flood elevation). We use this elevation difference as proxy for the impact of flood duration in that negatively elevated structures (negative elevation difference) will commonly be inundated for a longer period of time, i.e., a longer flood duration, than positively elevated structures (positive elevation difference) (NRC 2015). The elevation difference was available for approximately 75,000 of our claims and average damages associated with positively and negatively elevated structures are presented in Table 6. We find that on average and for most flood depth amounts, negatively elevated structures have higher paid claim amounts, indicating the potential role of flood duration in the loss at various flood depths. However, the differences in average damages for positively and negatively elevated structures are not statistically significant.
Table 6: Average damage for Positively and Negatively Elevated Structures Flood Depth Positively Elevated Negatively Elevated Are Averages
Statistically Significant? (p-value)
<1 foot $39,963 $39,059 No (0.770) 1-3 feet $47,746 $51,061 No (0.738) 3-6 feet $62,798 $81,900 No (0.292)

26
6-9 feet $94,348 $122,512 No (0.383) 9-24 feet $146,383 $182,517 No (0.095)
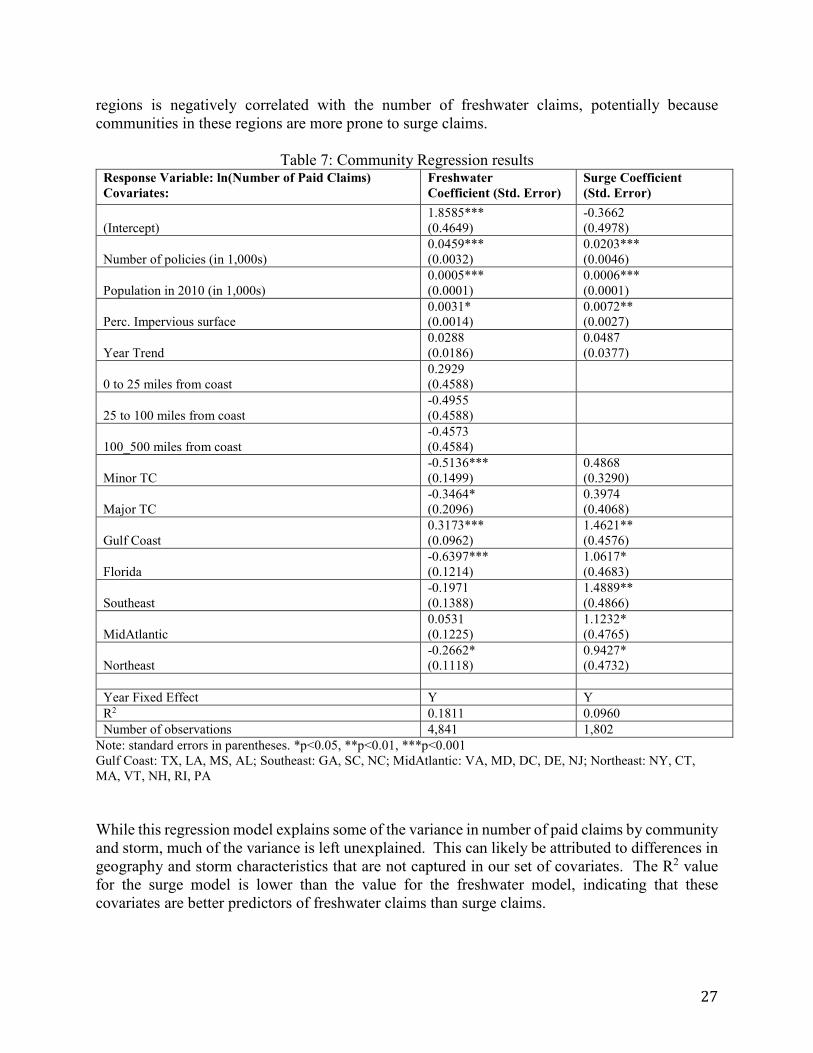
In summary, our analysis indicates that the number and total amount of TC freshwater claims exceeds the number and total amount of TC surge claims. However, the average surge claim amount is slightly higher than the freshwater amount, and average damage for surge claims is roughly two times greater than for freshwater claims. Damage also increases more sharply with depth for surge claims than for freshwater claims. A comparison of depth-damage in our dataset versus a USACE depth-damage curve shows a potential need for calibration at higher flood depth levels. Furthermore, storm surge risk is clearly significant outside of V-zone areas. Our analysis of individual claim characteristics highlights key conclusions about the influence of state, storm, surge versus freshwater, and depth and duration on claims and damage amounts. However, further analysis is needed to uncover features of claims that may be the result of multiple variables together or may be more complex in nature. We turn to statistical modeling to investigate this further. 5. Statistical Modeling 5.1 Community-level model Regression analysis was performed to identify variables that are statistically related with the number of freshwater and surge paid claims. The regression was done on a community-storm basis, with total number of paid claims for each NFIP community for each storm as the response variable. Covariates included storm and community characteristics and are noted in Table 7. Separate regressions were performed for surge and freshwater claims. As indicated in Table 7, the factors most correlated with number of paid claims for freshwater claims include number of policies in effect, population, minor TC, and community situated in the Gulf Coast region or Florida. For surge claims, number of policies in effect and population were most significantly correlated with the number of paid claims. Number of policies and population are positively correlated with the number of claims in a community, as would be expected. The percentage of impervious surface of a community is positively correlated with the number of freshwater and storm surge claims. We find no distinction in the distance from the coast categories for TC freshwater paid claim amounts as compared to the omitted variable of distance of 500 miles or greater from coast. (Distance from coast is not included for surge, since all communities with surge claims are within 25 miles of the coast). Minor TC categorization in comparison to the omitted tropical storm category is negatively correlated with the number of freshwater claims indicating that tropical storms on average bring more freshwater damages to communities than minor or major hurricanes. This makes sense given that TC wind and TC rainfall are weakly correlated. While minor TCs indicate higher storm surge losses in comparison to tropical storms, there is no statistical difference between storm surge claims from major vs. minor hurricanes in comparison to tropical storms. This indicates that other TC characteristics besides wind speed (e.g. size and forward speed) are also important. Location in Florida, Southeast, and Northeast
27
regions is negatively correlated with the number of freshwater claims, potentially because communities in these regions are more prone to surge claims.
Table 7: Community Regression results Response Variable: ln(Number of Paid Claims) Covariates:
Freshwater Coefficient (Std. Error)
Surge Coefficient (Std. Error)
(Intercept) 1.8585*** (0.4649)
-0.3662 (0.4978)
Number of policies (in 1,000s) 0.0459*** (0.0032)
0.0203*** (0.0046)
Population in 2010 (in 1,000s) 0.0005*** (0.0001)
0.0006*** (0.0001)
Perc. Impervious surface 0.0031* (0.0014)
0.0072** (0.0027)
Year Trend 0.0288 (0.0186)
0.0487 (0.0377)
0 to 25 miles from coast 0.2929 (0.4588)
25 to 100 miles from coast -0.4955 (0.4588)
100_500 miles from coast -0.4573 (0.4584)
Minor TC -0.5136*** (0.1499)
0.4868 (0.3290)
Major TC -0.3464* (0.2096)
0.3974 (0.4068)
Gulf Coast 0.3173*** (0.0962)
1.4621** (0.4576)
Florida -0.6397*** (0.1214)
1.0617* (0.4683)
Southeast -0.1971 (0.1388)
1.4889** (0.4866)
MidAtlantic 0.0531 (0.1225)
1.1232* (0.4765)
Northeast -0.2662* (0.1118)
0.9427* (0.4732)
Year Fixed Effect Y Y R2 0.1811 0.0960 Number of observations 4,841 1,802
Note: standard errors in parentheses. *p<0.05, **p<0.01, ***p<0.001 Gulf Coast: TX, LA, MS, AL; Southeast: GA, SC, NC; MidAtlantic: VA, MD, DC, DE, NJ; Northeast: NY, CT, MA, VT, NH, RI, PA While this regression model explains some of the variance in number of paid claims by community and storm, much of the variance is left unexplained. This can likely be attributed to differences in geography and storm characteristics that are not captured in our set of covariates. The R2 value for the surge model is lower than the value for the freshwater model, indicating that these covariates are better predictors of freshwater claims than surge claims.

28
5.2. Individual Claims Model In addition to the community model, regression analysis was conducted on the individual claims data, separated by surge and freshwater claims. Regression was performed on both ratio of paid claims to coverage and ratio of damage to replacement cost value. Covariates and results are presented in Tables 8 through 10. Covariates pertain to both property characteristics, such as flood zone and structure type, and community characteristics, such as proximity to coast and region. The storm magnitude is represented through the major TC and minor TC dummy variables. Table 8 presents results from the base model of individual claims. For surge and particularly for freshwater claims, many of the covariates were significantly correlated with paid claim amount. For surge claims, all covariates, with the exception of a few regions, were significantly correlated with paid claims and damage ratios. Results were similar for freshwater claims, except that Minor TC and Major TC were not significant as compared to the omitted tropical storm covariate. A-zone, V-zone, PreFIRM, and repetitive loss were positively correlated with paid claims ratios. While earlier results show similar mean claim amounts for SFHA and non-SFHA claims, the mean paid claims ratio from the SFHA (A-zone or V-zone) is higher than for nonSFHA claims, excluding the effects of other covariates. Elevated structure, multi-story, and basement were negatively correlated with paid claims and damage ratios. These results are as expected and in line with the findings of Kousky and Michel-Kerjan (2015). As with the community regression, a large amount of the variance is left unexplained with this model.
Table 8: Individual Claims Regression Coefficients
Paid claims ratio – Freshwater
Paid claims ratio – Surge
Damage ratio – Freshwater
Damage ratio – Surge
Intercept -2.5187*** (0.1392)
-3.3205*** (0.2606)
-3.3497*** (0.1675)
-3.4385*** (0.2575)
A zone property 0.4243*** (0.0089)
0.1189*** (0.013)
0.3319*** (0.0107)
0.1415*** (0.0150)
V zone property 0.4796*** (0.0215)
0.1624*** (0.0222)
0.3849*** (0.0249)
0.1861*** (0.0235)
PreFIRM property 0.6647*** (0.0086)
0.8797*** (0.0107)
0.6753*** (0.0103)
0.9433*** (0.0116)
Repetitive Loss property
0.2886*** (0.0236)
0.2593*** (0.0432)
0.2973*** (0.0282)
0.1846*** (0.0488)
Elevated structure -0.2820*** (0.0098)
-0.4060*** (0.0112)
-0.2275*** (0.0119)
-0.4527*** (0.0123)
Multi-story structure -0.2800*** (0.0097)
-0.2597*** (0.0115)
-0.2774*** (0.0117)
-0.3209*** (0.0126)
Structure with basement
-0.0832*** (0.0112)
-0.1356*** (0.0117)
-0.1384*** (0.0138)
-0.2028*** (0.0134)
Year Trend -0.0494*** (0.0028)
-0.0840*** (0.0081)
0.0002 (0.0033)
-0.0489*** (0.0079)
0 to 25 miles from coast
-0.5284*** (0.1398)
-0.0463 (0.1683)
25 to 100 miles from coast
-0.4149** (0.1405)
-0.1489 (0.169)
100 to 500 miles from coast
-0.1812 (0.1404)
-0.0569 (0.1689)
Minor TC 0.1396 (0.0263)
1.1249*** (0.0753)
0.0067 (0.0306)
0.6988*** (0.0722)
Major TC 0.4618 (0.0443)
1.8254*** (0.0889)
0.2576*** (0.0514)
1.6115*** (0.0864)
Gulf Coast 0.6460*** 0.4695* 0.4210*** 0.6705**
29
(0.0232) (0.2572) (0.0278) (0.2541) Florida -0.1370***
(0.027) -0.0460 (0.2574)
-0.1810*** (0.0321)
0.3534 (0.2543)
Southeast -0.0667* (0.0312)
0.1281 (0.2592)
0.0170 (0.0372)
0.8268** (0.2561)
MidAtlantic 0.1518*** (0.0258)
-0.0447 (0.2587)
0.4045*** (0.0321)
0.8613*** (0.2556)
Northeast 0.0652* (0.0256)
-0.1032 (0.2586)
0.1669*** (0.0310)
0.7483** (0.2556)
Year Fixed Effect Y Y Y Y Observations 147,606 82,933 149,093 70,214 R2 0.1504 0.2097 0.0770 0.2175
Note: standard errors in parentheses. *p<0.05, **p<0.01, ***p<0.001
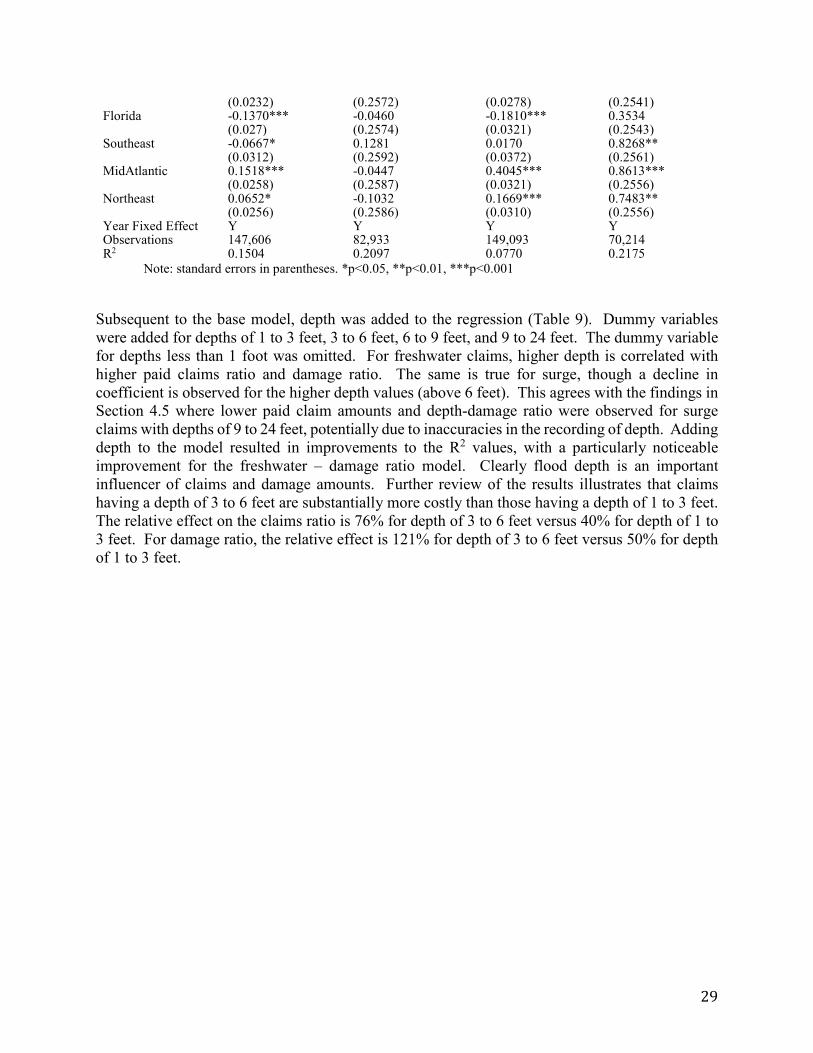
Subsequent to the base model, depth was added to the regression (Table 9). Dummy variables were added for depths of 1 to 3 feet, 3 to 6 feet, 6 to 9 feet, and 9 to 24 feet. The dummy variable for depths less than 1 foot was omitted. For freshwater claims, higher depth is correlated with higher paid claims ratio and damage ratio. The same is true for surge, though a decline in coefficient is observed for the higher depth values (above 6 feet). This agrees with the findings in Section 4.5 where lower paid claim amounts and depth-damage ratio were observed for surge claims with depths of 9 to 24 feet, potentially due to inaccuracies in the recording of depth. Adding depth to the model resulted in improvements to the R2 values, with a particularly noticeable improvement for the freshwater – damage ratio model. Clearly flood depth is an important influencer of claims and damage amounts. Further review of the results illustrates that claims having a depth of 3 to 6 feet are substantially more costly than those having a depth of 1 to 3 feet. The relative effect on the claims ratio is 76% for depth of 3 to 6 feet versus 40% for depth of 1 to 3 feet. For damage ratio, the relative effect is 121% for depth of 3 to 6 feet versus 50% for depth of 1 to 3 feet.

30
Table 9: Individual Claims Regression Determinants, Depth Included
Paid claims ratio – Freshwater
Paid claims ratio – Surge
Damage ratio – Freshwater
Damage ratio – Surge
Intercept -2.7265*** (0.1511)
-3.1474*** (0.2923)
-3.6473*** (0.1850)
-3.3033*** (0.2856)
A zone property 0.4035*** (0.0092)
0.1420*** (0.0150)
0.2850*** (0.0111)
0.1460*** (0.0165)
V zone property 0.4338*** (0.0219)
0.1552*** (0.0262)
0.3173*** (0.0257)
0.1261*** (0.0267)
PreFIRM property 0.6278*** (0.0088)
0.8100*** (0.0123)
0.6226*** (0.0107)
0.8539*** (0.0129)
Repetitive Loss property
0.0657* (0.0270)
0.2248*** (0.0560)
0.0583* (0.0326)
0.1088* (0.0582)
Elevated structure -0.2841*** (0.0101)
-0.3749*** (0.0129)
-0.2191*** (0.0124)
-0.3593*** (0.0136)
Multi-story structure
-0.2904*** (0.0100)
-0.2548*** (0.0133)
-0.2868*** (0.0122)
-0.3298*** (0.0140)
Structure with basement
-0.0671*** (0.0117)
-0.1394*** (0.0138)
-0.1023*** (0.0146)
-0.1850*** (0.0150)
Year Trend -0.0641*** (0.0029)
-0.1249*** (0.0087)
-0.0204*** (0.0034)
-0.0917*** (0.0082)
Depth 1 to 3 ft. 0.3353*** (0.0094)
0.4048*** (0.0155)
0.5464*** (0.0112)
0.1452*** (0.0155)
Depth 3 to 6 ft. 0.5656*** (0.0127)
0.7946*** (0.0194)
0.7701*** (0.0154)
0.5867*** (0.0197)
Depth 6 to 9 ft. 0.5988*** (0.0176)
0.6617*** (0.0243)
0.8438*** (0.0217)
0.5567*** (0.0263)
Depth 9 to 24 ft. 0.8935*** (0.0146)
0.4509*** (0.0173)
1.1339*** (0.0183)
0.4750*** (0.0188)
0 to 25 miles from coast
-0.4080** (0.1520)
0.1407 (0.1860)
25 to 100 miles from coast
-0.3338* (0.1527)
0.0160 (0.1869)
100 to 500 miles from coast
-0.0733 (0.1526)
0.1578 (0.1868)
Minor TC 0.0669* (0.0269)
1.0668*** (0.0795)
-0.0945** (0.0316)
0.6704*** (0.0740)
Major TC 0.3710*** (0.0451)
1.7603*** (0.0940)
0.1568** (0.0529)
1.4658*** (0.0888)
Gulf Coast 0.6197*** (0.0255)
0.2569 (0.2891)
0.3448*** (0.0309)
0.5435* (0.2825)
Florida -0.1150*** (0.0292)
-0.2873 (0.2891)
-0.2194*** (0.0351)
0.1984 (0.2825)
Southeast 0.1399*** (0.0336)
-0.1163 (0.2913)
0.0826* (0.0406)
0.4717* (0.2846)
MidAtlantic 0.3625*** (0.0284)
-0.1073 (0.2908)
0.4673*** (0.0355)
0.6036* (0.2842)
Northeast 0.1946*** (0.0284)
-0.2034 (0.2908)
0.1731*** (0.0348)
0.4940* (0.2841)
Year Fixed Effect Y Y Y Y Observations 133,820 62,891 136,633 55,705 R2 0.1828 0.2205 0.1145 0.2264
Note: standard errors in parentheses. *p<0.05, **p<0.01, ***p<0.001 Next, the impact of duration was evaluated, with results presented in Table 10. Prior analysis (Section 4.5.2) indicates that negatively elevated structures tend to have higher paid claims amounts and damage, though the finding was not statistically significant. Regression results show that negatively elevation is positively correlated with paid claims ratio and damage ratio for both freshwater and surge claims. Water depth and negative elevation (duration) were interacted in the regression, and results show a significant positive correlation for the freshwater models. This

31
indicates that a combination of depth and duration of flooding are important indicators of freshwater claims and damage amounts. The correlation is negative but not significant for surge claims.
Table 10: Individual Claims Regression Determinants, Duration Included
Paid claims ratio – Freshwater
Paid claims ratio – Surge
Damage ratio – Freshwater
Damage ratio – Surge
Intercept -2.9654*** (0.8391)
-4.3269** (1.4341)
-3.5128*** (1.0304)
-4.4965** (1.4331)
A zone property -0.1187 (0.1752)
0.0138 (0.1962)
-0.1694 (0.2234)
0.1495 (0.2279)
V zone property -0.1155 (0.1778)
0.2453 (0.1991)
-0.2792 (0.2260)
0.3195 (0.2303)
PreFIRM property
0.3758*** (0.0158)
0.5138*** (0.0220)
0.4124*** (0.0194)
0.6331*** (0.0232)
Repetitive Loss property
-0.0867 (0.0711)
-0.0332 (0.1228)
0.0272 (0.0844)
-0.0041 (0.1228)
Elevated structure
-0.5323*** (0.0165)
-0.7251*** (0.0214)
-0.4581*** (0.0201)
-0.7406*** (0.0222)
Multi-story structure
-0.2603*** (0.0171)
-0.2637*** (0.0220)
-0.2826*** (0.0204)
-0.3530*** (0.0222)
Structure with basement
-0.3042*** (0.0246)
-0.2818*** (0.0293)
-0.2257*** (0.0298)
-0.2357*** (0.0300)
Year Trend -0.0596*** (0.0053)
-0.0876*** (0.0192)
-0.0110* (0.0061)
-0.0572*** (0.0167)
0 to 25 miles from coast
0.9938 (0.8324)
0.7445 (1.0202)
25 to 100 miles from coast
0.8710 (0.8333)
0.3310 (1.0211)
100 to 500 miles from coast
0.9511 (0.8319)
0.5892 (1.0195)
Minor TC -0.1365** (0.0491)
0.8110*** (0.1783)
-0.1451* (0.0566)
0.3615* (0.1524)
Major TC 0.1944* (0.0758)
1.581*** (0.1958)
0.2817** (0.0873)
1.3183*** (0.1710)
Negatively elevated structure
0.4879*** (0.0244)
0.3112*** (0.0346)
0.2730*** (0.0297)
0.2783*** (0.0343)
Water depth 0.0607*** (0.0019)
0.0279*** (0.0017)
0.0782*** (0.0024)
0.0291*** (0.0019)
Depth*Duration 0.0195*** (0.0039)
-0.0030 (0.0035)
0.0170*** (0.0049)
-0.0023 (0.0040)
Gulf 0.1851 (0.1411)
1.7325 (1.4168)
0.1760 (0.1719)
1.8179 (1.4115)
Florida -0.6466*** (0.1433)
1.4530 (1.4165)
-0.5408** (0.1742)
1.6004 (1.4112)
Southeast -0.0893 (0.1450)
1.6622 (1.4181)
0.1153 (0.1765)
1.9340 (1.4126)
MidAtlantic -0.0260 (0.1429)
1.5308 (1.4178)
0.2415 (0.1747)
1.9882 (1.4124)
Northeast 0.0402 (0.1466)
1.6448 (1.4179)
0.1873 (0.1789)
2.0021 (1.4126)
Year Fixed Effect
Y Y Y Y

32
Observations 41,071 24,436 42,764 23,418 R2 0.208 0.1812 0.1157 0.2032
Note: standard errors in parentheses. *p<0.05, **p<0.01, ***p<0.001 A comparison of our results to those from the Kousky and Michel-Kerjan (2015) study indicates that many of the same covariates are significant in both. Flood zone, preFIRM property, elevated structure, multi-story structure, and basement were all of high significance in both models and the sign of the correlations (positive or negative) are in agreement for the two studies. Our study analyzed TC storm surge and freshwater claims separately, while all claims were combined in the Kousky and Michel-Kerjan study, with nonTC claims included. Clear differences in freshwater and surge claims were apparent. The addition of depth and duration provided further insight into drivers of paid claim and damage amounts. 5.3 Additional Analysis and Illustrative Application Both in the community and individual claims analysis, a greater number of covariates were of the highest significance in the freshwater analysis. The mechanism of storm surge flooding as well as the communities impacted are generally more uniform than those impacted by freshwater flooding. Storm surge flooding is limited to coastal communities while freshwater flooding occurs in many different types of communities with varying watershed characteristics. The hydrology behind freshwater flooding events can differ significantly based on storm and watershed characteristics, and flood characteristics can vary from high velocity riverine flooding to localized ponding. Results presented in Sections 5.1 and 5.2 represent a subset of the model runs completed. For brevity, other results are not presented in this paper. For the community regression, in addition to the results presented with number of claims as the dependent variable, models were run with total paid claims and total damage as the dependent variable. For the individual claims regression, in addition to the results presented as the ratio of paid claim and ratio of damage, the paid claim amount and damage amount were also modeled as dependent variables. Other dependent variables modeled in various community model iterations included CRS category and Flood Peak Ratio (a measure of relative flood magnitude – Czajkowski et al., 2017). In the individual claims model, designation of a storm as primarily freshwater versus surge was included, as was community CRS category. Dummy variables were used to represent depth, location, and storm. In the presented work, these included depth categories, regions, and storm classification (Minor TC, Major TC). In additional modeling, non-categorical water depth was modeled, as were states (instead of regions), and individual storms (instead of storm class). Model iterations presented in this paper were chosen for ease of interpretation and analysis, while still maintaining levels of accuracy (R2) generally comparable to the models not presented here. As a validation of model performance, presented results were reviewed for consistency with other model versions, with regards to coefficient sign, statistical significance, and ordering. Significantly, the regression models developed in this study can be applied for comparisons of expected depth-damage for different geographies and structures types. As other studies have done (e.g. Van Ootegem et al. 2015), depth-damage curves can be generated based on the regression results. Here we generate two illustrative examples from our model results provided in Table 10, using mean values for the covariates unless otherwise specified. First, Figure 14 illustrates depth-damage curves for freshwater and surge claims in the Florida and the Gulf Coast region based on
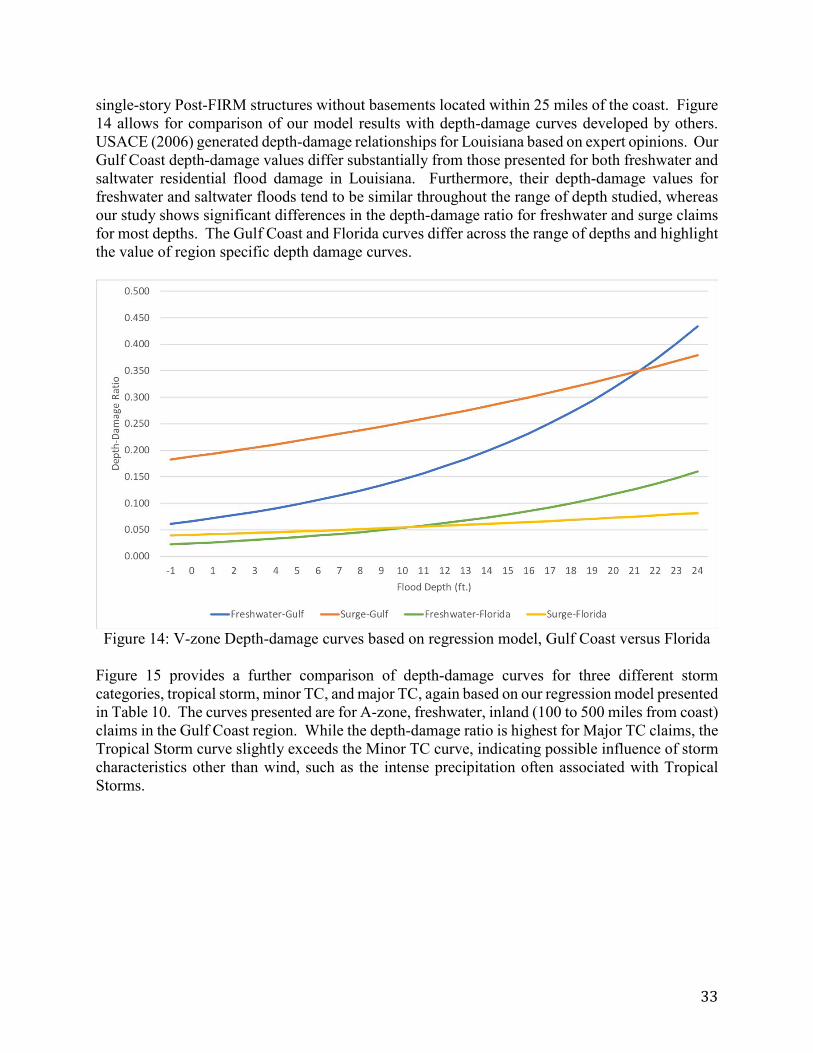
33
single-story Post-FIRM structures without basements located within 25 miles of the coast. Figure 14 allows for comparison of our model results with depth-damage curves developed by others. USACE (2006) generated depth-damage relationships for Louisiana based on expert opinions. Our Gulf Coast depth-damage values differ substantially from those presented for both freshwater and saltwater residential flood damage in Louisiana. Furthermore, their depth-damage values for freshwater and saltwater floods tend to be similar throughout the range of depth studied, whereas our study shows significant differences in the depth-damage ratio for freshwater and surge claims for most depths. The Gulf Coast and Florida curves differ across the range of depths and highlight the value of region specific depth damage curves.
Figure 14: V-zone Depth-damage curves based on regression model, Gulf Coast versus Florida
Figure 15 provides a further comparison of depth-damage curves for three different storm categories, tropical storm, minor TC, and major TC, again based on our regression model presented in Table 10. The curves presented are for A-zone, freshwater, inland (100 to 500 miles from coast) claims in the Gulf Coast region. While the depth-damage ratio is highest for Major TC claims, the Tropical Storm curve slightly exceeds the Minor TC curve, indicating possible influence of storm characteristics other than wind, such as the intense precipitation often associated with Tropical Storms.
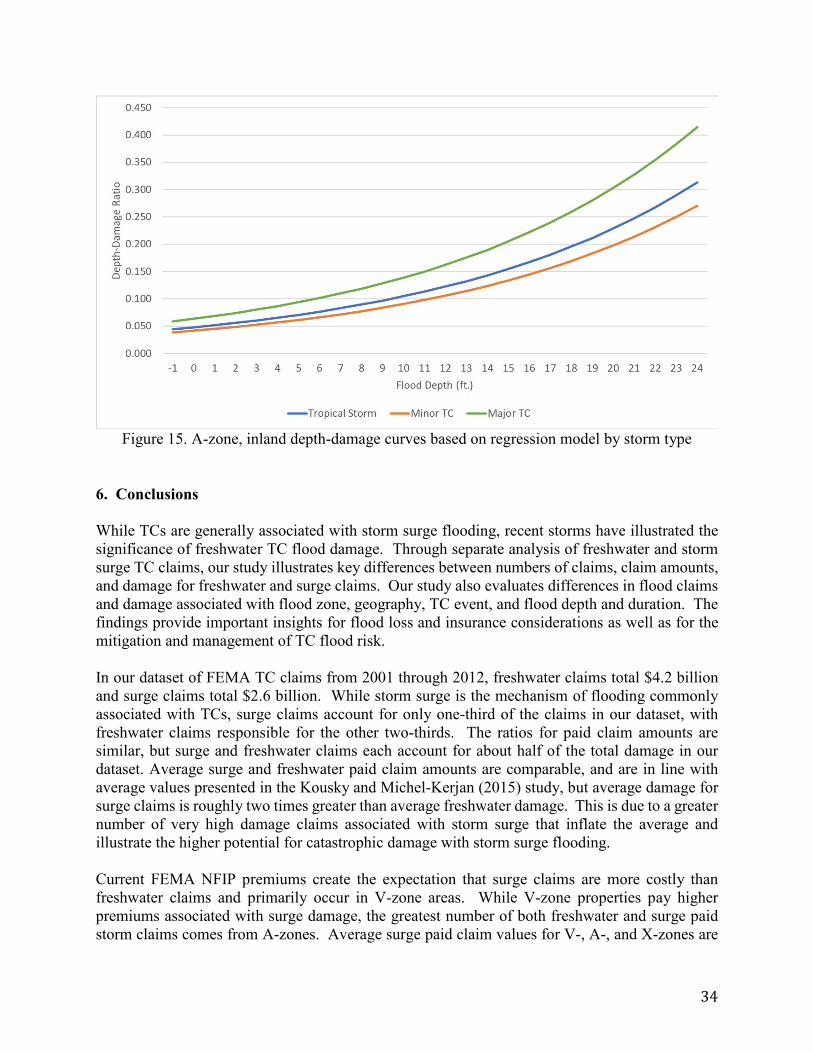
34
Figure 15. A-zone, inland depth-damage curves based on regression model by storm type
6. Conclusions While TCs are generally associated with storm surge flooding, recent storms have illustrated the significance of freshwater TC flood damage. Through separate analysis of freshwater and storm surge TC claims, our study illustrates key differences between numbers of claims, claim amounts, and damage for freshwater and surge claims. Our study also evaluates differences in flood claims and damage associated with flood zone, geography, TC event, and flood depth and duration. The findings provide important insights for flood loss and insurance considerations as well as for the mitigation and management of TC flood risk. In our dataset of FEMA TC claims from 2001 through 2012, freshwater claims total $4.2 billion and surge claims total $2.6 billion. While storm surge is the mechanism of flooding commonly associated with TCs, surge claims account for only one-third of the claims in our dataset, with freshwater claims responsible for the other two-thirds. The ratios for paid claim amounts are similar, but surge and freshwater claims each account for about half of the total damage in our dataset. Average surge and freshwater paid claim amounts are comparable, and are in line with average values presented in the Kousky and Michel-Kerjan (2015) study, but average damage for surge claims is roughly two times greater than average freshwater damage. This is due to a greater number of very high damage claims associated with storm surge that inflate the average and illustrate the higher potential for catastrophic damage with storm surge flooding. Current FEMA NFIP premiums create the expectation that surge claims are more costly than freshwater claims and primarily occur in V-zone areas. While V-zone properties pay higher premiums associated with surge damage, the greatest number of both freshwater and surge paid storm claims comes from A-zones. Average surge paid claim values for V-, A-, and X-zones are
35
relatively comparable for flood depths of 6 feet or less. For higher depths, V-zone claim amounts tend to be higher. This finding leads to the conclusion that improved mapping of storm surge risk areas and/or higher premiums for coastal A-zones and other areas at potential risk for storm surge damage are needed to improve the actuarial fairness of NFIP premiums. As expected, paid claim amounts and the ratio of damage to property value tend to increase as flood depth increases. Analysis of negatively and positively elevated structures as a proxy for flood duration showed some indication that duration may impact damage, as also confirmed by the statistical models for freshwater flooding. Claims and damage amounts vary greatly from storm to storm due to differing characteristics of storms and of the geographic areas that they impact. There is also high variation from state to state and regionally in the number and amount of claims and damage. Florida, Louisiana, and North Carolina experience the greatest number of TCs in our dataset, but Texas, Oklahoma, and Indiana had the highest median claim values. For both communities and individual claims, the situation in the Gulf Coast region is correlated with higher number of paid claims and freshwater and surge paid claim amounts. However, situation in Florida is correlated with lower numbers of freshwater claims and by community and lower freshwater paid claim amounts. This could potentially be attributed to differences in the Florida’s building codes versus those in other Gulf Coast states, and highlights the importance of considering state and regional differences in estimating and managing flood damage. While our statistical modeling results were in line with findings by past studies and reinforced by the findings of the descriptive analysis, limitations of the study include the restriction of the dataset to TC claims from 2001 to 2012, and the inherent data quality issues of the NFIP claims dataset. Future work will focus on comparing nonTC and TC claim and damage amounts to evaluate the applicability of findings from this study to nonTC flood events. Future work may also seek to improve the accuracy of the regression model via a spatial regression model and consideration of a thresholds of loss form of the dependent variable.
36
References: American Academy of Actuaries Flood Insurance Work Group (AAAFIWG) (2017). The National Flood Insurance Program: Challenges and Solutions. Available at http://www.actuary.org/files/publications/FloodMonograph.04192017.pdf Aryal, Y.N., G. Villarini, W. Zhang, and G.A. Vecchi. (2018) Long term changes in flooding and heavy rainfall associated with North Atlantic tropical cyclones: Roles of the North Atlantic Oscillation and El Niño-Southern Oscillation, Journal of Hydrology, 559, 698-710, 2018. Atallah, E., Bosart, L.F., Aiyyer, A.R., Precipitation distribution associated with landfalling tropical cyclones over the Eastern United States. (2007) Mon Weather Rev. 135, 2185–2206. Blake, E.S., Landsea, C.W., E.J. Gibney, The deadliest, costliest, and most intense United States tropical cyclones from 1851 to 2010 (and other frequently requested hurricane facts), NOAA Technical Memorandum NWS NHC-6, 2011 Botzen, W. W., Kunreuther, H., & Michel-Kerjan, E. (2015). Divergence between individual perceptions and objective indicators of tail risks: Evidence from floodplain residents in New York City. Judgment and Decision Making, 10(4), 365. Brody, S. D., Zahran, S., Highfield, W. E., Grover, H., & Vedlitz, A. (2008). Identifying the impact of the built environment on flood damage in Texas. Disasters, 32(1), 1-18. Brody, S. D., Peacock, W. G., & Gunn, J. (2012). Ecological indicators of flood risk along the Gulf of Mexico. Ecological indicators, 18, 493-500. Changnon, S.A., Assessment of flood losses in the United States, (2008) J Contemp Water Res Educ. 138(1), 38-44. Colle, B.A., Numerical simulations of the extratropical transition of Floyd (1999): Structural evolution and responsible mechanisms for the heavy rainfall over the northeast U.S. (2003) Mon Weather Rev. 131, 2905–2926. Czajkowski, J., Villarini, G., Michel-Kerjan, E., & Smith, J. A. (2013). Determining tropical cyclone inland flooding loss on a large scale through a new flood peak ratio-based methodology. Environmental Research Letters, 8(4), 044056. Czajkowski, J., & Done, J. (2014). As the wind blows? Understanding hurricane damages at the local level through a case study analysis. Weather, climate, and society, 6(2), 202-217. Czajkowski, J., Villarini, G., Montgomery, M., Michel-Kerjan, E., & Goska, R. (2017). Assessing Current and Future Freshwater Flood Risk from North Atlantic Tropical Cyclones via Insurance Claims. Scientific Reports 7, Article number: 416092016. FEMA (2002). National Flood Insurance Program, Program Description, August 1, 2002. Accessed at: https://www.fema.gov/media-library/assets/documents/1150

37
Jonkman, S.N., Maaskant, B., Boyd, E., Levitan, M.L., Loss of life caused by the flooding of New Orleans after Hurricane Katrina: Analysis of the relationship between flood characteristics and mortality. (2009) Risk Anal. 29(5), 676-698. Knutson, T.R., McBride, J.L., Chan, J., Emanuel, K., Holland, G., Landsea, C., Held, I., Kossin, J.P., Srivastava, A.K. and Sugi, M. (2010). Tropical cyclones and climate change. Nature Geoscience, 3(3), pp.157-163. Kousky, C., & Michel‐Kerjan, E. (2015). Examining flood insurance claims in the United States: Six key findings. Journal of Risk and Insurance. Kousky, C., Michel‐Kerjan, E., Raschky, P., (2018). Does federal disaster assistance crowd out flood insurance? Journal of Environmental Economics and Management Volume 87, Pages 150-164 Kreibich, H., Thieken, A. H., Petrow, T., Müller, M., & Merz, B. (2005). Flood loss reduction of private households due to building precautionary measures--lessons learned from the Elbe flood in August 2002. Natural Hazards and Earth System Science, 5(1), 117-126. Merz, B., Kreibich, H., Schwarze, R., & Thieken, A. (2010). Review article" Assessment of economic flood damage". Natural Hazards and Earth System Sciences, 10(8), 1697. Michel‐Kerjan, E. O., & Kousky, C. (2010). Come rain or shine: Evidence on flood insurance purchases in Florida. Journal of Risk and Insurance, 77(2), 369-397. National Research Council (NRC). 2015. Tying Flood Insurance to Flood Risk for Low-Lying Structures in the Floodplain. Washington, DC: The National Academies Press. https://doi.org/10.17226/21720. Olesen, L., Löwe, R and Arnbjerg-Nielsen, K. (2017). Flood Damage Assessment: Literature review and recommended procedure. Cooperative Research Centre for Water Sensitive Cities, Melbourne, Australia. Pielke, R.A., Klein, R., Distinguishing tropical cyclone-related flooding in U.S. Presidential Disaster Declarations: 1965-1997. (2005) Nat Hazards Rev. 6(2), 55-59. Rappaport, E.N., Fatalities in the United States from Atlantic tropical cyclones: New data and interpretation. (2014) B Am Meteorol Soc. 95, 341–346. Swiss Re (2017). Sigma – Natural catastrophes and man-made disasters in 2016: a year of widespread damages. No. 2/2017. Thieken, A. H., Müller, M., Kreibich, H., & Merz, B. (2005). Flood damage and influencing factors: New insights from the August 2002 flood in Germany. Water resources research, 41(12).

38
USACE. (2006). Depth-Damage Relationships for Structures, Contents, and Vehicles and Content-to-Structure Value Ratios (CSVR) in Support of the Donaldsonville to the Gulf, Louisiana, Feasibility Study. USACE New Orleans District. Van Ootegem, L., Verhofstadt, E., Van Herck, K., & Creten, T. (2015). Multivariate pluvial flood damage models. Environmental Impact Assessment Review, 54, 91-100. Villarini, G., Smith, J.A., Baeck, M.L., Marchok, T., Vecchi, G.A., Characterization of rainfall distribution and flooding associated with U.S. landfalling tropical cyclones: Analyses of Hurricanes Frances, Ivan, and Jeanne (2004). J Geophys Res. 116, D23116 (2011). Villarini, G., Goska, R., Smith, J.A., Vecchi, G.A., North Atlantic tropical cyclones and U.S. flooding. (2014) B Am Meteorol Soc. 95(9), 1381-1388. Wright, A., Comparing Flood Maps (2017) Risk & Insurance. Available at https://www.argolimited.com/comparing-flood-maps-risk-insurance/