Embed Size (px)
Citation preview

Zerihun G. Kelbore
GSSS, University of Trento
International Conference on Climate Change Impacts and
Adaptation for Food and Environmental Security
SEARCA, College, Los Banos, Laguna, Philippines
November 2012
International Conference on Climate Change Im
pacts and Adaptation for Food and Environm
ental Security 2012

Introduction
Climate of Ethiopia: An Overview
Data and Methodology
Results
Simulation : Impacts of Future Climate Change on Crop
Yields and Yield Variability
Conclusion
International Conference on Climate Change Im
pacts and Adaptation for Food and Environm
ental Security 2012

Kiremt/Meher refers to the long and heavy rainy season
which lasts from June to September; correspond to the main
meher growing season.
Belg is a short and moderate rainy season that lasts from
February to May.
accounts for only 5 to 10 percent of the total annual grainproduction of the country; the remaining share goes to Meher
season harvest
International Conference on Climate Change Im
pacts and Adaptation for Food and Environm
ental Security 2012

IPCC forecasts change in climate
warming world (1.8 to 4.00C )
Increases in CO2 levels
Precipitation patterns would change
Sea levels would rise
Frequency of extreme weather events would increase
… and etc
International Conference on Climate Change Im
pacts and Adaptation for Food and Environm
ental Security 2012

Consequences
Agricultural production will be substantially affected, but impacts unevenly distributed across regions (low latitude and developing countries severely hit)
Global agricultural productions may decline by 16% by 2080, in developing countries by around 20% (Cline, 2007)
International Conference on Climate Change Im
pacts and Adaptation for Food and Environm
ental Security 2012

AFRICA
Considered the most disproportionately affected region in the world, with low levels of irrigation (only 6 %, while in Asia 38%)
Share of Agriculture in GDP is high
Particularly, in Sub-Saharan Africa it provides 70% of employment and contributes 30% to GDP
International Conference on Climate Change Im
pacts and Adaptation for Food and Environm
ental Security 2012
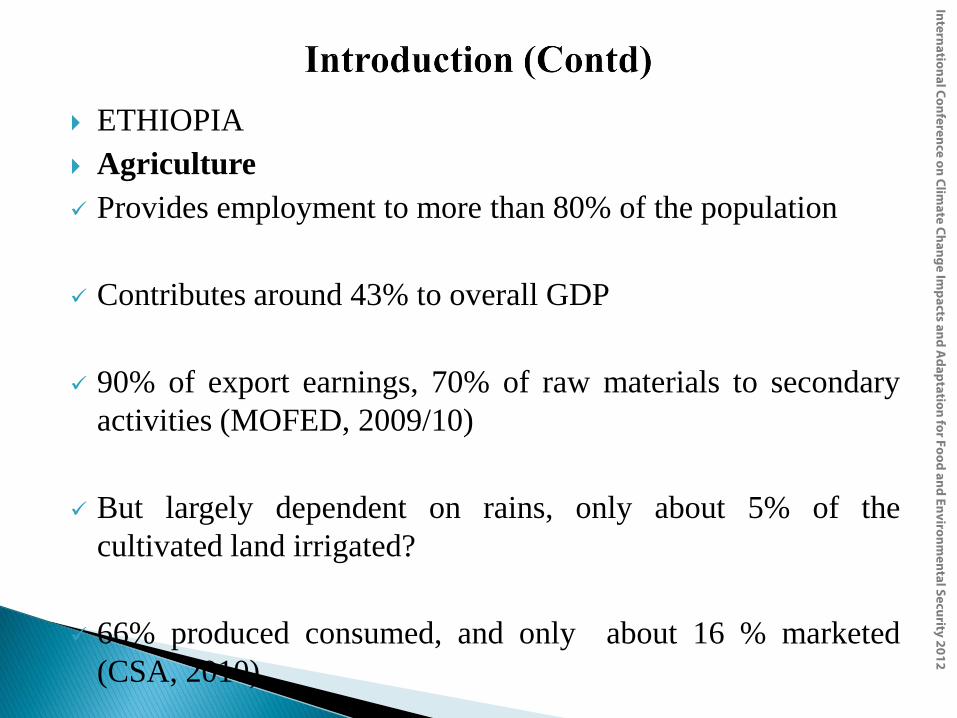
ETHIOPIA
Agriculture
Provides employment to more than 80% of the population
Contributes around 43% to overall GDP
90% of export earnings, 70% of raw materials to secondary
activities (MOFED, 2009/10)
But largely dependent on rains, only about 5% of the
cultivated land irrigated?
66% produced consumed, and only about 16 % marketed
(CSA, 2010)
International Conference on Climate Change Im
pacts and Adaptation for Food and Environm
ental Security 2012

The risk of climate extremes increase as very few farmers are
using irrigation
Drought risk could severely affect farmers` livelihood as it
may reduce farm production up to 90% (WB, 2003)
Farmers have traditional coping mechanisms, but fail in times
of drought
Other risk management options include, lower value, lower
yield, and lower risk cultivation; perpetuating poverty
(Dercon, 2005)
International Conference on Climate Change Im
pacts and Adaptation for Food and Environm
ental Security 2012

How average crop yields (maize, teff, and wheat) their variance responded to changes in weather?
How future climate changes will affect crop yield and its variability in Ethiopia?
International Conference on Climate Change Im
pacts and Adaptation for Food and Environm
ental Security 2012

Diverse topography Has 11 climatic zones broadly categorized as
dry climate, tropical rainy climate and temperate rainy climate (NMSA, 1996)
Different atmospheric circulation patterns resulted in determine rainfall patterns across the country (SEJ, ITCZ, etc)
Two important rainy periods: Kiremt (June to September), and Belg (February to May)
International Conference on Climate Change Im
pacts and Adaptation for Food and Environm
ental Security 2012

International Conference on Climate Change Im
pacts and Adaptation for Food and Environm
ental Security 2012

Data
Crop Yield Data for Maize, Teff, and Wheat
Agricultural Sample Surveys since 1979/80 to 2008/09
(Meher season post-harvest )
Included 14 Zones from three regions (Amhara(5),
Oromia (6), and SNNP (3))
International Conference on Climate Change Im
pacts and Adaptation for Food and Environm
ental Security 2012

National Average Crop Yield
1979/80 to 2008/09
Average Crop Yield
Crops 1979/80 2008/09 %change
Teff 9.5 12.2 28.42
Wheat 17.34 22.24 28.3
Maize 11.09 17.46 57.44
International Conference on Climate Change Im
pacts and Adaptation for Food and Environm
ental Security 2012

Summary of Regional Rainfall Data A time series rainfall data for 14
weather stations for the period
1979/80 to 2008/09
Kiremt/Meher and Belg season
rainfalls
Obtained from Meteorological
Services Agency of Ethiopia
AMHARA
Variable Mean Std. Dev. Observations
kiremt 798.83 309.91 N = 145
belg 233.11 171.20 n = 5
T = 29
OROMIA
kiremt 655.51 459.60 N = 174
belg 347.28 236.53 n = 6
T = 29
SNNPR
kiremt 432.78 202.32 N = 87
belg 323.71 113.66 n = 3
T = 29
International Conference on Climate Change Im
pacts and Adaptation for Food and Environm
ental Security 2012

Methodology
The Just and Pope (1978) Stochastic Production
Function
Decomposes production function into theoutput level and variability of thatoutput level
5.0;; itititit ZhXfY
;itXf
5.0; itit Zh
termstochastic is it 2
itV and 0 itE
International Conference on Climate Change Im
pacts and Adaptation for Food and Environm
ental Security 2012

Panel Unit Root
Fisher Type Panel Unit Root Test (Maddala and Wu, 1999)
With Dickey-Fuller statistics of AR(1)
We reject the null at 0.01 significance level.
i oneleast at for ,0:H ; i allfor ,0:H
N allfor T as freedom of degrees 2N as ddistribute is
ln2
a0
i
2
1
withP
pPN
i
N allfor T as freedom of degrees 2N as ddistribute is i
2 withP
International Conference on Climate Change Im
pacts and Adaptation for Food and Environm
ental Security 2012

P
(drift, lag (1), demeaned, N=14)
Crops
Teff 145.32*
Wheat 138.72*
Maize 149.90*
Rainfall
Kiremt 258.66*
Belg 180.36*
Annual 193.71*
Table 2. Fisher Type Unit Root Test Results
*Significant at 1% with | 2(28)=48.28
International Conference on Climate Change Im
pacts and Adaptation for Food and Environm
ental Security 2012
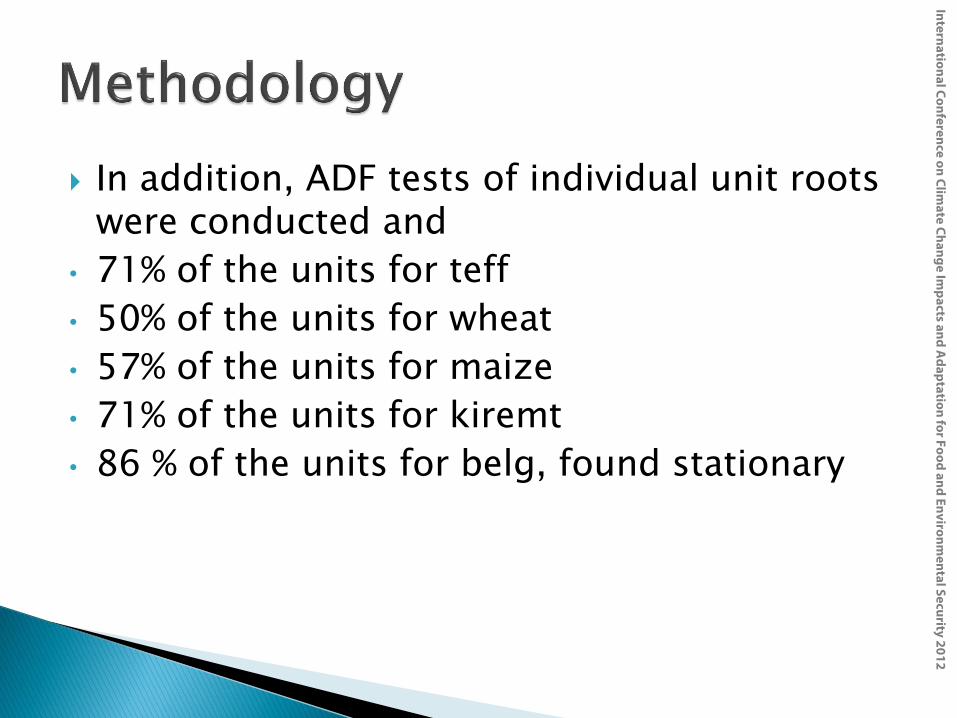
In addition, ADF tests of individual unit roots were conducted and
• 71% of the units for teff
• 50% of the units for wheat
• 57% of the units for maize
• 71% of the units for kiremt
• 86 % of the units for belg, found stationary
International Conference on Climate Change Im
pacts and Adaptation for Food and Environm
ental Security 2012

T
i
n
i
T
i
n
i it
itit
itXh
XfYXhNL
1 1 1
2
;
;;ln2ln*
2
1ln
Provides a maximum likelihood estimates of parameters and δ
•Panel Data Model
•Fixed or Random Effects Model
•Hausman Test rejects the null hypothesis that the panel unit specific
errors (ui) are not correlated with the regressors; and the random effects
model with a maximum likelihood option is estimated
•
International Conference on Climate Change Im
pacts and Adaptation for Food and Environm
ental Security 2012

An increase in kiremt season rainfall increases crop yields in
SNNP region
It has a relative decreasing effect on teff and wheat yields in
Amhara and Oromia regions
An increase in belg rain increases maize yield in Oromia
region, reduces teff and wheat yield in SNNP region
Change in crop production technology increases mean crop
yields across regions at an increasing rate
International Conference on Climate Change Im
pacts and Adaptation for Food and Environm
ental Security 2012

An increase in kiremt rainfall decreases variability of teff and
wheat yields in SNNP, and maize yield in Amhara region
An increasing belg rainfall decreases variability of average teff
yield in SNNP region, and average maize yield in Oromia
region
Technical change decreases variability of all crops across
regions
International Conference on Climate Change Im
pacts and Adaptation for Food and Environm
ental Security 2012

Table 3: Estimate Coefficients from Mean Crop Yield Regressions
Teff se Wheat se Maize Se
Kiremt 0.1436*** (0.0751) 0.1480*** (0.0810) -0.0159 (0.0517)
Belg -0.0327 (0.0292) -0.0227 (0.0293) 0.1050*** (0.0618)
D1_kiremt -0.1495*** (0.0875) -0.1743*** (0.0941) -0.0476 (0.0818)
D2_kiremt -0.1452*** (0.0809) -0.2239** (0.0888)
Trend -0.0143*** (0.0074) -0.0148** (0.0073) 0.0017 (0.0094)
Trend^2 0.0007* (0.0002) 0.0011* (0.0002) 0.0005*** (0.0003)
D3_kiremt 0.0198 (0.1255)
D1_belg -0.0413 (0.0859)
D3_belg -0.1329 (0.1128)
D1 1.0562** (0.5326) 1.0474*** (0.5750) 0.3940 (0.8080)
D2 1.0616** (0.4831) 1.4419* (0.5334)
D3 0.5191 (0.9681)
Intercept 1.3620 (0.4623) 1.5484* (0.5044) 2.1258* (0.5106)
N 359 352 359
Ha 7.85 (0.3460) 3.13 (0.6797) 8.37 (0.3983)
Standard errors in parentheses * **p<0.10 ** p<0.05 * p<0.01
International Conference on Climate Change Im
pacts and Adaptation for Food and Environm
ental Security 2012

Teff SE Wheat SE Maize SE
Kiremt -0.936** (0.434) -0.578*** (0.307) 0.226 (0.155)
Belg -0.939*** (0.553) 0.226 (0.234) -0.328 (0.303)
D1_kiremt 0.716 (0.546) 1.101* (0.425) -0.689* (0.167)
D2_kiremt 0.781*** (0.457) 0.868** (0.373)
D1_belg 0.952 (0.632) 0.276 (0.408)
D2_belg 1.213*** (0.627)
D3_kiremt 0.410** (0.170)
D3_belg -0.0905 (0.664)
Trend -0.00667 (0.0135) -0.0166 (0.0191) -0.0901* (0.0121)
D1 -10.18** (4.618) -7.535* (2.591) 2.813 (2.800)
D2 -11.34* (3.801) -5.736** (2.284)
D3 -2.228 (4.044)
Intercept 7.041** (3.180) -1.330 (2.340) -2.055 (2.250)
N 359 352 359
Ha 10.12 (0.1820) 4.12 (0.6605) 2.90 (0.8943)
Standard errors in parentheses ***<0.10 **p<0.05 *p<0.01
Table 4. Estimated Coefficients from the Variance Function Regression
International Conference on Climate Change Im
pacts and Adaptation for Food and Environm
ental Security 2012

Employed coefficients estimated using the historical data
Simulate the projected % change of average crop yield and its
variability using climate projections from three Atmosphere
Ocean General Circulation Model (AOGCMS) including
CGCM2, PCM, and HadCM3 for the years 2050 and 2100
A2 and B2 Emission Scenarios A2 :heterogeneous world, slowly converging birth rates, economic growth is regional,
slow technological change
B2 : emphasis on local solutions to environmental, economic and social problems,
population growth slower than A2, intermediate economic development; slow
technological change
International Conference on Climate Change Im
pacts and Adaptation for Food and Environm
ental Security 2012

Table 7. % Change in Mean Crop Yields at Regional and National Level Due to Change in
Climate
2050 2100
Region Teff Wheat Maize Teff Wheat Maize
Oromia -3.58 -7.26 -1.51 -1.62 -9.59 0.18
Amhara -1.93 -0.19 47.86 -0.66 -12.30 -0.21
SNNPR 1.89 -17.04 -3.09 -0.28 -17.23 -8.19
National -2.43 -6.21 10.84 -1.09 -11.03 -1.14
International Conference on Climate Change Im
pacts and Adaptation for Food and Environm
ental Security 2012

Table 9. % Change in standard deviation of Yields at Regional and National Level
2050 2100
Regions Teff Wheat Maize Teff Wheat Maize
ORO -2.49 1.20 39.76 -1.84 11.91 1.34
AMH -0.01 3.09 52.06 0.17 31.20 3.33
SNNPR 16.23 8.66 43.15 60.14 15.40 7.55
National 0.03 2.40 43.39 3.74 17.52 2.75
International Conference on Climate Change Im
pacts and Adaptation for Food and Environm
ental Security 2012
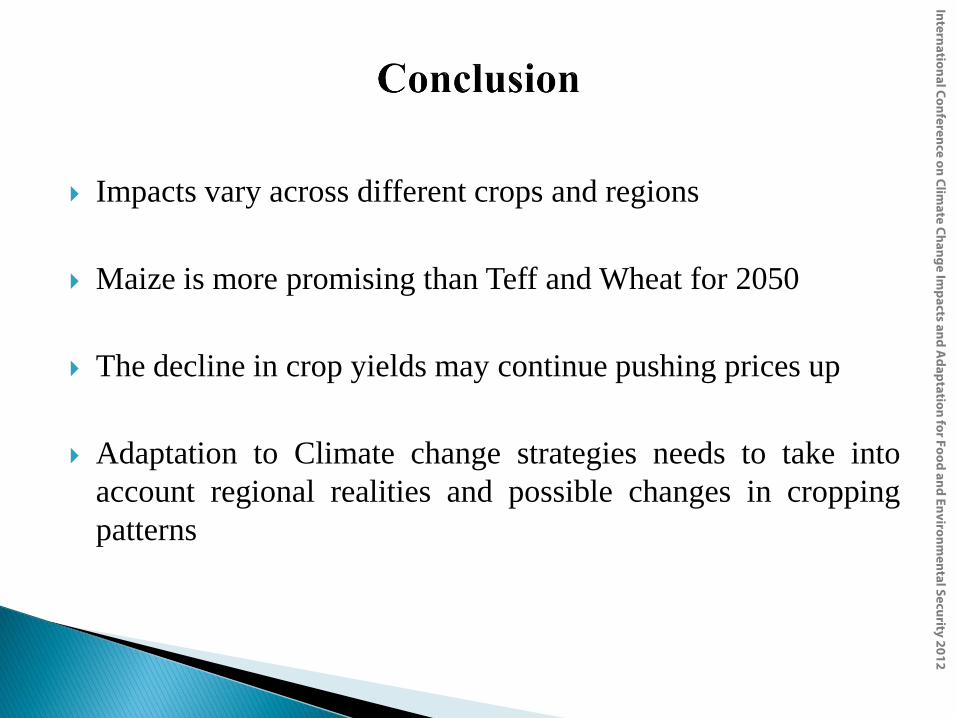
Impacts vary across different crops and regions
Maize is more promising than Teff and Wheat for 2050
The decline in crop yields may continue pushing prices up
Adaptation to Climate change strategies needs to take into
account regional realities and possible changes in cropping
patterns
International Conference on Climate Change Im
pacts and Adaptation for Food and Environm
ental Security 2012
Results may change :
when temperature variable is considered
Emission scenarios change
if downscaled climate change projections are used
International Conference on Climate Change Im
pacts and Adaptation for Food and Environm
ental Security 2012