Embed Size (px)
Citation preview

University of South Carolina University of South Carolina
Scholar Commons Scholar Commons
Senior Theses Honors College
Fall 2020
An Analysis Of How Stress Impacts Dietary Habits In First-Year An Analysis Of How Stress Impacts Dietary Habits In First-Year
Students Students
Matthew Telfer University of South Carolina - Columbia, [email protected]
Follow this and additional works at: https://scholarcommons.sc.edu/senior_theses
Part of the Public Health Commons
Recommended Citation Recommended Citation Telfer, Matthew, "An Analysis Of How Stress Impacts Dietary Habits In First-Year Students" (2020). Senior Theses. 388. https://scholarcommons.sc.edu/senior_theses/388
This Thesis is brought to you by the Honors College at Scholar Commons. It has been accepted for inclusion in Senior Theses by an authorized administrator of Scholar Commons. For more information, please contact [email protected].

1
Table of Contents
1. Thesis Summary …………………………………………….. 2
2. Introduction …………………………………………………. 3
3. Methodology …………………………………………………6
4. Results ……………………………………………………….. 8
5. Discussion …………………………………………………… 10
6. Implications For Further Research ………………………….. 13
7. Conclusion …………………………………………………... 14
8. References …………………………………………………… 17
9. Appendix …………………………………………………...... 22
2
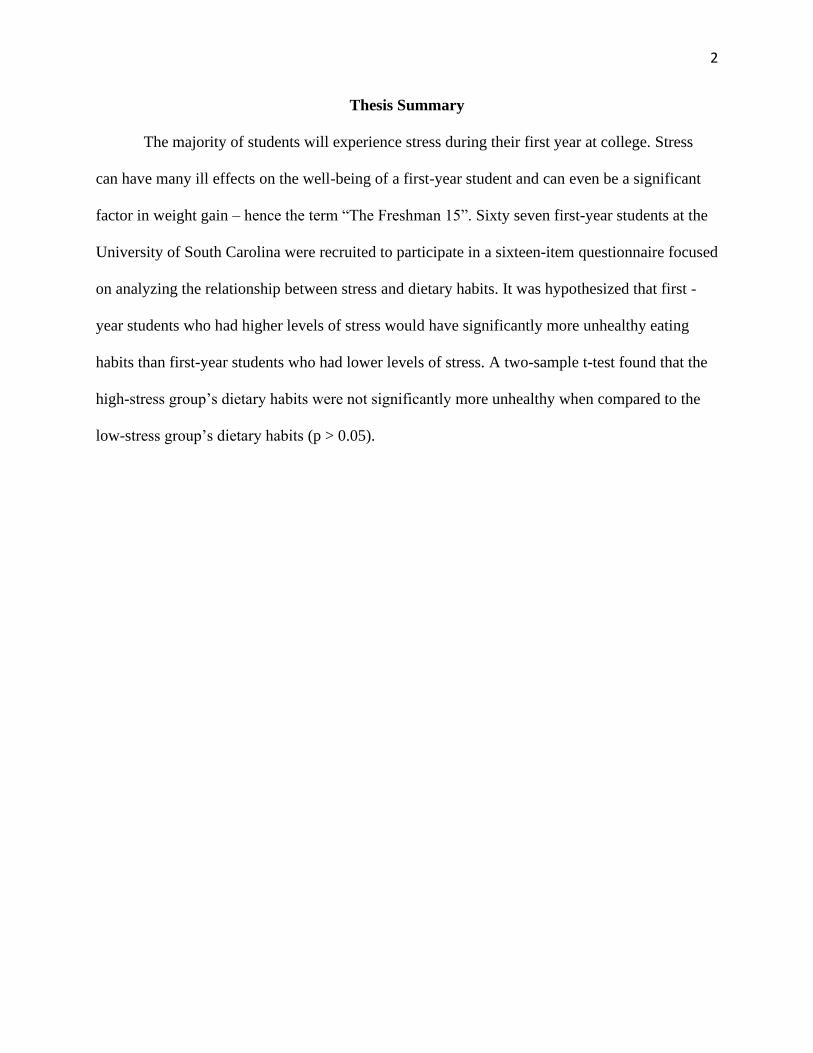
Thesis Summary
The majority of students will experience stress during their first year at college. Stress
can have many ill effects on the well-being of a first-year student and can even be a significant
factor in weight gain – hence the term “The Freshman 15”. Sixty seven first-year students at the
University of South Carolina were recruited to participate in a sixteen-item questionnaire focused
on analyzing the relationship between stress and dietary habits. It was hypothesized that first -
year students who had higher levels of stress would have significantly more unhealthy eating
habits than first-year students who had lower levels of stress. A two-sample t-test found that the
high-stress group’s dietary habits were not significantly more unhealthy when compared to the
low-stress group’s dietary habits (p > 0.05).

3
Introduction
The transition to college life can be difficult for many students as it involves the
adjustment to adulthood and the acceptance of increased responsibility. Many first-year students
are experiencing life on their own for the first time without supervision from their parents. In
2019, 58.7% of undergraduate students reported having “more than average stress” or
“tremendous stress” within the last 12 months (American College Health Association, 2019).
Additionally, first-year students entering college often experience some form of stress during
their first year (Serlachius et. al, 2007). One study found that first-year students had higher levels
of stress and lower levels of emotional well-being compared to second, third and fourth-year
students (Garett et al., 2018). Individuals with higher stress levels are more likely to have a lower
quality of sleep and more likely to experience emotions of anger and fear (Garett et al., 2018).
Stress can be defined as the body’s non-specific response to demand for change, and the
three types of stress include physical, metabolic and psychosocial (Wongvibulsin, 2014).
Physical stressors include fatigue, overtraining during workouts and surgery (Wongvibulsin,
2014). Metabolic stressors relate to hormonal imbalance, chronic inflammation or exposure to
harmful substances while psychosocial stressors consist of dealing with instances of death,
school examinations and divorce (Wongvibulsin, 2014). The duration of stress often determines
whether stress is acute (immediate response) or chronic (response over prolonged period)
(Wongvibulsin, 2014).
Common stressors in college include poor sleeping and eating habits, a lack of social
activities, and poor academic performance (Acharya et al., 2018). Another study showed that
financial difficulties, parental troubles, relationship problems, and public speaking were also
major stressors within the lives of college students (Bulo & Sanchez, 2014). However, it is
4
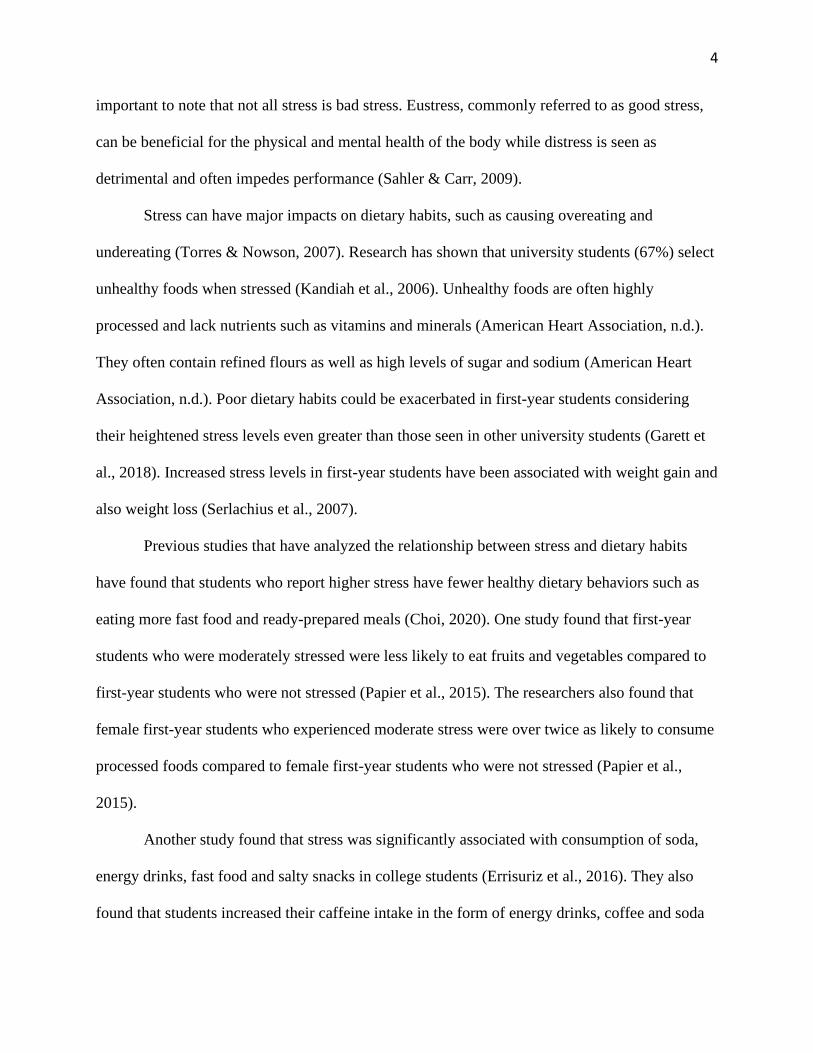
important to note that not all stress is bad stress. Eustress, commonly referred to as good stress,
can be beneficial for the physical and mental health of the body while distress is seen as
detrimental and often impedes performance (Sahler & Carr, 2009).
Stress can have major impacts on dietary habits, such as causing overeating and
undereating (Torres & Nowson, 2007). Research has shown that university students (67%) select
unhealthy foods when stressed (Kandiah et al., 2006). Unhealthy foods are often highly
processed and lack nutrients such as vitamins and minerals (American Heart Association, n.d.).
They often contain refined flours as well as high levels of sugar and sodium (American Heart
Association, n.d.). Poor dietary habits could be exacerbated in first-year students considering
their heightened stress levels even greater than those seen in other university students (Garett et
al., 2018). Increased stress levels in first-year students have been associated with weight gain and
also weight loss (Serlachius et al., 2007).
Previous studies that have analyzed the relationship between stress and dietary habits
have found that students who report higher stress have fewer healthy dietary behaviors such as
eating more fast food and ready-prepared meals (Choi, 2020). One study found that first-year
students who were moderately stressed were less likely to eat fruits and vegetables compared to
first-year students who were not stressed (Papier et al., 2015). The researchers also found that
female first-year students who experienced moderate stress were over twice as likely to consume
processed foods compared to female first-year students who were not stressed (Papier et al.,
2015).
Another study found that stress was significantly associated with consumption of soda,
energy drinks, fast food and salty snacks in college students (Errisuriz et al., 2016). They also
found that students increased their caffeine intake in the form of energy drinks, coffee and soda

5
when faced with stressors (Errisuriz et al., 2016). Finally, they found that stressed students often
consumed quick and accessible foods that were energy-dense yet were nutritionally poor
(Errisuriz et al., 2016). A separate study discovered that convenience was the most important
factor in choosing which food to eat for university students (Marquis, 2005).
Researchers found that as the number of daily hassles increased within an individual’s
life, so did the consumption of foods with higher fat and sugar contents while the consumption of
fruits and vegetables decreased (O’Connor et al., 2008). Another study found that students who
ate breakfast seven days a week as well as those that ate three meals a day reported the highest
levels of happiness (Lesani et al., 2016). Finally, positive emotions were more likely in students
who ate eight or more servings of fruits and vegetables per day (Lesani et al., 2016)
The Freshman 15 is a term commonly used in reference to the weight gain experienced
by first-year university students during their acclimation to college. Previous research has
pointed to snacking, larger portion sizes and inactivity as explanations for the sudden increase in
weight (Mihalopoulos et al., 2008). The weight gained among freshman students has been shown
to be statistically significant when compared to weight gain experienced by the general
population (Mihalopoulos et al., 2008). Although many freshmen gain weight during their first
year at school, it is important to note that very few gain fifteen pounds (Mihalopoulos et al.,
2008).
First-year students will be the focus population of this study. First-year students have not
had as much time as older students within the university to find effective ways to cope with
stressors. Possible coping strategies include utilizing time management skills, speaking with a
therapist and developing proper sleep habits. As a result, stressors may cause larger disruptions
in their life and have a more significant impact on their dietary habits. The majority of first-year
6
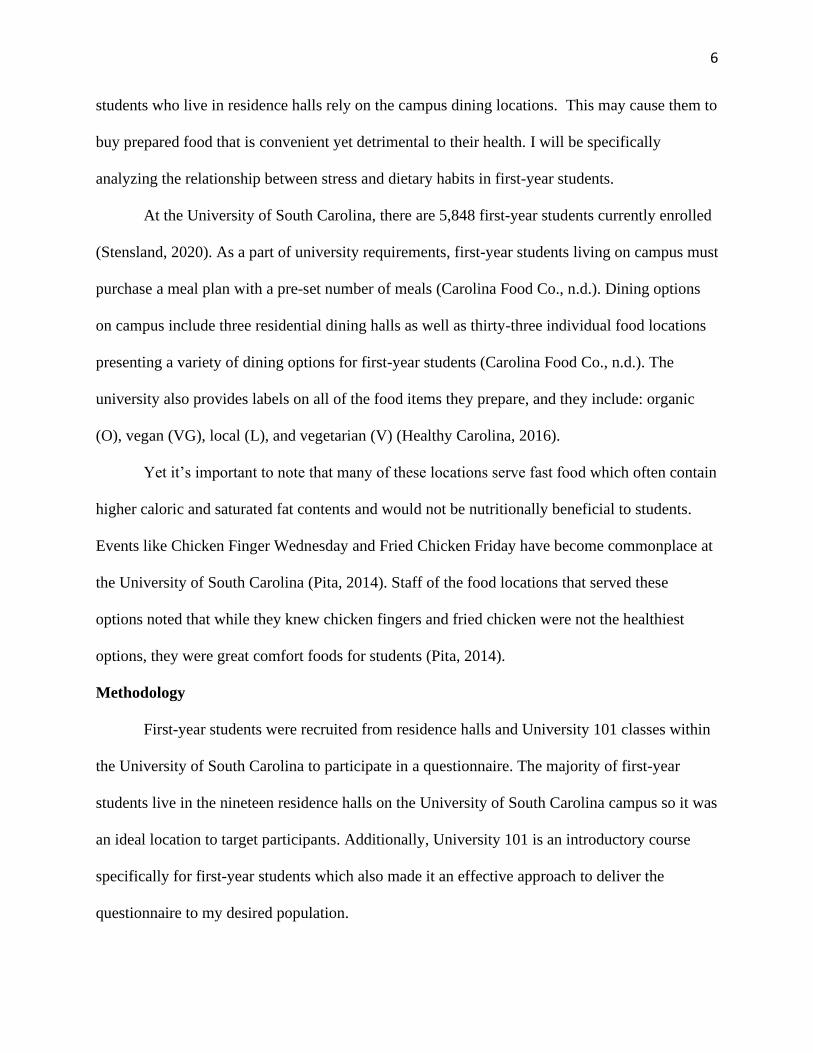
students who live in residence halls rely on the campus dining locations. This may cause them to
buy prepared food that is convenient yet detrimental to their health. I will be specifically
analyzing the relationship between stress and dietary habits in first-year students.
At the University of South Carolina, there are 5,848 first-year students currently enrolled
(Stensland, 2020). As a part of university requirements, first-year students living on campus must
purchase a meal plan with a pre-set number of meals (Carolina Food Co., n.d.). Dining options
on campus include three residential dining halls as well as thirty-three individual food locations
presenting a variety of dining options for first-year students (Carolina Food Co., n.d.). The
university also provides labels on all of the food items they prepare, and they include: organic
(O), vegan (VG), local (L), and vegetarian (V) (Healthy Carolina, 2016).
Yet it’s important to note that many of these locations serve fast food which often contain
higher caloric and saturated fat contents and would not be nutritionally beneficial to students.
Events like Chicken Finger Wednesday and Fried Chicken Friday have become commonplace at
the University of South Carolina (Pita, 2014). Staff of the food locations that served these
options noted that while they knew chicken fingers and fried chicken were not the healthiest
options, they were great comfort foods for students (Pita, 2014).
Methodology
First-year students were recruited from residence halls and University 101 classes within
the University of South Carolina to participate in a questionnaire. The majority of first-year
students live in the nineteen residence halls on the University of South Carolina campus so it was
an ideal location to target participants. Additionally, University 101 is an introductory course
specifically for first-year students which also made it an effective approach to deliver the
questionnaire to my desired population.

7
There were no other requirements to participate in the questionnaire other than self-
identification as a first-year student. The questionnaire was completely anonymous as no
identifying information, such as name or email, was required for participation. By creating a
questionnaire that was completely anonymous, the belief was that students would be forthright
with their responses to questions evaluating their stress levels or dietary habits, potentially
sensitive topics.
The questionnaire was created and delivered to participants through Google Forms. It
was designed to be completed in under five minutes to increase response rates. No incentives
were offered for participating in the survey. A consent form was displayed to students, before
they began the questionnaire, to confirm their desire to participate. The questionnaire consisted
of two sections: one that focused on stress and a second that focused on dietary habits. Sixteen
questions were presented to each participant with ten questions on stress and the remaining six
questions on dietary habits.
The ten questions on stress were taken from the widely used Perceived Stress Scale-10
item (PSS-10). The scale was designed to be assess stress levels over the past month (Cohen &
Williamson, 1988). The questions are straightforward and are not specific to any distinct
population (Cohen & Williamson, 1988). The PSS-10 has been found to be effective in
measuring the response to distress and the ability to cope with different stressors (Lee, 2012).
Possible responses to the PSS-10 were listed as followed: never, almost never, sometimes, fairly
often and very often.
The six questions on dietary habits focused on the frequency of eating various foods and
food groups. The dietary habit questions were self-created to ensure the questionnaire was an
appropriate length. The purpose of the dietary habit questions was to get a better understanding
8
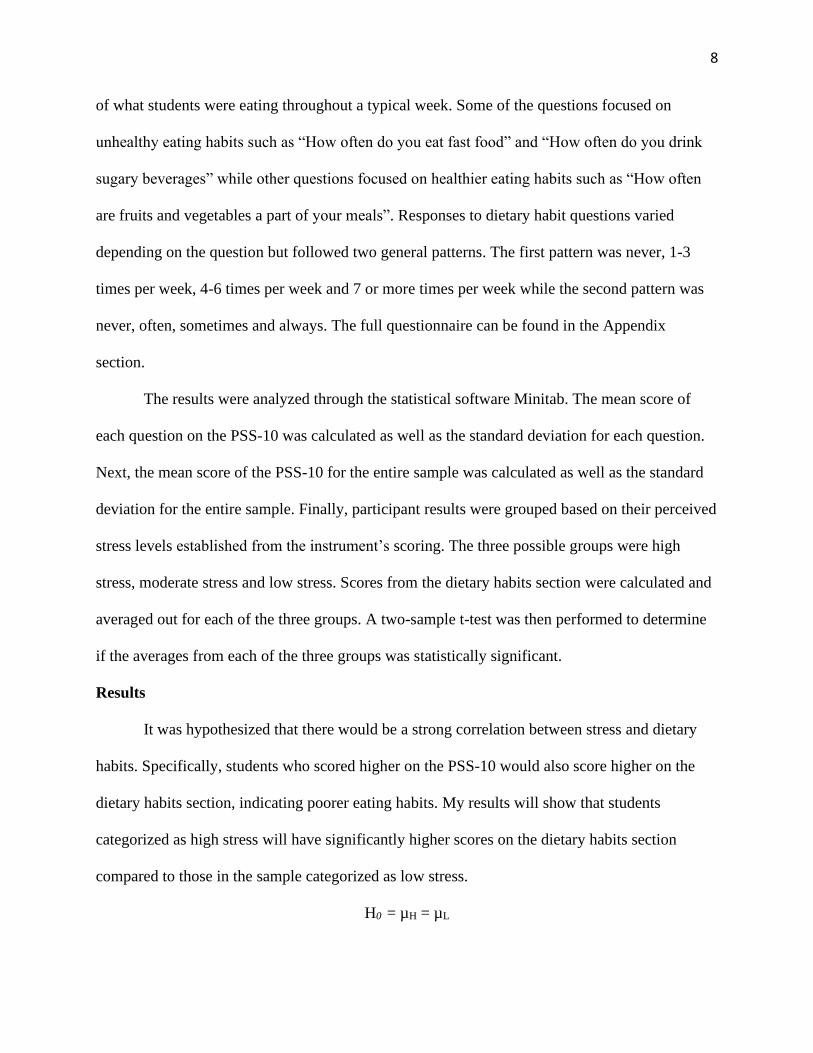
of what students were eating throughout a typical week. Some of the questions focused on
unhealthy eating habits such as “How often do you eat fast food” and “How often do you drink
sugary beverages” while other questions focused on healthier eating habits such as “How often
are fruits and vegetables a part of your meals”. Responses to dietary habit questions varied
depending on the question but followed two general patterns. The first pattern was never, 1-3
times per week, 4-6 times per week and 7 or more times per week while the second pattern was
never, often, sometimes and always. The full questionnaire can be found in the Appendix
section.
The results were analyzed through the statistical software Minitab. The mean score of
each question on the PSS-10 was calculated as well as the standard deviation for each question.
Next, the mean score of the PSS-10 for the entire sample was calculated as well as the standard
deviation for the entire sample. Finally, participant results were grouped based on their perceived
stress levels established from the instrument’s scoring. The three possible groups were high
stress, moderate stress and low stress. Scores from the dietary habits section were calculated and
averaged out for each of the three groups. A two-sample t-test was then performed to determine
if the averages from each of the three groups was statistically significant.
Results
It was hypothesized that there would be a strong correlation between stress and dietary
habits. Specifically, students who scored higher on the PSS-10 would also score higher on the
dietary habits section, indicating poorer eating habits. My results will show that students
categorized as high stress will have significantly higher scores on the dietary habits section
compared to those in the sample categorized as low stress.
H0 = µH = µL

9
HA = µH > µL
The PSS-10 was scored by assigning a numerical value to each of the five responses.
Those values are as followed: never = 0, almost never = 1, sometimes = 2, fairly often = 3, and
very often = 4. The numerical values were reversed for questions 4, 5, 7 and 8 as these questions
are considered positively worded questions compared to the other six which would be considered
negatively worded. Scores range from 0 to 40 with lower scores indicating lower perceived stress
and higher scores indicating higher perceived stress. The mean score on the PSS for all 67
students was 19.72 with a standard deviation of 6.53 (M = 19.72, SD = 6.53).
Next, the responses to the dietary habits were scored by assigning a numerical value to
each response, similarly to how the PSS-10 was scored. Each response was scored from 0 to 3:
never = 0, sometimes = 1, often = 2, always = 3. The second set of possible responses were
scored as followed: never = 0, 1-3 times per week = 1, 4-6 times per week = 2, 7 or more times
per week = 3. Finally, the third set of possible responses were scored as followed: never = 0, 1-2
times per day = 1, 3-4 times per day = 2, 5 or more times day = 3.
Questions 11 and 15 involved healthy dietary habits so the numerical values were
reversed for those two questions during the scoring process. A higher total score on the dietary
habits section of the questionnaire indicated more unhealthy dietary habits while a lower total
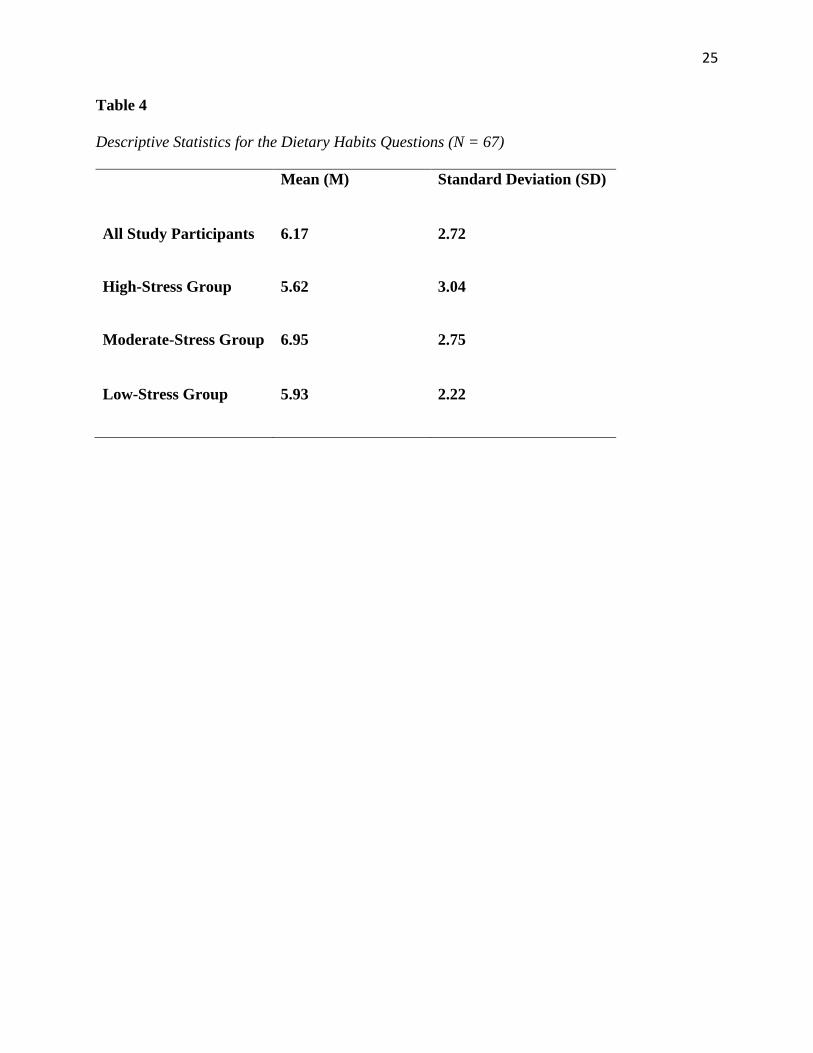
score indicated healthier dietary habits. The total possible score was 18. The mean score on the
dietary habits section for the entire sample was 6.17 and the standard deviation was 2.72 (M =
6.17, SD = 2.72).
Scores from the dietary habits’ questions were then categorized based on the participants
perceived stress levels. The three categories included high-stress, moderate-stress and low-stress.
Scores greater than or equal to 27 on the PSS-10 were considered high-stress, scores from 14-26
10
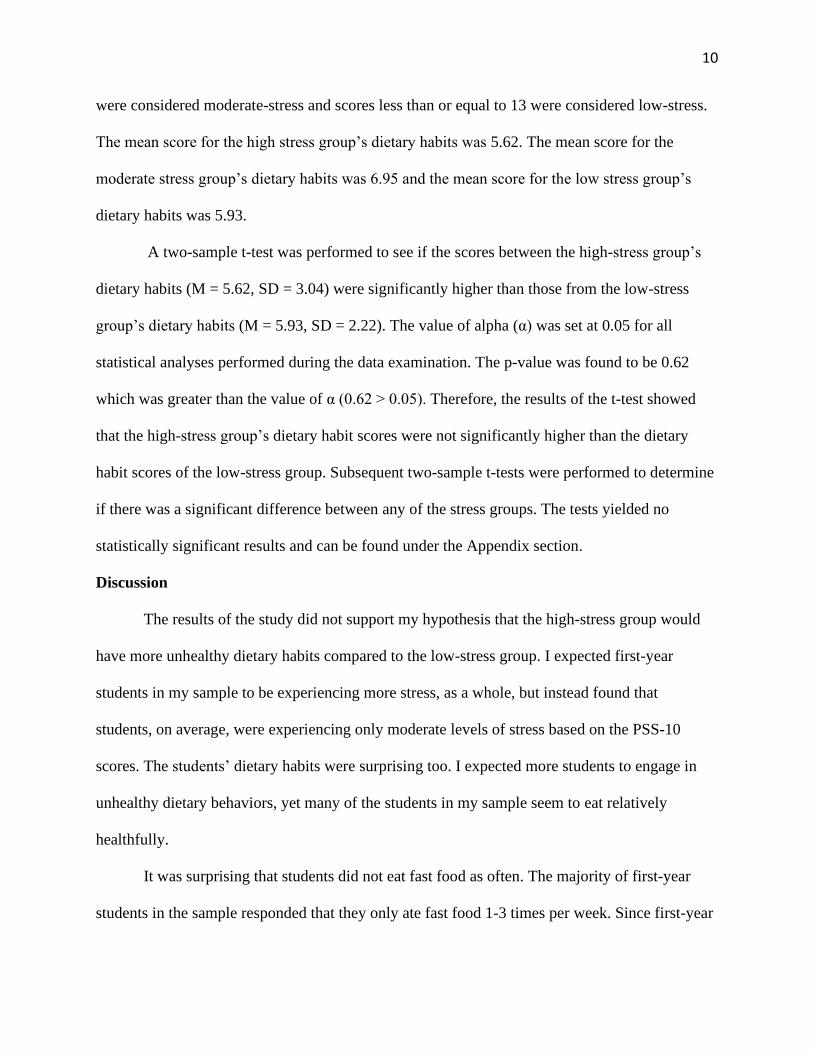
were considered moderate-stress and scores less than or equal to 13 were considered low-stress.
The mean score for the high stress group’s dietary habits was 5.62. The mean score for the
moderate stress group’s dietary habits was 6.95 and the mean score for the low stress group’s
dietary habits was 5.93.
A two-sample t-test was performed to see if the scores between the high-stress group’s
dietary habits (M = 5.62, SD = 3.04) were significantly higher than those from the low-stress
group’s dietary habits (M = 5.93, SD = 2.22). The value of alpha (α) was set at 0.05 for all
statistical analyses performed during the data examination. The p-value was found to be 0.62
which was greater than the value of α (0.62 > 0.05). Therefore, the results of the t-test showed
that the high-stress group’s dietary habit scores were not significantly higher than the dietary
habit scores of the low-stress group. Subsequent two-sample t-tests were performed to determine
if there was a significant difference between any of the stress groups. The tests yielded no
statistically significant results and can be found under the Appendix section.
Discussion
The results of the study did not support my hypothesis that the high-stress group would
have more unhealthy dietary habits compared to the low-stress group. I expected first-year
students in my sample to be experiencing more stress, as a whole, but instead found that
students, on average, were experiencing only moderate levels of stress based on the PSS-10
scores. The students’ dietary habits were surprising too. I expected more students to engage in
unhealthy dietary behaviors, yet many of the students in my sample seem to eat relatively
healthfully.
It was surprising that students did not eat fast food as often. The majority of first-year
students in the sample responded that they only ate fast food 1-3 times per week. Since first-year

11
students are still adjusting to the demands of college classes and developing their time
management, I expected students to consume more fast food due to the convenience it offers.
Another piece of interesting data was that only 27% of students in the sample “Always” ate three
meals per day. Eating less than three meals per day could make students more prone to weight
gain. It would be intriguing to do further research to discover more of what determines the
number of meals students eat each day. It was also fascinating to see that students were not
consuming a large quantity of sugary beverages. The majority of participants (82.1%) said they
consume sugary beverages such as soda, juice, and energy drinks either “never” or “1-3 times
per week.” A previous study found that sugary beverages were the top calorie source for
teenagers and contributed 226 calories each day to their daily calorie total (National Cancer
Institute, 2006).
One limitation of the study was the lack of a control group in which to compare the
results of the first-year sample. Another possible limitation could be the timing of when the
student filled out the questionnaire during the semester. Students may be more stressed if they
filled out the questionnaire during a week when they had many exams, projects, presentations
etc. or less stressed if they did not have any big commitments that week. Finally, the sample size
of the study (n = 67) was relatively small based on the size of the University of South Carolina’s
first-year class. The questionnaire was only available to students online so the convenience
sample may not have been representative of the greater student population at the University of
South Carolina. If subsequent studies were to be performed, more participants should be
recruited for greater accuracy in the results and to reduce the likelihood of random error.
It is also important to note that my results were collected in the midst of the COVID-19
pandemic. Although the effects of the COVID-19 pandemic on the mental health of college-aged

12
students may not be fully known, studies have shown that students have been more stressed and
anxious during the pandemic (Son et al., 2020). During the Spring of 2020, many Universities in
the United States, including the University of South Carolina, moved classes to a virtual format
and forced students out of their on-campus residences. A large number of students were isolated
from their friends due to social distancing policies enacted to prevent the transmission of
COVID-19. Their own health and the health of close family members may have become a larger
priority due to the unknown nature about the progression and mortality of the virus.
Additionally, once students returned to campus or came to campus for the first time, they
may have been detached from others as a result of stricter university policies in place due to
COVID-19. Many courses in the Fall were conducted entirely on a virtual format and minimal
in-person events were held throughout the semester. As a result, more students could have
experienced prolonged isolation which can have profound effects on an individual’s mental
health. It is critical that the university continue to think of ways to create an environment where
students can interact with each other in a safe manner. The abrupt change in lifestyle experienced
by students throughout the COVID-19 pandemic could have a significant impact on their mental
health.
The University of South Carolina offers mindfulness and meditation classes as well as
stress management and wellness sessions (Student Health Services, n.d.). A trained facilitator is
available to lead students through meditation and mindfulness sessions which have been
recommended to treat anxiety, pain, depression, panic attacks, and sleeping troubles (Student
Health Services, n.d.). The Student Health Services department also provides a trained therapy
dog who to assist students who are looking to reduce their stress levels (Student Health Services,
n.d.).

13
The University of South Carolina is currently addressing nutrition education even during
the COVID-19 pandemic through virtual workshops, coaching and classes (Student Health
Services, n.d.). They offer healthy eating workshops throughout the semester where a group of
students can meet with a Registered Dietician (RD) for an hour-long session (Student Health
Services, n.d.). Students gain insight in identifying healthy options both on and off campus while
also learning how to budget for healthful food and groceries (Student Health Services, n.d.). The
university also offers individualized coaching which provides more tailored guidance to achieve
a nutritious lifestyle (Student Health Services, n.d.). Additionally, a Farmer’s Market is held on
Greene Street weekly during the spring semester where students have the opportunity to
purchase fresh produce from local farmers while also being able to view healthful cooking
demonstrations sponsored by the university (Student Health Services, n.d.).
Implications for Future Research
Further research could be conducted by having participants use a tool such as the
Automated Self-Administered 24-hour (ASA24) Dietary Assessment Tool which would more
accurately convey dietary habits. The ASA24 is a detailed tool that allows participants to track
single or multi-day food records (National Cancer Institute, 2020). More demographic variables
could be collected in future questionnaires to compare the differences in gender, race, major and
even socioeconomic status. Incorporating a question about cooking would be useful since several
of the residence halls on the University of South Carolina’s campus are apartment style and
contain kitchens.
It would also be interesting to research the role that alcohol plays within the student’s
mental health and dietary habits. Alcohol can have many negative effects on one’s health and has
been determined to be the leading cause of disability-adjusted life years (DALYs) around the

14
world or those between the ages of 15-49 (Burton & Sheron, 2018). It would be fascinating to
look at the amount of alcohol consumed per week by students and whether those students that
consumed alcohol had greater stress as well as different dietary habits. This could be
accomplished by adding questions regarding estimated alcohol consumption.
It was challenging to recruit first-year students to complete the questionnaire due to the
lack of incentives. Adding an incentive for completing the questionnaire, such as a gift card, may
have increased the response rates. It may have also been beneficial to ask students directly in the
questionnaire if they typically eat more or less when feeling stressed. Additionally, it may have
been helpful to include a definition of the wording “fast food” on the questionnaire due to the
possible differing interpretations.
Another challenge was adjusting my thesis timeline due to the COVID-19 pandemic. I
initially planned to survey 250 first-year students in the Spring of 2020. However, after first-year
students were removed from their residence halls last Spring, the data collection portion of the
thesis moved to the Fall. Data collection was more difficult due to the smaller time window
available to collect data, analyze the data and then complete the final paper.
Conclusion
The results of the study did not support my hypothesis that students who experience high-
stress do not have dietary habits that are significantly more unhealthy than students who
experience low-stress. I was disappointed that the results did not show more of an association
between stress and dietary habits. Yet, I believe this was due to the small sample size within the
study (n = 67). Although more research needs to be conducted before drawing definitive
conclusions, this study shows that first-year students, as a whole, may be more adept at handling
stressors than previously thought. It also sheds some light on the phenomenon of “stress-eating”
15
of unhealthy foods. The high-stress groups would be more likely to “stress-eat” more unhealthy
foods compared to the moderate-stress and low-stress groups. Yet, the results show that this isn’t
really the case. Stress-eating of unhealthier foods may not be associated as much with the college
student population as previously thought.
More first-year students could have discovered other coping strategies to deal with stress.
Students may be benefiting from the improved dining halls or food locations around the
University of South Carolina’s campus. These eateries may be serving healthier options that
prioritize fruits and vegetables while limiting fast food options. During recent renovations to the
university’s student union, Russell House, both a Taco Bell and Pizza Hut location were torn
down and replaced with healthier options (Fedor, 2020).
It is also possible that students are entering college with better eating habits depending
on the region they grew up or based on their family’s socioeconomic status. High schools could
be promoting and offering more lifestyle classes which emphasize how to prepare, select and eat
healthier foods. Students may be drinking fewer sugary beverages due to the removal of vending
machines that contained unhealthy foods in high schools as a part of policies enacted by the U.S.
Department of Agriculture (Child Nutrition Policy, 2013). Additionally, students could be
utilizing nutrition resources on campus or taking part in stress-reducing activities such as
physical activity, meditation and mindfulness groups.
The University of South Carolina, along with universities around the country, works to
optimize the college experience for their students which includes continuously trying to improve
their dining options. Although larger state schools may have more resources to perfect the
variety of food they can offer, it may also mean more food court approaches which could contain
restaurants with unhealthy options. Ultimately, colleges and universities want their dining plans

16
to appeal to students. Universities should prioritize offering healthy options to all of their
students but especially first year and residential students who eat most of their meals on campus.
Carolina Food Co., the University of South Carolina food provider, offers resources including
dietician recommendations for each of the food locations on campus (Carolina Food Co., n.d.).
Nonprofit groups such as the Partnership for A Healthier America (PHA) are also
influencing the way students eat (PHA, 2020). PHA created a Healthier Campus Initiative
forming partnerships with colleges and universities around the country to improve the campus
nutritional landscape (Lee, 2018). The recommendations revolve around increasing the amount
of fruits, vegetables and whole grains while decreasing the amount of fried foods and sugary
beverages (PHA, 2020). Sixty-seven colleges and universities in the United States were a part of
the initiative as of 2018 and that number is growing (Lee, 2018). By surrounding students with
healthier options in campus dining halls, their goal is to encourage them to consume more
nutritious foods both in college and beyond into their adult life (Lee, 2018).

17
References
1. Acharya, L., Lin, J. & Collins, W. (2018). College life is stressful today – Emerging stressors
and depressive symptoms in college students. Journal of American College Health, 66(7),
655-664. https://doi-org.pallas2.tcl.sc.edu/10.1080/07448481.2018.1451869
2. American College Health Association. (2019). Reference Group Executive Summary.
National College Health Assessment. https://www.acha.org/documents/ncha/NCHA-
II_SPRING_2019_US_REFERENCE_GROUP_EXECUTIVE_SUMMARY.pdf
3. American Heart Association. (n.d.). Unhealthy Foods. https://www.heart.org/en/healthy-
living/go-red-get-fit/unhealthy-foods
4. Arsiwalla, D. D., Arnold, A. W., Teel, K. P., Ulrich, P. V., & Gropper, S. S. (2018). The
interactive role of eating regulation and stress in the prediction of weight-related outcomes
among college students. Journal of the International Society for the Investigation of Stress,
34(1), 59-71. https://doi.org/10.1002/smi.2760
5. Bulo, J. G., & Sanchez, M. G. (2014). Sources of stress among college students. CVCITC
Research Journal, 1(1), 16-25.
https://www.academia.edu/7498186/SOURCES_OF_STRESS_AMONG_COLLEGE_STUD
ENTS
6. Burton, R. & Sheron, N. (2018). No level of alcohol consumption improves health. The
Lancet, 392(10152), 987-988. https://doi.org/10.1016/S0140-6736(18)31571-X
7. Carolina Food Co. (n.d.). Health & Wellness. University of South Carolina
https://sc.edu/about/offices_and_divisions/dining_services/our_approach/health_wellness/ind
ex.php

18
8. Carolina Food Co. (n.d.). Meal Plans. University of South Carolina.
https://sc.edu/about/offices_and_divisions/dining_services/meal_plans/index.php
9. Choi, J. (2020). Impact of stress levels on eating behaviors among college students.
Nutrients, 12(5), 1241. Choi J. (2020). Impact of Stress Levels on Eating Behaviors among
College Students. Nutrients, 12(5), 1241. https://doi.org/10.3390/nu12051241
10. Cohen, S. & Williamson, G. (1988). Perceived stress in a probability sample of the United
States. The Social Psychology of Health, https://www.cmu.edu/dietrich/psychology/stress-
immunity-disease-lab/publications/scalesmeasurements/pdfs/cohen,-s.--williamson,-g.-
1988.pdf
11. Errisuriz, V. L., Pasch, K. E., & Perry, C. L. (2016). Perceived stress and dietary choices:
The moderating role of stress management. Eating Behaviors, 22(1), 211-216.
https://doi.org/10.1016/j.eatbeh.2016.06.008
12. Fedor, T. (2020, May 3). Russell House sees changes, memories over past four years. The
Daily Gamecock. https://www.dailygamecock.com/article/2020/05/commencement-russell-
house-changes-2016-to-2020-news-fedor
13. Garett, R., Liu, S., & Young, S. D. (2018). A longitudinal analysis of stress among incoming
college freshman. Journal of American College Health, 65(5), 331-338. https://doi.org
10.1080/07448481.2017.1312413
14. Healthy Carolina. (2016). Healthy Eating Guide. International Student Services.
https://iss.sc.edu/about/offices_and_divisions/student_health_services/documents/healthy-
eating-guide-2016.pdf

19
15. Kandiah, J., Yake, M., Jones, J., & Meyer, M. (2006). Stress influences appetite and comfort
food preferences in college women. Nutrition Research, 26(3), 118-123.
https://doi.org/10.1016/j.nutres.2005.11.010
16. Lee, B. Y. (2018, September 2). College Food Needs to Get Better, This PHA Initiative Is
Helping. Forbes. https://www.forbes.com/sites/brucelee/2018/09/02/college-food-needs-to-
get-better-this-pha-initiative-is-helping/?sh=5a6877bb4d0a
17. Lee, E. (2012). Review of the psychometric evidence of the perceived stress scale. Asian
Nursing Research, 6(4), 121-127. https://doi.org/10.1016/j.anr.2012.08.004
18. Lesani, A., Mohammadpoorasl, A., Javadi, M., Esfeh, J. M., & Fakhari, A. (2016). Eating
breakfast, fruit and vegetable intake and their relation with happiness in college students.
Eating and Weight Disorders – Studies on Anorexia, Bulimia, and Obesity, 21(1), 645-651.
https://doi-org.pallas2.tcl.sc.edu/10.1007/s40519-016-0261-0
19. Marquis, M. (2005). Exploring convenience orientation as a food motivation for college
students living in residence halls. International Journal of Consumer Studies, 29(1), 55-63.
https://doi.org/10.1111/j.1470-6431.2005.00375.x
20. Mihalopoulos, N. L., Auginer, P., & Klein, J. D. (2008). The freshman 15: Is it real? Journal
of American College Health, 56(5), 531-534. https://doi.org/10.3200/JACH.56.5.531-534
21. National Cancer Institute. (2020). Automated Self-Administered 24-Hour (ASAS24) Dietary
Assessment Tool. https://epi.grants.cancer.gov/asa24/
22. National Cancer Institute (2005). Identification of Top Food Sources of Various Food
Components. https://epi.grants.cancer.gov/diet/foodsources/top-food-sources-report-
02212020.pdf

20
23. O'Connor, D. B., Jones, F., Conner, M., McMillan, B., & Ferguson, E. (2008). Effects of
daily hassles and eating style on eating behavior. Health Psychology, 27(1), 20–31.
https://doi-org.pallas2.tcl.sc.edu/10.1037/0278-6133.27.1.S20
24. Papier, K., Ahmed, F., Lee, P., & Wiseman, J. (2015). Stress and dietary behaviour among
first-year university students in Australia: sex differences. Nutrition, 31(2), 324-330.
https://doi.org/10.1016/j.nut.2014.08.004
25. Partnership for A Healthier America. (2020). Healthier Campus Initiative.
https://www.ahealthieramerica.org/healthier-campus-initiative-20#partner_block-293
26. Pita, N. (2014, January 14). Food traditions remain a crucial part of a Russell House diet. The
Daily Gamecock. https://www.dailygamecock.com/article/2014/01/food-traditions-remain-a-
crucial-part-of-a-russell-house-diet
27. Sahler, O. J., & Carr, J. E., (2009). The stress response. Developmental-Behavioral
Pediatrics, 50(1), 491-496. https://doi.org/10.1016/B978-1-4160-3370-7.00050-X
28. Child Nutrition Policy Center. (2013, September 1). Competitive Food Guidelines by State.
School Nutrition Association.
https://schoolnutrition.org/uploadedFiles/Legislation_and_Policy/State_and_Local_Legislati
on_and_Regulations/4-Sept2013StateCompetitiveFoodPolicies.pdf
29. Serlachius, A., Hamer, M., & Wardle, J. (2007). Stress and weight change in university
students in the United Kingdom. Physiology and Behavior, 92(4), 548-553.
https://doi.org/10.1016/j.physbeh.2007.04.032
30. Son, C., Hegde, S., Smith, A., Wang, X., & Sansangohar, F. (2020). Effects of COVID-19 on
college students’ mental health in the United States: Interview survey study. Journal of
Medical Internet Research, 22(9). https://doi.org/10.2196/21279

21
31. State of New Hampshire Employee Assistance Program. (2020, October 30). Perceived
Stress Scale. https://das.nh.gov/wellness/docs/percieved%20stress%20scale.pdf
32. Stensland, J. (2020, September 8). UofSC enrollment increases. University of South
Carolina.
https://www.sc.edu/uofsc/posts/2020/09/2020_freshman_class.php#.X7mAR9NKgUo
33. Student Health Services. (n.d.). Eating Well. University of South Carolina.
https://sc.edu/about/offices_and_divisions/student_health_services/wellness-
prevention/eating-well/index.php
34. Student Health Services, (n.d.) Stress Management. University of South Carolina.
https://sc.edu/about/offices_and_divisions/student_health_services/wellness-
prevention/stress-management/
35. Torres, S. J., & Nowson, C. A. (2007). Relationship between stress, eating behavior, and
obesity. Nutrition, 23(11-12), 887-894. https://doi.org/10.1016/j.nut.2007.08.008
36. Wongvibulsin, S. (2014). Defining stress. Explore Integrative Medicine.
https://exploreim.ucla.edu/mind-body/defining-stress/

22
Appendix
Table 1
Descriptive Statistics for the Ten Questions on the Perceived Stress Scale 10 (PSS-10)
Question
Number
N Mean (M) Standard Deviation (SD) 95% CI
1 67 2.269 0.898 (2.050, 2.488)
2 67 2.328 1.064 (2.060, 2.588)
3 67 2.806 0.909 (2.584, 3.028)
4 67 1.284 0.670 (1.120, 1.447)
5 67 1.761 0.761 (1.576, 1.947)
6 67 1.866 1.153 (1.584, 2.147)
7 67 1.746 0.766 (1.560, 1.933)
8 67 1.627 0.832 (1.424, 1.830)
9 67 2.075 1.034 (1.822, 2.327)
10 67 1.985 1.148 (1.705, 2.265)

23
Table 2.1
Results for the Responses to Questions on Dietary Habits (N = 67)
Never Sometimes Often Always
How often do you eat
three meals per day?
20.9% 25.4% 26.9% 26.9%
How often do you eat
dessert at the end of a
meal?
22.4% 52.2% 23.9% 1.5%
How often are fruits
and vegetables apart
of your meals?
1.5% 25.4% 41.8% 31.3%
Table 2.2
Results for the Responses to Questions on Dietary Habits (N = 67)
Never 1-3 times per
week
4-6 times per
week
7 or more times
per week
How often do you
eat fast food?
17.9% 59.7% 19.4% 3%
How often do you
drink sugary
beverages?
43.3%
38.8%
6%
1.9%

24
Table 2.3
Results for the Responses to Questions on Dietary Habits (N = 67)
Never 1-2 times per
day
3-4 times per
day
5 or more times
per day
How often do you
snack on salty or
sweet foods?
12.1% 65.2% 19.7% 3%
Table 3
Results of the Two-Sample T-Test for Each Stress Group’s Mean Dietary Habits Score
P-Value
High-Stress Group vs. Moderate-Stress Group
(Mean of High-Stress Group > Mean of Moderate-Stress Group)
0.91
High-Stress Group vs. Low-Stress Group
(Mean of High-Stress Group > Mean of Low-Stress Group)
0.62
Moderate-Stress Group vs. Low Stress Group
(Mean of Moderate-Stress Group > Mean of Low-Stress Group)
0.09
*denotes statistical significance at α = 0.05
25
Table 4
Descriptive Statistics for the Dietary Habits Questions (N = 67)
Mean (M) Standard Deviation (SD)
All Study Participants 6.17 2.72
High-Stress Group 5.62 3.04
Moderate-Stress Group 6.95 2.75
Low-Stress Group 5.93 2.22

26
Consent to Participate Form

27
Perceived Stress Scale – 10 Section

28

29

30

31
Dietary Habits Section

32