Embed Size (px)
Citation preview

An analysis of Hong KongAn analysis of Hong Kong’’sstemperature and rainfall recordtemperature and rainfall record
WyssWyss W.W.--S. S. YimYimDepartment of Earth Sciences, The University of Hong Kong / Department of Earth Sciences, The University of Hong Kong /
School of Energy & Environment, City University of Hong KongSchool of Energy & Environment, City University of Hong Kong
Acknowledgements Acknowledgements ––This work is partially supported by RGC and University of Hong KThis work is partially supported by RGC and University of Hong Kong ong research grants. Thanks are due to the HKO for providing meteororesearch grants. Thanks are due to the HKO for providing meteorological logical data, Elaine data, Elaine KooKoo, Dr Judy Huang and Prof. Johnny Chan for their help., Dr Judy Huang and Prof. Johnny Chan for their help.

PlanPlan4 parts:(1) Introduction
(2) Hong Kong’s temperature record
(3) Hong Kong’s rainfall record
(3) Implications/conclusions

Some questions to be answeredSome questions to be answeredHas Hong Kong’s present temperature been exceeded in the past?Can natural variability and human impact be identified from the record?What is important in causing the changes?Are there other important drivers other than carbon dioxide?What are the implications for environmental sustainability?

Components of the EarthComponents of the Earth’’s systems system- Atmosphere (air)- Hydrosphere (groundwater, lakes, rivers & oceans)- Cryosphere (ice)- Biosphere (living things)- Pedosphere (soil)- Lithosphere (solid Earth)
Climate change is a product of astronomicalforcing including solar radiation and theinteractions of the components shown

Advantages in studying the present dayAdvantages in studying the present day
Most reliablerecord -
Instrumentalrecord
Informationage
Directobservationse.g. clouds,particulatesand aerosols
Satelliteobservationssince ~1980

Some observed temperature and rainfall Some observed temperature and rainfall changes in Hong Kongchanges in Hong Kong
(source: Hong Kong Observatory)(source: Hong Kong Observatory)
Annual mean temperature ↑ 0.12oC per decade; 1.44oC(1885-2009)
Mean diurnal range ↓ 0.24oC per decade (1947-2009)
Mean sea level (Victoria Harbour) ↑ 26 mm per decade(1954-2009)
Annual rainfall ↑ 51 mm per decade (1947-2009)
Heavy rain days (> 30 mm per hour) ↑ 0.4 days per decade(1947-2009)
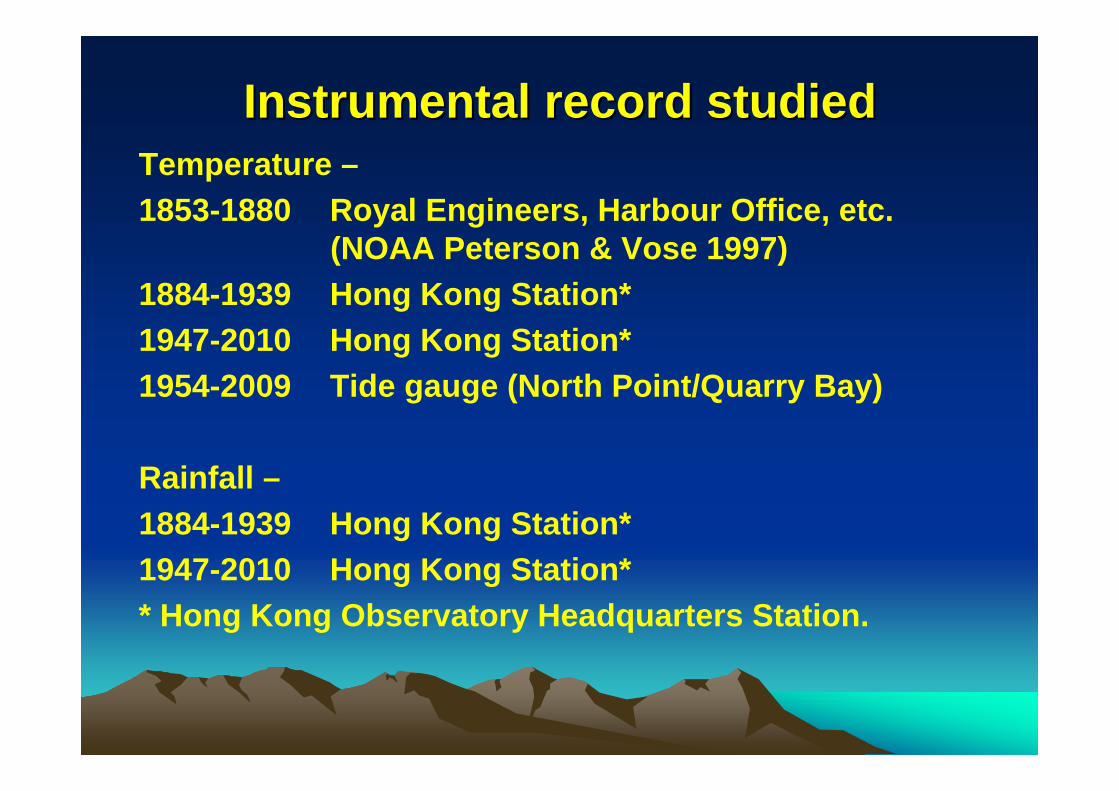
Instrumental record studiedInstrumental record studiedTemperature –1853-1880 Royal Engineers, Harbour Office, etc.
(NOAA Peterson & Vose 1997)1884-1939 Hong Kong Station*1947-2010 Hong Kong Station*1954-2009 Tide gauge (North Point/Quarry Bay)
Rainfall –1884-1939 Hong Kong Station*1947-2010 Hong Kong Station** Hong Kong Observatory Headquarters Station.
↑
→ ←
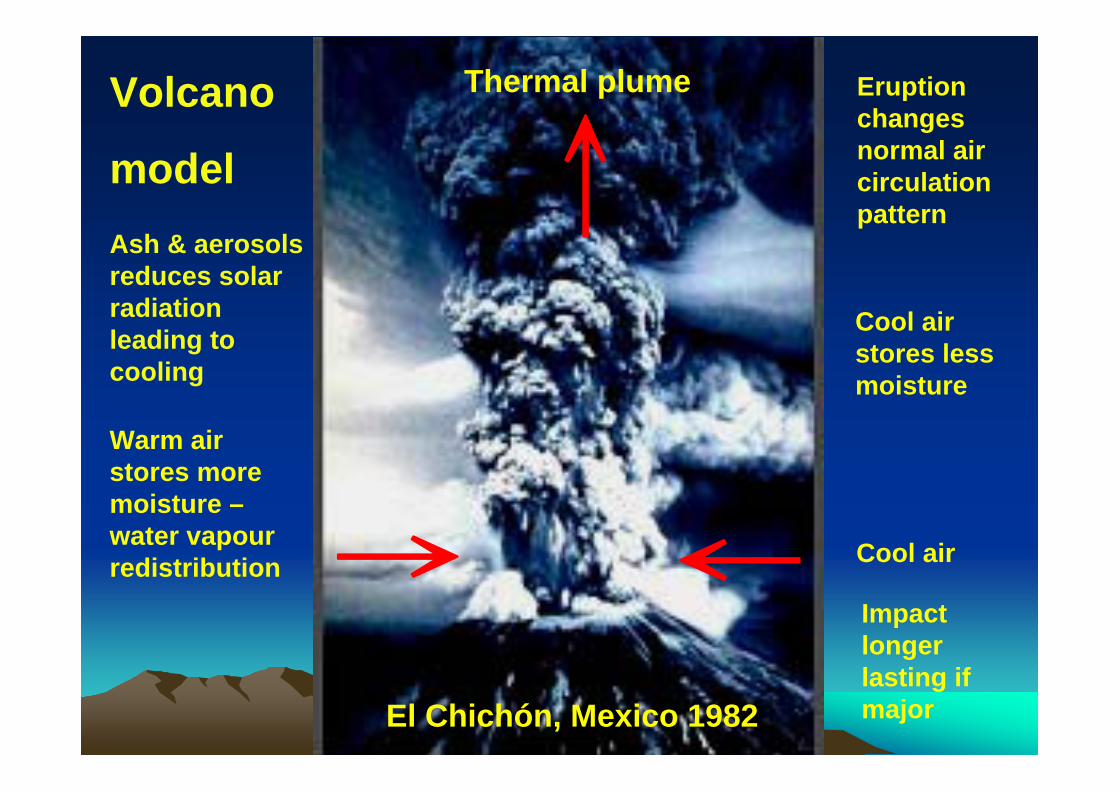
Volcano
model
Thermal plume
Cool air
Warm airstores moremoisture –water vapourredistribution
Cool airstores lessmoisture
El Chichón, Mexico 1982
Eruptionchangesnormal aircirculationpattern
Ash & aerosolsreduces solarradiationleading tocooling
Impact longerlasting ifmajor
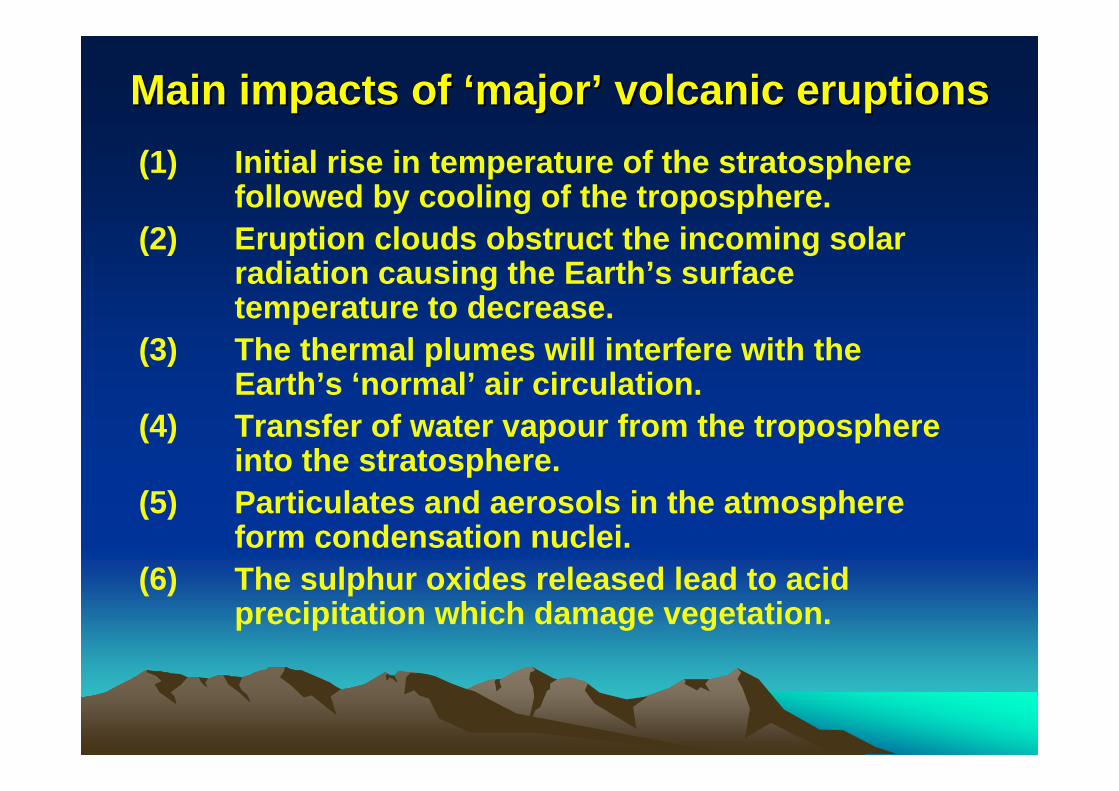
Main impacts of Main impacts of ‘‘majormajor’’ volcanic eruptionsvolcanic eruptions(1) Initial rise in temperature of the stratosphere
followed by cooling of the troposphere.(2) Eruption clouds obstruct the incoming solar
radiation causing the Earth’s surface temperature to decrease.
(3) The thermal plumes will interfere with the Earth’s ‘normal’ air circulation.
(4) Transfer of water vapour from the troposphere into the stratosphere.
(5) Particulates and aerosols in the atmosphere form condensation nuclei.
(6) The sulphur oxides released lead to acid precipitation which damage vegetation.
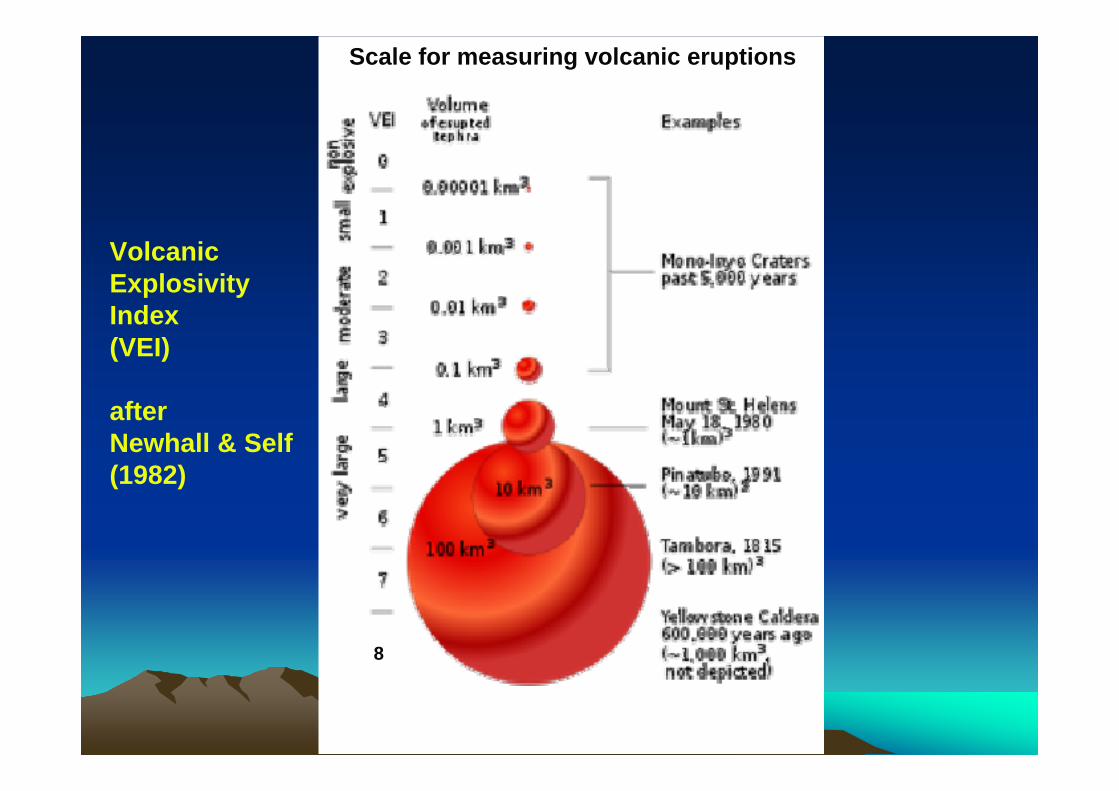
VolcanicExplosivityIndex(VEI)
afterNewhall & Self(1982)
8
Scale for measuring volcanic eruptions
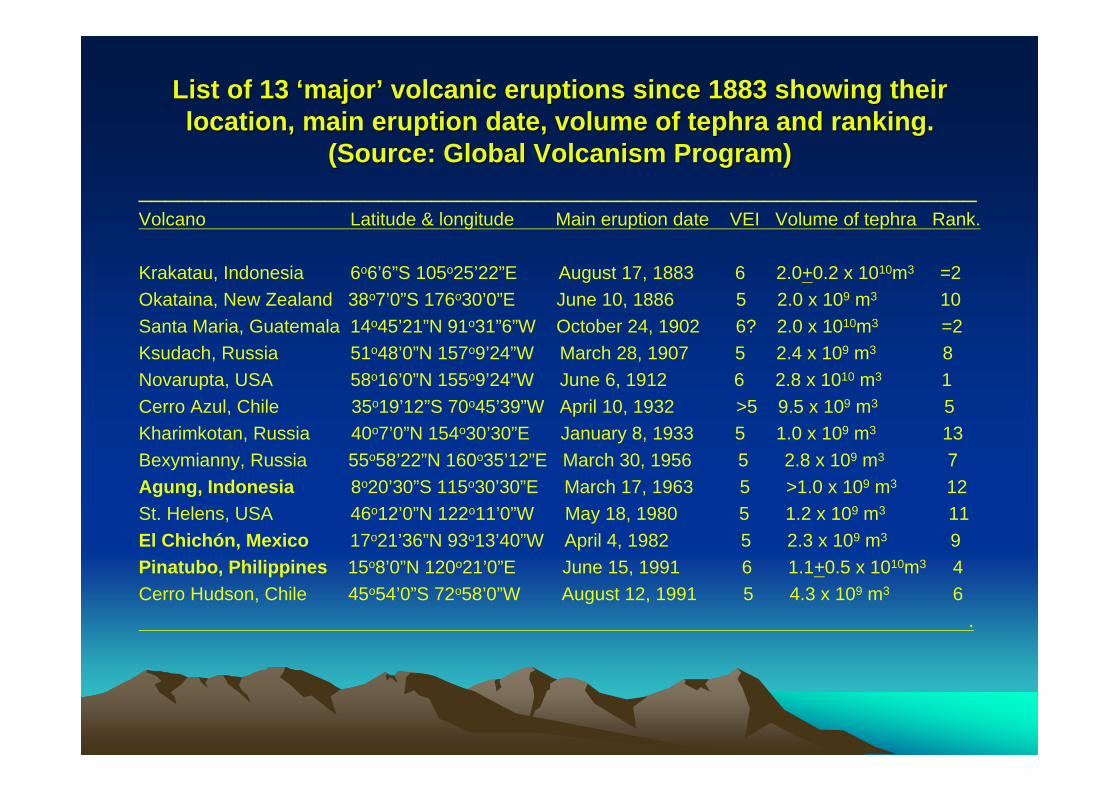
List of 13 List of 13 ‘‘majormajor’’ volcanic eruptions since 1883 showing their volcanic eruptions since 1883 showing their location, main eruption date, volume of location, main eruption date, volume of tephratephra and ranking. and ranking.
(Source: Global Volcanism Program)(Source: Global Volcanism Program)_______________________________________________________________Volcano Latitude & longitude Main eruption date VEI Volume of tephra Rank.
Krakatau, Indonesia 6o6’6”S 105o25’22”E August 17, 1883 6 2.0+0.2 x 10¹⁰m3 =2Okataina, New Zealand 38o7’0”S 176o30’0”E June 10, 1886 5 2.0 x 10⁹ m3 10Santa Maria, Guatemala 14o45’21”N 91o31”6”W October 24, 1902 6? 2.0 x 10¹⁰m3 =2Ksudach, Russia 51o48’0”N 157o9’24”W March 28, 1907 5 2.4 x 10⁹ m3 8Novarupta, USA 58o16’0”N 155o9’24”W June 6, 1912 6 2.8 x 10¹⁰ m3 1Cerro Azul, Chile 35o19’12”S 70o45’39”W April 10, 1932 >5 9.5 x 10⁹ m3 5Kharimkotan, Russia 40o7’0”N 154o30’30”E January 8, 1933 5 1.0 x 10⁹ m3 13Bexymianny, Russia 55o58’22”N 160o35’12”E March 30, 1956 5 2.8 x 10⁹ m3 7Agung, Indonesia 8o20’30”S 115o30’30”E March 17, 1963 5 >1.0 x 10⁹ m3 12St. Helens, USA 46o12’0”N 122o11’0”W May 18, 1980 5 1.2 x 10⁹ m3 11El Chichón, Mexico 17o21’36”N 93o13’40”W April 4, 1982 5 2.3 x 10⁹ m3 9Pinatubo, Philippines 15o8’0”N 120o21’0”E June 15, 1991 6 1.1+0.5 x 10¹⁰m3 4Cerro Hudson, Chile 45o54’0”S 72o58’0”W August 12, 1991 5 4.3 x 10⁹ m3 6
.

Location of Location of AgungAgung, El , El ChichChichóónn and Pinatuboand Pinatubo
+ AgungIndonesia 1963
+ El ChichónMexico 1982
●HK+ Pinatubo
Philippines 1991
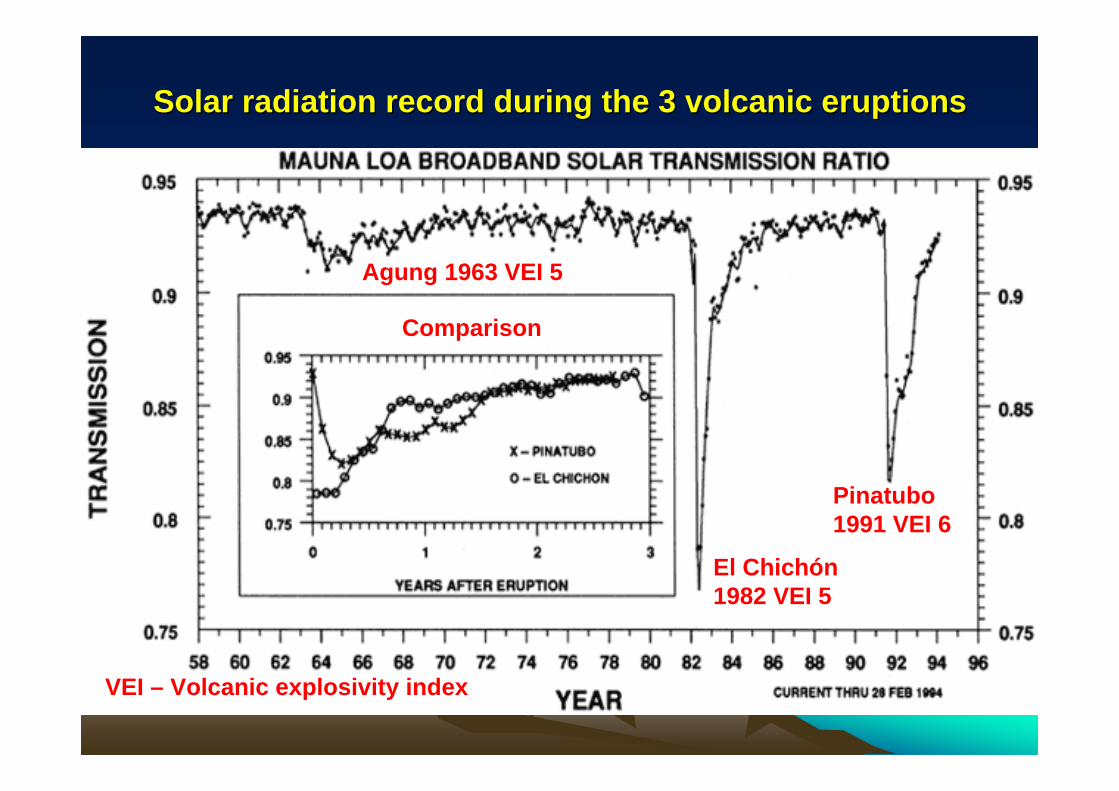
Solar radiation record during the 3 volcanic eruptionsSolar radiation record during the 3 volcanic eruptions
Agung 1963 VEI 5
El Chichón1982 VEI 5
Pinatubo1991 VEI 6
Comparison
VEI – Volcanic explosivity index

Latitude, first eruption date, volume of materials Latitude, first eruption date, volume of materials erupted and annual precipitation at the Hong Kong erupted and annual precipitation at the Hong Kong Station during the 1963 Station during the 1963 AgungAgung, 1982 El , 1982 El ChichChichóónn and and 1991 Pinatubo eruptions1991 Pinatubo eruptions_______________________________________________________________________
Volcano Latitude First eruption Volume of materials Annual Rainfall^ Commentdate erupted (mm)
_________________________________________________________________________________
Agung, 8oS February 18, ~1 km3 (Rampino & 901.1 Driest yearIndonesia 1963 Self, 1982)
El Chichón, 17oN March 28, ~0.6 km3 (Rampino & 3247.5 2nd wettestMexico 1982 Self, 1984) year
Pinatubo, 15oN June 15, ~5 km3 (Self et al., 1999) 1639.1 10th driestPhilippines 1991 year_________________________________________________________________________________^ Mean ~2228 mm.

Spread of the eruption cloud Temperature gradient above ground
Double layer of Pinatubo ash over South Americaon August 8, 1991 (Space shuttle photo)
USGS

Volcanic eruptions have an important role in the redistribution of water vapour within the atmosphere. 1991 ‘ l b l’ d ht
LuzonSouthChina Sea
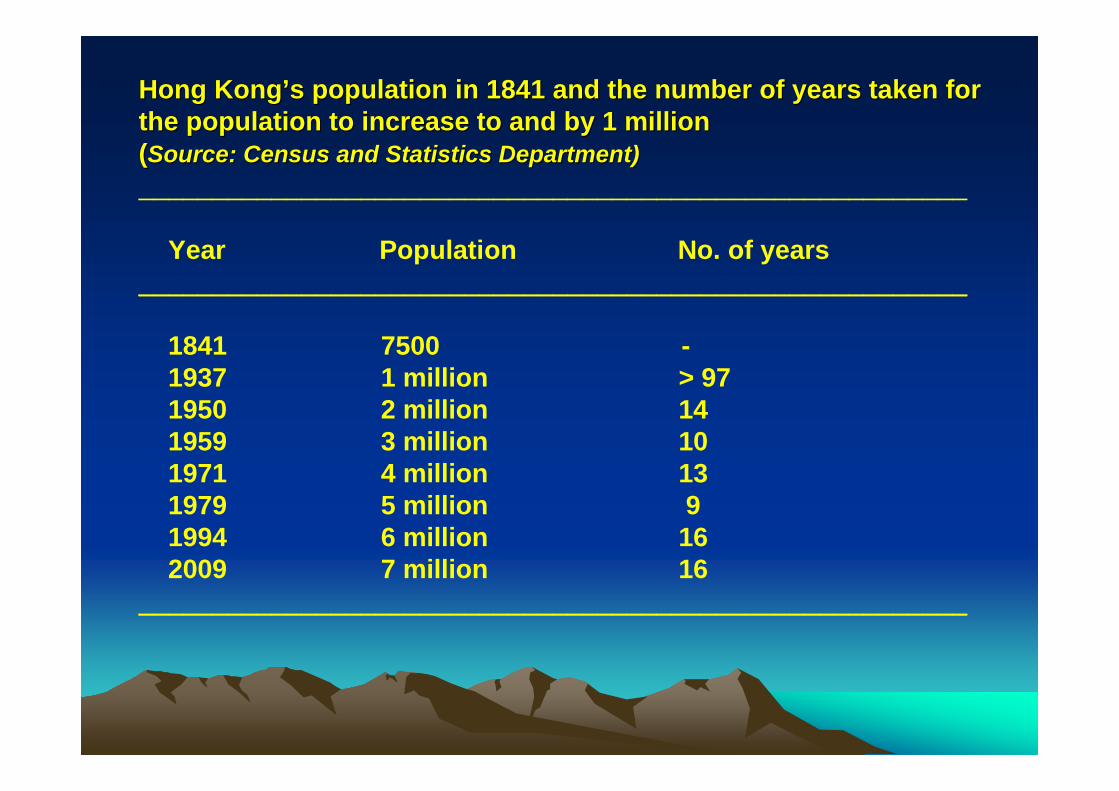
Hong KongHong Kong’’s population in 1841 and the number of years taken for s population in 1841 and the number of years taken for the population to increase to and by 1 millionthe population to increase to and by 1 million((Source: Census and Statistics Department)Source: Census and Statistics Department)________________________________________________________
Year Population No. of years________________________________________________________
1841 7500 -1937 1 million > 971950 2 million 141959 3 million 101971 4 million 131979 5 million 91994 6 million 162009 7 million 16
________________________________________________________

Drilling into the seafloor has led to the discovery of higher temperatures than the present

~0.5 million year record of climate & sea~0.5 million year record of climate & sea--level changelevel changein Hong Kongin Hong Kong_______________________________________________________________
Estimated Marine Dating MaximumUnit Age age isotope method thickness
(ka) age used (m)______________________________________________________________________
M1 Postglacial < 8.2 1 14C 21.5T1 Last glacial 8.2 – 70 2-4 OSL 6.5M2 Last interglacial 90 – 140 5 U series 15.7T2 2nd last glacial 150 – 180 6 - 9.5M3 2nd last interglacial 190 – 240 7 - 12T3 3rd last glacial 250 – 300 8 T-L 7.3M4 3rd last interglacial 310 – 340 9 U series 14.1T4 4th last glacial 350 – 370 10 - 6M5 4th last interglacial 380 – 420 11 U series 3.5T5 5th last glacial > 440 12 - 7
______________________________________________________________________M – marine; T – terrestrial

Agreement with temperature record shown by deuterium in Antarctica ice cores
Annual banding in ice

M1
T1
M2
T2
M3
T3
M4
T4
M5
T5

Site investigation of New Hong Kong AirportSite investigation of New Hong Kong Airport1995
South China Morning Post
Continuous borehole showing a palaeo-desiccated crust in theUpper part of the M2 unit
| M2
M1

Mangrove pollen Mangrove pollen SonneratiaSonneratia sp.sp.Present day northern limit Present day northern limit HainanHainan IslandIsland
Present in the M2 unit of the New Hong Kong Airport site. This indicated the last timepresent day temperature in Hong Kong was exceeded was about 130,000 years agoduring the last interglacial period. The mean annual temperature of ~26oC at the timewas 2-3oC higher than in the present day.
______________1 mm

Hong KongHong Kong’’s temperature records temperature recordat the Hong Kong Stationat the Hong Kong Station
(Source: Hong Kong Observatory)(Source: Hong Kong Observatory)

+
+
_________10 km
Location map of the Hong Kong Station and the Waglan Island Stationof the Hong Kong Observatory
Hong Kong Station
Waglan Station

Comparison between the two stationsComparison between the two stations_______________________________________________________________________
Hong Kong Station Waglan Station_______________________________________________________________________
Record available 1884-2010 1968-2010
Location Urban (~4 million) Rural (few inhabitants)
Ground elevation 32 m 57 m
Urban heat Island (UHI) Known to be strongly Absentaffected (Koo 1988)
Temperature record Temperature record Least positive linear(Leung et al. 2004) shows most positive regression (r=0.127)
linear regression (r=0.79)_______________________________________________________________________
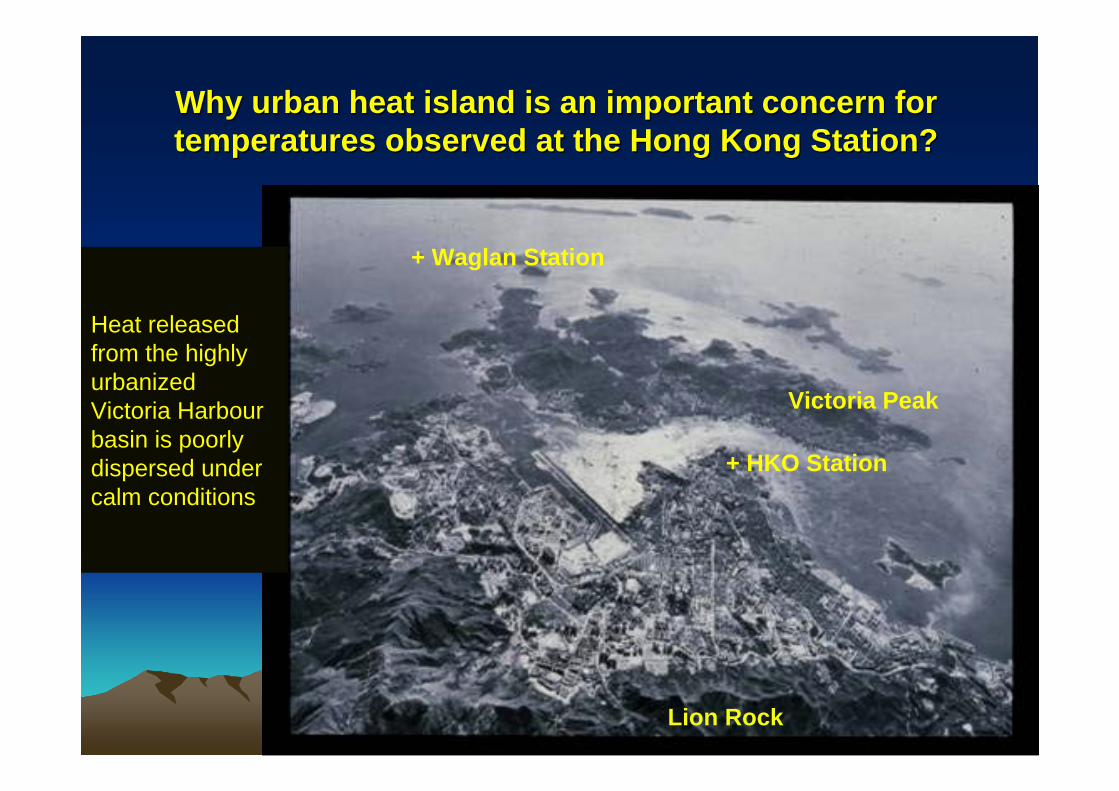
Why urban heat island is an important concern for Why urban heat island is an important concern for temperatures observed at the Hong Kong Station?temperatures observed at the Hong Kong Station?
Heat releasedfrom the highly urbanized Victoria Harbourbasin is poorlydispersed undercalm conditions
+ HKO Station
Victoria Peak
Lion Rock
+ Waglan Station

ComparsionComparsion between the temperature recordbetween the temperature recordof the Hong Kong Station and the Macau Stationof the Hong Kong Station and the Macau Station
(Source: (Source: KooKoo 1988)1988)
5-year running mean temperaturesat Hong Kong Station, Nathan Road (located in a heat trap area becauseof the topography of VictoriaHarbour)
5-year running mean temperaturesat Macau station (hill top location)No obvious temperature rise can beobserved

Source of heatSource of heatfor UHI at the Hong Kong Stationfor UHI at the Hong Kong Station
The obvious source is NOT CO2 which is one of the greenhouse gas but …
Heat generated through the consumption of fossil fuels including power generation, transportation (including by air, land and sea), constructional activities, air conditioning, water pumping, cooking,usage of home applicances, fireworks, etc.

Top 11Top 11th th warmest years in terms of mean annual temperature warmest years in terms of mean annual temperature recorded at the Hong Kong Station since record began in 1884recorded at the Hong Kong Station since record began in 1884
________________________________________________________________
Year Mean temperature (oC) Rank________________________________________________________________
1998 24.0 1st
2002 23.9 2nd
1999 23.8 =3rd
1966 23.8 =3rd
2007 23.7 5th
2003 23.6 =6th
2001 23.6 =6th
1994 23.6 =6th
2009 23.5 =9th
2006 23.5 =9th
1997 23.5 =9th
________________________________________________________________
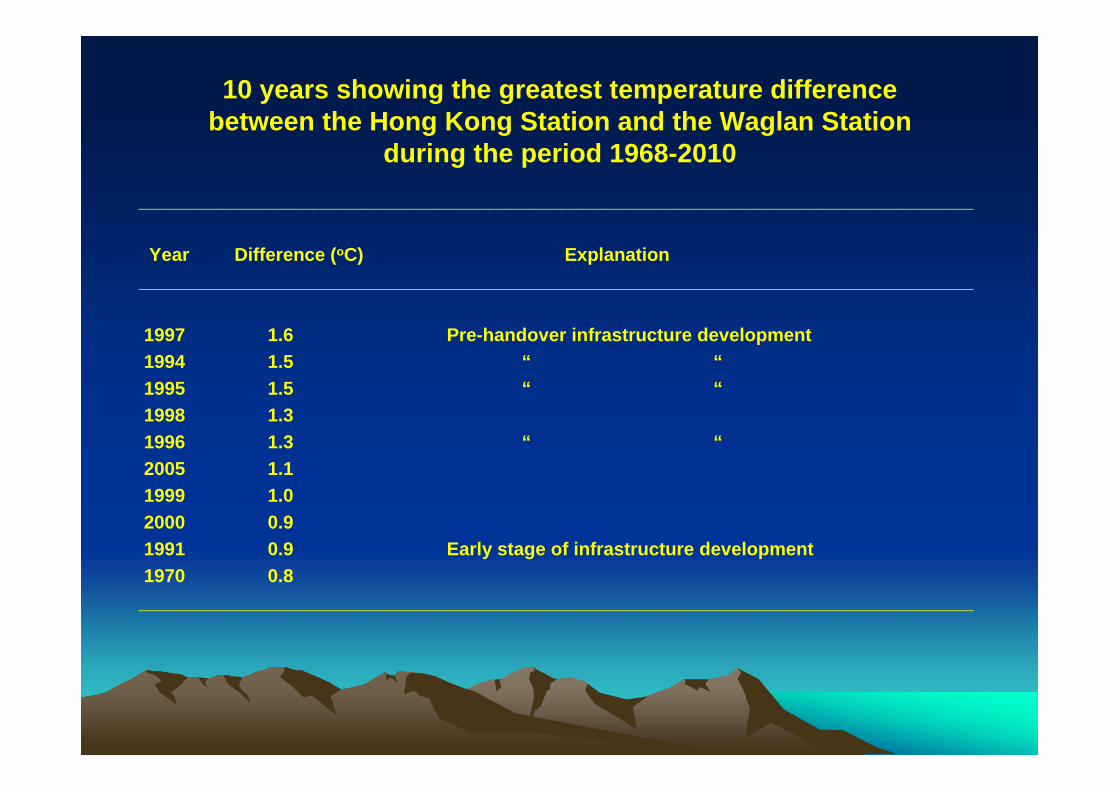
10 years showing the greatest temperature differencebetween the Hong Kong Station and the Waglan Station
during the period 1968-2010_________________________________________________________________________________
Year Difference (oC) Explanation_________________________________________________________________________________
1997 1.6 Pre-handover infrastructure development1994 1.5 “ “1995 1.5 “ “1998 1.31996 1.3 “ “2005 1.11999 1.02000 0.91991 0.9 Early stage of infrastructure development1970 0.8
_________________________________________________________________________________
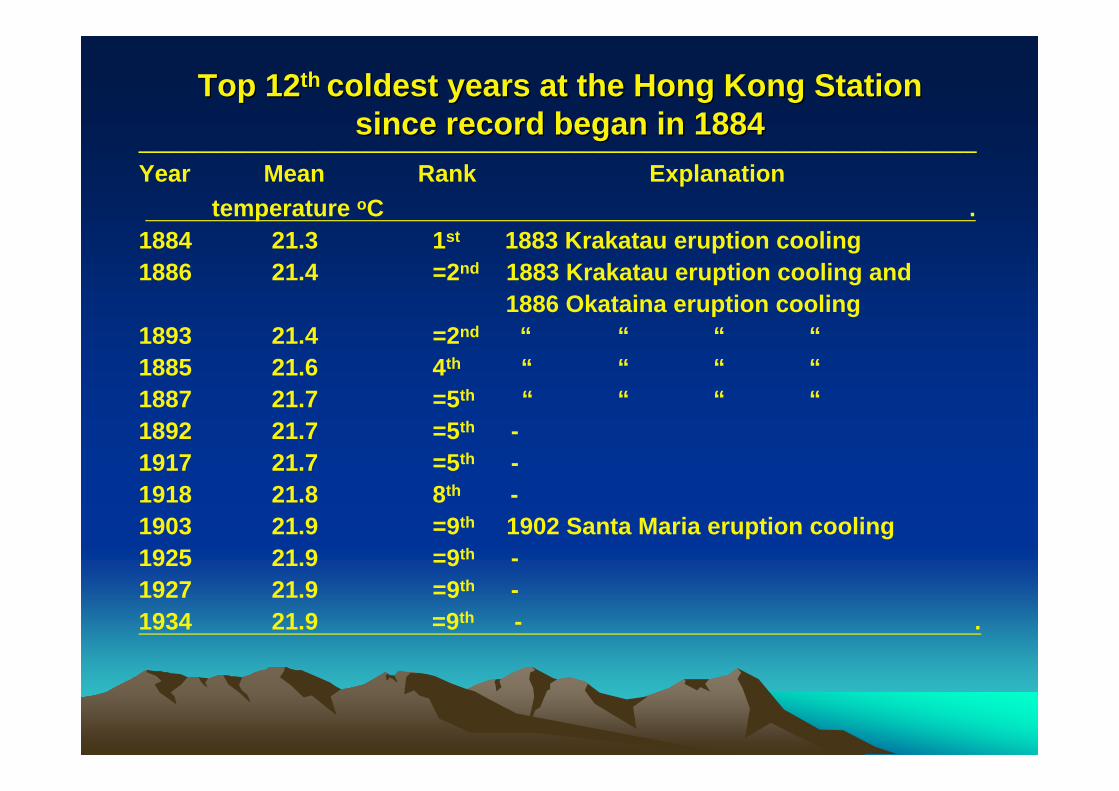
Top 12Top 12th th coldest years at the Hong Kong Stationcoldest years at the Hong Kong Stationsince record began in 1884since record began in 1884______________________________________________________________________
Year Mean Rank Explanationtemperature oC .
1884 21.3 1st 1883 Krakatau eruption cooling1886 21.4 =2nd 1883 Krakatau eruption cooling and
1886 Okataina eruption cooling1893 21.4 =2nd “ “ “ “1885 21.6 4th “ “ “ “1887 21.7 =5th “ “ “ “1892 21.7 =5th -1917 21.7 =5th -1918 21.8 8th -1903 21.9 =9th 1902 Santa Maria eruption cooling1925 21.9 =9th -1927 21.9 =9th -1934 21.9 =9th - .

Selected major volcanic eruptions and coolingSelected major volcanic eruptions and cooling
1883 Krakatau1886 Okataina
1902 Santa Maria
1912 Novarupta
1932 Cerro Azul1933 Kharimkotan
1963 Agung1982 El Chichón
1991 Pinatubo /Cerro Hudson
1956 Bezymianny
↓
↓↓
↓
↓↓↓
↓
↓
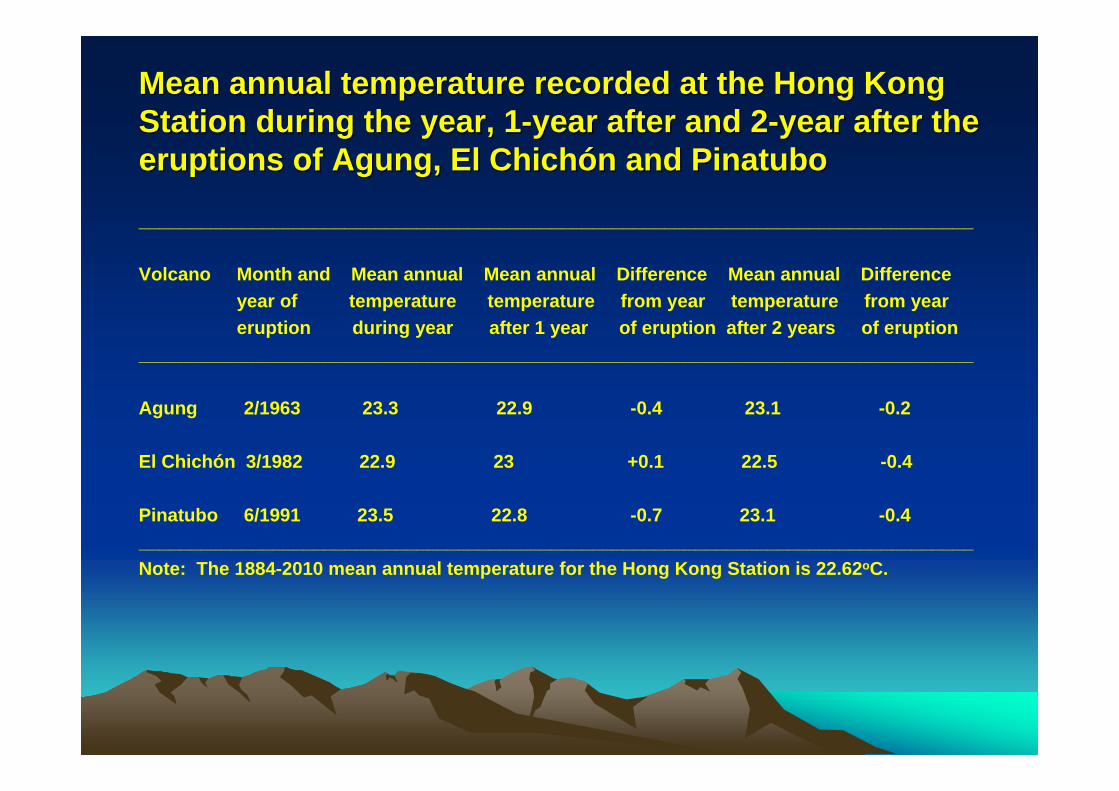
Mean annual temperature recorded at the Hong Kong Mean annual temperature recorded at the Hong Kong Station during the year, 1Station during the year, 1--year after and 2year after and 2--year after the year after the eruptions of eruptions of AgungAgung, El , El ChichChichóónn and Pinatuboand Pinatubo
_________________________________________________________________________________
Volcano Month and Mean annual Mean annual Difference Mean annual Differenceyear of temperature temperature from year temperature from yeareruption during year after 1 year of eruption after 2 years of eruption
_________________________________________________________________________________
Agung 2/1963 23.3 22.9 -0.4 23.1 -0.2
El Chichón 3/1982 22.9 23 +0.1 22.5 -0.4
Pinatubo 6/1991 23.5 22.8 -0.7 23.1 -0.4_________________________________________________________________________________Note: The 1884-2010 mean annual temperature for the Hong Kong Station is 22.62oC.

Estimate of global warming temperature increase after Estimate of global warming temperature increase after correction for UHI based on 1968correction for UHI based on 1968--2010 temperature values2010 temperature values
_______________________________________________________________
HKO Headquarters* Waglan_______________________________________________________________
Mean temperature 23.14oC 22.50oCTemperature difference +0.64oC -0.64oCMaximum temperature 24oC (1998) 23.2oC (2002)Minimum temperature 22.5oC (1976) 21.3oC (1995)Temperature range 1.5oC 1.9oC
Suggested correction - 0.5oC (for UHI)Actual warming 0.14oC (< 25% increase)
____________________________________________________________* Mean annual temperature 1884-2010 is 22.62oC.
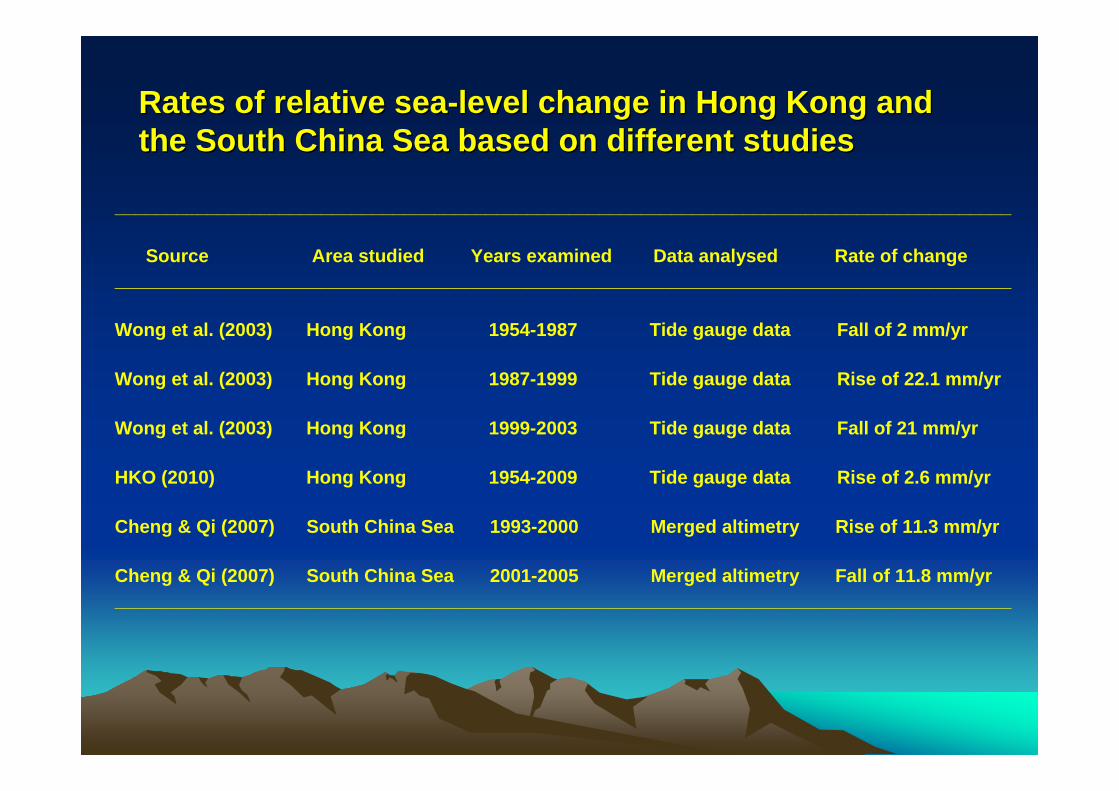
Rates of relative seaRates of relative sea--level change in Hong Kong and level change in Hong Kong and the South China Sea based on different studiesthe South China Sea based on different studies
_______________________________________________________________________________________
Source Area studied Years examined Data analysed Rate of change_______________________________________________________________________________________
Wong et al. (2003) Hong Kong 1954-1987 Tide gauge data Fall of 2 mm/yr
Wong et al. (2003) Hong Kong 1987-1999 Tide gauge data Rise of 22.1 mm/yr
Wong et al. (2003) Hong Kong 1999-2003 Tide gauge data Fall of 21 mm/yr
HKO (2010) Hong Kong 1954-2009 Tide gauge data Rise of 2.6 mm/yr
Cheng & Qi (2007) South China Sea 1993-2000 Merged altimetry Rise of 11.3 mm/yr
Cheng & Qi (2007) South China Sea 2001-2005 Merged altimetry Fall of 11.8 mm/yr_______________________________________________________________________________________

QQuestionuestion::Has UHI data bias been adequately corrected?Has UHI data bias been adequately corrected?
NOAA

Hong Kong’s rainfall record- Located at the margin of the Earth’s largest
continental land mass- Coastal location is sensitive to wind shifts
If wind is predominantly onshore – wetterIf wind is predominantly offshore – drier
- Main sourcesTropical depressions (bulk of heavy rainfall)Tropical cyclones
But what are the causes of the variability observed?

Rainfall record at the Hong Kong Station 1947Rainfall record at the Hong Kong Station 1947--20092009Source: Hong Kong ObservatorySource: Hong Kong Observatory

With timing of With timing of ‘‘majormajor’’ volcanic eruptionsvolcanic eruptionsand nuclear testsand nuclear tests
↓1991 Pinatubo
↓
2008Chaitén↓
1982 El Chichón
↓
1963 Agung
↓
1956Bezymianny
↓
1966Mururoa test
↓
1980St. Helens
↓
1961Russian test

Top 10 wettest years at the Hong Kong Station Top 10 wettest years at the Hong Kong Station and their connection with ENSO and volcanic and their connection with ENSO and volcanic eruptions since record began in 1884eruptions since record began in 1884
_______________________________________________________________________
Year Annual rainfall (mm) % of average Note_______________________________________________________________________
1997* 3343.0 150.0 -1982* 3247.5 145.8 El Chichón, Mexico on March 282005 3214.5 144.3 -1973* 3100.4 139.2 -2001 3091.8 138.8 -2008 3066.2 137.6 Chaitén Chile on May 2 1889 3041.8 139.3 -1975 3028.7 138.7 -1891 2974.5 136.3 -1957 2950.3 135.1 -
_______________________________________________________________________* Strong El Niño year.

Top 10 maximum hourly precipitation in Top 10 maximum hourly precipitation in Hong KongHong Kong
_______________________________________________________________
Date Precipitation (mm) Note_______________________________________________________________
7June 2008 145.5 Chaitén eruption, Chile8 May 1992 109.9 El Niño year12 June 1966 108.2 El Niño year2 May 1989 104.8 -19 July 1926 100.7 -13 June 1968 100.0 -18 June 1972 98.7 El Niño year30 April 1975 92.4 -15 July 1986 88.4 -30 May 1889 86.4 -_______________________________________________________________

What we now know were caused by volcanic eruptionsWhat we now know were caused by volcanic eruptions1963 worst drought year on record 1991 10th driest year on record
1982 2nd wettest year on record June 7, 2008 rainstorm
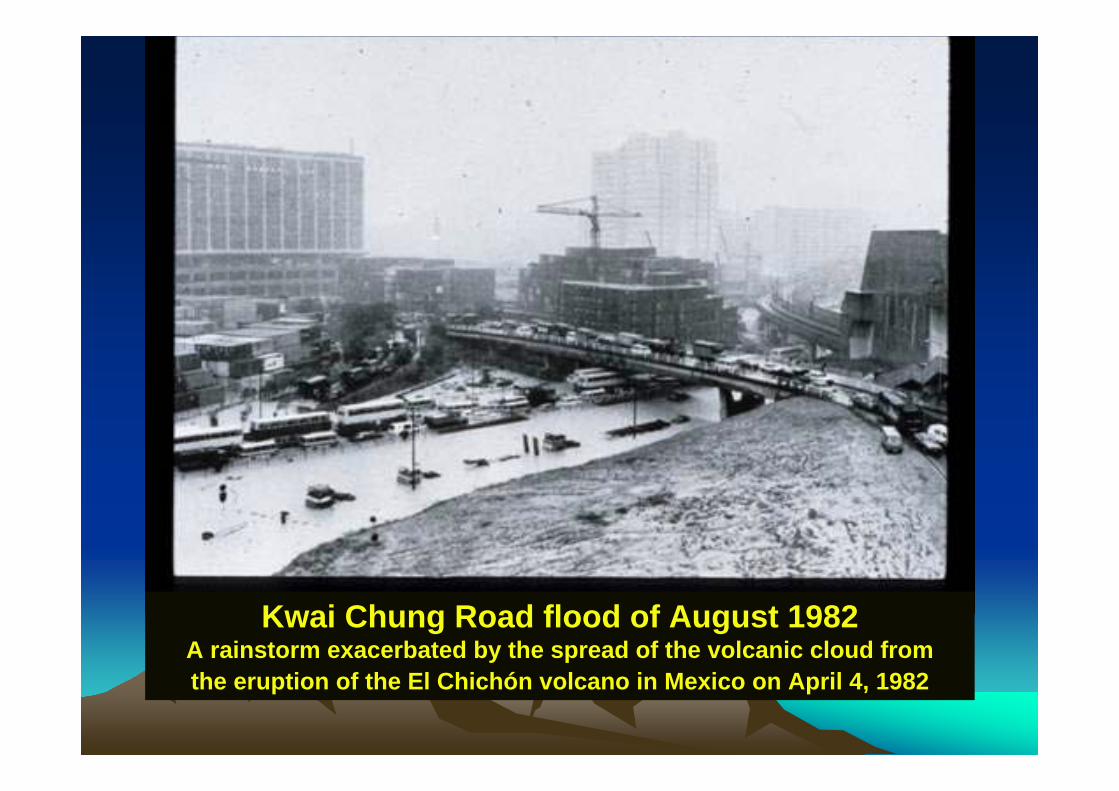
Kwai Chung Road flood of August 1982A rainstorm exacerbated by the spread of the volcanic cloud fromthe eruption of the El Chichón volcano in Mexico on April 4, 1982
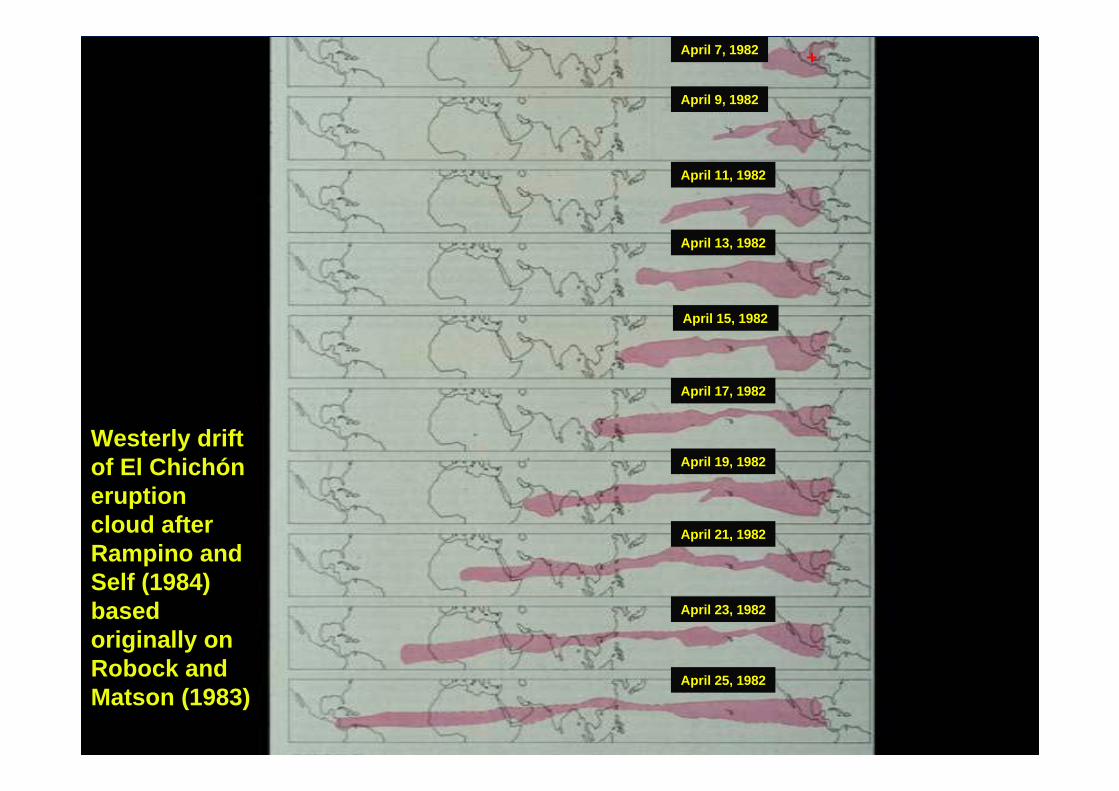
Westerly driftof El Chichóneruptioncloud after Rampino and Self (1984)basedoriginally onRobock andMatson (1983)
April 9, 1982
April 11, 1982
April 13, 1982
April 15, 1982
April 17, 1982
April 19, 1982
April 21, 1982
April 23, 1982
April 25, 1982
April 7, 1982 +

Monthly rainfall at the Hong Kong Station in 1982Monthly rainfall at the Hong Kong Station in 1982____________________________________
Month Rainfall (mm)____________________________________
January 16.0February 23.1March 30.6April 310.0May 767.4June 205.9July 296.2August 872.0September 466.8October 163.7November 95.8December trace____________________________________
Total 3247.5 mmAnnual average 2225 mm146% above average
Normal for April 139.4 mm- 222% above normal- 7th wettest on record- relative humidity 5th lowest on record
Normal for May 298.1 mm- 257% above normal- 4th wettest on record- worst landslides since 1976
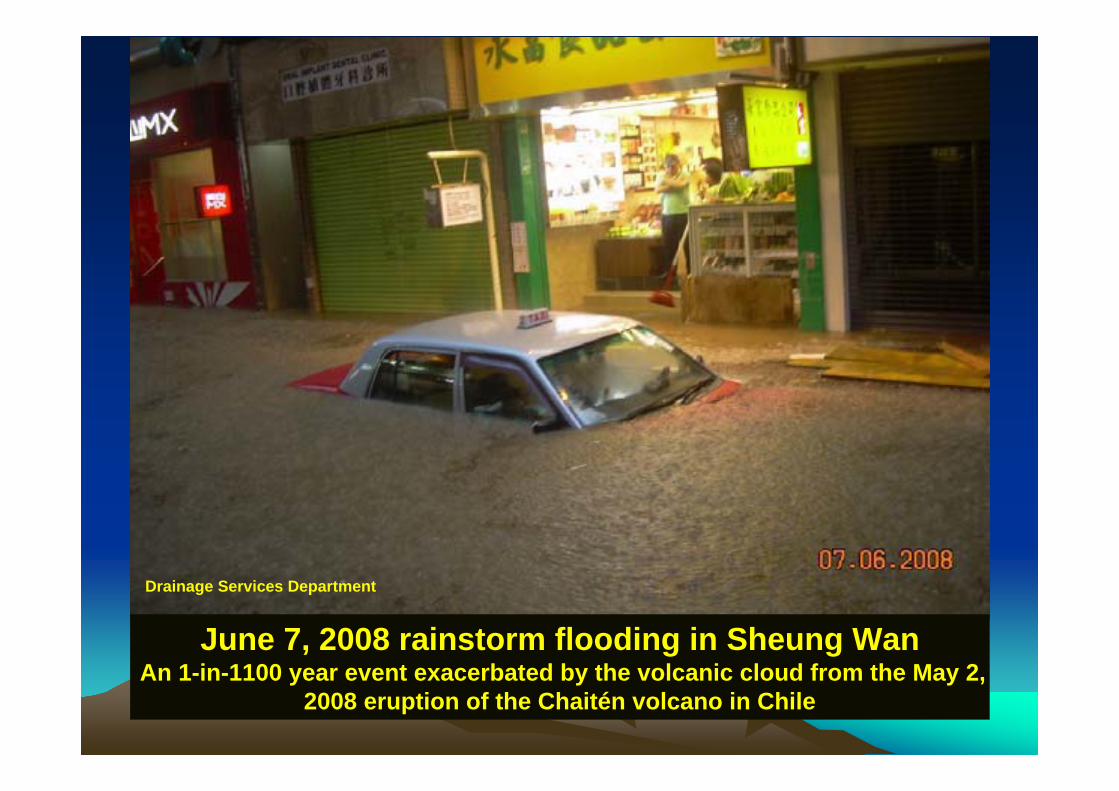
June 7, 2008 rainstorm flooding in Sheung Wan An 1-in-1100 year event exacerbated by the volcanic cloud from the May 2,
2008 eruption of the Chaitén volcano in Chile
Drainage Services Department

May 2, 2008 May 2, 2008 ChaitenChaiten eruption, Chile VEI = 4eruption, Chile VEI = 4
AtlanticOcean
PacificOcean
Modis NASA
Argentina

Selected impacts on regional Selected impacts on regional rainfall following eruptionrainfall following eruption
- A wet May/June in South Africa- A wet June in Australia (LIDAR picks up
ash as far as southeastern Australia)- Wettest June in Hong Kong since record
began in 1884 (1346.1 mm or 346.8% above average including an 1-1100 year rainstorm)

Some of the ~ 2400 landslides onLantau Island caused by the 1-in-1,100 year
June 7, 2008 rainstorm

Top 10 driest years at the Hong Kong Station Top 10 driest years at the Hong Kong Station since 1884 and their possible connection with since 1884 and their possible connection with
volcanic eruptions and nuclear testingvolcanic eruptions and nuclear testing_______________________________________________________________________
Year Precipitation (mm) % of average Notes_______________________________________________________________________
1963 901.1 40.4 Agung eruption, Indonesia1895 1164.2 52.3 -1954 1367.0 61.4 -1938 1405.8 63.1 -1901 1418.8 63.7 -1898 1447.7 65.0 -1967 1570.6 70.5 Year after Mururoa nuclear test1933 1585.2 71.1 Kharimkotan eruption, Russia1912 1625.2 72.9 Navarupta eruption, Alaska, USA1991 1639.1 73.6 Pinatubo eruption, Philippines
_______________________________________________________________________
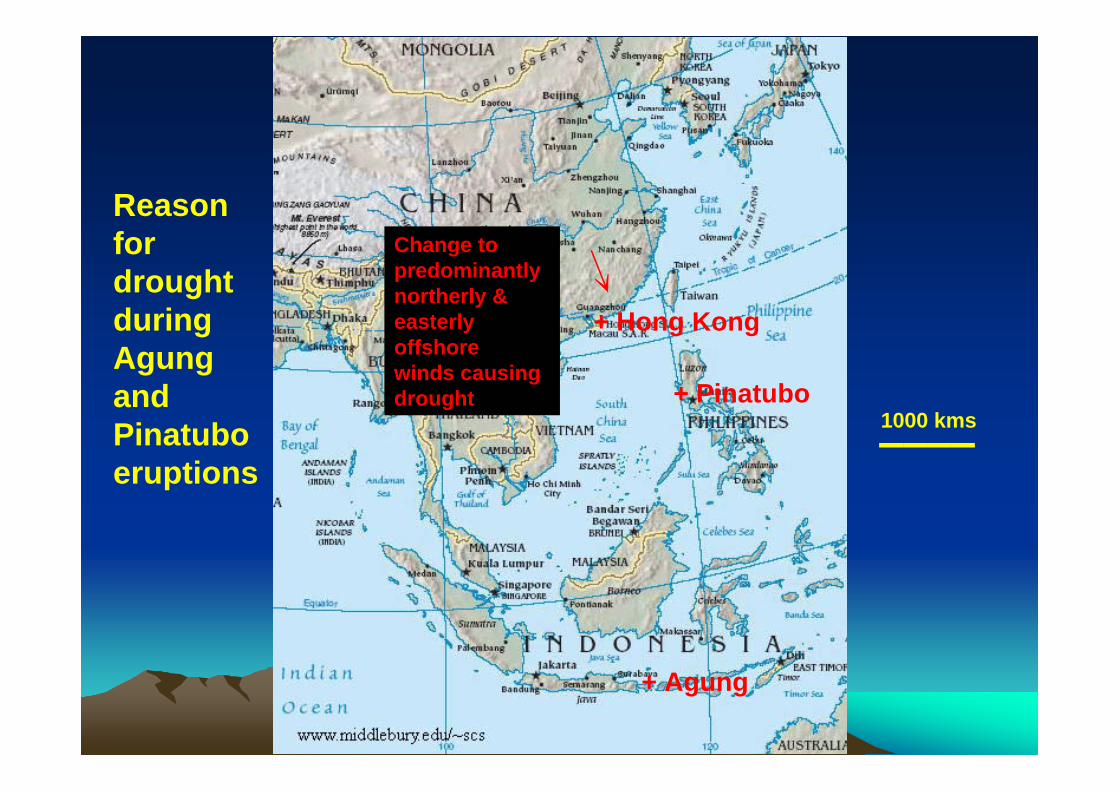
+ Pinatubo
+ Agung
+ Hong Kong↓
Change topredominantlynortherly & easterlyoffshorewinds causing drought
ReasonfordroughtduringAgungandPinatuboeruptions
▬▬▬▬1000 kms

Nuclear testing and drought yearsNuclear testing and drought years
Two examples:
1962 Rainfall at Hong Kong Station 1741.0 mm (78.1 % of average)1963 Rainfall at Hong Kong Station 901.1 mm (40.4 % of average)Nuclear test –31/10/1961 Russia explodes the world’s largest nuclear bomb
1967 Rainfall at Hong Kong Station 1570.6 mm (70.5 % of average)Nuclear test –24/9/1966 France explodes atomic bomb at Mururoa Atoll

Possible implications for environmental sustainability
Good news –Rate of warming is slower than IPCC/HKOCO2 is not as bad as claimedIn terms of fossil fuels coal has the greatest reserves by far
Bad news –Ice is melting because heat is generated through human activitiesNatural variability (including volcanic eruptions) is a problemAbnormally dry and wet years are bad for food productionUnderestimated the role of water vapour as a greenhouse gas (saturated
greenhouse gas hypothesis of Ferenc Miskolczi)‘Water pollution’ through human impact on the natural water cycle is a
problemElectricity will become more expensive because HK is phasing out coal
for power generationUHI is a contributor to the local air pollution problem
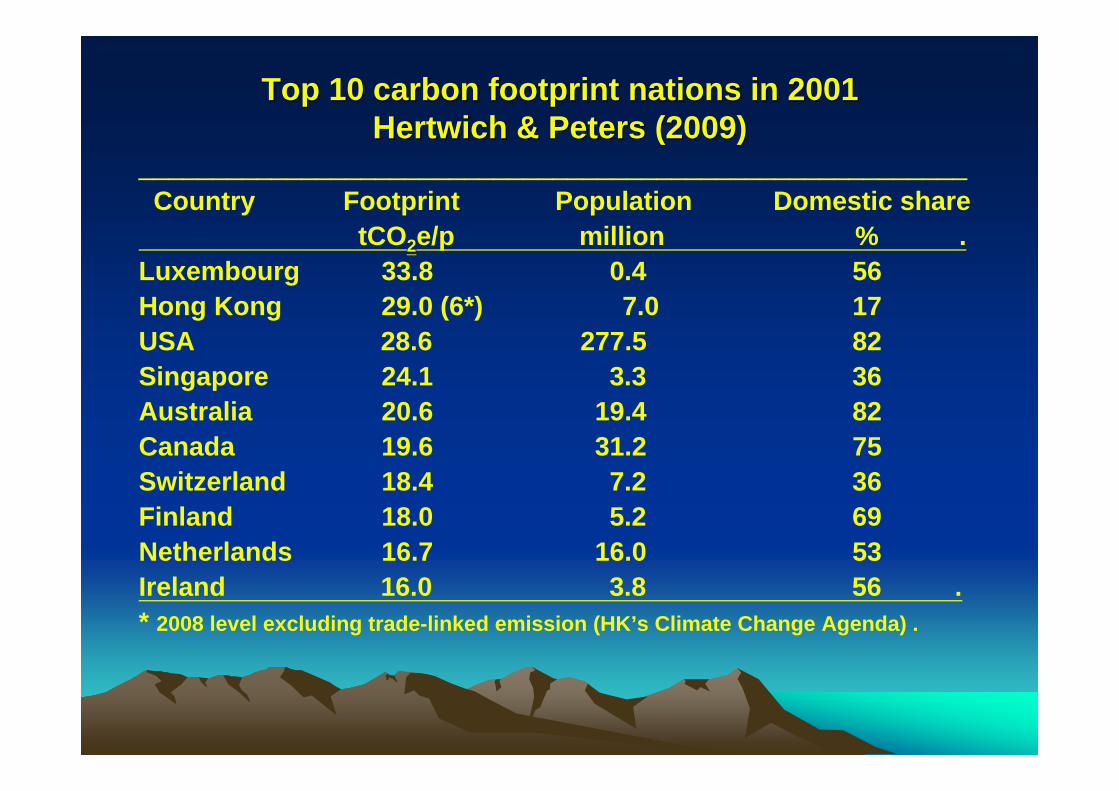
Top 10 carbon footprint nations in 2001Top 10 carbon footprint nations in 2001HertwichHertwich & Peters (2009)& Peters (2009)
________________________________________________________Country Footprint Population Domestic share
tCO2e/p million % .Luxembourg 33.8 0.4 56Hong Kong 29.0 (6*) 7.0 17USA 28.6 277.5 82Singapore 24.1 3.3 36Australia 20.6 19.4 82Canada 19.6 31.2 75Switzerland 18.4 7.2 36Finland 18.0 5.2 69Netherlands 16.7 16.0 53Ireland 16.0 3.8 56 .* 2008 level excluding trade-linked emission (HK’s Climate Change Agenda) .

Can we learn from Singapore?Can we learn from Singapore?2010 HSBC Economy and Climate Change survey of 15 2010 HSBC Economy and Climate Change survey of 15
countries based on at least 1000 consumers/countrycountries based on at least 1000 consumers/country((www.channelnewsasia.comwww.channelnewsasia.com))
- 12% climate change is top concern (4th lowest after France, UK and USA)
- 28% stability of global economy is the top concern- 22% terrorism is the top concern- 67% more spending on healthcare compared to
global average of 56%- 53% more spending on boosting economy compared
to global average of 38%

Some observed temperature and rainfall Some observed temperature and rainfall changes in Hong Kongchanges in Hong Kong
(source: Hong Kong Observatory)(source: Hong Kong Observatory)Annual mean temperature ↑ 0.12oC per decade; 1.44oC (1885-
2009)
Mean diurnal range ↓ 0.24oC per decade (1947-2009)
Mean sea level (Victoria Harbour) ↑ 26 mm per decade(1954-2009)
Annual rainfall ↑ 51 mm per decade (1947-2009)
Heavy rain days (> 30 mm per hour) ↑ 0.4 days per decade(1947-2009)
Overestimated due to UHI
Shows UHI is important
Combined effects of natural & human causes
Implications uncertain

Temperature ConclusionsTemperature Conclusions(1) The Hong Kong Station is unsuitable for indicating long-
term temperature trends unless it is adequately corrected for UHI.
(2) Heat produced by human activity should be blamed as the cause of warming rather than CO2.
(3) Volcanic eruptions, a natural cause of temperature variability, have been shown to cause cooling.
(4) At least 75% of the temperature rise seen in the record of the Hong Kong Station since 1884 may be attributed to UHI while no more than 25 % may be attributed to global warming.
(5) Engineering construction through ‘large’ scale infrastructure development was the probable cause for the sharp temperature increase at the Hong Kong Station during the 1990s.

Rainfall ConclusionsRainfall Conclusions(1) ‘Major’ volcanic eruptions may be the cause of both
abnormally dry and wet years.(2) Major volcanic eruptions may also be the cause for
exacerbating individual rainstorms, contributing to record monthly rainfall and record annual rainfall associated with severe flooding and landslides .
(3) Human impact through nuclear testing is another possible cause for abnormally dry years.
(4) Plume systems through both natural and human induced causes including volcanic eruptions, nuclear explosions, bushfires, power plants, UHI of cities, etc. should be investigated their role in the saturated greenhouse gas hypothesis.
(5) Rainfall may be heavier through UHI and the air-borne pollutants produced through human activity.

General ConclusionsGeneral Conclusions(1) Variability in the hydrological cycle through natural
means (volcanic eruptions) and human impact (water pollution) is a much underestimated cause of climate change.
(2) Reducing CO2 level only is an ineffective means of slowing down climate change/global warming.
(3) Overpopulation is a problem.(4) The rapid development of infrastructures immediately
before the handover of Hong Kong was an important contributor to warming during the 1990s.
(5) Water vapour in the atmosphere is probably rising in tune with temperature changes.
(6) Climatic models should be treated with caution because they cannot predict decadal variability.
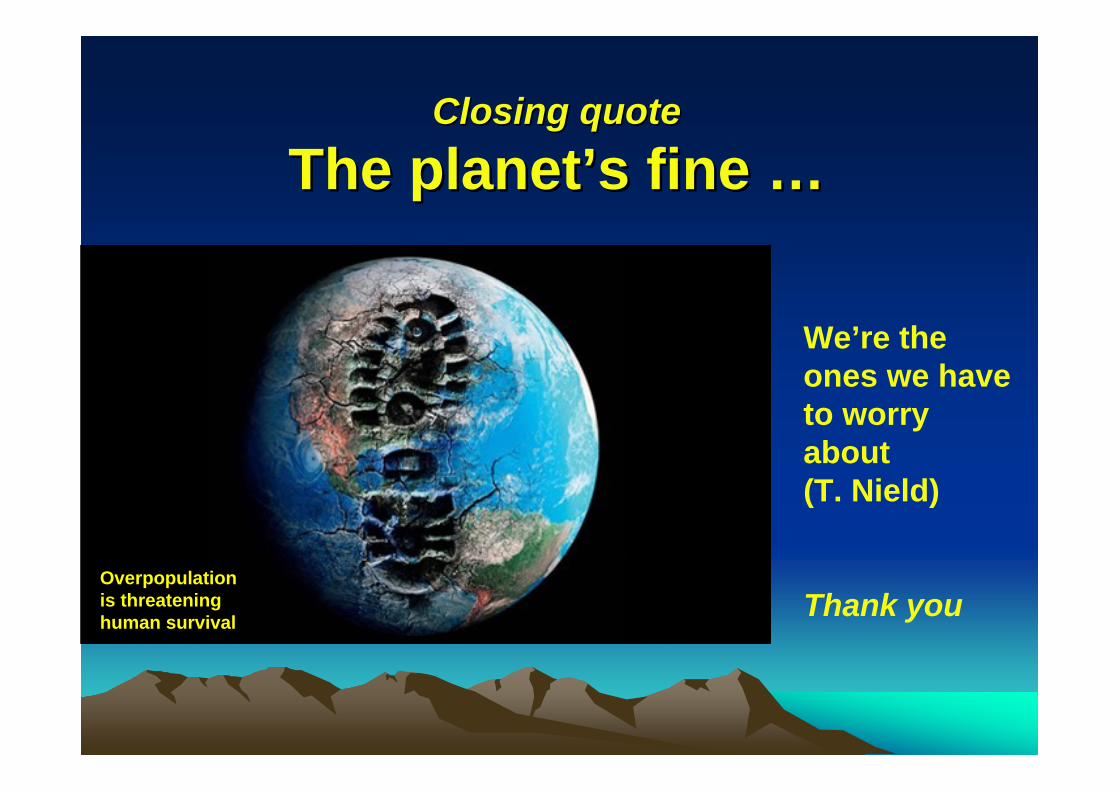
Closing quoteClosing quote
The planetThe planet’’s fine s fine ……
We’re theones we haveto worryabout(T. Nield)
Thank youOverpopulationis threateninghuman survival