Embed Size (px)
Citation preview

Project EASME/COSME/2014/014
An analysis of drivers, barriers and readiness
factors of EU companies for adopting advanced
manufacturing products and technologies
Deliverable 3 (based on Work Package 2):
Drivers and Barriers of EU Companies for
adopting Advanced Manufacturing Technologies
Submitted by IDEA Consult, Brussels, Belgium and
VTT, Helsinki, Finland
Technical Proposal
Finale Fassun

2
Submitted to
European Commission
Executive Agency for Small and Medium-sized Enterprises (EASME)
Unit A.1.5 - COSME, Competitiveness
COV2 11/129, B-1049 Brussels/Belgium
Submitted on
27th September 2016
Authors:
Els Van de Velde,
Magnus Simons,
Annelies Wastyn,
Mika Naumanen,
Henning Kroll
Main contact persons for this deliverable
Els Van de Velde
Competitiveness and innovation
IDEA Consult
Kunstlaan – Avenue des Arts 1-2, b 16
B-1210 Brussels, Belgium
Phone: +32 2 282 17 10
Fax: +32 2 282 17 15
Magnus Simons
Business Ecosystem Development
VTT Technical Research Centre of Finland
Vuorimiehentie 3
P.O. Box 1000
FI-02044 VTT, Finland
Phone +358 40 543 85 86

3
Overall project manager
Henning Kroll
Competence Centre Policy – Industry – Innovation
Fraunhofer Institute for Systems and Innovation Research ISI
Breslauer Strasse 48
D - 76139 Karlsruhe, Germany
Phone +49 721 6809-181
Fax +49 721 6809-176
4
Contents
Executive summary ............................................................................................................. 10
1 Introduction ................................................................................................................. 13
1.1 Analysis of main drivers and barriers for the uptake of advanced
manufacturing by EU industry (WP2) ............................................................. 13
1.2 Methodology ................................................................................................... 14
2 Qualitative analysis ...................................................................................................... 15
2.1 Methodology ................................................................................................... 15
2.2 Analysis of the case studies............................................................................. 18
2.2.1 Description of case companies ....................................................................... 21
2.2.2 Case material for analysis ............................................................................... 24
2.3 Results of the qualitative analysis ................................................................... 26
2.3.1 Main drivers and barriers to AMT in Europe .................................................. 26
2.3.2 Evaluating the importance of drivers and barriers ......................................... 28
2.3.3 Summary of qualitative analysis of AMT investment decisions ...................... 31
2.3.4 Size, region, value chain position and technology .......................................... 37
2.4 Conclusion from the qualitative analysis ........................................................ 38
3 Quantitative analysis ................................................................................................... 39
3.1 Introduction .................................................................................................... 39
3.2 Methodology ................................................................................................... 39
3.2.1 Direct approach ............................................................................................... 39
3.2.2 Indirect approach ............................................................................................ 40
3.3 Basic description of dataset ............................................................................ 41
3.3.1 Company profile .............................................................................................. 42
3.3.2 AMT profile ..................................................................................................... 49
3.4 Drivers to invest in AMT .................................................................................. 57
3.4.1 General findings .............................................................................................. 57
3.4.2 Specific findings ............................................................................................... 60
3.5 Barriers to the adoption of AMT ..................................................................... 64
3.5.1 General findings .............................................................................................. 64
3.5.2 Specific findings ............................................................................................... 69
3.6 Capacity to overcome barriers related to the adoption of AMT .................... 75

5
3.6.1 General findings .............................................................................................. 75
3.6.2 Specific findings ............................................................................................... 77
3.7 Conclusion from the quantitative analysis ...................................................... 81
4 First insights on policy recommendations ..................................................................... 83
4.1 General findings .............................................................................................. 83
4.2 Specific findings ............................................................................................... 86
4.2.1 Technology/AMT specific findings .................................................................. 86
4.2.2 Findings related to location ............................................................................ 87
4.2.3 Findings related to company size .................................................................... 88
4.2.4 Findings related to company performance ..................................................... 89
5 Overall conclusion from the quantitative and qualitative analyses ................................... 90
6 Next steps .................................................................................................................... 92
7 Annexes ....................................................................................................................... 95
7.1 ANNEX A: Case company descriptions ............................................................ 96
7.2 ANNEX B: Main drivers and barriers identified in the case studies .............. 118
7.3 ANNEX C: Case company comments on EU policy ........................................ 126
7.4 ANNEX D: Questionnaire used for the case studies ...................................... 132
7.5 ANNEX E: Online questionnaire for AMT users and producers .................... 137

6
Figures
Figure 1: Framework for WP2 ................................................................................................ 13
Figure 2: Focus of the report as part of WP2 ......................................................................... 14
Figure 3: Main pillars of the semi-structured interview guidelines ....................................... 16
Figure 4: Company size .......................................................................................................... 42
Figure 5: Company sector ...................................................................................................... 43
Figure 6: Location of headquarters, ....................................................................................... 43
Figure 7: Coverage of manufacturing operations .................................................................. 44
Figure 8: Coverage of market activities ................................................................................. 46
Figure 9: Users or producers of AMT ..................................................................................... 48
Figure 10: Percentage of sales produced using AMT (user and producer perspective) ......... 48
Figure 11: Distribution of relevance of AMT ........................................................................... 50
Figure 12: Relevance of specific high performance manufacturing technologies (in %) ........ 52
Figure 13: Relevance of ICT-enabled technologies (in %) ....................................................... 53
Figure 14: Relevance of Sustainable Manufacturing Technologies (in %) .............................. 54
Figure 15: Drivers to invest in AMT (user perspective) .......................................................... 57
Figure 16: Drivers to invest in AMT (producer perspective regarding users) ......................... 58
Figure 17: Drivers to invest in AMT (producer perspective) ................................................... 59
Figure 18: Drivers by company type (user perspective) ......................................................... 63
Figure 19: Barriers to the adoption of AMT (user perspective) .............................................. 66
Figure 20: Barriers to the adoption of AMT (producer perspective on users) ........................ 67
Figure 21: Barriers to supply of AMT (producer perspective) ................................................. 69
Figure 22: Differences in barriers by company type (user perspective) .................................. 73
Figure 23: Average readiness by AMT (user perspective) ....................................................... 75
Figure 24: Average readiness by AMT (producer perspective regarding users)...................... 75
Figure 25: Distribution of readiness by AMT (user perspective) ............................................. 76
Figure 26: Average readiness by AMT (producer perspective) ............................................... 76
Figure 27: Average readiness by company type (user perspective) ........................................ 79
Figure 28: Average policy measures (user perspective) .......................................................... 83
Figure 29: Distribution policy measures (user perspective) .................................................... 84
Figure 30: Average policy measures (producer perspective regarding users) ........................ 85

7
Tables
Table 1: Distribution of the case studies .............................................................................. 17
Table 2: Predefined groups of drivers/barriers .................................................................... 18
Table 3: AMT use and interests in case study companies .................................................... 20
Table 4: Importance of drivers ............................................................................................. 30
Table 5: Importance of barriers ............................................................................................ 30
Table 6: Location of headquarters versus company size ...................................................... 44
Table 7: Coverage of manufacturing operations over company size ................................... 45
Table 8: Coverage of manufacturing activities over various sectors .................................... 45
Table 9: Coverage of manufacturing activities over various locations ................................. 46
Table 10: Coverage of market activities over company size .................................................. 47
Table 11: Coverage of manufacturing and market activities ................................................. 47
Table 12. Percentage of sales produced using AMT by company size (user perspective) ..... 49
Table 13: Overview of the (high versus low) relevance of AMT ............................................. 50
Table 14: Overview of the high relevance of AMT ................................................................. 51
Table 15: Average relevance of AMT by user/producer......................................................... 55
Table 16: Average relevance of AMT by company size .......................................................... 55
Table 17: Average relevance of AMT by sector ...................................................................... 56
Table 18: Average relevance of AMT by location headquarters ............................................ 56
Table 19: Drivers to invest in AMT: users versus producers perspective ............................... 59
Table 20: Drivers by type of AMT (user perspective) ............................................................. 60
Table 21: Drivers by location (user perspective) .................................................................... 61
Table 22: Drivers by company size (user perspective) ........................................................... 62
Table 23: Drivers by performance (user perspective) ............................................................ 64
Table 24: Differences in barriers: users’ own and producers’ perspective on them ............. 68
Table 25: Differences in barriers by AMT (user perspective) ................................................. 70
Table 26: Differences in barriers by location (user perspective) ............................................ 71
Table 27: Differences in barriers by company size (user perspective) ................................... 72
Table 28: Differences in barriers by performance (user perspective) .................................... 74
Table 29: Average readiness by AMT (user perspective) ....................................................... 77
Table 30: Average readiness by location (user perspective) .................................................. 78

8
Table 31: Average readiness by company size (user perspective) ......................................... 79
Table 32: Average readiness by performance (user perspective) .......................................... 80
Table 33: Difference in policy measures: user versus producer perspective ......................... 85
Table 34: Average policy measures by AMT (user perspective) ............................................. 86
Table 35: Average of policy measures by location (user perspective) ................................... 87
Table 36: Average of policy measures by company size (user perspective) .......................... 88
Table 37: Average of policy measures by company (user perspective) ................................. 89
Table 38: Case company descriptions .................................................................................... 96
Table 39: Drivers and barriers related to financial situation ................................................ 118
Table 40: Drivers and barriers related to demand situation ................................................ 119
Table 41: Drivers and barriers related to competitive situation .......................................... 120
Table 42: Drivers and barriers related to know-how, competence and skills ...................... 121
Table 43: Drivers and barriers related to process performance .......................................... 122
Table 44: Drivers and barriers related to customer requirements ...................................... 123
Table 45: Drivers and barriers related to legislative, regulation, political situation ............ 124
Table 46: Drivers and barriers related to sustainability ....................................................... 125
Table 47: Relevance of AMT ................................................................................................. 133

9
Main acronyms used in the report
3D Three Dimensional
ACTPHAST Access Centre for Photonics Innovation Solutions and Technology Support
AMT Advanced Manufacturing Technologies
B2B Business-To-Business
CAD Computer-Aided Design
CAM Computer-Aided Manufacturing
CECIMO European Association of the Machine Tool Industries
CEO Chief Executive Officer
CNC Computer Numeric Control
COSME Competitiveness of Small and Medium-sized Enterprises
DIY Do It Yourself
EEN Enterprise Europe Network
EFFRA European Factories of the Future Research Association
EU European Union
Fab Lab Fabrication Laboratory
GPRS General Packet Radio Service
HR Human Resources
ICT Information and Communication Technology
IP Intellectual Property
KET Key Enabling Technology
LED Light-Emitting Diode
NACE Nomenclature statistique des Activités économiques dans la Communauté Européenne
OEM Original Equipment Manufacturer
PBS Progression-Based System
PCB Printed Circuit Board
PLC Product Life Cycle
PLM Product Life Cycle Management
R&D Research and Development
RoHS Restriction of Hazardous Substances Directive
SAP Systemanalyse und Programmentwicklung
SBIR Small Business Innovation Research Programme (US)
SBRI Small Business Research Initiative (UK)
Sirris Collective centre for innovation in the technological industry
SME Small and Medium-sized Enterprise
TRL Technology Readiness Level
VAT Value Added Tax
VR Virtual Reality

10
Executive summary
The adoption of advanced manufacturing technologies (AMT) by companies is seen as a prerequisite
for the modernisation of the European industry. The adoption of AMT allows for an increase in ener-
gy efficiency as well as productivity. Both are pivotal factors in achieving long-term competitiveness
in the market and preserving the natural environment for subsequent generations. Although the
European economy benefits from having world-class manufacturing and research capacities, it strug-
gles to bridge the gap between technological innovation and market commercialisation – a phenom-
enon which is often referred to as the valley of death. Moreover, low demand on the European mar-
ket hinders the deployment of AMT by the European industry. In order to understand the factors
affecting the uptake of advanced manufacturing by the European industry, representative case stud-
ies were explored and an online questionnaire was launched.
Several insights emerged from the qualitative analysis. Firstly, several drivers and barriers that
emerged from the literature study, such as general arguments on the investment climate for AMT in
Europe, were confirmed. Secondly, the analysis provided detailed information on how drivers and
barriers relate to the demand situation, the financial situation, know-how, and competence and skills
affect decision-making in various situations. Thirdly, additional drivers and barriers with regard to
specific technologies, company size, geographic area and value chain position were identified. Hence,
the qualitative analysis provided important information on what was new compared to state of the
art and as such provided input for the quantitative analysis.
Additional insights emerged from the quantitative analysis. Hereby the most important drivers for
users to invest in AMT were financially driven and human capital related. Additionally, the main bar-
riers for users to adopt AMT were the high cost of investment in AMT and the lack of financial re-
sources, while the main barriers for producers were related to marketing difficulties. Users did not
master the capacity to overcome various barriers to the adoption of AMT, whereas producers felt
well prepared to overcome them. Internal drivers to invest in AMT were more frequently mentioned
than external drivers, indicating that there was a positive motivation through observed benefits of
advanced manufacturing as a business model, rather than a passive adaptation to external market
developments. Considering the three types of AMT, it seemed that investment in ICT-enabled and
sustainable manufacturing technologies faced more barriers than investment in high performance
manufacturing technologies. Within the three types, no single technology was considered as very
important, but rather a group of technologies was perceived as such. This points towards the multi-
disciplinary character of industrial applications and hence the need for the integration of various
KETs. The analysis also reflected the various stages of market development among Member States.
For example, while Western European companies saw AMT as a suitable means to access new mar-
kets and differentiate themselves from competitors, this effect was less pronounced in Central,
Northern and Eastern Europe.
11
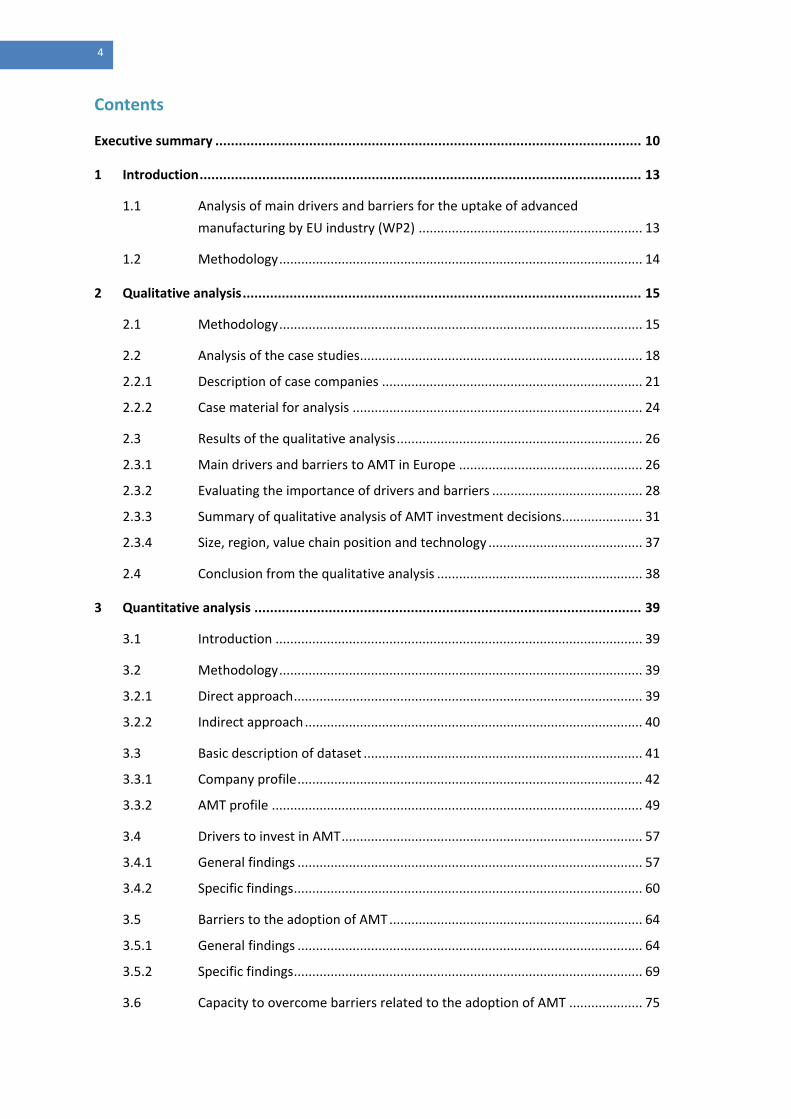
The main drivers and barriers to invest in AMT are:
By distinguishing between three main types of AMT (high performance manufacturing technologies,
ICT-enabled technologies and sustainable manufacturing technologies), few differences in drivers for
users to invest in AMT were identified. The drivers “reduce the consumption of energy and materi-
als” and “tackle environmental requirements/certification” were significantly more important for
users active in ICT-enabled technologies and sustainable manufacturing technologies. With regard to
barriers, respondents active in ICT-enabled technologies and sustainable manufacturing technologies
faced more barriers as compared to respondents active in high performance manufacturing technol-
ogies.
Certain regions showed a difference in the main objectives to invest in AMT. For example, for 90% of
respondents located in Western Europe, the ability to approach new markets by investing in AMT
was an important driver. By contrast, only 46% of respondents located in Central Europe identified
this as an important driver. In Western and Southern Europe, being able to stand out from competi-
tors was an important driver for investment in AMT, while in Central, Northern and Eastern Europe,
this was only the case for about 60% of the respondents. Regions also tended to differ in the barriers
they face to adopting AMT. For example, the impossibility of integrating AMT into customers’ current
processes (i.e. due to standard/process incompatibility) was judged to be an important barrier in
Southern Europe while it was of less importance in Central and Northern Europe. Market uncertainty
and turbulence was of high importance fin Western Europe while it was of medium importance to
Northern European respondents.

12
The means to overcome barriers to the adoption of AMT from a user perspective are:
Producers felt well prepared for overcoming the challenges related to understanding the technologi-
cal opportunities resulting from the application of AMT and generally understanding the technologi-
cal dynamics in the field. They were less well prepared for accessing relevant intermediary organisa-
tions of users like associations and for accessing additional markets. SMEs were less ready to over-
come barriers to the adoption of AMT. Especially with regard to the access to pilot facilities and de-
monstrators to test the potential of AMT, SMEs evaluated their capacity for overcoming this barrier
as being significantly lower than that of large companies.
The readiness to overcome certain barriers differed slightly amongst the three main types of AMT
(high performance manufacturing technologies, ICT-enabled technologies and sustainable manufac-
turing technologies). In particular, for respondents active in ICT-enabled technologies and sustainable
manufacturing technologies, overcoming the barrier to cooperation with users and develop-
ers/providers of AMT seemed more difficult.
Northern European respondents seemed to be better at overcoming the barrier to accessing pilot
facilities/demonstrators for testing the potential of AMT. In contrast, Western and Northern Europe-
an respondents struggled most to gain access to financial resources. Southern European respondents
excelled in overcoming the barrier to cooperation with other AMT developers/producers.
Initial insights from the quantitative and qualitative analyses indicated that policy support appears to
be welcome in four main areas:
These insights will lead to further specified and targeted policy measures and practical recommenda-
tions regarding the adoption of AMT in the next deliverable of the study.

13
1 Introduction
1.1 Analysis of main drivers and barriers for the uptake of advanced manufacturing by EU industry (WP2)
Starting with the results of WP1 in terms of diffusion and impacts of AMT, this work package aimed
at collecting and analysing information on factors affecting the uptake of advanced manufacturing by
the EU industry. The focus was on understanding how internal and external drivers and barriers have
affected decisions to implement AMT and determined the readiness factors affecting decisions. This
information was transformed into guidelines in WP3 for further policy-making.
Figure 1: Framework for WP2
Source: Project Proposal
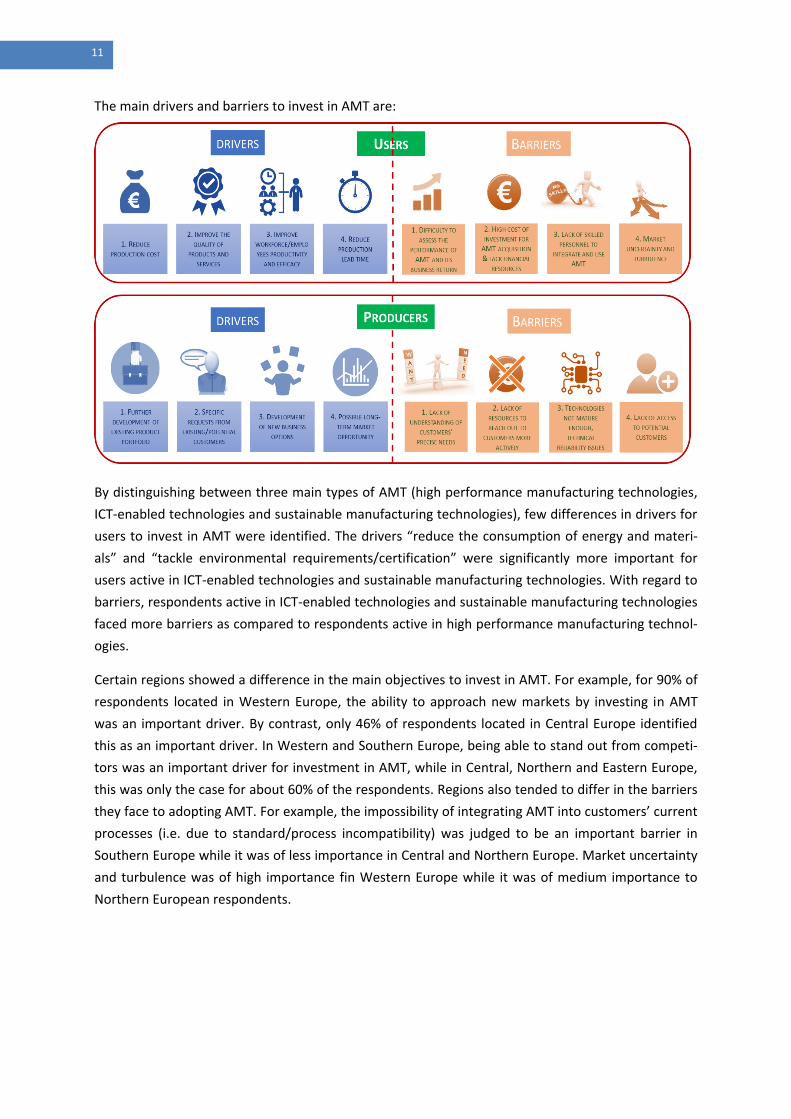
The analysis in Work Package 2 was undertaken in four main phases (see Figure 2). Where Delivera-
ble 2 focused on the first two phases, the present deliverable focuses on the last three1. The case
studies are now finalised, which allows for a full analysis of the qualitative data obtained during the
interviews. An online questionnaire was sent to European companies (SMEs or large companies with
less than 2 000 employees) in order to find out how they have used AMT or how they plan to use
them. A questionnaire covering topics such as main drivers, barriers and SME readiness for advanced
manufacturing products and technologies was developed. The questionnaire was translated into
French, German and Italian in order to ensure that a large proportion of SMEs and large companies
with less than 2 000 employees could answer in their mother tongue or in a language that they could
understand, in addition to avoiding biases due to language confusion. An analysis of the barriers,
drivers and readiness of SMEs and large companies with less than 2 000 employees was undertaken
in order to identify differences and similarities in adopting AMT among regions and industries, in
addition to explaining these differences through evidence-based findings.
1 In Deliverable 2, initial findings from the case studies are reported (covering seven case studies). The final results of all
case studies are reported in Deliverable 3.
14
Figure 2: Focus of the report as part of WP2
Source: Project Proposal
1.2 Methodology
The case studies aimed to identify and analyse the internal and external drivers that enabled compa-
nies to invest in AMT and pin-point which barriers have slowed down further diffusion of the tech-
nology. In this work package, 17 case studies were undertaken, covering 13 SMEs (<250 employees)
and four large companies located in various European regions. A questionnaire consisting of four
parts was developed:
1. Potential of AMT;
2. Business of the company (general);
3. How the company utilises AMT;
4. Input for policy makers.
The insights obtained from the case studies were used to fine-tune the firm-level questionnaire. The
aim of the firm-level questionnaire was to find out how companies (SMEs or large companies with
less than 2 000 employees) use AMT and why they use or plan to use them. The questionnaire was
structured into five main parts:
1. Company profile (size, sector, location, etc.);
2. Relevance of AMT as user and/or producer;
3. Main objectives of using AMT;
4. Main hindering factors to using AMT;
5. Firm-level readiness for AMT use.
Section 2 provides more detail on the case studies-based qualitative analyses while section 3 offers
insights into the quantitative analyses of the questionnaire. The latter section also describes the pro-
cess adopted to reach the required response rate of 500 companies, equating to 20% of (at least) 2
500 European companies (SMEs or large companies with less than 2 000 employees). In this report,
answers from 605 respondents were analysed.

15
2 Qualitative analysis
In order to understand the specific situation in Europe concerning investment in AMT, case studies
were carried out on several European companies. In this study, the focus was on factors affecting the
ability of the companies to invest in, and implement, existing new technologies. In the case studies, a
semi-structured interview approach was used in order to broaden our understanding of AMT and the
drivers and barriers to invest in these technologies. Through open-ended questions, the aim was to
identify drivers and barriers that had not been identified in previous studies and to learn more about
the underlying factors.
In the case studies, the interviewees were initially asked to determine the most important drivers
and barriers to investing in AMT from their perspective. Next, their answers were cross-checked with
more detailed discussions on investment decisions. In this chapter, the setup of the case study is
described and then the results of all case studies are presented. The main objective of the qualitative
analysis was to identify various, potentially relevant drivers and barriers to be studied in greater
depth in the quantitative analysis. Hence, it should be regarded as a preliminary phase, providing
input for the quantitative analysis.
2.1 Methodology
The main steps of our case study approach were to:
Set up a case study template based on a literature review;
Choose case studies in each region;
Carry out case study interviews;
Complete the case study documentation for analysis.
Each company interview was expected to take two to three hours. The company interviews were
mainly carried out by two researchers from the research organisation responsible for the interviews
in that area. Each interview was documented, based on an interview template, in order to enable
analysis and comparison of cases. The main questions focused on various categorical barriers and
drivers, accompanied by general questions (see also Figure 3 below and Annex D for the interview
questionnaire).

16
Figure 3: Main pillars of the semi-structured interview guidelines
Source: Project Proposal
The main steps of the analysis were:
For each case, identification of barriers, drivers and readiness factors;
Comparison of cases in a region in order to identify differences between companies in var-ious positions along the value chain;
Comparison of cases to identify potential differences between industries and regions.
The interviews were carried out and documented in English. The initial analysis of barriers, drivers
and readiness factors in each company was carried out by the responsible organisation and was doc-
umented, case by case, in a national language and in English. This information was used for further
analysis.
The aim of the case studies was to identify and analyse the internal and external drivers that have
enabled companies to invest in AMT as well as which barriers have slowed down their further diffu-
sion. The choice of leading adopters of advanced technology provided a good understanding of driv-
ers, but it provided less information on barriers. Nevertheless, a good understanding of the causality
behind the drivers explained what can slow down diffusion of new technologies and what can be-
come a barrier, if not properly addressed. Since there had to be homogenous coverage of the various
regions of Europe, with a clear focus on SMEs, the distribution of the case studies among the part-
ners and regions was planned as follows. For each region, two SMEs and one large company were
initially chosen for the case study interview. The final setup of the cases in the various regions is
shown in Table 1.

17
Table 1: Distribution of the case studies
Central
Europe
(ISI,
IDEA)
Northern
Europe
(VTT)
Southern
Europe
(ITIA,
IDEA)
Eastern
Europe
(ISI)
Sum
SME (<250
employees) 4 2 3 4 13
Large compa-
nies 1 1 2 - 4
Source: Own analysis
In order to obtain geographical spread across the case studies, the EU was divided into four geo-
graphical regions as follows:
Central Europe: Germany, Austria, Poland, Czech Republic, Slovakia, Hungary;
Western Europe: France, Belgium, the Netherlands, Luxemburg, United Kingdom, Ireland;
Northern Europe: Denmark, Sweden, Finland, Latvia, Lithuania, Estonia;
Southern Europe: Spain, Portugal, Italy, Greece, Malta, Cyprus;
Eastern Europe: Romania, Bulgaria, Slovenia, Croatia, Serbia.
By choosing leading companies in main industry sectors in each region, drivers affecting existing in-
vestments were more easily identified. This was the reason why leading SMEs in each region were
identified. In addition, attention was devoted to their positions in the value chains: OEM (large/SME),
component manufacturer (large/SME) and subcontractor (SME). To sum up, criteria for choosing a
company for our set of case studies were:
Company region (to cover all parts of Europe);
Company size (clear focus on SMEs, supplemented by large companies);
Value chain position (to cover various positions).
In order to gain an in-depth insight into the particularities of companies and the challenges they have
to deal with, when adopting (or not adopting) AMT, it was of great importance to find not only the
right companies, but also the correct expert to undertake interviews within the company. For this
project it was of the utmost importance that interviews were undertaken with the owner of the
company (especially for SMEs), the head of production or the CEO (especially for large companies).
Companies were contacted by members of each regional partner, relying on their direct company
contacts and also on their network of intermediates, such as clusters and industry-related associa-
tions.

18
Organisations chosen for case studies in each geographical region were:
Central Europe: Fraunhofer ISI;
Western Europe: IDEA Consult, ITIA;
Northern Europe: VTT;
Southern Europe: ITIA, IDEA Consult;
Eastern Europe: Fraunhofer ISI.
A predefined list of drivers/barriers was used to facilitate the discussion, building upon the frame-
work used to analyse drivers and barriers in the literature review (see Figure 3 of Deliverable 2). The
technological, organisational and environmental contexts were translated as follows:
Technological context: technological maturity, specific regulation/legislation/policies re-garding a technology;
Organisational: know-how/skills, process requirements, customer service level, availability of internal finance, productivity, costs;
Environmental: demand, competition, availability of external finance, sustainability.
This was translated into the following groups of drivers and barriers (see Table 2):
Table 2: Predefined groups of drivers/barriers
Type of drivers/barriers
Financial situation
Demand situation
Competitive situation
Know-how, competence and skills
Process performance
Customer requirements
Legislative, regulation, and political situations
Sustainability
Other external drivers/barriers
Source: Own analysis

19
2.2 Analysis of the case studies
Four large companies in Europe were involved in the case study interviews. Three of these compa-
nies were users of AMT and the fourth was a producer of AMT. All three user companies are produc-
ers of consumer goods in a global market and are struggling with losses or barely breaking even. To
these companies, economies of scale and cost-cutting are central drivers. AMT such as industrial
robots, automatic handling systems and automated warehouse systems are in use in all of these
companies. One of the companies also reported using additive manufacturing. The fourth large com-
pany in the case study operates in a business-to-business environment. Here, the market is growing,
but competition is tough. Moreover, this company is familiar with industrial robots and 3D printing. It
also develops control and sensing technologies and manufactures micro-mechanical components. All
four companies reported having experience with ICT-enabled manufacturing technologies and sus-
tainable manufacturing technologies.
Thirteen of the case study companies are SMEs. The majority of these companies are high perform-
ing family-owned companies. They reported moderate to fast growth over the last three to five
years. Most companies have a fairly traditional level of automation in their manufacturing depart-
ment. Eight of the SMEs are AMT producers and although these companies design and produce high-
ly automated machines and equipment, several of them scarcely use automation in their own pro-
duction processes. One of the AMT producers reported having an automated line for electrical board
production. Some use digital means such as CNC machines and robots for welding or material han-
dling. Five companies in this group use AMT. Two of the user companies only reported one single
investment in production robots.
AMT producers are experts in the engineering and design of their own products. This can, to some
extent, be seen in how they invest in ICT-enabled manufacturing technology. This technology is used
in their own processes and is delivered to customers as part of their machine and equipment service.
Some of the companies have also invested in sustainable manufacturing technology, such as energy
saving technology or life cycle management technology.
Eight SMEs reported investments in high performance manufacturing technologies, six reported in-
vestments in ICT-enabled manufacturing technologies and six reported investments in sustainable
manufacturing technologies. Companies also indicated investments they had not yet implemented.
Nine of these were in high performance manufacturing technology, one in ICT-enabled manufactur-
ing technologies and one in sustainable manufacturing technology.
A summary of AMT use and considered use by SMEs and large companies is shown in Table 3. Only
three SMEs have experience with robots and none reports experience with automated materials
handling or automated warehouse systems. Many of the companies use CNC machines and
CAD/CAM links in production. On the ICT side, the most common tools are CAD systems and simula-
tion tools for construction and production reconfiguring. Data transfer from machine tools is men-
tioned by one company. Energy-saving technologies are also used in some companies.

20
Table 3: AMT use and interests in case study companies
Invested in AMT Interested in AMT
SMEs
North 1
(user/producer)
- Robot for customer demonstrations (sales)
- CAD, simulation
- Clean air and floor in factory facility
North 3
(user)
- Robots for welding and edging
- CAD
- Energy saving from warm air
East 1
(user/producer)
- Automated manufacturing of PCB, automated quality control
- Automation of PCB development and manufacturing, calibration lab, simulation, GPRS and Bluetooth
- Long-life meter devices
- Additive manufacturing
East 2
(user/producer)
- Data transfer from welding machines - PCB manufacturing automa-tion
East 3
(user/producer)
- Product life cycle management system - Additive manufacturing
East 4
(user/producer)
- CNC technology
- Computer based development and program-ming of CNC machines
- Automation of production processes
South 2
(user/producer)
- Factory facilities
-
South 3
(user/producer)
- New facilities, heat treatment furnace
- Sustainable manufacturing technology and logistics
-
South 5
(user)
- Robot island
- 3D simulation technologies
- Product life cycle management systems
Central 1
(user/producer)
- Dry processing/minimum lubrication
- VR/simulation in production reconfiguration, VR/simulation in product design
- Enterprise resource planning
- Product life cycle management systems
-
Central 2
(user)
- - Additive manufacturing
- VR/simulation in production reconfiguration
Central 4
(user)
- Press machine automation
- Simulation in construction
- Smart technology for linking energy positions with the aim of reducing energy costs
-
Central 5
(user)
- CNC cylindrical grinding machine
- 3D modelling CAD/CAM
- LED lighting
-
Large companies
North 2
(user)
- Robots for welding
- Robots for quality control
- Automated material handling
- Simulation
- Virtual reality technology

21
Invested in AMT Interested in AMT
South 1
(user)
- Industrial robots
- Handling systems
- Automated warehouse management
- ICT applied to machinery/production control through computers and mobile devices
- Control system for shut down of machines
-
South 4
(user)
- Industrial robots/ handling systems
- Automated warehouse management systems
- Additive manufacturing
- Supply chain management with suppli-ers/customers
- Enterprise resource planning
- Dry processing/minimum lubrication
- Combined cold, heat and power
- Technologies for safe hu-man‐machine cooperation
- VR/simulation in production reconfiguration
Central 3
(user/producer)
- Industrial robots/handling systems
- Manufacturing micro-mechanical components
- Additive manufacturing
- Control and sensing technologies
- Product life cycle management systems
- Energy efficient technologies
-
Source: Own analysis
2.2.1 Description of case companies
North 1 is a family-owned SME from Finland. The company focuses on the design and production of
highly customised automated manufacturing systems for the heavy manufacturing industry. Compa-
ny employees are highly skilled, with roughly half of them having a degree in engineering. About 90%
of production is exported, with roughly 60% travelling outside Europe. Major investments in a plant
and product development were made in 2003 and 2004, with an enlargement in 2009.
North 2 is a leading service provider in consumer goods. Today, the company employs over 2 000
professionals in Finland and abroad. North 2 is known for its high quality and the ability to scale up
production very quickly, using its own engineering resources and know-how. Managing investment in
production technology and product line implementation enables the company to keep investment
costs down and speed up implementation. North 2 has grown and made significant investments in
recent years - plans for expansion already exist.
North 3 is a subcontractor for sheet metal machining and assembly. The main customer segment
served is the heavy lorry industry. The company is situated in the middle of Sweden and has about 50
employees. The company is especially good at understanding the needs of the customers, producing
prototypes quickly and producing cost efficient mid-sized batches. The main market is Sweden.
Roughly 15% of production is exported. The market has grown slightly and recovered somewhat
since 2009. Economically, the company is doing reasonably well. It has invested in several robots for
welding and edging pressing. The main investments were made 10-15 years ago, but the company
has updated the equipment annually, with small investments in new or replacement technology.

22
East 1 is a Hungarian SME designing and manufacturing customised measuring equipment for the
industry. It is a privately owned limited company with solid finances. It grew rapidly between 2008
and 2014 following heavy investment in production facilities and product development in 2006 and
2007, respectively. In 2013–2014 the company invested in enlarging its plant facilities.
East 2 is a Serbian SME specialising in the development and production of industrial welding equip-
ment and tools. In addition to R&D and production, the company repairs and maintains all types of
welding units and offers training for professional users. It employs mechanical, electronic and IT en-
gineers for the development of customer-specialised technology. The company has a huge co-
operation network, which enables it to develop and produce customer-specialised systems of highly
automated mechanical and electronic parts for welding and cutting tools.
East 3 is a Croatian SME that focuses on the development, design and production of high speed pre-
cision motorised spindles, direct drives and other high speed technology. It also focuses on engineer-
ing, design and automation of special machine tools and systems. East 3 is a medium-sized enterprise
with 70 employees and an annual turnover of €5.5 million. Its products are customised to the specific
needs of individual customers. The company has a modern, technically advanced factory in Croatia
and sales are located in Croatia as well as in other EU countries. The company is mostly export-
oriented: 90% of the company’s products and services are exported, 75% of which go to the Western
European market and 15% to the US. The company is a privately owned, limited company with solid
finances. It grew rapidly from 2010 to 2014, investing heavily in 2013.
East 4 is an SME located in Serbia. The company has been developing and manufacturing agricultural
machines and components since 1987. In the last five years, the company has invested in a new unit
which specialises in the production of machine components using CNC-controlled precision machine
tools. This unit only develops and produces products for foreign customers. The unit employs highly
specialised workers - not only in development, but also in manufacturing. The company has invested
in new CNC machine tools and ICT-enabled technology, such as software for design, development,
digital process control and simulation. The company employs 24 people in the new CNC unit, roughly
half of whom are engineers. The unit grew rapidly between 2014 and 2016. In 2015 and 2016 the
company invested about 30% of its turnover in new production facilities and product development.
South 1 is a large company located in Spain. It develops, produces and supplies household furniture
in the Iberian Peninsula. The company has a strong focus on technologies and services. It strives to
improve its competitive position through technological innovation and design, the quality of its
products and its customer service.
South 2 is a family-owned machine tool company in Spain, specialising in building and selling high
added value machining centres throughout the world. It is an SME and its competitiveness is based
on high quality products, flexibility and customisation. The company is constantly improving its de-
signs, product range and services related to machinery. This is how it can offer exactly what custom-
ers need and not just a standard machine.

23
South 3 is a social economy company offering precision cutting tools and solutions for various indus-
trial uses in the building sector. Its design and advanced geometry ensures the best finish and per-
formance for all designed materials. The use of modern coating increases cutting speed. The compa-
ny exports more than 80% of its production.
South 4 is one of the major household appliance manufacturers in the world, with approximately $20
billion in annual sales, and manufacturing and technology research units in about 70 countries. In a
mature and concentrated market, led by a few big competitive players, the company leverages a
broad global scale relying on regional divisions to meet local consumers’ preferences. With two re-
cent acquisitions, the company has become more geographically diverse and has realised market
share growth. Its main competitive advantages are based on high economies of scale and reduction
in labour costs in particular in assembly operations.
South 5 is a family-owned business which, since the 1960s, has produced laminated fiberglass rein-
forced polyester for various uses in the industrial sector, such as agriculture, residential construction
and DIY. The company covers the Italian market and exports to various European and African coun-
tries. In the last few years, the Italian market has declined while exports have reached 50% of sales.
Each regional market typically requires various product characteristics in terms of preferred colour
ranges, roll lengths, packaging and batch sizes. South 5 bases its strength on its capacity to fulfil vari-
ous customers’ requirements (in terms of colour, characteristics, delivery, etc.) as well as being able
to satisfy the smallest orders. This small-lot strategy has allowed the company to survive the 2009
crisis when order volumes drastically reduced. The company’s financial situation has been in a con-
stantly improving trend since 2012.
Central 1 is an SME producing AMT. It designs and builds unique, high quality and ultra-precise fully
hydrostatic machine tools. The market for its products is quite small. Therefore, it targets high quality
niche products and focuses on flexibility and customisation. The company currently has 70 employ-
ees. Central 1 exports 95% of its products, of which 30 to 40% travel are exported outside of Europe.
The company mainly invests in its own technology as it has a policy to outsource much activity to
other players. A limited part of its activity is concentrated on services and maintenance, although it is
paying increasingly more attention to helping customers work with machines.
Central 2 is a small French manufacturing enterprise founded in 1946, currently employing 60 peo-
ple. It has been active in general mechanical processing, acquiring expertise and enlarging its activi-
ties in industrial maintenance and consultancy. The company has developed close relationships with
its customers, relying on quality and responsiveness, in order to satisfy customers’ needs. The com-
pany often struggles to remain profitable; the resources it needs to explore innovation opportunities
and the risk of adopting new technologies are often very high barriers to significant innovation for
the company. Currently the company competes in the market by means of its productivity, cost re-
duction and agility to adapt to customers’ requirements.
Central 3’s core expertise is measurement across machine tools and technologies. The company ap-
plies tools and techniques to measure and support feedback loops. It is also active in the fields of
metrology and post-process measurement. In that context, the company deals with motion-

24
measuring technologies and sensors for high precision manufacturing. One of the key areas is me-
trology and this is where the business has initially experienced substantial growth, as Central 3 is a
main provider of solutions and programmes for high precision manufacturing. Over 300 software
engineers are currently working on and building software and tools to support hardware products.
The primary market focuses on manufacturing in relatively low volumes for sectors such as aero-
space, power generation and health care. Future markets include industrial machines, the automo-
tive industry and components for consumer technology products. The company invests heavily in
R&D and is constantly pushing the boundaries of technology. Central 3 has grown over the last five
years. A lot of this growth has been driven by requirements for increased efficiency and waste reduc-
tion. Most of its revenues are export-based, as it exports over 95% of its production.
Central 4 is an innovative company in the aluminium processing industry, which deals with the pro-
duction of technical extruded parts and assemblies. Its expertise is cold-forming by impact extrusion,
combined with innovative processing techniques which emphasise the use of aluminium. Each solu-
tion is completely and entirely tailored to the needs of its customer. The company employs about
230 people, of which roughly 10% are engineers. It was founded in 1988 as a family business. Today
the company is a privately owned limited company with solid finances. In the years 2012 to 2015, the
company enjoyed moderate growth. The company invested heavily during those years. Currently, the
company invests an amount of money comparable to six months turnover.
Central 5 is a company in the metal and synthetic special processing industry which produces tech-
nical parts for the mechanical engineering, automotive and aircraft industries. Its expertise is both
machining metal using CNC machinery and producing thermoplastic parts by injection moulding.
Moreover, it offers its customers several manufacturing services, project management and a quality
centre. The company employs about 100 people, of which roughly 10% are engineers. The products
are customised to the specific needs of individual customers. The company has a modern and techni-
cally advanced factory in Germany. The company was founded in 1991 as a family business. Today
the company is a privately owned limited company with solid finances. In 2014 and 2015, the com-
pany enjoyed a moderate growth rate of 8% and invested heavily. In 2014, the company also estab-
lished a new CNC cylindrical grinding machine.
The cases, their AMT investments and arguments for investing or not investing are described in more
detail in Annex A.
2.2.2 Case material for analysis
In the interviews, the interviewees were first presented with a list of predefined AMT. This was
meant to act as an introduction to the topic of the interview and a means of checking which technol-
ogies the companies are already familiar with. The result of this initial topic was summarised in Table
3, earlier in this chapter.
The second set of questions concerned the case companies, their line of business and their economic
performance. Short descriptions of the companies are provided in Section 3.2.1 to give the reader an
understanding of what kind of companies are involved.

25
In the third part of the interview, the interviewees were asked to describe their views on drivers and
barriers to AMT investments in Europe and how national and European policies support or prevent
AMT investments in their country. The open questions in this part of the interviews gave the re-
spondents space to define their own points of view. The comprehensive information compiled by the
researchers then compared the companies and a list of twenty central topics on drivers, barriers and
the readiness of the industry to invest in AMT. The results of this analysis are presented in Chapter
3.3 and organised according to the predefined groups of drivers and barriers (see Table 2).
The fourth part of the interview focused on the drivers of AMT investments already made by the
companies and on the barriers affecting negative investment decisions or decisions awaiting a final
conclusion. The list of predefined groups of drivers and barriers was used to guide the interview. The
interviewees were asked to give a quantitative estimate of the importance of the groups of drivers
and barriers and qualitative arguments as to why they were rating the driver or barrier as they were.
This line of questioning gave a total of 28 descriptions of AMT investments made by the case compa-
nies and 18 cases of negative or pending investment decisions. The number of AMT investment cases
was higher than the number of case companies, since some companies described several invest-
ments in various types of AMT. Some of the case companies preferred to give more general views on
drivers and barriers to AMT investment.
The information on AMT investment decisions formed the basis for the main analysis of drivers and
barriers. It contained 151 ratings of the importance of specific drivers and barriers and 302 qualita-
tive arguments or short quotes as to why a driver or barrier was important to the company. This ma-
terial was structured and analysed from two points of view. Firstly, the predefined groups of drivers
and barriers in Table 2 were used. Secondly, the material was structured based on:
The size of the case company (SME, large company);
The region (Central, Eastern, Northern and Southern Europe);
Position in value chain (AMT user, AMT producer);
AMT (high performance manufacturing technologies, ICT-enabled manufacturing technol-ogies and sustainable manufacturing technologies).
The analysis was systematically carried out, grouping the quantitative and the qualitative material
into a matrix of eight by four. Due to the fairly low volume of quantitative data it was mainly used to
support the qualitative analysis. The specific character of each unit was concluded by inductive rea-
soning. For AMT investment decisions made or to be made, a comprehensive list of drivers of and
barriers was formed and presented in Annex B.
In the last part of the interview, the interviewees were asked how their company is affected by regu-
lations and how national or EU policy could be changed to better support AMT investments. These
insights have served as input for Work Package 3. Annex C contains a list of the main arguments
made by the interviewees.

26
2.3 Results of the qualitative analysis
2.3.1 Main drivers and barriers to AMT in Europe
The case studies on drivers and barriers to invest in AMT were undertaken in 14 companies in four
regions of Europe covering 11 countries. In the interviews, the representatives of the case companies
were asked to describe their views on drivers and barriers for European companies to invest in AMT
and what the EU could do to improve the situation in Europe. A set of factors affecting AMT market
conditions in Europe was identified. The factors were grouped based on the predefined groups of
drivers and barriers that are presented in Table 2. In this chapter, summaries of the case study re-
sults are presented.
2.3.1.1 Financial situation
A central challenge was that few companies are prepared to make productivity leaps through in-
vestments in new advanced technologies. Users are more willing to continue to work with already
installed technologies. The primary criterion for selection of a supplier is usually the price and not the
novelty of the technical solution. In publicly listed companies and companies operating in low-margin
markets and relying on economies of scale in particular, management is strongly risk-adverse when
considering new investments for innovation. Innovation projects are launched when the return on
investment is significant and no high risks are present. In particular, it is important not to invest in
technologies where the advantage and robustness are not clearly proven, so as not to damage the
quality and reliability of the company’s image. Management is particularly cautious about putting
new technologies into production if they have not been exhaustively tested and previously engi-
neered.
AMT are very expensive and the companies in developing countries cannot invest in them. Hence,
they are willing to invest if their customers are willing to co-operate in that investment. EU subsidies
could be another solution. Unfortunately, such possibilities are not known to small companies.
2.3.1.2 Demand situation
The European AMT market is seen as very passive at the moment. The European AMT market is not
one unified market as there are differences between countries and regions. Some leading areas like
Germany seem to be slowing down, while others like Italy and France are showing some signs of
awakening. Local or national activities and support also affect the way industry is investing. For in-
stance, the Basque country has successfully supported AMT investments. There are good examples
of companies which dare to invest in other countries with high labour costs. For instance, Danish and
Norwegian companies are mentioned in the interviews.
The readiness to invest in AMT is negatively influenced particularly by the financial situation and un-
certainty of the demand. The lack of knowledge and competencies with regard to new technologies
as well as the various cultural barriers impede the adoption readiness of companies. The main chal-
lenge of AMT suppliers is to change the mind of managers, helping them with knowledge develop-
ment as well as with finding the right partners for co-development and co-financing of AMT adoption
projects.

27
Many companies are unfamiliar with the technologies offered by small AMT producers. As the tech-
nology is unknown, they often do not dare to take the step to transition to these technologies, as
they perceive the risk as too high.
2.3.1.3 Competitive situation
Some AMT user industries are facing market concentration and intensification of competition from
Asia. This is the case in the mass production of consumer goods where the entry into the European
market by Asian producers has destabilised competition and led to several complaints with regard to
dumping practices. In the AMT market, Chinese competition has not yet been successful in Europe
due to high quality requirements.
As mass production is increasingly offshored to countries in Asia, Africa or Latin America, European
companies have to compete with local suppliers in these countries. The prices of these suppliers are
significantly lower than the prices of European companies. One way to deal with this problem is to
adopt new technologies such as robots or digital systems to develop and construct better quality
products and competitive prices. This is the main reason why European mass-producing companies
are willing to invest in AMT.
European companies also invest in AMT in order to remain open to future development possibilities.
The business life cycle has shortened in recent years as it is necessary to remain flexible and respon-
sive to new market opportunities. This is especially the case for SMEs that focus on specific niches
and risk being left out if technologies change and new competitors enter the market. Well-
established companies have more references and resources for R&D, enabling them to attract more
subsidies from the EU. This affects the competition and puts SMEs as suppliers of AMT in a less fa-
vourable position.
2.3.1.4 Know-how, competence and skills
Lack of competence and know-how in adopting and using new technologies is also seen as a barrier
to implementing AMT in Europe. This specifically concerns the use of complex ICT-enabled systems
with a high level of digitalisation combining electronic and software elements, especially when im-
plementation of the system requires input from several suppliers. In the case of high performance
manufacturing systems, the situation can be reversed due to new and user-friendly technology.
Organisational culture can also significantly affect AMT investment decisions. In a company with a
deep lean manufacturing culture and tradition, employees at all levels are involved in development
work. They use a wide set of management and organisational instruments that are supported by
paper documents as a tool to enable information on sharing and intra-organisational dialogue. In the
perception of company culture, digital tools are often not suited to lean manufacturing practices as
not all employees have the required competencies using digital tools.
The diffusion of AMT is also slowed down by complex structures in large globally operating compa-
nies. In multinational companies, important decisions must not only meet the approval of top man-
agement, but also of the management of the various business units that are involved as future users

28
of the innovation. Sometimes it might be the case that various units have different priorities or dif-
ferent understandings if new technologies. Finding a common agreement may require a time-
consuming process.
In order to manage innovation risk, user companies often cooperate with innovation partners that
develop, customise and industrialise the technology. User companies do not have infrastructure ca-
pable of developing and introducing technology innovations, so they need to collaborate with inno-
vation partners to develop the technology to TRL 9 as buyers are only interested in introducing it into
their production lines once the technology reaches this stage.
Also the availability of reliable suppliers for the new technologies is important. Users have to rely on
solid suppliers, able to guarantee the supply of novel technologies, serve various production sites
and assist in case of problems. This is a problem for SMEs whose products are not well known or are
very innovative. Hence, there is a need for brokerage events.
Potential AMT users are often not willing to invest in consultancy or training to become acquainted
with new technologies. It would, however, be helpful in case user companies could invest in trainings
for their employees organised at the supplier’s facilities. This would imply that employees can follow
training to become acquainted with the new technology in the supplier’s factory.
2.3.1.5 Process performance
The introduction of AMT has consequences in several areas. It may require re-engineering of pro-
cesses, training of personnel, changes in infrastructure or changes in product design. The introduc-
tion of AMT often requires significant additional investments.
2.3.1.6 Legislative, regulation and political situations
Low competitiveness of the labour force and high cost of labour is affecting the entrepreneurial cli-
mate in some European countries. This also affects how entrepreneurs and managers view invest-
ment in AMT and investment in general.
Also CE Marking Directives can affect AMT investments. They can put SMEs in a situation where they
do not have the know-how to plan and implement the investment, but are forced to buy this from
external experts, adding extra cost to the investment.
2.3.2 Evaluating the importance of drivers and barriers
The interviewees were asked to identify and describe AMT investments and rate the importance of
drivers or barriers in the specific investment decision (scale from 1 to 52). The scores of all investment
decisions are shown in Table 4 and Table 5. Some companies described more than one AMT invest-
ment, resulting in 27 investments being described.
2 1 =low importance and 5 =high importance

29
Although the statistical significance of the answers could not be properly tested due to the small
sample size, some remarks can be made on how important the interviewees consider the various
drivers to be. Firstly, the driver "customer requirements" was evaluated by almost all respondents. It
had a rather high average value, indicating that this was an important driver. Secondly, the “process
performance” driver had the highest average value and a low standard deviation. Thirdly, the driver
“financial situation” clearly divided the group of respondents. Two respondents considered it not
important, two respondents reported it to be of medium importance and two considered it very im-
portant. Fourthly, the driver "Know-how, competence and skills" was rated as not important by one
interviewee although the other interviewees gave it at least a number three or higher.
The interviewees were also asked to identify AMT in which the company had not yet invested and to
describe how the predefined set of barriers affected their decision not to invest. The interviewees
were asked to give a number on a scale from 1 to 5 on the importance of the barrier (see Table 5).
There were major differences in how respondents answered the questions on barriers. For instance,
the average values vary from 1.9 and 4.2.
In general, barriers were rated to be of lower importance than drivers. Among the groups of barriers,
the barrier “Know-how, competence and skills” was rated as the most significant barrier to invest in
AMT. The barrier “Financial situation” received a similar score. Other important barriers included
“Process performance” and “Demand situation”. The least important barrier was “Sustainability”.

30
Table 4: Importance of drivers
Source: Own analysis
Table 5: Importance of barriers
Source: Own analysis

31
2.3.3 Summary of qualitative analysis of AMT investment decisions
This chapter summarises the conclusions of the quantitative analysis of drivers and barriers to invest
in AMT in order to provide an understanding of the readiness of European companies to invest in
AMT. The results are presented from the point of view of the predefined groups of drivers and barri-
ers.
2.3.3.1 Financial situation
The financial situation was rated as one of the most important barriers to investing in AMT, while it
was rated lower as a driver for investment in AMT. This is a strong indication of the importance of
the financial situation of European companies as the group of companies chosen for the case studies
is performing well. A high return on investment is a prerequisite for investing in AMT, but not suffi-
cient if funding cannot be found. For SMEs this can become a barrier when internal resources are
scarce and there are insufficient skills and resources to obtain public financing. Co-financing with
customers is an important source of funding for both large and small companies. All but one of the
companies indicated that their financial situation allows them to invest in manufacturing technology,
but external support would enable them to invest in more sophisticated technology.
In all regions, the financial situation was more important as a barrier to investing in AMT than as a
driver. Some differences of focus could be inferred from the interviews. For example, not all Europe-
an countries provide financial support to invest in AMT. This is specifically the case for countries in
Eastern Europe.
The financial situation is especially important when considering investments in high performance
manufacturing technology. This could be due to high investment costs of technology, but from the
comments of the interviewees, it appears that implementing this type of technology is often con-
nected with product development and process re-engineering, which both contribute to the cost of
implementing this technology. The comments on subsidies for ICT-enabled technologies raise the
question of whether there are differences in opportunities among the various kinds of AMT.
Solving the financial situation can be considered a prerequisite for investment in AMT, both for AMT
users and AMT producers. The users in the case studies focused on the necessity to possess the best
manufacturing technology, while the AMT producers seemed to be more inclined to consider AMT
too expensive for their production.
2.3.3.2 Demand Situation
The demand situation was clearly an important driver and barrier for SMEs and large companies.
Although there were some differences in how the demand situation was rated in the two groups, it
was difficult to see clear differences in how the demand situation affected investment decisions in
the two groups of companies.

32
The companies in Central Europe discussed demand of large batch production, while the companies
in Eastern Europe debated the demand of customised production. Due to the limitations of the re-
search material, this cannot be considered a systematic difference. The choice of case companies
with only SMEs in Eastern Europe is a crucial factor affecting this topic.
What is interesting is that there are companies in Central and Eastern Europe which talked about
huge demand. This somewhat contradicts the general picture of markets in Europe described by the
other case companies. The European AMT market was seen as particularly passive, yet an Eastern
European AMT producer mentioned a huge demand for customised products. Perhaps this is an indi-
cation of change happening in Europe.
It appears that investment in high performance manufacturing technology is sensitive to changes in
demand. One hypothesis could be that such an investment concerns a major process in the company.
ICT-enabled technologies enable customisation and support the company in coping with specific
customer needs. This can be a means to improve competitiveness in a poorer market situation. There
were few comments on sustainable manufacturing technology. It appears the companies are not
familiar with this technology and there seems to be limited demand from customers for sustainabil-
ity.
2.3.3.3 Competitive Situation
The competitive situation was clearly seen as a major driver for investment by large companies.
Economies of scale push for high volumes, high efficiency and low costs. For SMEs, AMT provide an
opportunity to stand out through improved products and services and avoid competing on costs.
High performance manufacturing technology does not benefit SMEs in the same way it does the
high-volume production in larger companies.
Only minor differences between the answers from various regions were identified. In Central Europe
the focus of the comments was on speed and quality to compete on price. In Eastern Europe the
small and medium-sized AMT producers focused their comments on flexibility and speed to serve
their customers. Flexibility was also a competitive edge for the companies in Northern Europe. One
company also considered sustainable manufacturing technology a competitive edge. In Southern
Europe, process efficiency and low costs were considered important.
In the group of 17 companies, only two companies (one in Central Europe and one in Southern Eu-
rope) commented on heavy competition from companies in favourable conditions. Based on the
small number of cases, it was difficult to see any systematic differences between regions regarding
their attitude towards the competitive situation.
The results of the case studies reflected the fact that the three groups of technology are implement-
ed for various reasons. High performance manufacturing technologies are mainly implemented in the
process of transforming physical raw material and components into final products. ICT-enabled tech-
nologies can also partly be used to manage this process, but in most cases these technologies are
used to manage other processes related to physical manufacturing or other services in the company.

33
Managing information helps to cut cost and time in production, but it can also be a means to super-
vise operations like logistics, machine condition monitoring, product data management, etc. Sustain-
able manufacturing technology can to some extent cut costs or improve working conditions, but it is
also seen as a means to improve the company’s image.
Many technologies in the high performance manufacturing technology group focus on improving
efficiency of the manufacturing process via automation. This improves the user’s ability to compete
on cost and production speed. Flexibility in technology also enables variation of products through
modulus and predefined designs. ICT-enabled technologies can be used to support high performance
manufacturing technology, but they also open up possibilities for competing with flexibility and
providing rapid reaction to specific customer needs.
To some extent, the differences in the comments on drivers and barriers between the AMT users and
the AMT producers could be explained by the fact that all but one are SMEs producing highly custom-
ised products that avoid direct competition with low price mass production. The group of AMT users
was more diverse and operated in the mass-production or mass-customisation paradigm. While the
large companies in this group all produce consumer goods in large quantities, the SMEs are suppliers
of parts in a business-to-business environment where repetition is central but production happens in
small batches.
2.3.3.4 Know-how, competence and skills
Lack of know-how, competence and skills constitutes an important barrier for both SMEs and large
companies. Together with the financial situation, this was rated as the most important barrier to the
implementation of AMT. Know-how, competence and skills are important drivers of investment in
AMT in large companies, where in-house training of employees enables companies to improve com-
petitiveness. Engineering skills were not seen as a driver of investment in AMT by SMEs. Lack of
know-how, competence and skills is an important barrier to small, medium-sized and large compa-
nies. The lack of skills or competencies may concern employees on the shop floor, engineers and
managers. A major difference between large companies and SMEs is that the former group has more
in-house resources for training its own employees.
Some regional differences could be outlined. In Central Europe, the focus on know-how, competence
and skills was on machine operators and factory personnel. In Eastern and Northern Europe, the
focus was more on skills and engineering know-how. In Eastern Europe, there seemed to be a lack of
engineers knowledgeable on the most modern types of AMT. In Northern Europe, there was no gen-
eral lack of skilled engineers, but there seemed, more specifically, to be a lack of engineers in the
domain of mass-production or mass-customisation. The companies in Central and Northern Europe
also emphasised the need for in-house employee training and tools and methods for performing the
training.
How know-how, competence and skills are perceived in the various regions contradicts to some ex-
tent the real educational level in these areas. In Central Europe, where the level of general education

34
is good, the comments indicated a lack of skills and competences among factory personnel. In East-
ern Europe, there seemed to be a lack of engineers. The case study material did not show whether
this is due to a gap between the educational system and industrial needs, a high demand for engi-
neers, or a brain drain to Western countries with higher salaries.
There were slight differences in the need for know-how, competence and skills between the three
technology groups. Implementing high performance manufacturing technology puts pressure on
engineers to develop and implement technologies. In ICT-enabled technologies, there is a specific
need for engineering skilled in integrating new technology with old technology. In addition, there is a
need to develop the skills of users of the new technology. In sustainable technology, the lack of
know-how is rather at the level of company management, as managers are not sufficiently aware of
how this technology can benefit their company.
Comparing the comments of AMT users and AMT producers, few differences were noted. The main
topic identified was access to engineering skills. Having good engineers can be a driver of investment,
while a lack of engineers was identified as a barrier for both AMT users and producers. Although
AMT producers have in-house engineering resources to develop their products and services, they
seem to face the same challenge as AMT users in finding engineers and integrating and operating
AMT into their production processes.
2.3.3.5 Process performance
A clear difference between SMEs and large companies was identified in the area of process perfor-
mance. For large companies, where operations are based on economies of scale, automation of pro-
duction and improvement of productivity are central objectives. Their production processes are
tuned towards high capacity and continuous production. Each task is repeated multiple times and
suitable for automation, implying that high performance manufacturing technologies can be very
efficient. For SMEs focusing on customised or small batch production, the opportunity for repetition
is less significant and automation plays a smaller role. In this case, management of processes and
controlling of diverse information is more important.
From the point of view of process performance, the case study material did not show differences in
drivers and barriers based on the geographical location of a company. The differences were more
related to the type of production. Companies producing customised products have a hard time au-
tomating their processes, while companies producing larger volumes of products find this technology
very useful for optimising process performance.
The interviews revealed differences among the three groups of technologies. High performance
manufacturing technologies tend to focus on physical production processes. The volume of produc-
tion can be either a barrier or a driver to invest in AMT, depending on its level. A higher volume and
repeated procedures allow steps in production to be automated. Implementing high performance
manufacturing technologies can disturb the continuous operating process and is considered a poten-
tial barrier to investment in AMT. ICT-enabled technologies enable collection of information, com-

35
munication and information-sharing in new ways and can be used to manage, support or develop
main processes in a wide variety of companies. A main driver for the use of sustainable manufactur-
ing technologies appears to be the possibility of saving costs through reducing energy use and scrap
and using raw materials.
The situation of AMT users and producers with regard to process performance is similar as AMT is
used to improve the efficiency and productivity of production, cut costs and speed up processes.
AMT producers mentioned flexibility, integration between design and production, and improved
maintenance of equipment. AMT can help companies to improve processes in many ways, but a mis-
fit between the potential of AMT and the need for process improvement is a barrier to investing in
AMT.
2.3.3.6 Customer requirements
Customer requirements play a very important role for SMEs. In sales and design departments, a cen-
tral objective for using ICT-enabled manufacturing tools is to document customer requirements and
turn them into a product or service. In production, the commitment to provide customised solutions
implies little repetition and limited opportunity for automation. In larger companies, products are
rather produced in large numbers without changing the designs.
Although there were some differences in how companies from various regions regard customer re-
quirements as a driver or barrier, no real evidence of systematic differences between the regions
could be found. High quality was mentioned in most regions, while speed of production was cited by
companies located in Central and Eastern Europe. Innovation, new functionality and new products
were mentioned by companies from Central, Eastern and Southern Europe, while sustainability was
only mentioned as a customer requirement in the Northern regions.
The comments on high performance manufacturing technologies create a picture of simultaneous
holistic innovation or development of products, services and manufacturing processes. In the case of
ICT-enabled manufacturing technology, the comments stress single improvements such as improved
quality, better planning, minimum disturbance and compatibility. This could indicate that AMT im-
plementation differs amongst these two groups in scope, which probably affects costs and the time
span for implementation. This implies that ICT-enabled manufacturing technologies are a faster and
more efficient means of reacting to customer requirements than high performance manufacturing
technologies are.
Customer requirements are important for AMT users and producers. The arguments for high quality,
speed of production, compatibility of technology and processes and lower prices are the same for
both groups. Customer requirements do not differ for the AMT users focused on customised, flexible
production versus AMT producers focused on batch production.

36
2.3.3.7 Legislative, regulation and political situations
Although the interviewees were able to identify situations where the business of their company or
customers was affected by legislation, directives and regulation, these factors were not considered
to be an important driver of AMT investment. Large companies rated legislation, directives and regu-
lations as major barriers to investing in AMT, while SMEs did not consider these barriers to be im-
portant. SMEs tend to have fewer resources and less know-how to cope with changes and new regu-
lations.
One company in Eastern Europe considered legislation, regulation and the political situation to be
important drivers to invest in AMT. This finding was to some extent supported by the qualitative
findings from the Eastern European companies which showed that these topics are important in
shaping the market. Only Southern Europe rated legislation, regulation and the political situation as
important barriers. Legislation, regulation and the political system were seen as potential drivers for
investment in AMT in three regions while all regions expressed their concerns regarding the freedom
to make business decisions. Eastern Europe considered difficulties applying for subsidies to be a bar-
rier.
The impact of legislation, directives and regulation is often not so visible and this might be a reason
why this group of drivers and barriers was not seen as important for AMT investments. Due to the
low number of comments, no clear difference between the technology groups could be identified
and no systematic difference between AMT users and producers could be found.
2.3.3.8 Sustainability
Sustainability was not highly rated as a driver or barrier although most companies reported some
kind of activities in this area. The main driver seemed to be cost savings through reduced use of en-
ergy or reduced scrap and waste. There were, however, some comments about strategically more
advanced ways to utilise sustainability and sustainable manufacturing technology. This indicates that
some European companies see new possibilities in this area. For example, one company from North-
ern Europe identified sustainability as a strategic issue affecting its business activities, not only
through cost reduction but also through customer value and company image.
Sustainability was a driver in all three groups of AMT. Although circular economy has been raised as a
hot topic for the industry, few commented on sustainability concerned aspects other than saving
scrap and waste. One exception is a Swedish SME’s representative who is also interested in energy
recovery from the air in their plant. In Sweden, the municipality is supplying companies with infor-
mation on sustainable technology, because it is in the interest of the municipality to achieve sustain-
ability targets. One of the Central European companies is a producer of sustainable manufacturing
technology.
AMT users and producers view sustainability in a similar way. As one of the interviewees said:
“Productivity and quality of performance come first, but after this, sustainability is also important to
the customer”. This indicates that the companies are aware of requirements for sustainability, but
that it is not yet the main driver.
37
2.3.4 Size, region, value chain position and technology
The size of the company had a clear impact in some areas on how the companies perceive drivers
and barriers to invest in AMT. The main differences are based on differences in business logics. The
competitive edge of SMEs is based on fulfilling customer requirements better than the competition.
This has a direct effect on their process performance. Large companies use AMT to improve efficien-
cy and productivity through a high level of repetition and automation in their production, while SMEs
focus on efficient management of processes and information management to produce a wide variety
of customised products. Another difference between SMEs and large companies can be derived from
the fact that smaller companies have fewer financial and in-house resources. They have a need for
outside support, but often lack the resources (time and know-how) to apply for public support.
The differences between the four regions in Europe were smaller than expected. There seemed to be
some difference in availability of public financial support between the countries, but little difference
with respect to know-how, competence and skills. Lack of skills was identified as a common chal-
lenge, but there were differences in the deficiencies the companies experience. In Central Europe,
the focus was on the skills and know-how of machine operators and factory personnel while in East-
ern and northern Europe, the focus was rather on resources and engineering skills. Developing com-
petence for in-house training was mainly mentioned by companies from Central and northern Eu-
rope.
The three groups of AMT were different in some ways. Several of the high performance manufactur-
ing technologies studied in this project have been around for a long time, as it often concern house-
hold technologies in mass-production or mass-customisation processes. ICT-enabled technologies
and sustainable technologies are often new or emerging technologies. High performance manufac-
turing technologies focus on the core of the production processes at manufacturing companies. They
not only affect production technology, but also products and production processes. Implementing
new high performance manufacturing technologies involves, in many cases, profound changes in the
entire production system. As a result, investments in these technologies are high and a rapid payback
is critical for the companies. Risk of poor demand or poor performance by the technology has to be
avoided. ICT-enabled manufacturing technologies are often used to improve the information flow in
existing processes. More efficient means of information management are used to create new service
business models, altering the roles of actors in a value network. Better information management
enables efficient operations in areas previously performed as low-technology manual support ser-
vices. This implies that investments are often not high and the benefits can be significant.
The implementation of AMT also requires special skills and competencies. In the case of high perfor-
mance manufacturing technologies, highly-specialised skills are needed especially on the engineering
side. When new technology is implemented, skills and competencies have to be renewed in the de-
sign of products and production. For ICT-enabled manufacturing technologies, engineering skills are
also needed but the implementation of this type of technology also puts pressure on the skills and
know-how of users.

38
Some small differences between AMT users and producers could be outlined but the reason is likely
to be connected to the companies’ operating model. Most AMT producers are SMEs that are produc-
ing highly customised products while many of the user companies are large companies that are pro-
ducing large volumes of standardised products. This might explain why users seemed more likely to
invest in high performance manufacturing technology compared to AMT producers.
2.4 Conclusion from the qualitative analysis
The qualitative analysis led to many interesting insights. Firstly, several drivers and barriers that
emerged from the literature analysis were confirmed. Secondly, additional drivers and barriers were
identified in relation to specific technologies, company size, geographic area and value chain position
(e.g. sufficient demand is a prerequisite for investment in AMT, some companies lack the skills and
resources to apply for public funding). Thirdly, some relevant, strong and unequivocal phenomena
could be identified, based on the fact that the majority of companies participating in the case studies
outlined the same issues. Hence, the qualitative analysis should be seen as a preliminary phase,
providing important input on what is new compared to state-of-the-art and as such provides input
for the quantitative analysis.
In particular, the analysis of comments from the interviewees on the AMT investment decisions con-
firmed that the investment climate for AMT in Europe is indeed an important driver. The analysis
also gave more detailed information on how drivers and barriers affect decision making in different
situations.
The demand situation stands out as crucial for both SMEs and large companies. When the demand
situation is favourable, AMT are used to increase capacity and/or improve process performance. In
large companies, AMT are used to improve process efficiency and productivity in order to be compet-
itive in mass-production or mass-customisation markets. Meanwhile SMEs use AMT to distinguish
their products and services from those of competitors. The fear of losing process performance due
to immature AMT is a strong barrier to invest in emerging AMT. Finance can be a barrier, especially
for small companies if internal resources are lacking and if external support cannot be found. Compe-
tition can also be a powerful driver. Customer requirements were a driver rather than a barrier to
AMT adoption as SMEs compete on the ability to provide customers with unique solutions.
Know-how is very frequently a barrier to investment. A lack of skilled engineers and factory person-
nel will stop a company from acquiring new technology, even though if properly operated it could
improve their processes. The need for know-how depends on technology, but also on the size of the
company.
Regulation and the political environment are important overall, both as drivers and barriers, but
they seem less important for SMEs than for large companies. Sustainability is considered a chance
for new business opportunities, particularly by some SMEs. Many companies invest in this technolo-
gy, as they see an opportunity to save costs and to improve their brand image at the same time.

39
3 Quantitative analysis
3.1 Introduction
A questionnaire was launched to validate the insights obtained in the case studies and the work un-
dertaken in WP1. The focus of the questionnaire was to find out how European companies (SMEs or
large companies with less than 2 000 employees) use AMT, or why they plan to use AMT, what is
hindering them to do so and how ready they are to implement them. The questionnaire strongly built
upon the insights obtained through the literature review and qualitative analysis.
Closed-form questions were used in the questionnaire, which applies similar categorisation in order
to maximise the comparability of the results. The main reasoning behind the predefined groups of
drivers and barriers as identified through the qualitative analysis was used (see Section 3.1), but in
order not to confuse the respondent, jargon associated with the particular framework (see Figure 3
of Deliverable 2) was avoided. It was decided not to include open-form questions with the aim of
reducing the time needed to complete the questionnaire. Respondents were informed that filling in
the questionnaire would only require about 10 minutes. In practice, the average response time was
12 minutes and 30 seconds.
As the questionnaire targets SMEs or large companies with less than 2 000 employees, it was provid-
ed in English, French, German and Italian in order to avoid self-selection due to any confusing lan-
guage that might bias results. This also ensured that a large share of SMEs and large companies with
less than 2 000 employees answered in their mother tongue or in a language that they could under-
stand. When clicking on the link of the questionnaire, respondents could pick the language of their
preference.
In this chapter, the selection procedures of the SMEs or large companies with less than 2 000 em-
ployees are described, following by the description of the dataset and the analyses of the data.
3.2 Methodology
The objective of the questionnaire was to have very broad coverage in terms of manufacturing sec-
tors and COSME countries. Therefore, two approaches were followed to reach SMEs and large com-
panies with less than 2 000 employees.
3.2.1 Direct approach
A direct approach was adopted, one that builds upon the Amadeus database in order to compile a
list of companies that fitted our targeted sample of companies. From Amadeus, companies that em-
ploy between 30 and 2 000 employees active in the last available year were selected in the following
sectors (excluding companies that had no recent financial data):
40
Food, beverages, tobacco industry (NACE 10-12);
Chemical industry (NACE 20-21);
Rubber and plastic industry (NACE 22 23);
Metal industry (NACE 24 25);
Electronic and electrical equipment (NACE 26 27);
Machinery (NACE 28);
Transport equipment (NACE 29 30).
In order to select companies in these sectors, an “AMT keyword” driven search was performed, similar to
the search strategy applied in the literature study (part of WP2 and reported in Deliverable 2).
Search term
“Advanced Manufacturing”
“Sustainable Manufacturing” OR (“Sustainability” AND “Manufacturing”)
“Manufacturing” AND (”Digital Technologies” OR “Big Data” OR “Internet Of Things” OR “Industrial Internet” OR
“Cyber-Physical Systems” OR ”Product Life Cycle Management” OR “Supply Chain Management” OR “Enterprise
Resource Planning” OR “Manufacturing Resource Planning”)
”High Performance Manufacturing” OR ”Additive Manufacturing” OR ”Micro Manufacturing” OR (“Manufacturing” AND
“Industrial Robot”)
The questionnaire was directly circulated to 54 832 companies selected from the Amadeus firm da-
tabase. This number was well above the request in the Terms of Reference to address the question-
naire to at least 2 500 European companies (SMEs or large companies with less than 2 000 employ-
ees). In addition, 1 879 companies were directly called based on a list of companies received from
CECIMO as well as on the lists issued from Amadeus. In many cases, these companies were called
twice: when they showed an interest in the questionnaire, they were followed up to see if they had
actually completed the questionnaire.
When calling these companies, many expressed their frustration after repeated requests to answer
questionnaires, which are now common in the sector. In their view, too many questionnaires are
launched in their community, and this is compounded by the fact that the rationale for completing
such questionnaires is often unclear. In addition, many respondents expressed their concern that the
European Commission could not induce any change to improve their situation. Hence the response
rate was extremely low, as it proved very difficult to convince respondents to complete the ques-
tionnaire.
3.2.2 Indirect approach
In addition, an indirect approach was taken when contacting the main intermediary organisations
and industry associations associated with the use and uptake of advanced manufacturing products
and technologies in a variety of manufacturing sectors. These organisations and associations were
asked to circulate the questionnaire to their members and companies from their networks by adding
the link to the questionnaire in their newsletters and on their website or by directly contacting the
companies.

41
1 612 people at 1 042 intermediary organisations (clusters, chambers of commerce, professional
associations, etc.) were called and asked to circulate the questionnaire among their members. Most
organisations have more than ten members, and several organisations have over 100. For example,
Sirris sent the questionnaire to its 2 500 members; EFFRA included an article on it in their members’
newsletter; CECIMO disseminated the questionnaire to all associated organisations; and several clus-
ters in France and the Netherlands accepted to forward the link to the questionnaire to their mem-
bers. We received the email addresses of 961 people that agreed to distribute the questionnaire
among their members or agreed to discuss the possibility of distributing the questionnaire among
their board members. After three weeks, these people were contacted again.
In addition, the questionnaire was supported and distributed by following heads of sector groups of
Enterprise Europe Network (EEN):
Aeronautics and Space;
Agrofood;
Automotive, Transport and Logistics;
Biochemtech;
Environment;
Healthcare;
ICT Industry & Services;
Intelligent Energy;
Maritime Industry and Services;
Materials;
Nano and Micro-Technologies;
Sustainable Construction;
Textile & Fashion.
Several intermediary organisations and the contacted EEN chairs reacted very positively to our re-
quest and confirmed that they had mobilised their network. We contacted them regularly as the
response rate remained low compared to our outreach efforts.
3.3 Basic description of dataset
In this section, an extensive descriptive analysis of the dataset by company size, sector, location and
coverage of manufacturing activities is delivered. The answers from 605 respondents were analysed.
Not all data could be used, however, as some respondents indicated that they are very large compa-
nies (>2 000 employees). Hence, 44 respondents were excluded from the analysis. In addition, 31
respondents were headquartered in non-COSME countries and were therefore excluded. As none of
the questions was obligatory, the response rate per question varies.

42
3.3.1 Company profile
The analysis of the company size of the respondents of the questionnaire revealed that 49.7% of the
respondents are medium-sized companies i.e. those that have between 50 and 249 employees. The
other groups, namely large companies (250-2 000 employees) and small and micro companies (1-49
employees), represent respectively 18.1% and 32.2%.
Figure 4: Company size (n=525)3
Source: Own analysis
The machinery sector (NACE 28) is the sector best represented in the sample of respondents (22.8%).
The metal industry (NACE 24 25) and electronic and electrical equipment sectors (NACE 26 27) follow
in second and third places, respectively. Transport equipment (NACE 29 30) is the sector that is least
represented. The other category mainly comprises construction companies, paper & pulp companies,
and textile companies.
3 44 very large companies (> 2 000 employees) were excluded from the analysis.

43
Figure 5: Company sector (n=524)
Note: Figures in brackets refer to NACE, rev. 2
Source: Own analysis
The majority of the respondents are located in Central and Southern Europe. Italy is the Member
State with most respondents (18.6%), followed by Germany (12.7%) and Spain (7.6%). Czech Republic
(6.8%) and Hungary (6.2%) complete the top 5. The sample contains respondents from all COSME
countries with the exception of Ireland and Luxembourg.
Figure 6: Location of headquarters (n=369)4,5
Source: Own analysis
4 23 respondents from Belarus, India, Japan, Russia, South Africa, Switzerland, US, Ukraine and Bosnia and Herzegovina
were excluded from the survey. 5 Central Europe: Germany, Austria, Poland, Czech Republic, Slovakia, Hungary
Western Europe: France, Belgium, the Netherlands, Luxembourg, United Kingdom, Ireland Northern Europe: Denmark, Sweden, Finland, Latvia, Lithuania, Estonia Eastern Europe: Romania, Bulgaria, Slovenia, Croatia Southern Europe: Spain, Portugal, Italy, Greece, Malta, Cyprus COSME non-EU (which responded): Albania, Iceland, Serbia, Macedonia, Turkey

44
Looking at the company size across regions, Table 6 shows that in Southern Europe, there are more
SMEs compared to other regions in Europe. 50.5% of all respondents from Southern Europe indicat-
ed that they are a small or micro-enterprise. In Central and Northern Europe, only 19.0% and 36.1%
indicated that they are a small or micro-enterprise. The large majority of companies from Eastern
Europe that responded to the questionnaire are medium-sized or large companies.
Table 6: Location of headquarters versus company size (n= 366)
Location
Company size Central Europe
Western Europe
Northern Europe
Southern Europe
Eastern Europe
COSME non-EU
Total
n=121 n=45 n=36 n=105 n=39 n=20 n=366
Large companies (250-2 000 employees)
24.0% 17.8% 13.9% 8.6% 30.8% 0% 17.2%
Medium-sized companies (50-249 employees)
57.0% 46.7% 50.0% 41.0% 46.2% 80.0% 50.5%
Small and micro companies (1-49 employees)
19.0% 35.6% 36.1% 50.5% 23.1% 20.0% 32.2%
Total 100% 100% 100% 100% 100% 100% 100%
Source: Own analysis
On average, the majority of respondents only have manufacturing operations in their home country
(60.1%). Considering the average size of the companies (Figure 7), this comes as no surprise. Hence,
Table 7 provides an overview of the coverage of manufacturing operations according to company
size. Large companies are operating relatively more in a number of countries compared to SMEs
which tend to focus on their home country.
Figure 7: Coverage of manufacturing operations (n=461)
Source: Own analysis

45
Table 7: Coverage of manufacturing operations over company size (n=458)
Coverage of manufacturing operations
Company size Manufacturing operations only in the home country
Manufacturing opera-tions in a number of
countries
Total
n=274 n=184 n=458
Large companies (250-2 000 employees)
13.1% 25.0% 17.9%
Medium-sized companies (50-249 employees)
55.1% 48.9% 52.6%
Small and micro companies (1-49 employees)
31.8% 26.1% 29.5%
Total 100% 100% 100%
Source: Own analysis
The international character of companies differs across the selected sectors. Companies active in the
food, beverages and tobacco industry in our sample tend to concentrate their activities in the home
country (78.7%), while several companies active in transport equipment operate in a number of
countries.
Table 8: Coverage of manufacturing activities over various sectors (n=459)
Coverage of manufacturing operations
Sector Manufacturing operations only in the home country
Manufacturing operations in a number of countries
Total
n=275 n=184 n=459
Food, beverages, tobacco industry (NACE 10 12)
78.7% 21.3% 100%
Chemical industry (NACE 20 21)
65.9% 34.1% 100%
Rubber and plastic industry (NACE 22 23)
57.8% 42.2% 100%
Metal industry (NACE 24 25) 55.2% 44.8% 100%
Electronic and electrical equipment (NACE 26 27)
58.3% 41.7% 100%
Machinery (NACE 28) 52.1% 47.9% 100%
Transport equipment (NACE 29 30)
30.4% 69.6% 100%
Other 62.2% 37.8% 100%
Note: Figures in brackets refer to NACE, rev. 2
Source: Own analysis
Looking at the coverage of manufacturing activities across regions, it can be noted that Western Eu-
ropean companies tend to operate in more countries, while several Southern and Eastern European
companies operate only in the home country.

46
Table 9: Coverage of manufacturing activities over various locations (n=349)
Coverage of manufacturing operations
Location Manufacturing operations only in the home country
Manufacturing operations in a number of countries
Total
n=205 n=144 n=349
Central Europe 55.1% 44.9% 100%
Western Europe 44.7% 55.3% 100%
Northern Europe 56.3% 43.8% 100%
Southern Europe 63.5% 36.5% 100%
Eastern Europe 75.7% 24.3% 100% COSME non-EU 55.0% 45.0% 100%
Total 58.7% 41.3% 100%
Source: Own analysis
The questionnaire also provided insights into market coverage, in addition to the coverage of manu-
facturing operations. It is not because a company only operates manufacturing operations locally
that they cannot serve customers from a variety of countries. Figure 8 clearly shows that the majority
of companies in our sample serve clients on a global scale (60.4%). A minority, only 15.8%, serve only
their domestic market. Not surprisingly, mainly SMEs serve primarily local markets (see Table 10).
However, it can be noted that a large proportion of the medium-sized companies with 50 to 249 em-
ployees tend to serve EU28 and international markets.
Figure 8: Coverage of market activities (n=480)
Source: Own analysis

47
Table 10: Coverage of market activities over company size (n=475)
Market coverage
Company size Domestic EU28 Global Total
n=75 n=113 n=287 n=475
Large companies (250-2 000 employees) 8.0% 12.4% 22.3% 17.7% Medium-sized companies (50-249 employees) 37.3% 56.6% 53.3% 51.6% Small and micro companies (1-49 employees) 54.7% 31.0% 24.4% 30.7% Total 100% 100% 100% 100%
Source: Own analysis
The majority of companies that have a domestic market coverage, operate manufacturing operations
from their home country (89.9%). Companies with a EU28 market coverage also tend to operate
from their home country, although 38.9% operates manufacturing operations in several countries.
Companies that cover the global market also tend to operate from multiple countries.
Table 11: Coverage of manufacturing and market activities (n=459)
Market coverage
Coverage of manufacturing operations Domestic EU28 Global Total
n=69 n=108 n=282 n=459
Manufacturing operations only in the home country 89.9% 61.1% 52.5% 60.1% Manufacturing operations in a number of countries 10.1% 38.9% 47.5% 39.9% Total 100% 100% 100% 100%
Source: Own analysis
An important variable for the analysis of the data is whether a company is a user or producer of AMT.
As some companies are both users and producers, this option was also included in the questionnaire.
22.3% of the respondents are both users and producers, and they were asked to fill in the question-
naire from a user’s perspective. The majority of companies (62.9%) that completed the questionnaire
are users. This group of companies is well placed to provide insights on drivers and barriers related to
the diffusion of AMT. 14.8% of the respondents indicate that they are a producer of AMT. They re-
sponded to the questionnaire from their own perspective, but were also asked to give their opinion
from the perspective of their customers.
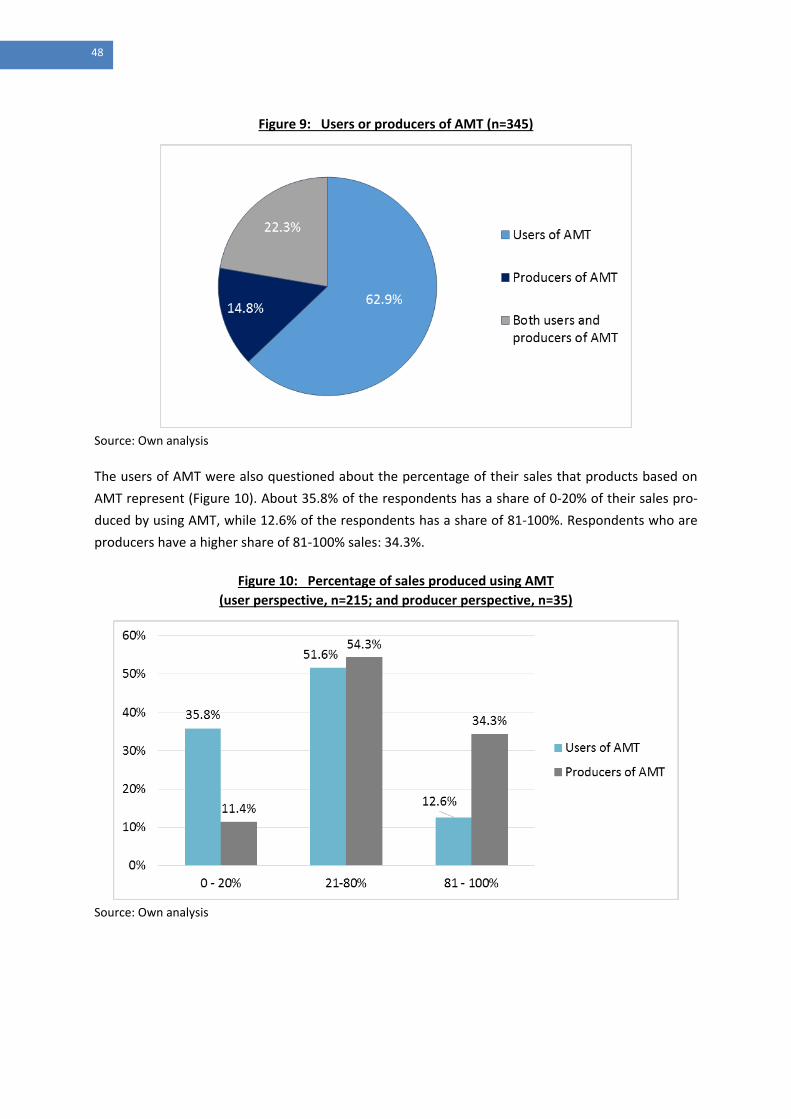
48
Figure 9: Users or producers of AMT (n=345)
Source: Own analysis
The users of AMT were also questioned about the percentage of their sales that products based on
AMT represent (Figure 10). About 35.8% of the respondents has a share of 0-20% of their sales pro-
duced by using AMT, while 12.6% of the respondents has a share of 81-100%. Respondents who are
producers have a higher share of 81-100% sales: 34.3%.
Figure 10: Percentage of sales produced using AMT
(user perspective, n=215; and producer perspective, n=35)
Source: Own analysis
49
Looking at the company size of users, Table 12 shows that the highest share of sales produced by
using AMT for small and micro companies is a share of between 0-20%. For large and medium-sized
companies, the highest share of sales produced by using AMT is between 21-80%.
Table 12: Percentage of sales produced using AMT by company size (user perspective) (n=214)
Company size
Large companies (250-2 000 employees)
Medium-sized com-panies
(50-249 employees)
Small and micro companies
(1-49 employees)
Total
n=43 n=124 n=47 n=214
0-20% 25.0% 38.0% 61.5% 37.1%
21-80% 55.6% 51.0% 34.6% 50.0%
81-100% 19.4% 11.0% 3.8% 12.9%
Total 100% 100% 100% 100%
Source: Own analysis
3.3.2 AMT profile
Three types of AMT were distinguished: high performance manufacturing technologies, ICT-enabled
technologies and sustainable manufacturing technologies. Companies were asked to indicate the
relevance of each type of AMT to their company on a scale of 1 (low) to 5 (high relevance for the
company). As Figure 11 shows, technologies to improve the performance of manufacturing and ena-
ble innovative manufacturing processes are found to be highly relevant. The distribution of relevance
of high performance technologies is increasing: a small amount of respondents (3%) indicated that
high performance technologies have low relevance, while a large amount of respondents (40%) indi-
cated the high relevance of high performance technologies. The distribution of relevance of the ICT-
enabled and sustainable manufacturing technologies is more inverse U-shaped, with a lower amount
of low and high relevance responses and a higher amount of medium relevance responses. On aver-
age, high performance technologies are more relevant than sustainable manufacturing technologies
which are in turn more relevant than ICT-enabled technologies (on average 3.4 for sustainable manu-
facturing technologies, 3.2 for ICT-enabled technologies vs. 3.9 for high performance technologies).

50
Figure 11: Distribution of relevance of AMT (n=359-361)
Note: Scale 1 (Low) – 5 (High)
Source: Own analysis
Table 13 provides more detailed insights on the response rate compared to Figure 11. A difference is
seen between high relevance versus low and medium relevance as for the analysis of various types of
AMT, only the companies that considered the technology to be of high relevance are taken into ac-
count. 71.2% of respondents considered high performance manufacturing technologies to be of high
relevance, but only 50.0% of the respondents in the case of sustainable manufacturing technologies
did. However, of those respondents who indicated that sustainable manufacturing is only of low or
medium relevance to them, several indicated that another type of AMT is of high relevance. There
are multiple respondents who indicated more than one type of AMT as being of high relevance,
whereas it is interesting to see that only 20.8% did not indicate a single high relevance for any type of
AMT for their company. Of the respondents who indicated high relevance for a specific type, 26.0%
indicated a high relevance for all three types of AMT (see Table 12).
Table 13: Overview of the (high versus low) relevance of AMT (n=361)
High performance ICT-enabled Sustainable
N (%) N (%) N (%)
High relevance6 257 (71.2%) 156 (43.5%) 180 (50.0%)
Low-medium relevance7 104 (28.8%) 203 (56.5%) 180 (50.0%)
Total 361 (100%) 359 (100%) 360 (100%)
Source: Own analysis
6 High relevance: Respondent indicated 4 or 5 on a scale of 1 (low) to 5 (high relevance).
7 Low-medium relevance: Respondent indicated 1, 2 or 3 on a scale of 1 (low) to 5 (high relevance).

51
Table 14: Overview of the high relevance of AMT (n=365)
% N
High relevance of 1 AMT 21.9% 80 High performance 61
ICT-enabled 10
Sustainable 9
High relevance of 2 AMT 31.2% 114 High performance and ICT-enabled 38
ICT-enabled and Sustainable 13
High performance and Sustainable 63
High relevance of 3 AMT 26.0% 95 Low-medium relevance of AMT 20.8% 76 Total 100% 365
Source: Own analysis
Respondents could also indicate those specific high performance technologies that are relevant to
their production processes. High performance machinery and industrial robots/handling systems are
found to be very relevant whereas process for bio-manufacturing; silicon-on-chips, heterogeneous
circuits and embedded systems; photonics; and nano-electronics materials and patterning, nano-
imprint are considered to be of less relevance (see Figure 12). Hence, more traditional AMT like ro-
botics are perceived as more relevant, compared to more innovative AMT such as nano-electronics
materials, which are rather push technologies and probably less known to companies. In ICT-enabled
technologies, supply chain management with suppliers/customers, network-centric production, op-
timisation of production networks; enterprise resource planning; and product life cycle management
systems, product data management systems are considered the most relevant technologies (see
Figure 13). Control system for shutting down machines; recycling and waste/disposal management
technologies; and product life cycle optimisation, service life optimisation are the most relevant sus-
tainable manufacturing technologies (see Figure 14). On average, no single technology is perceived
as predominantly important. This points towards the multidisciplinary character of industrial applica-
tions and the importance of integrating several technologies.

52
Figure 12: Relevance of specific high performance manufacturing technologies (in %) (n=258-266)
Note: Scale 0 (Not relevant) – 1 (Relevant)
Source: Own analysis

53
Figure 13: Relevance of ICT-enabled technologies (in %) (n=253-258)
Note: Scale 0 (Not relevant) – 1 (Relevant)
Source: Own analysis

54
Figure 14: Relevance of Sustainable Manufacturing Technologies (in %) (n=259-262)
Note: Scale 0 (Not relevant) – 1 (Relevant)
Source: Own analysis

55
On average, the respondents who are both users and producers of AMT have a higher relevance in all
the three types compared to companies who are users or producers of AMT. Producers give, on av-
erage, a higher relevance to high performance technologies than users (4.1 versus 3.9), while users
give, on average, a higher relevance to sustainable manufacturing technologies (3.4) compared to
producers (3.1). Users and producers indicate a similar relevance for ICT-enabled technologies.
Table 15: Average relevance of AMT by user/producer (n = 340)
High performance
ICT-enabled Sustainable
n=340 n=338 n=337
Users of AMT 3.9 3.2 3.4
Producers of AMT 4.1 3.2 3.1
Both users and producers of AMT 4.1 3.4 3.7
Total 4.0 3,3 3.4
Note: Scale 1 (Low) – 5 (High)
Source: Own analysis
Looking at the relevance of types of AMT by company size, Table 16 shows that for large companies,
high performance manufacturing technologies are very relevant (4.2). Also ICT-enabled technologies
and sustainable manufacturing technologies are on average highly relevant for large companies.
Small and micro companies perceived all types of AMT as less relevant compared to large companies.
Table 16: Average relevance of AMT by company size (n=358)
Company size High performance
ICT-enabled Sustainable
n=358 n=356 n=356
Large companies (250-2 000 employees) 4.2 3.4 3.8
Medium-sized companies (50-249 employees) 4.1 3.2 3.5
Small and micro companies (1-49 employees) 3.6 3.2 3.2
Total 4.0 3.2 3.4
Note: Scale 1 (Low) – 5 (High)
Source: Own analysis
Table 17 provides an overview of the average relevance of the various types of AMT by sector. The
food, beverages, and tobacco industry is the only sector for which the relevance of high performance
technologies is not on top. For this sector, sustainable manufacturing technologies are of relatively
higher importance. ICT-enabled technologies are of high relevance to the electronic and electrical
equipment and transport equipment sectors. In turn, both sectors consider sustainable manufactur-
ing to be of less relevance.

56
Table 17: Average relevance of AMT by sector (n=293-299)
Sector High
performance ICT-enabled Sustainable
Food, beverages, tobacco industry (NACE 10 12) 3.8 3.3 3.8
Chemical industry (NACE 20 21) 4.1 3.3 3.7
Rubber and plastic industry (NACE 22 23) 4.0 2.7 3.4
Metal industry (NACE 24 25) 4.0 3.3 3.6
Electronic and electrical equipment (NACE 26 27) 4.0 3.4 3.1
Machinery (NACE 28) 4.0 3.2 3.3
Transport equipment (NACE 29 30) 3.8 3.6 3.3
Other 3.9 2.9 3.8
Note: Scale 1 (Low) – 5 (High)
Note: Figures in brackets refer to NACE, rev. 2
Source: Own analysis
For companies located in Western, Northern and COSME non-EU countries, high performance tech-
nologies are of high relevance (on average above 4.0). ICT-enabled technologies prove to be most
relevant in Eastern Europe (3.5) and COSME non-EU countries (3.6), while sustainable manufacturing
technologies are most relevant for Central Europe (3.5) and COSME non-EU countries (4.0). It has to
be noted that COSME non-EU countries only represent a small sample size. For all regions, high per-
formance technologies are the type of AMT with the highest relevance.
Table 18: Average relevance of AMT by location headquarters (n=279)
Location High performance
ICT-enabled Sustainable
n=281 n=279 n=279 Central Europe 3.9 3.1 3.5 Western Europe 4.1 3.2 3.4 Northern Europe 4.2 3.3 3.2 Southern Europe 3.8 3.3 3.3 Eastern Europe 3.9 3.5 3.6 COSME non-EU
8 4.0 3.6 4.0
Total 3.9 3.3 3.4
Note: Scale 1 (Low) – 5 (High)
Source: Own analysis
In addition to various types of AMT, the respondents were asked to assess their company’s level of
capacity with respect to:
Product and service technology;
Production technology;
Use of ICT;
Management processes to improve technological level.
8 Only 8 companies from COSME non-EU countries responded to this question.

57
Most respondents considered their company to be around the industry average. Product and service
technology and production technology, on average, scored slightly above the industry average while
the use of ICT and management processes to improve technological level was scored slightly below
industry average.
3.4 Drivers to invest in AMT
3.4.1 General findings
Figure 15 provides an overview of the various drivers to invest in AMT. The top three drivers are:
reduction of production cost, improving the quality of products and services, and improving work-
force/employee productivity and efficacy. Between 86.4% and 90.9% of the respondents indicated
these drivers were the main objectives for their company to invest in AMT. Less than 50% of the re-
spondents indicated that addressing other certification requirements is a driver to invest in AMT.
The various drivers to invest in AMT can be divided into internal and external drivers for the compa-
nies. Internal drivers refer to those that are the direct responsibility of a company and which man-
agement can influence directly. External drivers refer to those that take place outside the company
and result from developments outside the company, over which the company itself has little influ-
ence. Figure 15 clearly indicates that the internal drivers (dark blue bars) are more frequently (63.4-
90.9%) indicated by respondents as objectives than the external ones (light blue bars) (45.9-69.5%). It
seems that the main goals of SMEs and large companies with less than 2 000 employees are to in-
crease efficiency and quality, where they expect AMT to play a role.
Figure 15: Drivers to invest in AMT (user perspective) (n=141-143)
Note: Scale 0 (no objective) – 1 (objective)
Source: Own analysis
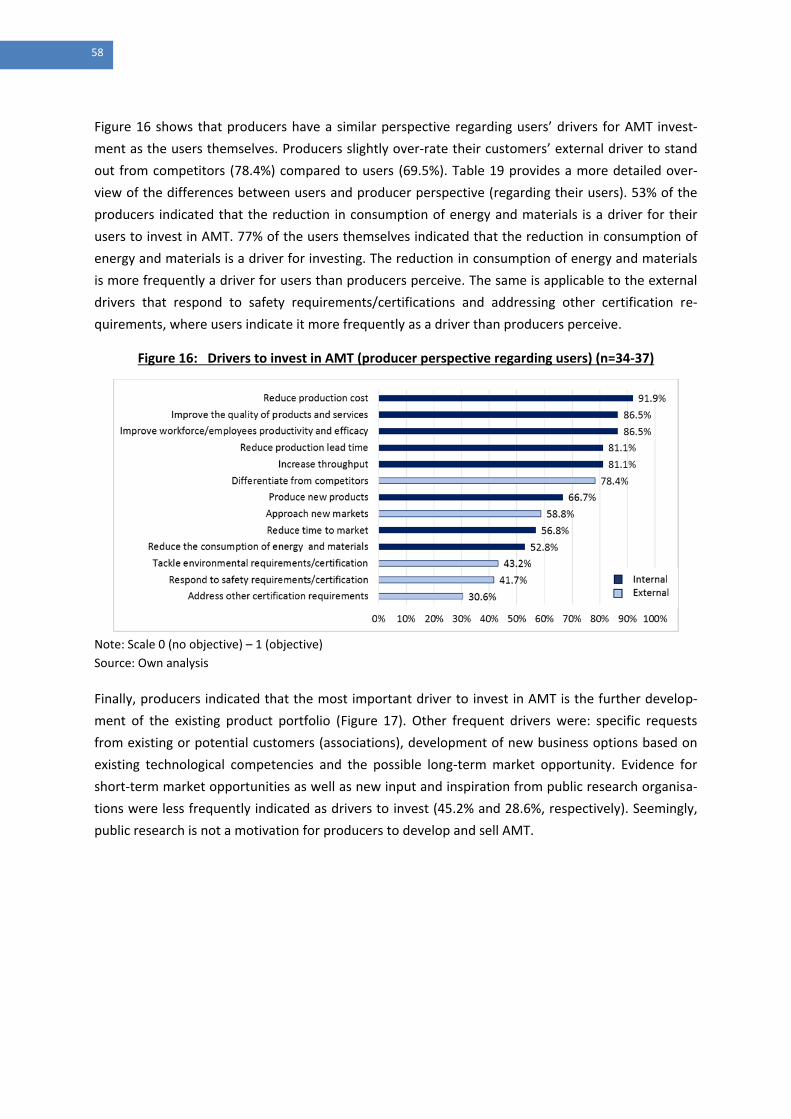
58
Figure 16 shows that producers have a similar perspective regarding users’ drivers for AMT invest-
ment as the users themselves. Producers slightly over-rate their customers’ external driver to stand
out from competitors (78.4%) compared to users (69.5%). Table 19 provides a more detailed over-
view of the differences between users and producer perspective (regarding their users). 53% of the
producers indicated that the reduction in consumption of energy and materials is a driver for their
users to invest in AMT. 77% of the users themselves indicated that the reduction in consumption of
energy and materials is a driver for investing. The reduction in consumption of energy and materials
is more frequently a driver for users than producers perceive. The same is applicable to the external
drivers that respond to safety requirements/certifications and addressing other certification re-
quirements, where users indicate it more frequently as a driver than producers perceive.
Figure 16: Drivers to invest in AMT (producer perspective regarding users) (n=34-37)
Note: Scale 0 (no objective) – 1 (objective)
Source: Own analysis
Finally, producers indicated that the most important driver to invest in AMT is the further develop-
ment of the existing product portfolio (Figure 17). Other frequent drivers were: specific requests
from existing or potential customers (associations), development of new business options based on
existing technological competencies and the possible long-term market opportunity. Evidence for
short-term market opportunities as well as new input and inspiration from public research organisa-
tions were less frequently indicated as drivers to invest (45.2% and 28.6%, respectively). Seemingly,
public research is not a motivation for producers to develop and sell AMT.

59
Table 19: Drivers to invest in AMT: users versus producers perspective (n=277-280)
Users9 Producers Difference
n=241-243 n=34-36
Internal drivers
Increase throughput 78.0% 81.1% -3.1%
Reduce production lead time 81.1% 81.1% 0.0%
Reduce time to market 63.4% 56.8% 6.6%
Reduce production cost 90.9% 91.9% -1.0%
Improve workforce/employee productivity and efficacy 86.4% 86.5% -0.1%
Reduce the consumption of energy and materials 76.5% 52.8% 23.7%***
Improve the quality of products and services 90.1% 86.5% 3.6%
Produce new products 76.0% 66.7% 9.3%
External drivers
Approach new markets 63.4% 58.8% 4.6%
Differentiate from competitors 69.5% 78.4% -8.9%
Respond to safety requirements/certification 62.2% 41.7% 20.5%**
Tackle environmental requirements/certification 53.5% 43.2% 10.3%
Address other certification requirements 45.9% 30.6% 15.3%*
Note: Scale 0 (no objective) – 1 (objective)
Note: * significant at the 1% level, ** significant at the 5% level, *** significant at the 10% level
Source: Own analysis
Figure 17: Drivers to invest in AMT (producer perspective) (n=42-44)
Note: Scale 0 (no objective) – 1 (objective)
Source: Own analysis
9 The respondents which indicated that they are both user and producer of advanced manufacturing equipment and tech-
nologies were asked to fill in the questionnaire from a user perspective.

60
3.4.2 Specific findings
3.4.2.1 Technology/AMT specific findings
In this study, three types of AMT are discussed: high performance technologies, ICT-enabled tech-
nologies and sustainable manufacturing technologies. Table 20 provides an overview of the various
drivers distinguishing the three different AMT (for respondents who indicated high relevance of the
specific technology to their company)10
.
The top three drivers that were previously identified relate to three types of technologies frequently
indicated as drivers. Users which indicated the high relevance of sustainable manufacturing technol-
ogies more frequently indicated the reduction in consumption of energy and materials (87.3%) and
tackling the environmental requirements/certification (64.7%) than high performance and ICT-
enabled technologies.
Table 20: Drivers by type of AMT (user perspective) (n=106-184)
High performance
ICT-enabled Sustainable
manufacturing
n=184-186 n=106-108 n=132-134
Internal drivers
Increase throughput 80.4% 77.4% 83.5%
Reduce production lead time 83.3% 83.3% 82.1%
Reduce time to market 67.2% 75.0% 68.7%
Reduce production cost 91.9% 92.6% 94.8% Improve workforce/employee productivity and efficacy 86.0% 87.0% 88.1%
Reduce the consumption of energy and materials 76.3% 79.6% 87.3%
Improve the quality of products and services 93.0% 93.5% 92.5%
Produce new products 78.9% 82.2% 78.4%
External drivers
Approach new markets 65.1% 65.7% 63.4%
Differentiate from competitors 74.7% 74.1% 73.1%
Respond to safety requirements/certification 64.3% 69.8% 67.4%
Tackle environmental requirements/certification 54.9% 57.0% 64.7%
Address other certification requirements 49.2% 50.9% 56.4%
Note: Scale 0 (no objective) – 1 (objective)
Source: Own analysis
10
Only respondents that answered highly relevant e.g. 4 or 5 on a scale of 1 (low) to 5 (high relevance) are considered in this analysis

61
3.4.2.2 Findings related to location
Table 21 provides an overview of the various drivers of AMT by location of a company’s headquar-
ters. All regions are very concerned with the reduction in production costs. Western European com-
panies seem to give high priority to efficiency, services and external drivers, while Southern Europe-
an companies seem rather to tackle services in terms of reduction in production lead time (86.8%)
and costs (88.7%), and improving the quality of products and services (90.6%). Both Western and
Southern European companies are motivated by the external driver to differentiate themselves from
competitors.
Table 21: Drivers by location (user perspective) (n=187-189)
Central Europe
Western Europe
Northern Europe
Southern Europe
Eastern Europe
COSME
non-EU11
Total
n=67-68 n=23 n=15 n=52-53 n=20 n=8-10
n=187-189
Internal drivers
Increase throughput 80.9% 91.3% 80.0% 65.4% 70.0% 100.0% 77.7%
Reduce production lead time 75.0% 95.7% 80.0% 86.8% 90.0% 70.0% 82.5%
Reduce time to market 51.5% 78.3% 60.0% 71.7% 65.0% 80.0% 64.0%
Reduce production cost 88.2% 91.3% 93.3% 88.7% 90.0% 100.0% 89.9% Improve workforce/employee productivity and efficacy
89.7% 91.3% 80.0% 79.2% 95.0% 90.0% 86.8%
Reduce the consumption of energy and materials
77.9% 65.2% 60.0% 75.5% 85.0% 100.0% 76.2%
Improve the quality of products and services
89.7% 73.9% 86.7% 90.6% 100.0% 90.0% 88.9%
Produce new products 66.2% 78.3% 80.0% 73.6% 75.0% 90.0% 73.0%
External drivers
Approach new markets 47.1% 82.6% 66.7% 58.5% 70.0% 100.0% 61.4% Differentiate from competitors
51.5% 87.0% 53.3% 79.2% 65.0% 80.0% 66.7%
Respond to safety requirements/certification
56.7% 52.2% 66.7% 56.6% 80.0% 77.8% 60.4%
Tackle environmental requirements/certification
58.8% 43.5% 26.7% 49.1% 70.0% 100.0% 54.5%
Address other certification requirements
39.7% 43.5% 40.0% 35.8% 60.0% 80.0% 43.4%
Note: Scale 0 (no objective) – 1 (objective)
Source: Own analysis
11
Only a limited number of responses were obtained from COSME countries which are not part of the EU. Therefore, this region was not further analysed in detail.

62
For companies with headquarters in Western Europe, approaching a new market is more frequently
indicated as a driver than in Central Europe (82.6% versus 47.1%). Differentiating the company from
competitors is for respondents in Central Europe, Northern Europe and Eastern Europe (51.5-65.0%)
less frequently a driver for investing in AMT than for Western and Southern Europe (79.2-87.0%).
Eastern European companies more frequently indicate tackling environmental require-
ments/certification (70.0%) as a driver than Northern Europe (26.7%). The same applies to the reduc-
tion in consumption of energy and materials: 85.0% of respondents in Eastern Europe indicated it as
a driver, compared to 60.0% in Northern Europe. It appears that other regions seem to care less
about the environment and certification issues than Eastern Europe. This may be due to the fact that
companies in these regions have already tackled these issues in the past, whereas Eastern European
companies are now concerned with coping with environmental standards and certification issues. To
summarise, overall the regional differences are larger for external than for internal drivers.
3.4.2.3 Findings related to company size
SMEs consider differentiation from competitors as a driver more often than large companies (70.4%-
72.7% versus 58.3%). On the other hand, increasing the throughput is less frequently a driver for
small and micro companies: 58.5% versus 83.3%-84.1% for medium-sized and large companies. Small
and micro companies are also less concerned with environmental requirements and certification
(40.7%) (Table 22).
Table 22: Drivers by company size (user perspective) (n=239-241)
Large companies
Medium-sized companies
Small and micro-
companies Total
n=47-48 n=137-139 n=53-54 n=17
Internal drivers
Increase throughput 83.3% 84.1% 58.5% 78.2%
Reduce production lead time 83.3% 84.9% 70.4% 81.3%
Reduce time to market 62.5% 62.6% 66.7% 63.5%
Reduce production cost 91.7% 94.2% 81.5% 90.9% Improve workforce/employee productivity and efficacy
85.4% 89.9% 77.8% 86.3%
Reduce the consumption of energy and materials 70.8% 80.6% 70.4% 76.3%
Improve the quality of products and services 95.8% 90.6% 85.2% 90.5%
Produce new products 75.0% 76.3% 75.5% 75.8%
External drivers
Approach new markets 52.1% 66.9% 63.0% 63.1%
Differentiate from competitors 58.3% 72.7% 70.4% 69.3%
Respond to safety requirements/certification 70.2% 63.8% 50.0% 61.9%
Tackle environmental requirements/certification 62.5% 55.5% 40.7% 53.6%
Address other certification requirements 52.1% 47.1% 37.0% 45.8%
Note: Scale 0 (no objective) – 1 (objective)
Source: Own analysis

63
The most important drivers for SMEs to invest in AMT are to reduce production costs (90.7%) and to
improve the quality of products and services (89.1%) (Figure 18). For large companies (<2 000 em-
ployees), the most important driver is to improve the quality of products and services (95.8%). Ap-
proaching new markets and standing out from competitors seem to be more important for SMEs
compared to large companies. Drivers related to certification, safety and environmental require-
ments are also more frequently identified by large companies.
Figure 18: Drivers by company type (user perspective) (n=239-241)
Note: Scale 0 (no objective) – 1 (objective)
Source: Own analysis
3.4.2.4 Findings related to company performance
Respondents with a high share of sales produced using AMT (81-100%) indicated more frequently
that increased throughput and tackling environmental requirements/certification are drivers for in-
vestment in AMT, while they less frequently indicated that reduction of production lead time and
reduction of time to market are drivers (see Table 23). Increased throughput is less frequently an
internal driver for companies with a share of sales of 21-80% than for other companies.

64
Table 23: Drivers by performance (user perspective) (n=213-215)
0-20% 21-80% 81-100% Total
n=76-77 n=110-111 n=26-27 n=213-215
Internal drivers Increase throughput 80.5% 74.5% 84.6% 77.9% Reduce production lead time 80.5% 85.6% 70.4% 81.9% Reduce time to market 59.7% 65.8% 55.6% 62.3% Reduce production cost 90.9% 91.9% 85.2% 90.7% Improve workforce/employee productivity and efficacy 83.1% 86.5% 88.9% 85.6% Reduce the consumption of energy and materials 74.0% 74.8% 77.8% 74.9% Improve the quality of products and services 87.0% 88.3% 100.0% 89.3% Produce new products 76.3% 75.7% 74.1% 75.7% External drivers Approach new markets 61.0% 60.4% 66.7% 61.4% Differentiate from competitors 68.8% 67.6% 77.8% 69.3% Respond to safety requirements/certification 57.1% 62.7% 66.7% 61.2% Tackle environmental requirements/certification 49.4% 51.8% 55.6% 51.4% Address other certification requirements 42.9% 44.5% 44.4% 43.9%
Note: Scale 0 (no objective) – 1 (objective)
Source: Own analysis
3.5 Barriers to the adoption of AMT
3.5.1 General findings
Figure 19 provides an overview of the various barriers to investing in AMT. The most important bar-
rier was the high cost of investment for AMT acquisition and the lack of financial resources (74.3%).
Between 52.3 and 57.7% of the respondents indicated difficulties in assessing the performance and
business return, the lack of skilled personnel required to integrate and use AMT and market uncer-
tainty and turbulence. Less frequent barriers were the inadequacy of the technologies in terms of
customer requirements and needs and the personnel reduction implied by the introduction of it
(25.1%).
As with the drivers, the barriers to invest in AMT can also be divided into internal and external barri-
ers. Internal barriers refer to internal factors companies can influence directly and actively decide
upon. External barriers refer to external factors that take place outside the company, resulting from
developments outside the company and upon which the company itself has little influence. Figure 19
shows that, compared to the drivers, the barriers for users to investment in AMT are more evenly
distributed between internal and external barriers. The most important barrier - high cost and financ-
ing - is an external barrier, while the least important barriers are internal to the company.

65
The producers indicated that lack of skilled personnel to integrate and use AMT and market uncer-
tainty and turbulence are the most important barrier for their customers/users e.g. 74.3-75.0% (see
Figure 20). Table 24 provides a more detailed overview of the differences between users and pro-
ducer perspectives regarding their users. Producers, compared to users, more frequently think that
the introduction of AMT is a barrier as it implies personnel reduction (41.2% versus 23.7%). Lack of
skilled personnel to integrate and use AMT, market uncertainty and turbulence, and the cultural and
organisational reluctance of employees/operators to accept AMT are also thought by producers to
be more important barriers to investment (about their customers/users) than by the users them-
selves.

66
Figure 19: Barriers to the adoption of AMT (user perspective) (n=213-219)
Note: Scale 0 (no barrier) – 1 (barrier)
Source: Own analysis

67
Figure 20: Barriers to the adoption of AMT (producer perspective regarding users) (n=34-36)
Note: Scale 0 (no barrier) – 1 (barrier)
Source: Own analysis

68
Table 24: Differences in barriers: users’ own and producers’ perspective on them (n=247-255)
Users12
Producers Difference
n=213-219 n=34-36
Internal barriers
AMT is not adequate to customer requirements and needs 25.1% 25.7% -0.6%
AMT is not enough mature yet 34.2% 41.7% -7.5%
The service/assistance guaranteed to customers is not adequate 25.7% 25.7% 0.0%
Difficulty to assess the performance of AMT and its business return 56.5% 61.1% -4.6%
The introduction of AMT as it implies personnel reduction 23.7% 41.2% -17.5%**
The introduction of AMT as it implies significant organisational change
38.1% 47.1% -9.0%
External barriers
Impossibility to integrate the AMT into customers’ current processes (i.e. due to standards/process incompatibility)
39.2% 47.1% -7.9%
Lack of skilled personnel to integrate and use AMT 57.7% 75.0% -17.3%** Difficulty to meet safety, environmental and other requirements associated to AMT
26.3% 26.5% -0.2%
Lack of standards for AMT 32.4% 34.3% -1.9%
Market uncertainty and turbulence 52.3% 74.3% -22.0%** High cost of investment for AMT acquisition and lack of financial resources
74.3% 72.2% 2.1%
Cultural and organisational reluctance of employees/operators to accept AMT
32.4% 54.3% -21.9%**
Note: Scale 0 (no barrier) – 1 (barrier)
Note: * significant at the 1% level, ** significant at the 5% level, *** significant at the 10% level
Source: Own analysis
From a producer’s perspective, the main factors hindering the supply of AMT to additional customers
were marketing-related e.g. the lack of access to potential customers (53.5%), accompanied by the
lack of resources to more actively reach out to customers (51.2%). A lack of knowledge about market
dynamics was not really perceived to be a major barrier, as only 27.9% of the producers identify it as
such.
12
The respondents who indicated that they are both user and producer of advanced manufacturing equipment and tech-nologies were asked to fill in the questionnaire from a user perspective.

69
Figure 21: Barriers to supply of AMT (producer perspective) (n=42-43)
Note: Scale 0 (no barrier) – 1 (barrier)
Source: Own analysis
3.5.2 Specific findings
3.5.2.1 Technology/AMT specific findings
Similar to the drivers, the barriers to investing in advanced manufacturing activities are also analysed
according to high performance, ICT-enabled or sustainable manufacturing technologies13
(see Table
25). Their inadequacy when meeting customer requirements and needs is more frequently a barrier
for ICT-enabled (28.7%) than for high performance technologies (22.6%). The same applies to some
external barriers such as the impossibility to integrate AMT into customers’ current processes and a
lack of skilled personnel to integrate and use AMT. Respondents who indicated that ICT-enabled
technologies are highly relevant more frequently encounter a lack of skilled personnel to integrate
and use AMT (59.6%) than those who indicated that sustainable manufacturing technologies are
highly relevant (51.8%). Companies with highly relevant sustainable manufacturing technologies en-
counter more frequently the impossibility of integrating the technology into customers’ current pro-
cesses (40.9%) and the difficulty to meet safety, environmental and other requirements associated
with AMT (27.7%) compared to companies with highly relevant high performance technologies (re-
spectively 37.3% and 23.9%).
13
Only respondents that answered highly relevant e.g. 4 or 5 on a scale of 1 (low) to 5 (high relevance) are considered in this analysis.

70
Table 25: Differences in barriers by AMT (user perspective) (n=151)
High performance
ICT-enabled
Sustainable
n=163-168 n=92-94 n=112-117
Internal barriers AMT is not adequate to customer requirements and needs 22.6% 28.7% 25.6%
AMT is not mature enough yet 34.7% 30.9% 37.6% The service/assistance guaranteed to customers is not adequate
23.4% 23.4% 28.4%
Difficulty to assess the performance of AMT and its business return
57.3% 57.0% 58.8%
The introduction of AMT as it implies personnel reduction 22.4% 22.8% 26.3%
The introduction of AMT as it implies significant organisational change
35.2% 36.6% 39.5%
External barriers
Impossibility to integrate the AMT into customers’ current processes (i.e. due to standards/process incompatibility)
37.3% 39.4% 40.9%
Lack of skilled personnel to integrate and use AMT 55.8% 59.6% 51.8% Difficulty to meet safety, environmental and other requirements associated to AMT
23.9% 25.0% 27.7%
Lack of standards for AMT 31.3% 29.0% 34.8%
Market uncertainty and turbulence 53.0% 53.8% 52.2% High cost of investment for AMT acquisition and lack of financial resources
74.4% 69.5% 69.2%
Cultural and organisational reluctance of employees/ operators to accept AMT
31.3% 33.7% 36.3%
Note: Scale 0 (no barrier) – 1 (barrier)
Source: Own analysis
3.5.2.2 Findings related to location
Table 26 provides an overview of the various barriers to investment in AMT, based on the location of
company headquarters. High cost of investment for AMT acquisition and lack of financial resources is
more frequently a barrier for Western and Eastern European countries (95.5% and 81.3%) than for
the other regions. A large share of the Western European companies indicated difficulties in as-
sessing the performance of AMT and their business return (71.4%) while this was less frequently an
issue for Eastern, Central and Northern European countries (50.8%-46.2%). 71.4% of Western Euro-
pean countries considered market uncertainty and turbulence a barrier, which was greater compared
to other regions.

71
Table 26: Differences in barriers by location (user perspective) (n=166-172)
Central Europe
Western Europe
Northern Europe
Southern Europe
Eastern Europe
COSME
non-EU14
Total
n=59-62 n=21-23 n=13 n=48-49 n=15-16 n=8-9 n=166-172
Internal barriers AMT is not adequate to customer requirements and needs
34.4% 30.4% 30.8% 30.6% 12.5% 22.2% 29.8%
AMT is not mature enough yet
33.9% 30.4% 38.5% 34.7% 31.3% 22.2% 33.1%
The service/assistance guaranteed to customers is not adequate
32.8% 13.0% 15.4% 25.0% 31.3% 33.3% 26.5%
Difficulty to assess the performance of AMT and its business return
50.8% 71.4% 46.2% 59.2% 50.0% 62.5% 56.0%
The introduction of AMT as it implies personnel reduction
22.0% 22.7% 23.1% 16.3% 31.3% 62.5% 23.4%
The introduction of AMT as it implies significant organisational change
41.7% 22.7% 15.4% 41.7% 56.3% 37.5% 38.3%
External barriers Impossibility to integrate the AMT into customers’ current processes (i.e. due to standards/process incompatibility)
33.3% 39.1% 23.1% 55.1% 31.3% 44.4% 40.0%
Lack of skilled personnel to integrate and use AMT
55.0% 50.0% 53.8% 50.0% 53.3% 66.7% 53.3%
Difficulty to meet safety, environmental and other requirements associated to AMT
23.3% 18.2% 23.1% 33.3% 31.3% 62.5% 28.1%
Lack of standards for AMT
26.7% 19.0% 38.5% 37.5% 50.0% 50.0% 33.1%
Market uncertainty and turbulence
52.5% 71.4% 46.2% 49.0% 60.0% 50.0% 53.9%
High cost of investment for AMT acquisition and lack of financial resources
65.6% 95.5% 76.9% 69.4% 81.3% 75.0% 73.4%
Cultural and organisa-tional reluctance of em-ployees/operators to accept AMT
23.3% 40.9% 23.1% 37.5% 33.3% 87.5% 33.7%
Note: Scale 0 (no barrier) – 1 (barrier)
Source: Own analysis
14
Only a limited number of responses were obtained from COSME countries which are not part of the EU. Therefore, this region was not further analysed in detail.

72
3.5.2.3 Findings related to company size
Table 27 provides an overview of the barriers to investing in AMT between various company sizes.
Small and micro companies more frequently indicated that AMT are not appropriate to customer
requirements and needs (35.4%) than medium-sized companies did. Assessing the performance and
business return of AMT seems more challenging for small and micro companies compared to medi-
um-sized companies. Small and micro companies encounter more hindrance from lack of skilled per-
sonnel to integrate and use AMT (64.6%) than other companies (53.7% and 56.5%).
Table 27: Differences in barriers by company size (user perspective) (n=211-217)
Large companies
Medium-sized companies
Small and micro- companies
Total
n=41-42 n=122-127 n=46-48 n=211-217
Internal barriers
AMT is not adequate to customer requirements and needs
31.0% 19.7% 35.4% 25.3%
AMT is not mature enough yet 38.1% 31.5% 39.6% 34.6% The service/assistance guaranteed to customers is not adequate
26.2% 22.2% 35.4% 25.9%
Difficulty to assess the performance of AMT and its business return
43.9% 55.6% 70.2% 56.6%
The introduction of AMT as it implies personnel reduction
23.8% 24.2% 21.3% 23.5%
The introduction of AMT as it implies significant organisational change
23.8% 41.9% 38.3% 37.6%
External barriers Impossibility to integrate the AMT into customers’ current processes (i.e. due to standards/process incompatibility)
40.5% 36.8% 43.8% 39.1%
Lack of skilled personnel to integrate and use AMT
53.7% 56.5% 64.6% 57.7%
Difficulty to meet safety, environmental and other requirements associated to AMT
21.4% 25.4% 34.0% 26.5%
Lack of standards for AMT 45.2% 25.4% 40.4% 32.7%
Market uncertainty and turbulence 50.0% 54.0% 47.8% 51.9% High cost of investment for AMT acquisition and lack of financial resources
76.7% 72.2% 78.7% 74.5%
Cultural and organisational reluctance of employees/operators to accept AMT
26.2% 32.8% 36.2% 32.2%
Note: Scale 0 (no barrier) – 1 (barrier)
Source: Own analysis

73
SMEs and large companies (<2 000 employees) indicated that high cost of investment for AMT acqui-
sition and lack of financial resources is the main barrier to adopting AMT (Figure 22). SMEs, as op-
posed to large companies, more frequently think that the difficulty of assessing the performance of
AMT and their business return is a barrier (59.6% versus 43.9%). The lack of skilled personnel and the
introduction of AMT, in that it implies significant organisational change, are perceived to be more
important barriers for SMEs than for large companies. The lack of standards for AMT is more fre-
quently perceived as a barrier for large companies as compared to SMEs (45.2% versus 29.6%).
Figure 22: Differences in barriers by company type (user perspective) (n=211-217)
Note: Scale 0 (no barrier) – 1 (barrier)
Source: Own analysis

74
3.5.2.4 Findings related to company performance
For companies with a low share of sales produced by using AMT (0-20%), the following barriers are
important: high cost of investment for AMT acquisition and lack of financial resources (87.7%); the
difficulty to assess the performance of AMT and their business return (65.8%); and the lack of skilled
personnel to integrate and use AMT (67.1%). On the other hand, the introduction of AMT as it im-
plies personnel reduction, is not considered to be a major barrier by this group of companies (16.7%).
Companies who have a high share of sales produced using AMT (81-100%) have a lower frequency of
external barriers compared to the other two groups, except for the market uncertainty and balance
which occurs more frequently (54.2%). The internal barriers which occur more frequently compared
to the other two groups are those related to the maturity of AMT (42.3%) and the barrier related to
personnel reduction implied by the introduction of AMT (28.0%).
Table 28: Differences in barriers by performance (user perspective) (n=202-207)
0-20% 21-80% 81-100% Total
n=70-73 n=105-108 n=24-26 n=202-207
Internal barriers
AMT is not adequate to customer requirements and needs
30.1% 21.3% 16.0% 23.8%
AMT is not mature enough yet 34.2% 34.6% 42.3% 35.4%
The service/assistance guaranteed to customers is not adequate
25.0% 27.8% 16.0% 25.4%
Difficulty to assess the performance of AMT and its business return
65.8% 54.3% 52.0% 58.1%
The introduction of AMT as it implies personnel reduction
16.7% 25.9% 28.0% 22.9%
The introduction of AMT as it implies significant organisational change
32.4% 42.6% 28.0% 37.3%
External barriers
Impossibility to integrate the AMT into customers’ current processes (i.e. due to standards/process incompatibility)
46.6% 35.5% 28.0% 38.5%
Lack of skilled personnel to integrate and use AMT 67.1% 57.9% 40.0% 58.9%
Difficulty to meet safety, environmental and other requirements associated to AMT
28.2% 26.4% 20.0% 26.2%
Lack of standards for AMT 35.2% 32.1% 24.0% 32.2%
Market uncertainty and turbulence 49.3% 52.8% 54.2% 51.7%
High cost of investment for AMT acquisition and lack of financial resources
87.7% 68.5% 65.4% 74.9%
Cultural and organisational reluctance of employees/operators to accept AMT
37.1% 34.3% 12.5% 32.7%
Note: Scale 0 (no barrier) – 1 (barrier)
Source: Own analysis

75
3.6 Capacity to overcome barriers related to the adoption of AMT
3.6.1 General findings
An overview of the readiness to overcome various barriers to the adoption of AMT is provided in
Figure 23. Readiness is measured on a scale from 1 (not ready) to 5 (well mastered). There is little
difference between the capacity to overcome several barriers or the readiness of companies to over-
come these barriers. On average, users consider themselves medium ready to overcome the barriers
to adopting AMT: access to skilled human resources that can operate AMT (3.1), access to technology
services provided notably by research and technology organisations, consulting, etc (3.0) and access
to financial resources (3.0). There are also no large differences between the users’ perspective on
readiness and the producer perspective (on users) (see Figure 24). There is clearly room to enhance
the readiness of users in several domains so that they become more ready to adopt AMT.
Figure 23: Average readiness by AMT (user perspective) (n=219-222)
Note: Scale 1 (Not ready) – 5 (Well mastered)
Source: Own analysis
Figure 24: Average readiness by AMT (producer perspective regarding users) (n=34-36)
Note: Scale 1 (Not ready) – 5 (Well mastered)
Source: Own analysis

76
Figure 25 provides more insight into the specific response behaviour, indicating a reverse U-shaped
response where the largest share of respondents indicate they are medium ready to overcome chal-
lenges.
Figure 25: Distribution of readiness by AMT (user perspective) (n=219-222)
Note: Scale 1 (Not ready) – 5 (Well mastered)
Source: Own analysis
Producers on average feel they have mastered a general understanding of technological dynamics in
the field and an understanding of technological opportunities resulting from the application of AMT
(average score of about 4 on a scale from 1 to 5). They have least mastered access to relevant inter-
mediary organisations of users like associations and chambers (2.3). Apparently, it is not straightfor-
ward for producers to gain access to intermediary organisations of users.
Figure 26: Average readiness by AMT (producer perspective) (n=37)
Note: Scale 1 (Not ready) – 5 (Well mastered)
Source: Own analysis

77
3.6.2 Specific findings
3.6.2.1 Technology/AMT specific findings
As with the drivers and barriers, the readiness to invest in AMT of respondents who indicated that
high performance, ICT-enabled or sustainable manufacturing technologies are highly relevant15
to
their company is also analysed. Companies where high performance technologies are relevant on
average have a higher readiness to cooperate with other users of AMT (2.9) than companies with
ICT-enabled (2.9) and sustainable manufacturing technologies (2.9). Overall, high performance manu-
facturing technologies companies are on average more ready to overcome challenges than compa-
nies active in ICT-enabled and sustainable manufacturing technologies.
Table 29: Average readiness by AMT (user perspective) (n=154)
High performance
ICT-enabled Sustainable
n=167-170 n=94-96 n=116-118
Access to skilled human resources that can operate AMT 3.2 3.1 3.2 Access to pilot facilities/demonstrators to test the potential of AMT
2.9 2.9 2.9
Access to financial resources (e.g. loans, innovation grants, etc.)
3.1 3.1 3.1
Cooperation with other AMT developers/providers 3.0 3.0 2.9
Cooperation with other users of AMT 2.9 2.9 2.9 Access to technology services provided notably by research and technology organisations, consulting companies or other competence centres
3.0 3.0 3.0
Note: Scale 1 (Not ready) – 5 (Well mastered)
Source: Own analysis
3.6.2.2 Findings related to location
All regions think that they are medium ready to access skilled human resources who can operate
AMT. With regard to accessing pilot facilities/demonstrators to test the potential of technologies,
companies in Northern Europe consider themselves on average more ready than others (3.1). Cen-
tral, Southern and Eastern European companies on the other hand are on average medium ready to
access financial resources (2.7, 2.9 and 2.9) while other regions indicate a lower readiness. Central
European companies indicate a lower readiness towards the cooperation with other users (2.7) than
those in other regions (which are on average medium ready). Southern and Eastern European com-
panies excel in overcoming the barrier to cooperating with other AMT developers and providers (3.1
and 3.1), which may be explained by the fact that cooperating in the supply chain is one way to face
the challenges related to a lack of internal critical mass.
15
High relevance: respondent indicated 4 or 5 on a scale of 1 (low) to 5 (high relevance).

78
Table 30: Average readiness by location (user perspective) (n=169-172)
Central Europe
Western Europe
Northern Europe
Southern Europe
Eastern Europe
COSME
non-EU16
Total
n=61-62 n=22-23 n=13 n=47-49 n=16-17 n=8 n=169-172
Access to skilled human resources that can operate AMT
3.1 3.1 3.6 3.2 3.0 2.9 3.1
Access to pilot facilities/ demonstrators to test the potential of AMT
2.7 2.5 3.1 2.9 2.9 3.0 2.8
Access to financial resources (e.g. loans, innovation grants, etc.)
3.0 2.5 2.5 3.1 2.9 3.6 2.9
Cooperation with other AMT developers/providers
2.8 2.8 2.9 3.1 3.1 3.9 3.0
Cooperation with other users of AMT
2.7 2.9 2.9 2.9 3.3 3.4 2.9
Access to technology services provided notably by research and technology organisations, consulting companies or other competence centres
2.8 2.9 2.9 3.1 3.3 3.1 3.0
Note: Scale 1 (Not ready) – 5 (Well mastered)
Source: Own analysis
3.6.2.3 Findings related to company size
Large companies are on average more ready to access skilled human resources to operate AMT (3.3)
and access pilot facilities/demonstrators to test the potential of AMT (3.0). Small and micro compa-
nies on the other hand, have on average a higher readiness to cooperate with other AMT develop-
ers/providers (3.2) and other users of AMT (2.9).
16
Only a limited number of responses were obtained from COSME countries which are not part of the EU. Therefore, this region was not further analysed in detail.

79
Table 31: Average readiness by company size (user perspective) (n=217-220)
Large
companies Medium-sized
companies
Small and micro-
companies Total
n = 44-45 n = 125-127 n = 46-47 n = 217-220 Access to skilled human resources that can operate AMT
3.3 3.0 3.2 3.1
Access to pilot facilities/ demonstrators to test the potential of AMT
3.0 2.8 2.8 2.8
Access to financial resources (e.g. loans, innovation grants, etc.)
3.1 3.1 2.6 3.0
Cooperation with other AMT developers/providers
2.8 2.9 3.2 2.9
Cooperation with other users of AMT 2.8 2.8 2.9 2.8
Access to technology services provided notably by research and technology organisations, consulting companies or other competence centres
3.0 2.9 3.0 3.0
Note: Scale 1 (Not ready) – 5 (Well mastered)
Source: Own analysis
Large companies are on average more ready to overcome barriers to the adoption of AMT than
SMEs, where the only exception is the barrier related to cooperation with other AMT develop-
ers/providers (see Figure 27). SMEs evaluate their capacity to overcome the barriers access to pilot
facilities and demonstrators to test the potential of AMT and access to skilled human resources to
operate AMT at a lower level than large companies do.
Figure 27: Average readiness by company type (user perspective) (n=217-220)
Note: Scale 1 (Not ready) – 5 (Well mastered)
Source: Own analysis

80
3.6.2.4 Findings related to company performance
Respondents with a high share of sales produced using AMT (81-100%) are on average more ready to
overcome barriers to the adoption of AMT than respondents with a low share of sales (0-20%). All
readiness factors are above 3 for the first group of respondents, while none of the readiness factors
is above 3 for the latter group of respondents. Clearly companies with more experience with AMT
evaluate their capacity to overcome barriers to the adoption of AMT as less critical.
Table 32: Average readiness by performance (user perspective) (n=208-210)
0-20% 21-80% 81-100% Total n=73-74 n=109-111 n=26 n=208-210 Access to skilled human resources that can operate AMT
2.7 3.2 3.7 3.1
Access to pilot facilities/demonstrators to test the potential of AMT
2.5 2.9 3.4 2.8
Access to financial resources (e.g. loans, innovation grants, etc.)
2.6 3.1 3.4 2.9
Cooperation with other AMT developers/providers
2.8 2.9 3.4 2.9
Cooperation with other users of AMT 2.7 2.9 3.3 2.8 Access to technology services provided notably by research and technology organisations, consult-ing companies or other competence centres
2.7 3.1 3.4 3.0
Note: Scale 1 (Not ready) – 5 (Well mastered)
Source: Own analysis
81
3.7 Conclusion from the quantitative analysis
The most important driver of AMT investment by users is financial and refers to the need to reduce
production costs. Equally important, however, is the aim to improve the quality of products and
services and to improve the productivity and efficacy of employees. These drivers are rather inno-
vation and HR-related issues in contrast to more traditional competitive arguments that drive pro-
ducers, e.g. further development of existing product portfolio or specific requests from existing or
potential customers and customer associations.
Internal drivers are more frequently indicated as drivers to invest in AMT as compared to external
drivers. Distinguishing between three main types of AMT (e.g. High performance manufacturing
technologies, ICT-enabled technologies and sustainable manufacturing technologies), few differences
in drivers for users to invest in AMT can be identified. For the users active in ICT-enabled and sus-
tainable manufacturing technologies, only the drivers “reduce the consumption of energy and mate-
rials” and “tackle environmental requirements/certification” are significantly more important.
Certain regions also show a difference in main objectives to invest in AMT. For example, for 90% of
respondents located in Western Europe, the ability to approach new markets by investing in AMT is
an important driver. Contrarily, only 46% of respondents located in Central Europe identified this as
an important driver. For companies in Western and Southern Europe, the objective of being able to
stand out from competitors is an important driver to invest in AMT, while for companies in Central,
Northern and Eastern Europe this is only the case for about 60% of the respondents. The difference
in the importance awarded to the driver “tackle environmental requirements/certification” between
Eastern (73%) versus Northern Europe (25%) is also remarkable.
The main barrier for users to adopting AMT is the “high cost of investment for AMT acquisition and
lack of financial resources”. When asking producers what they consider to be the most important
barriers for their users when adopting AMT the “cost of investment” ranks in second place, while
“market uncertainty and turbulence” is judged to be the most important barrier. Users identify the
“difficulty to assess the performance of AMT and their business return to be an important barrier
while producers tend to underestimate the importance of this barrier for their users. Vice versa,
producers identify the barrier “introduction of AMT as it implies personnel reduction” as important
for their users, while for users, this is the least important barrier to adopting AMT.
For the producers, the most important barriers to adopting AMT are the “development of new
business options based on existing technological competence” and “possible long-term market
opportunity”. Distinguishing between three main types of AMT, it seems that respondents active in
ICT-enabled technologies and sustainable manufacturing technologies face more barriers compared
to respondents active in high performance manufacturing technologies.
Regions tend to differ in the barriers they face to adopt AMT. For example, the internal barrier
“AMT is not appropriate to customer requirements and needs” is not important for Eastern Europe
(0%), while it is of importance to the other regions. The barrier “the service/assistance guaranteed to
customers is not adequate” is not important for Northern and Western European respondents (9%

82
resp. 14%), while it is of moderate importance to the other regions. “Impossibility to integrate the
AMT into customers’ current processes (i.e. due to standards/process incompatibility)” is judged to
be an important barrier in Southern Europe while it is of less importance to Central and Northern
Europe. “Market uncertainty and turbulence” is of high importance in Western Europe while it is
considered of medium importance to Northern European respondents.
While the drivers for adopting AMT are quite similar for users and producers when considering
their customers, several barriers are perceived differently by both groups of respondents.
The capacity of users to overcome barriers to the adoption of AMT can be considered average. In
their evaluation of their capacity to overcome several barriers, the users feel they do not master the
capacity to overcome barriers to the adoption of AMT very well. The producers feel well prepared
to overcome the challenges related to the “understanding of technological opportunities resulting
from the application of AMT” and “general understanding of technological dynamics in the field”.
They are less well prepared to “access relevant intermediary organisations of users like associations
and chambers” and “access additional markets”. The readiness to overcome certain barriers differs
slightly for the three main types of AMT (high performance manufacturing technologies, ICT-enabled
technologies and sustainable manufacturing technologies). In particular, the barrier to cooperating
with users and developers/providers of AMT seems more difficult to overcome for respondents ac-
tive in ICT-enabled technologies and sustainable manufacturing technologies.
Northern European respondents seem to be better at overcoming the barrier to accessing pilot
facilities/demonstrators to test the potential of AMT. On the other hand, Western and Northern
European respondents struggle most to get access to financial resources. Southern European re-
spondents excel in overcoming the barrier to cooperation with other AMT developers/producers.
The most important driver for SMEs to invest in AMT is to reduce production costs, while the most
important driver for large companies (<2 000 employees) is to improve the quality of products and
services (user perspective). Both types of company see the high costs of investment for AMT acquisi-
tion and lack of financial resources as the main barrier to the adoption of AMT. The difficulty in as-
sessing the performance of AMT and their business return, as well as the lack of skilled personnel,
prove to be more important barriers for SMEs as compared to large companies. SMEs are also less
ready to overcome barriers to the adoption of AMT. Especially with regard to access to pilot facili-
ties and demonstrators to test the potential of AMT, SMEs evaluated their capacity to overcome
this barrier as significantly lower compared to large companies (<2 000 employees).
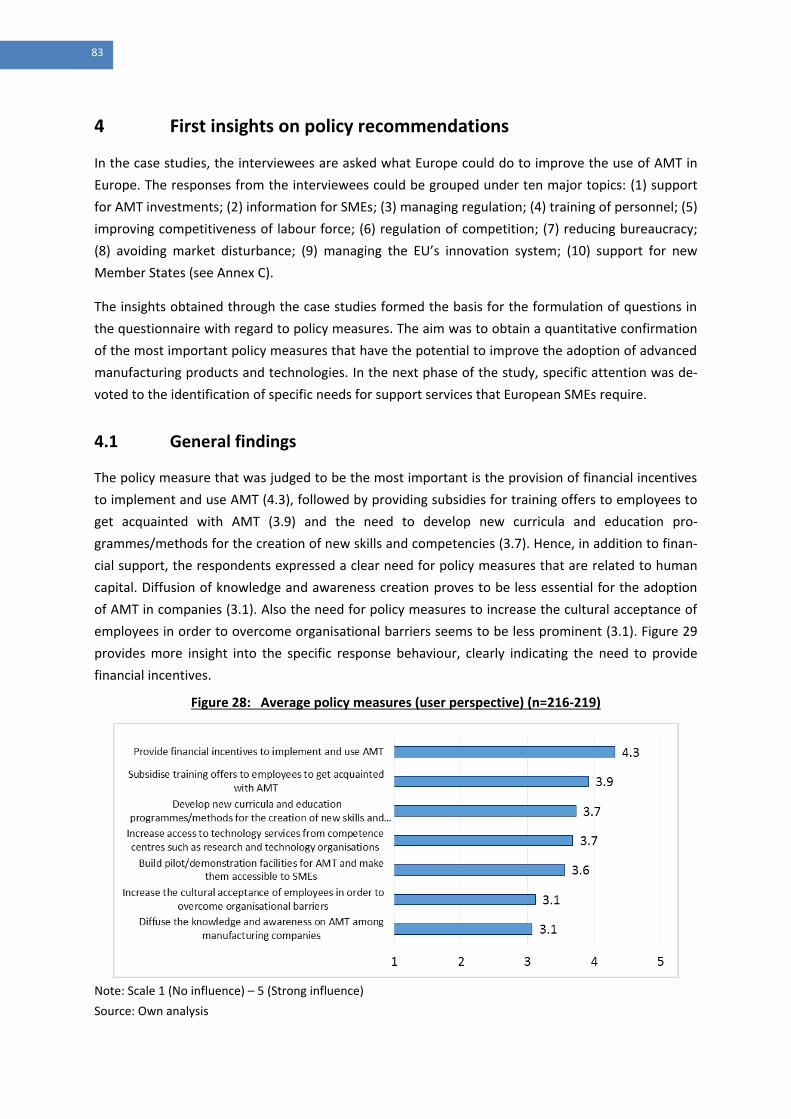
83
4 First insights on policy recommendations
In the case studies, the interviewees are asked what Europe could do to improve the use of AMT in
Europe. The responses from the interviewees could be grouped under ten major topics: (1) support
for AMT investments; (2) information for SMEs; (3) managing regulation; (4) training of personnel; (5)
improving competitiveness of labour force; (6) regulation of competition; (7) reducing bureaucracy;
(8) avoiding market disturbance; (9) managing the EU’s innovation system; (10) support for new
Member States (see Annex C).
The insights obtained through the case studies formed the basis for the formulation of questions in
the questionnaire with regard to policy measures. The aim was to obtain a quantitative confirmation
of the most important policy measures that have the potential to improve the adoption of advanced
manufacturing products and technologies. In the next phase of the study, specific attention was de-
voted to the identification of specific needs for support services that European SMEs require.
4.1 General findings
The policy measure that was judged to be the most important is the provision of financial incentives
to implement and use AMT (4.3), followed by providing subsidies for training offers to employees to
get acquainted with AMT (3.9) and the need to develop new curricula and education pro-
grammes/methods for the creation of new skills and competencies (3.7). Hence, in addition to finan-
cial support, the respondents expressed a clear need for policy measures that are related to human
capital. Diffusion of knowledge and awareness creation proves to be less essential for the adoption
of AMT in companies (3.1). Also the need for policy measures to increase the cultural acceptance of
employees in order to overcome organisational barriers seems to be less prominent (3.1). Figure 29
provides more insight into the specific response behaviour, clearly indicating the need to provide
financial incentives.
Figure 28: Average policy measures (user perspective) (n=216-219)
Note: Scale 1 (No influence) – 5 (Strong influence)
Source: Own analysis

84
Figure 29: Distribution policy measures (user perspective) (n=216-219)
Note: Scale 1 (No influence) – 5 (Strong influence)
Source: Own analysis
Producers’ opinion regarding policy measures that could motivate/enable their customers to intro-
duce AMT into their companies was also sought. Again, the need to provide financial incentives re-
ceived the highest score (4.3). The necessity to subsidise training offers to employees in order to get
them acquainted with AMT was also acknowledged as important (3.9). Policy measures designed to
stimulate the construction and accessibility of pilot and demonstration activities for SMEs are judged by
producers to be more important than users judge them to be. This may be due to the fact that users do
not always fully understand the benefits of pilot and demonstration activities. The difference is, how-
ever, not statistically significant as shown in Table 33.

85
Figure 30: Average policy measures (producer perspective regarding users) (n=35-36)
Note: Scale 1 (No influence) – 5 (Strong influence)
Source: Own analysis
Table 33: Difference in policy measures: user versus producer perspective (n=35-216)
Users17
Producers Difference
n=216-219 n=35-36 Diffuse the knowledge and awareness on AMT among manufacturing companies
3.1 3.3 -0.2
Build pilot/demonstration facilities for AMT and make them accessible to SMEs
3.6 3.7 -0.1
Provide financial incentives to implement and use AMT
4.3 4.3 -0.02
Subsidise training offers to employees to get acquainted with AMT
3.9 3.9 0
Develop new curricula and education programmes/methods for the creation of new skills and competences on AMT
3.7 3.5 0.2
Increase access to technology services from competence centres such as research and technology organisations
3.7 3.4 0.3*
Increase the cultural acceptance of employees in order to overcome organisational barriers
3.1 3.1 0.04
Note: Scale 1 (No influence) – 5 (Strong influence)
Note: * significant at the 1% level, ** significant at the 5% level, *** significant at the 10% level
Source: Own analysis
17
The respondents who indicated that they are both user and producer of advanced manufacturing equipment and tech-nologies were asked to fill in the questionnaire from a user perspective.

86
4.2 Specific findings
4.2.1 Technology/AMT specific findings
As with the drivers and barriers to invest in AMT, the possible policy measures by respondents who
indicated that high performance, ICT-enabled or sustainable manufacturing technologies are highly
relevant18
for their company were also analysed. As can be seen from Table 34, there is little differ-
ence between the desired policy measures for all three types of AMT. The provision of financial in-
centives to implement and use AMT is ranked number one in all three groups of technologies (re-
spectively 4.4, 4.5 and 4.4 for high performance, ICT-enabled and sustainable manufacturing tech-
nologies).
Table 34: Average policy measures by AMT (user perspective) (n=92-169)
High performance
ICT-enabled Sustainable
n=166-169 n=92-95 n=113-115
Diffuse the knowledge and awareness on AMT among manufacturing companies
3.1 3.3 3.1
Build pilot/demonstration facilities for AMT and make them accessible to SMEs
3.7 3.8 3.7
Provide financial incentives to implement and use AMT
4.4 4.5 4.4
Subsidise training offers to employees to get acquainted with AMT
4.0 4.0 4.0
Develop new curricula and education pro-grammes/methods for the creation of new skills and competences on AMT
3.8 3.9 3.9
Increase access to technology services from competence centres such as research and technology organisations
3.8 3.7 3.9
Increase the cultural acceptance of employ-ees in order to overcome organisational barriers
3.2 3.3 3.3
Note: Scale 1 (No influence) – 5 (Strong influence)
Source: Own analysis
18
Highly relevant: respondent indicated 4 or 5 on a scale of 1 (low) to 5 (high relevance).

87
4.2.2 Findings related to location
All regions indicate that the need to provide financial incentives to implement and use AMT is im-
portant. The need to subsidise training offers to employees in order to get them acquainted with
AMT also receives high scores in all regions, with the exception of Central Europe where this policy
measure is judged slightly less important compared to other regions. Policy measures to develop new
curricula and education programmes/methods for the creation of new skills and competences on
AMT are important for Eastern (4.12) and Northern European (3.92) companies.
Table 35: Average of policy measures by location (user perspective) (n=167)
Central Europe
Western Europe
Northern Europe
Southern Europe
Eastern Europe
COSME non-
EU19
Total
n=62 n=22 n=13 n=45 n=17 n=8 n=167
Diffuse knowledge and awareness on AMT among manufacturing companies
2.5 3.5 3.0 3.4 3.9 3.6 3.1
Build pilot / demon-stration facilities for AMT and make them accessible to SMEs
3.4 3.6 3.7 3.8 3.9 3.6 3.6
Provide financial incentives to adopt and use AMT
4.3 4.5 4.3 4.5 4.4 3.8 4.4
Subsidise training offers to employees to get acquainted with AMT
3.7 4.2 4.1 3.9 4.3 3.9 3.9
Develop new curricula and programmes / methods for the crea-tion of new skills and competences on AMT
3.6 3.8 3.9 3.7 4.1 3.9 3.7
Increase access to technology services from competence cen-tres such as research and technology organi-sations
3.6 3.5 3.4 3.6 4.2 3.6 3.7
Increase the cultural acceptance of employ-ees in order to over-come organisational barriers
3.0 3.2 2.5 3.4 3.4 3.9 3.2
Note: Scale 1 (No influence) – 5 (Strong influence)
Source: Own analysis
19
Only a limited number of responses were obtained from COSME countries which are not part of the EU. Therefore, this region was not further analysed in detail.

88
In addition, policy measures that can increase access to technology services from competence cen-
tres such as research and technology organisations, consulting companies, etc. prove to be valuable
to stimulating Eastern European companies (4.24) to adopt AMT. The higher ranking of this specific
policy measure by companies located in Eastern Europe might be caused by the fact that the range of
competence centres offering these services is more limited in these countries. Companies located in
Northern Europe place less value on policy measures to increase the cultural acceptance of employ-
ees in order to overcome organisational barriers (2.54).
4.2.3 Findings related to company size
When considering the company size, all the respondents indicated that policy measures that provide
financial incentives to implement and use AMT would strongly influence their ability to introduce
these technologies in their company. Subsidies for training offers in order for employees to get ac-
quainted with AMT is estimated to be a strong influence for large companies (4.1), but is considered
to be a smaller influence for medium-sized companies (3.8). Small and micro companies indicated
that they would strongly benefit from all policy measures, with the exception of policy measures that
stimulate the diffusion of knowledge and awareness of AMT among manufacturing companies (3.3)
and that increase the acceptance of employees in order to overcome organisational barriers (3.2).
Table 36: Average of policy measures by company size (user perspective) (n=215)
Large
companies
Medium-sized
companies
Small and micro
companies Total
n=43 n=124 n=46 n=215
Diffuse the knowledge and awareness on AMT among manufacturing companies
3.0 3.0 3.3 3.1
Build pilot/demonstration facilities for AMT and make them accessible to SMEs
3.7 3.4 3.8 3.6
Provide financial incentives to implement and use AMT
4.6 4.3 4.2 4.3
Subsidise training offers to employees to get acquainted with AMT
4.1 3.8 4.0 3.9
Develop new curricula and education pro-grammes/methods for the creation of new skills and competences on AMT
3.8 3.7 3.8 3.7
Increase access to technology services from competence centres such as research and technology organisations
3.9 3.6 3.7 3.7
Increase the cultural acceptance of employees in order to overcome organisational barriers
3.2 3.1 3.2 3. 1
Note: Scale 1 (No influence) – 5 (Strong influence)
Source: Own analysis

89
4.2.4 Findings related to company performance
Analysing policy measures that would motive companies to introduce AMT in their company from a
performance perspective provides similar insights compared to previous sections. Again, policy
measures that provide financial incentives to implement and use AMT are considered to have a
strong influence. This is more pronounced in the group of companies that have a percentage of sales
between 81-100% (4.4) and the ones which have a share between 0-20% (4.4). Policy measures that
stimulate training offers to get employees acquainted with AMT are also judged to have a strong
influence. Here, the influence is more pronounced in the group of companies that have a percentage
of sales between 81-100% (3.8 versus 3.8 and 3.6 in the other two groups).
Table 37: Average of policy measures by company (user perspective) (n=208)
0-20% 21-80% 81-100% Total
n=75 n=107 n=25 n=208 Diffuse the knowledge and awareness on AMT among manufacturing companies
3.1 3.0 3.5 3.1
Build pilot/demonstration facilities for AMT and make them accessible to SMEs
3.5 3.7 3.3 3.6
Provide financial incentives to implement and use AMT 4.4 4.3 4.4 4.3 Subsidise training offers to employees to get acquainted with AMT
3.9 3.9 4.1 3.9
Develop new curricula and education pro-grammes/methods for the creation of new skills and com-petences on AMT
3.6 3.8 3.8 3.8
Increase access to technology services from competence centres such as research and technology organisations
3.6 3.7 3.7 3.7
Increase the cultural acceptance of employees in order to overcome organisational barriers
3.0 3.2 2.9 3.1
Note: Scale 1 (No influence) – 5 (Strong influence)
Source: Own analysis

90
5 Overall conclusion from the quantitative and qualitative analyses
Financial considerations play a pivotal role as a barrier to adopt AMT as confirmed in the qualitative
and the quantitative findings. The high costs of investing in AMT and the difficulty of assessing the
business return are regarded as important barriers to the adoption of these technologies. At the
same time, financial considerations are also a major driver to invest in AMT for users with a view to
reducing the production costs. This driver is equally important for both large companies and SMEs.
The second most important driver for adopting AMT is human capital related. Investing in AMT is
seen as instrumental to improving productivity and efficacy in the workplace. A related barrier, how-
ever, is the need for skilled personnel with the right qualifications and specific competencies. A lack
of skilled personnel prevents companies from acquiring new technologies; although when properly
operated, they could result in optimised processes. For micro companies, human capital-related mo-
tives are seen as a barrier rather than a driver.
Thirdly, users of advanced manufacturing equipment and technologies tend to invest in it in order
to improve the quality of their products and services. This is an equally important driver for both
large companies and SMEs. When the demand situation is favourable, AMT are used to increase ca-
pacity or improve process performance. A major barrier here, however, is market uncertainty and
turbulence. The European market is currently regarded as passive, while increasing competition is
now experienced by players active in Asian countries. Producers of AMT, however, see market uncer-
tainty and turbulence as the most important barrier for their customers, indicating that there is still a
lack of stable momentum in industrial modernisation.
The need for standards or a response to specific requirements and certification issues is seen as
less important by users of AMT. It is not regarded as an important driver, nor is it considered to be a
major barrier for either large companies or SMEs. This conclusion is also confirmed by the qualitative
analysis.
In general, internal drivers of investment in AMT are more frequently mentioned than external
drivers, indicating that there is positive motivation through observed benefits of advanced manufac-
turing as a business model, rather than a passive adaptation to external market developments. The
perception of producers is quite well aligned with the position of users. The main drivers are nearly
all internal drivers, while the main barriers are mainly external and linked to a lack of resources.
Considering the three types of AMT, high performance manufacturing technologies are rated more
important than ICT-enabled and sustainable manufacturing technologies. It seems that investment in
ICT-enabled and sustainable manufacturing technologies faces more barriers than investment in
high performance manufacturing technologies. In particular, respondents who indicated that ICT-
enabled technologies are highly relevant, more frequently encountered a lack of skilled personnel to
integrate and use AMT. They also faced more difficulty integrating the technology into their current
customers’ processes. Within the three types, no single technology is considered really important,
but rather a group of technologies is, which points towards the multidisciplinary character of indus-
trial applications and the need to integrate various KETs.

91
The analysis reflects the various stages of market development among Member States. While
Western European companies see AMT as a suitable means to access new markets and differentiate
themselves from competitors, this effect is less pronounced in Central, Northern and Eastern Europe.
Southern European companies consider differentiation from competitors a more important driver
than the ability to approach new markets. Western and Southern European companies view the diffi-
culty of assessing the performance of AMT and their business return as the most important internal
barrier, whereas high investment costs and a lack of financial resources are considered to be the
most important external barriers for Western and Eastern European companies. Western and South-
ern European companies seem to have a wider strategic, external view when investing in new AMT.
The quantitative analyses revealed more differences across the various European regions compared
to the qualitative analyses where no significant differences were identified.
On average, users consider themselves to be medium ready to overcome barriers related to the
adoption of AMT. The producers, on the other hand, master the capacity to overcome barriers re-
lated to understanding technological opportunities and associated dynamics quite well. They feel
less comfortable in accessing additional markets and relevant intermediary organisations of users.
Overall, high performance manufacturing technologies companies are on average more ready to
overcome challenges than ICT-enabled and sustainable manufacturing technology-active companies.
Southern European companies seem to be more ready to cooperate with other AMT developers and
providers, while Eastern European companies are more ready to cooperate with other users of AMT
compared to companies in other European regions.
In line with our findings, policy support appears to be welcome in three main areas. Firstly, the pro-
vision of financial incentives to implement and use AMT is important to enable companies to em-
brace AMT. Secondly, subsidies for training of employees to get acquainted with AMT and support to
new curricula and programmes for the creation of new skills and competences are essential to foster
the introduction of AMT in European companies. Thirdly, policy measures that aim to stimulate ac-
cess to additional markets and relevant intermediary organisations of users might help producers to
overcome these barriers. These insights were further detailed into specific targeted policy measures
and practical recommendations regarding the adoption of advanced manufacturing products and
technologies in the next phase of the study.

92
6 Next steps
The qualitative and quantitative analyses provide some insights into specific needs for developing
support services that European SMEs require. For example, the firm-level questionnaire points to-
wards specific support services that address the needs of SMEs. For SMEs, it is often quite difficult to
identify the pilot facility or demonstrator that can help them to bring their technology/product to the
market. In order to help SMEs to gain access to state-of-the-art facilities, the European Commission
has mapped technological service centres active in the field of Key Enabling Technologies20
. Other
initiatives offer one-stop shop access to SMEs to support them in gaining access to infrastructure,
equipment, services and assistance. ACTPHAST, for example, serves as a unique one-stop shop for
supporting photonics innovation by European companies21
. It supports and accelerates the innova-
tion capacity of companies by providing them with direct access to the expertise and state-of-the-art
facilities of Europe's leading photonics research centres (the ACTPHAST Partners), enabling compa-
nies to exploit the commercial potential of applied photonics. A similar initiative in the area of AMT
might help SMEs to overcome some barriers identified in this study. This will be further explored in
the next phase of the study.
SMEs also seem to struggle with assessing the performance of AMT and their business return, in ad-
dition to finding skilled personnel. A regional initiative in Flanders (Belgium), called Made Different,
has been created to address these issues, amongst others22
. The aim of the Made Different action
plan is to strengthen Flanders' manufacturing industry and make it a world leader in AMT. One of its
activities is to offer specific guidance to manufacturing companies to turn themselves into agile, high-
tech organisations. Seven transformations are identified, including human centred production as
employees are recognised as a significant asset for anchoring production locally (see box 1).
Box 1: Seven transformations of the Made Different programme23
- Transformation 1: World Class Manufacturing Technologies consists of improving and inno-
vating machines and productive equipment
- Transformation 2: End-to-end Engineering aims at increasing value along the different stag-
es of value chains
- Transformation 3: Digital Factory addresses the introduction of the digital world in factories
- Transformation 4: Human centred Production aiming at skills and knowledge development
- Transformation 5: Production Network focuses on the improvement of the networks that
surround companies: suppliers, partners, etc.
- Transformation 6: Eco Production addresses the products´ life cycle and looks for solutions
to improve the reuse and recycling of materials and products
- Transformation 7: Smart Production Systems aspires at improving companies´ capacity of
response to changes in demand
20
https://ec.europa.eu/growth/tools-databases/ketsobservatory/kets-ti-inventory/map 21
http://www.actphast.eu/ 22
http://www.madedifferent.be/en/ 23
http://www.madedifferent.be/en/projects/7-transformations-en

93
In addition to access to knowledge, SMEs are often also in need of additional financial means to
adopt AMT. The ActPhast initiative, for example, provides up to €80 000 for SME projects and up to
€40 000 for large companies24
. The European Commission has also launched a call (INNOSUP-03-
201725
) with the objective of establishing one-stop shop access for SMEs to technology services
and/or facilities from a network of technology infrastructures in the field of advanced manufacturing
for clean production. In addition, it aims to use the established network to enable SMEs to integrate
innovative AMT for clean production into their production process and make informed decisions for
further investment. The call foresees award grants to SMEs with a maximum of €60 000 (full costs
not covered).
In the next phase of the study, information on best practices such as the UK Catapult Centre on high
value manufacturing, the German AiF/IGF system for joint industrial research between SMEs and the
example mentioned in Box 2 will be explored, allowing the consortium to describe which business
support services are required for EU companies to adopt AMT and which type of organisations are
best suited to provide these services.
Box 2: Example of company training in the area of advanced manufacturing equipment26
B. Braun is one of the world’s leading manufacturers of medical devices. It faced a skills gap in its
existing workforce as increasingly sophisticated equipment was introduced into plant operations.
The company reviewed the key competencies that workers require in order to understand the
theory of how the equipment works and the principles that govern production line operations in
an advanced manufacturing plant. These competencies include mechanical, electrical, hydraulic
and pneumatic functions.
The company set up a highly innovative programme to train the existing workforce in the use and
operation of advanced manufacturing equipment. A Progression-Based System (PBS) was intro-
duced to make sure that all employees receive basic training in each of these functional areas. The
underlying strategy behind the PBS is to train all workers in these core competencies and then
help the employee learn to apply this theoretical background to the operation, maintenance and
repair of equipment in the plant. Training is divided into five levels: entry, basic, intermediate,
comprehensive and advanced (with a master’s level under development). The expectation is that
each employee will advance to the comprehensive level. All training was initially provided by a
local vocational school but has since then been expanded to include the local community colleges
as well. PBS has allowed B. Braun to retrain and upskill its employees, and the better skilled work-
force has, in turn, helped the company reduce its operating and maintenance costs. The pro-
gramme is now being introduced to other B. Braun facilities in the US.
24
http://www.actphast.eu/ 25
http://ec.europa.eu/research/participants/portal/desktop/en/opportunities/h2020/topics/6088-innosup-03-2017.html 26
http://www.areadevelopment.com/advanced-manufacturing/Q2-2016/Best-Practices-Advanced-Manufacturing-Culture-454577.shtml

94
The American Small Business Innovation Research Programme (SBIR) and British Small Business Re-
search Initiative (SBRI) were also examined in more detail as they provide insight into how a country
can act as a lead-user in order to promote the adoption and deployment of specific technologies
through both public and private markets. Both the SBIR and the SBRI follow a demand-driven ra-
tionale based on key public agencies’ missions, which are related to concrete market opportunities.
Firstly, a feasibility study is conducted, then direct R&D support is brought to the small businesses.
The third stage aims at technically supporting the businesses in their search for private investments
and if relevant, connects with public procurement procedures. In the American context, any success-
ful SBIR applicant is granted with a sole contract. The SBIR is an example of an initiative that puts a
country or any public entity/agency in the position of (1) coach, (2) lead user and (3) frame for busi-
nesses to commercialise key technologies27
.
Interesting regional initiatives with regard to the adoption and deployment of AMT were also ex-
plored. For example, the Pays-de-la-Loire region intends to maximise the diffusion of advanced man-
ufacturing techniques towards regional SMEs (see Box 3).
Box 3: Regional initiative in the area of advanced manufacturing techniques28
The Pays-de-la-Loire region has invested €10 million over two years in order to create a “pathway
towards advanced manufacturing for SMEs”. The plan includes awareness raising actions (innova-
tion days, “web is industry” workshop in 2015 during the Web2Day digital festival), funding of
technological diagnostics, training actions and funding of collaborative R&D projects and demon-
strators accessible to regional SMEs. The region has also invested €10 million over the last two
years in order to accelerate the adoption of robots by regional industrial SMEs by creating a “ro-
botisation pathway”. Regional companies can also count on the financial support from the national
public investment bank BPI France that has awarded €1.2 billion of loans under the “Industry of
the Future” programme, which displays a range of four thematic loans:
• “Prêts verts” (green loans) for companies that undertake actions to increase their resource
efficiency;
• “Prêts robotique” (robotics loans) targeting companies which invest in structuring projects
integrating automated production processes, including robots;
• “Prêts pour l'industrialisation” (industrialisation loans) in order to cover material and im-
material spending following the achievement of R&D projects to sustain the industrialisa-
tion and commercialisation of innovative products, processes or services;
• “Prêts numériques” (digital loans) for companies engaged in the digitalisation of processes
to improve competitiveness.
27
Padilla P (2016) Policy learning through strategic intelligence 28
Regional Innovation Report Pays-de-la-Loire (https://ec.europa.eu/growth/tools-databases/regional-innovation-moni-tor/sites/default/files/report/2016_RIM%20Plus_Regional%20Innovation%20Report_Pays%20de%20la%20Loire.pdf)

95
7 Annexes

96
7.1 ANNEX A: Case company descriptions
Table 38: Case company descriptions
Company
code
Basic data Region/
country
User/
producer
AMT investments Drivers/barriers
North 1 - SME
- Family-owned
- Fast growth
from 2000 to
2009
- Financially
doing well
- Main invest-
ments made
in 2003, 2004
and 2009
North/Finland User/Producer Sustainable manufacturing
technology: factory
facilities and sustainable
technology
(2003 and 2009)
- The company heavily invests in sustainability to improve its competitive
edge. Being able to show the customer that the company is capable of oper-
ating very sustainably and convince the customer of its ability to provide
high quality, sustainable products. Productivity and quality of performance
come first, but after this, sustainability is also important to the customer
- Sustainability is an image issue for the customers
- The factory is a very good working environment for the staff
ICT-enabled intelligent
manufacturing technology:
product development
(2004, continuously)
- Flexible automation improves productivity in the heavy manufacturing
industry
- Computer capacity has grown, enabling the development of automation
system flexibility
High performance
manufacturing technology
(not invested)
- The manual assembly process on one-off products is not suitable for auto-
mation. Part production is outsourced to suppliers

97
Company
code
Basic data Region/
country
User/
producer
AMT investments Drivers/barriers
North 2 - Large compa-
ny
- Limited liabil-
ity company
- Fast growth in
2014
- Financially
weak perfor-
mance
- Massive
investments in
2013-2014
North/Finland User High performance
manufacturing technology:
robot lines
- Financial support for research would improve readiness for investing. The
company has previously received EU support
- Production line investments are partly paid, up front, by the customer, as
part of the contract
- The municipality built a direct road from the plant to the harbour in 2013-
2014. A straight train connection would be a great improvement
- The company does not have problems finding staff for production. To some
extent, they train their own staff in robot programming.
- Customer requirements are central drivers. If the customer demands some-
thing, our company invests
- Sufficient payback is a prerequisite for investments
- Sufficient demand is a prerequisite for investment
- Lack of know-how can be a barrier to investing in AMT
- Finding people with experience from the relevant industry for engineering
and product development is challenging in Finland, the company trains new
people and recruits experienced people from abroad
- New standards and certificates with higher requirements add to costs
North 3 - SME
- Family-owned
- Slow growth
after 2009
- Profitability
low
- Main invest-
ments 10-15
years ago,
North/Sweden User High performance
manufacturing technology:
robots
- No external support, invests own company money
- Finding knowledgeable staff is not a problem
- The main objective of investing in automation is to improve the efficiency of
the production process and reduce staffing.
- The central objective of improving the process is pricing pressure from
customers
- The company is not much affected by legislative issues

98
Company
code
Basic data Region/
country
User/
producer
AMT investments Drivers/barriers
additional in-
vestments
yearly
Sustainable manufacturing
technology
- If the financial situation is good, we invest more
- External financial support could help, but so far little has been done to get
this support
- The main objective of investing in environmentally friendly technology is
energy savings
- The problem is assessing whether or not the company can save money on
an investment
East 1 - SME
- Family-owned
- Fast growth
2008–2014
- Solid financing
- Main invest-
ments 2006–
2007, expan-
sion 2013–
2014
East/Hungary User/Producer ICT-enabled intelligent
manufacturing technology:
automation of PCB devel-
opment and manufactur-
ing
- Higher efficiency in our R&D processes
- Development of electronic boards using computers
- Development of products without pilot/model development
- Simulation of complex functions
- Testing and simultaneously improving the quality without any additional
investments
- Achieving high performance improvements in manufacturing our electronic
products
- Automated manufacturing of PCBs
- Programmable manufacturing processes
- Automated quality control
- We offer a much better quality of products for a lower price on the market
- We are much more flexible than before
- Higher quality/lower price
- More efficient manufacturing processes – less waste and scrap

99
Company
code
Basic data Region/
country
User/
producer
AMT investments Drivers/barriers
ICT-enabled intelligent
manufacturing technology:
intelligent calibration lab
- Using the lab improves our financial situation – our better financial situation
is one of the reasons we invested in this equipment
- We are able to develop, produce and calibrate our products – this is why our
customers want to work with us
- This is our unique selling point
- Our lab is our best school
- Higher quality requirements
- All meters have to be calibrated and certified
ICT-enabled intelligent
manufacturing technology:
simulation of development
and manufacturing pro-
cesses
- Flexibility and speed of R&D and manufacturing
- Only some exceptions
- More efficient manufacturing processes – less waste and scrap
ICT-enabled intelligent
manufacturing technology:
GPRS and Bluetooth com-
munication technologies
- Without this technology we would lose our customers
- All suppliers, on the market, offer this technology
- The market requires such data transfer technologies
Sustainable manufacturing
technology: long-life meter
devices
- Because of the high demand for digital meters with low energy consumption
(long-life meters), we invest in the development of new products
High performance
manufacturing technology:
additive manufacturing
technologies – 3D printers
(not invested)
- Too expensive
- There is no subvention in Hungary or in the EU

100
Company
code
Basic data Region/
country
User/
producer
AMT investments Drivers/barriers
East 2 - SME
- Family-owned
- Solid finances
- Growing
- Investing 5–
10% in R&D
yearly
East/Serbia User/Producer High performance
manufacturing technology:
development of welding
and cutting tools which
are compatible with
well-known robot brands
- R&D is a part of a project. We share the development costs with the cus-
tomers
- We are only two to three kilometres away
- We offer our customers continuous availability for maintenance and opera-
tor training
- We offer good quality at a fair price
- Our engineers are ready to learn and adopt their competencies to new
challenges. This allows us great flexibility, not only in R&D, but also in manu-
facturing
- Our automated welding tools improve the process performance of our
customers. Clearly, this is the main reason they invest in this technology
- Our customers want to have a good supplier, who is always there if they
have a problem
ICT-enabled intelligent
manufacturing technology:
GSM communication
technology –
communication between
the developer and the
automated tool
- With this technology we are able to ensure the function of our manufactur-
ing tools, without long disturbances. Thus, this boosts the competitiveness
of our products and our services
- With this communication technology we are learning about the behaviour of
our products, in practical use
- Improvements of maintenance
- The customer wants a production with minimum disturbances. This tech-
nology ensures better control of our tools
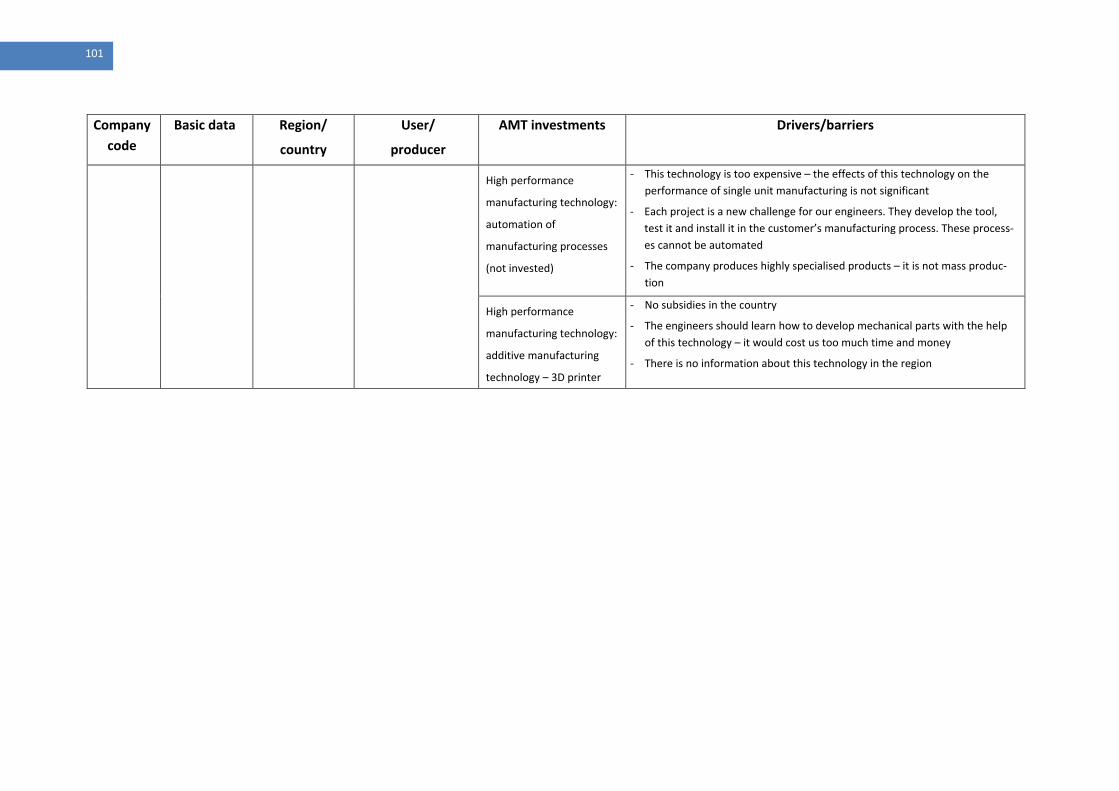
101
Company
code
Basic data Region/
country
User/
producer
AMT investments Drivers/barriers
High performance
manufacturing technology:
automation of
manufacturing processes
(not invested)
- This technology is too expensive – the effects of this technology on the
performance of single unit manufacturing is not significant
- Each project is a new challenge for our engineers. They develop the tool,
test it and install it in the customer’s manufacturing process. These process-
es cannot be automated
- The company produces highly specialised products – it is not mass produc-
tion
High performance
manufacturing technology:
additive manufacturing
technology – 3D printer
- No subsidies in the country
- The engineers should learn how to develop mechanical parts with the help
of this technology – it would cost us too much time and money
- There is no information about this technology in the region

102
Company
code
Basic data Region/
country
User/
producer
AMT investments Drivers/barriers
East 3 - SME
- Privately
owned limited
company
- Solid finances
- Fast growth
between 2010
– 2014
- Invests heavily
in 2013 (about
€1 million in
AMT)
East/Croatia User/Producer ICT-enabled intelligent
manufacturing technology:
Product life cycle man-
agement system
- Because of the need to possess a PLC management system in our company,
we were ready to invest as much as needed. Moreover, we got a subsidy
from the Croatian government that significantly helps our situation
- There is a huge demand for customised products. This technology gives us a
very quick response to demand
- Our managers and engineers are able to follow the whole process (PLC)
using their smart devices. It reduces their reaction time drastically and, of
courses, improves our competitiveness
- Using this technology, we are able to answer important questions from our
customers in real time (e.g. during our meetings) regardless of the location
- This technology enables better management of collaborative workflows
between different competence centres in our company
- At the very beginning of the adoption process, the problem was to find
skilled labourers who could integrate the technology into our existing sys-
tem
- Another issue is motivating our employees to learn. Moreover, a big chal-
lenge has been the adaptation of existing organisational routines and pro-
cesses
- Because we are developing and producing products according to customer
requests, the integration of a digital system that enables design, building,
and management of development and production with greater visibility and
control is a crucial factor for our business. The SAP-software that we have
integrated covers all aspects of product management. It supports us in man-
aging, tracking and controlling all product-related information over the
complete product and asset life cycle. Clearly, it is essential for our work
- This technology provides us with much better quality control, in all phases of
the process. This is also a very important factor for our customers
- Using this technology, we are able to indicate production bottlenecks more
effectively
- Our system is vulnerable to a range of external attacks. However, we are
constantly working on the security of our data

103
Company
code
Basic data Region/
country
User/
producer
AMT investments Drivers/barriers
High performance
manufacturing technology:
additive manufacturing
technologies – 3D printers
- Technology is too expensive. There are no partners who would be ready to
cooperate and co-finance
- There is a lack of demand for products, which would be produced using
additive manufacturing. The reason for this is mainly the cost factor
- Our competitors do not use 3D printers in production, but rather in design
and development
- We do not have any practical experience in using this technology, in our
plant. We would have to invest in developing our engineers’ capabilities,
and it would cost too much time and money
- 3D printers would not significantly improve our production
- The integration of additive manufacturing technology, in our production, is
difficult and too complex
- We see a use for 3D printers in development and design. This is why we are
considering adopting this technology in our development processes
East 4 - SME
- invests heavi-
ly, in 2015
East/Serbia User/Producer High performance
manufacturing technology:
CNC technology
- Demand pull – High demand for machine elements with the highest-
precision components
- These machines provide us with very high development and manufacturing
flexibility, which is the prerequisite for our competitiveness
- We could not produce these components without the CNC machines
- High quality is the most important criterion
ICT-enabled intelligent
manufacturing technology:
computer based develop-
ment and programming of
CNC machines
- This technology improves the flexibility of our development and manufac-
turing processes
- Better linkage between development and manufacturing processes
- Our development and manufacturing have to be compatible with those of
our customers
- The risk of scrap is drastically reduced
- We have far less waste material

104
Company
code
Basic data Region/
country
User/
producer
AMT investments Drivers/barriers
High performance
manufacturing technology:
automation of production
processes
- The technology is too expensive for us
- At this time, we do not see a high demand for mass production of machine
elements with the highest-precision components. Maybe in the near future,
but in that case, we have to work on price reduction to be competitive on
the global market
- Our main advantage is our flexibility in development and production. We
are not competitive in mass production (our prices are higher than those of
Asian manufacturing companies). This is one of the main reasons why we do
not invest in automated manufacturing
- We cannot find enough engineers in the region who could programme and
operate such complex manufacturing systems
South 1 - Large compa-
ny
- Financial
break-even
South/Spain User Investing in AMT (general) - The excessive concentration of sales to a few large customers introduces an
element of risk in increasing productive capacity. Any loss of a single cus-
tomer could compromise the return on investment
- High bureaucracy of applications for European grants for R&D and innova-
tion and low success rates
High performance
manufacturing technology:
industrial robots
- Improve product quality
- Reduce labour costs
- Reduce lead time
High performance
manufacturing technology:
handling systems
- Improve employee safety
- Reduce labour costs
- Reduce lead times
High performance
manufacturing technology:
automated warehouse
management
- Improve employee safety
- Reduce labour costs
- Reduce delivery times
- Avoid mistakes in goods identification

105
Company
code
Basic data Region/
country
User/
producer
AMT investments Drivers/barriers
High performance
manufacturing technology:
ICTs applied to machinery/
production control
through computers, and
mobile devices –
smart phones
- Provide complete remote control of the factory flow and machinery to
production and maintenance managers
Sustainable manufacturing
technology: control system
for shutdown of machines
-
South 2 - SME
- Family-owned
- Good financial
situation
- Growing
South/Spain User/Producer High performance
manufacturing technology:
factory facilities
- This is going to enable growth for several years. As part of this investment,
the production facilities are planned for a very high standard of technology
to be demonstrated to customers and to be effective and flexible in their
own production
High performance
manufacturing technology:
production automation
(not invested)
- Although the company is a producer of highly automated production
equipment, it has made only limited investments in automation, in its own
production
- The main reasons for this are its type of production and how production is
organised in the value chain
- First, the products are customised (one-off) products with limited oppor-
tunity for repetition or economies of scale
- In production, the company focuses on assembly, and the part production is
to a large extent outsourced to a highly devoted supplier network
- The assembly work is to a large extent manual
South 3 - SME
- Good financial
situation
- Growing
South/Spain User/Producer Sustainable manufacturing
technology: sustainable
manufacturing technology
and logistics
- Increased capacity
- Safety is the first issue
- Very important in our company because of our culture
- Need to be up-to-date and remain competitive

106
Company
code
Basic data Region/
country
User/
producer
AMT investments Drivers/barriers
South 4 - Large compa-
ny
- Listed compa-
ny
- Growing
turnover
- Company
return grow-
ing since 2013
South/Italy User High performance
manufacturing technology:
industrial robots/handling
systems
- Adopted and running in practice
High performance
manufacturing technology:
automated warehouse
management systems
- Adopted and running in practice
High performance
manufacturing technology:
additive manufacturing
- Adopted and running in practice
- This technology is, currently, only in use as a prototyping phase. The com-
pany is very interested in exploring its advantages in the production phase
as well
ICT-enabled intelligent
manufacturing technology:
VR/simulation in product
design
- Conducted some tests
- The company has carried out a project for the introduction of these tech-
nologies but results have not been exciting in terms of experienced ad-
vantages. Consequently, these technologies are not adopted in practice
- There are multiple reasons. The first one is of a cultural type. The company
has a deep, lean manufacturing culture and tradition. Lean manufacturing
favours people involvement. This is done by using a wide set of manage-
ment/organisation instruments, which are supported by paper documents
as a tool, enabling information sharing and intra-organisational dialogue.
Thus, digital tools are not immediately suited to lean manufacturing practic-
es, at least with the concept of company culture
- The second reason is that the background of the company derives from
“times and methods” practices. Thus, people do not have competencies ca-
pable of appreciating and using digital tools
- Finally, some experiences were recently gained with simulation, but they did
not provide a positive result

107
Company
code
Basic data Region/
country
User/
producer
AMT investments Drivers/barriers
ICT-enabled intelligent
manufacturing technology:
supply chain management
with suppliers/customers
- Adopted and running in practice
- Interesting experiences with electronic Kanban, with suppliers
- The current system needs additional work for updating information. One of
the main barriers experienced is the cultural readiness of people (both in
the company and in supplier companies) to understand and change their
operation processes accordingly
ICT-enabled intelligent
manufacturing technology:
enterprise resource
planning
- Adopted in practice
Sustainable manufacturing
technology: dry pro-
cessing/minimum lubrica-
tion
- Adopted
Sustainable manufacturing
technology: combined
cooling, heating and power
- The company has established a partnership with its energy provider, for the
installation of a co-generation system to minimise heating costs of the man-
ufacturing/assembly processes. Through this solution, the company is also
able to sell energy, in the network
High performance
manufacturing technology:
technologies for safe
human‐machine
cooperation (not adopted)
- The company is currently exploring the viability and advantages of such
technologies. There are ongoing projects on man-machine cooperation, for
assembly operations
High performance
manufacturing technolo-
gies: processing alloy
construction materials
(not adopted)
- Not applicable with the present process

108
Company
code
Basic data Region/
country
User/
producer
AMT investments Drivers/barriers
High performance
manufacturing technology:
processing composite
materials (not adopted)
- At the moment, the company is not using composite materials in its prod-
ucts
High performance
manufacturing technology:
manufacturing micro-
mechanical components
(not adopted)
- Very few micro-mechanical components are used. When employed, compo-
nents are bought from external suppliers
ICT-enabled intelligent
manufacturing technology:
VR/simulation in produc-
tion reconfiguration
(not adopted)
- There are multiple reasons. The first one is of a cultural type. The company
has a deep, lean manufacturing culture and tradition. Lean manufacturing
favours people involvement. This is done by using a wide set of manage-
ment/organisation instruments, which are supported by paper documents
as a tool, enabling information sharing and intra-organisational dialogue.
Thus, digital tools are not immediately suited to lean manufacturing practic-
es, at least with the concept of company culture
- The second reason is that the background of the company derives from
“times and methods” practices. Thus, people do not have competencies ca-
pable of appreciating and using digital tools
Finally, some experience was recently gained with simulation, but it did not
provide an enthusiastic result

109
Company
code
Basic data Region/
country
User/
producer
AMT investments Drivers/barriers
ICT-enabled intelligent
manufacturing technology:
product life cycle man-
agement systems
(not adopted)
- A significant attempt to adopt this technology has been made in the past,
but with negative results. The barrier has mainly been of an organisational
type. In fact, while product development is carried out centrally at the cor-
porate level, logistics and manufacturing operations are at the local level. By
definition, the PLM should integrate all information from design to end-of-
life. However, company organisation makes the integration of such infor-
mation difficult, since product development and manufacturing/logistics are
supported by separate systems that do not communicate. The only link be-
tween the systems is the Bill of Material. Investments needed to integrate
the two systems and the organisational distance in terms of systems and
priorities between the different functions and units make it very complex to
achieve agreement
Sustainable manufacturing
technology: recuperation
of kinetic and process
energy (not adopted)
- The process is not very energy-consuming, except for furnaces. Thermal
insulation has been adopted for this
Sustainable manufacturing
technology: recycling and
waste/disposal manage-
ment technologies
(not adopted)
- Waste and end-of-life products are recycled by external operators. Only
plastic process scraps are re-melted in production. There are difficulties in
employing recycled materials in new products, since regulatory constraints
do not allow the use of contaminated materials for the production of parts
that will have to interact with food
- End-of-life take-back options that could enable remanufacturing practices or
the extraction of spare parts are currently excluded due to the prohibitive
logistical costs and the low core value
Sustainable manufacturing
technology: Sustainable
nanotechnology
(not adopted)
- Nanotechnologies are only employed with some surface finishing treat-
ments (anti-fingerprint, anti-scratch coatings)

110
Company
code
Basic data Region/
country
User/
producer
AMT investments Drivers/barriers
South 5 - SME
- Family-owned
- Economic
situation im-
proving after
the crisis in
2009
- Growth 30%,
in last years
South/Italy User High performance
manufacturing technology:
robot island
- Competition is a relevant driver pushing new investments for differentiation
and innovation. The sector in which the company operates is very concen-
trated and products are nearly commodities. Thus, the risk of losing cus-
tomers due to competitors’ market tactics is very high and AMT might be a
way to differentiate products, processes and services
- In the case of promising technologies, such as industrial robots, the initial
lack of specific competencies in this technology has been a barrier to acqui-
sition. The company suffers from the unavailability of permanent skilled
employees dedicated to research and innovation. Flexible solutions to iden-
tify and introduce these employees, in a sustainable way, would be needed.
In the end, the company has opted to invest in AMT as a new engineer with
expertise in robot programming has been introduced into the workforce
- Performance is normally managed
- Customer requirements are a fundamental driver for the adoption of AMT.
The company constantly researches new applications that could be ad-
dressed using its materials and production capabilities. For this reason, the
R&D manager attends meetings organised by Fab Lab and participates in
creative meetings, organised by networks of entrepreneurs from various
sectors
- Often new customers’ requirements, or the opportunity to offer new solu-
tions, pushes through the acquisition of dedicated production tools, such as
the robotised system that the company has introduced
- Materials regulations are often drivers of product performance (e.g. fire
behaviour) and process improvements
- In a wider perspective, sustainability issues can drive new opportunities for
materials producers. The [product name] material was created to reduce
the big amount of process waste

111
Company
code
Basic data Region/
country
User/
producer
AMT investments Drivers/barriers
Central 1 - SME
West/Netherlands User/Producer Sustainable manufacturing
technology: dry pro-
cessing/minimum lubrica-
tion
- Sufficient demand and willingness to accept new technologies
- Support customers to move forward towards greater efficiency

112
Company
code
Basic data Region/
country
User/
producer
AMT investments Drivers/barriers
Central 2 - SME Central/France User High performance
manufacturing technology
ICT-enabled
manufacturing technology
- Internal resources to reinvest in the adoption and integration of AMT are
scarce in a cost-based competition environment such as the one in which
the company operates. The company is not able to access EU funding oppor-
tunities. Thus, the financial situation is a significant barrier to AMT adoption
- The demand situation, in general, is not a direct driver significantly address-
ing AMT adoption decisions
- Competitive pressure, based on costs, is a driver towards the adoption of
AMT to increase efficiency
- The company’s lack of access to new specialised resources, able to cope
with AMT (technicians, programmers, developers, etc.) and the “culture
shock” technology changes produce among current employees affects AMT
adoption capabilities very negatively
- The need to guarantee constant productivity performance is a barrier to
new technology adoption decisions. The impossibility of assessing ex ante
AMT performance, in the company-specific industrial production context,
generates a high risk that the company is not willing to sustain
- Customer requirements are the trigger for the production of new products
and the adoption of new materials and tools. Flexibility capabilities and the
development of new products for customers are important success factors
in the market in which the company operates. AMT are seen as enablers to
meet market success factors. The example of the innovations made to sup-
port customers’ changing materials is significant. Thus, the demand situa-
tion is an important driver
- The instability of political decisions regarding tax policies and support for
innovation implies additional uncertainty about available resources to be
dedicated to innovation activities. On the other hand, the company is not
perceived as being affected by EU policies in support of innovation and in-
vestments
- AMT adoption decisions do not seem to be directly linked to sustainability
issues
- Together with taxation, the high cost of labour is judged to be a strong
factor hindering the company’s competitiveness and ability to reinvest re-
sources for innovation

113
Company
code
Basic data Region/
country
User/
producer
AMT investments Drivers/barriers
Central 3 - Large compa-
ny
- Growth in the
last five years
Central/UK User/Producer High performance
manufacturing technology:
additive manufacturing
- Major driver behind most decisions: improve our response ability; quite
often investments are made in a competitive context
- A lot of our investments are long-term and we seek IP protection
- We are not usually constrained by our margins, so we seek improvements,
but not just profit maximisation
- Impact of regulations etc. We are not in highly regulated industries, alt-
hough we serve them. Our concern is that regulators don’t overregulate and
that regulations are uniformly enforced
- Long-term investment
Central 4 - SME
- Solid finance
- Moderate
growth
Central/Germany User High performance
manufacturing technology:
investment in press
machine automation
- This was one of our biggest investments over the last five years. We are
investing in automation of our biggest hydraulic-electric press machine
- The main reason for this investment is a reduction in labour costs
- We have higher demand for large batch production. The manual production
of these parts, in this amount, is no longer efficient
- The integration of the automated production system into our manufacturing
process positively influences our competitive situation because, with this
technology, we are able to produce top quality much faster
- Our production employees, in particular the machine operators, do not have
any problem working with automated machines. They are even more satis-
fied, because robots take on the difficult and harmful tasks
- This technology allows us a much higher production speed and quality
- We are able to offer bigger lot sizes and better product quality
- The machine allows us to reduce production failures
- Higher quality requirements
- Integration of these new robots into our manufacturing processes positively
influences our productivity and resource consumption

114
Company
code
Basic data Region/
country
User/
producer
AMT investments Drivers/barriers
ICT-enabled intelligent
manufacturing technology:
simulation in construction
- There is a huge demand for products that are being constructed and manu-
factured using simulation technology
- This technology is making us more competitive in the market, because we
are able to offer such data to our customers
- The integration of this technology into our manufacturing increases the
opportunity to obtain contracts
- The main problem is the lack of competencies within our production
- Our cutting machine operators are not competent to work with the data
produced by our constructors. Thus, we have to invest much in their training
- There is a lack of machine operator (mechanic) employees who are able to
work as ICT workers
- The second problem is the willingness or the motivation of our machine
operators to change their existing routines
- Our human resource management needs new concepts for competency
development, in particular for development and adjustment of competen-
cies of semi-skilled and unskilled production employees, who are directly
working on and with the new automated machines
- This technology enables us to have much greater flexibility in the construc-
tion and production of our tools
- We are able to offer our customers data that enables them to better plan
their production processes
- The integration of new digital technology in our manufacturing process
provides us with better data management. Thus, we are able to manage our
resource consumption, on the one hand, and control our emission of harm-
ful substances into the environment, on the other

115
Company
code
Basic data Region/
country
User/
producer
AMT investments Drivers/barriers
Sustainable manufacturing
technology: smart tech-
nology for linking energy
positions with the aim of
reducing energy costs
- We are saving resources and of course money indirectly
- There is support from the Kreditanstalt für Wiederaufbau bank in Germany
- The main advantage of this process is the minimal loss of energy in our
system
High performance
manufacturing technology:
additive manufacturing
technologies – 3D printers
- Redesigning our production processes would be too expensive
- There is no demand for aluminium products manufactured using 3D print-
ers.
- 3D printed aluminium parts are too expensive. We are working with big lots
and this technology is not adequate, for our manufacturing
- We use cold-forming by impact extrusion in our manufacturing process. 3D
printers would not improve our manufacturing processes at all
Central 5 - SME
- Family-owned
- Moderate 8%
growth
- Invested
heavily, from
2014 – 2015
Central/Germany User High performance
manufacturing technology:
CNC cylindrical grinding
machine
- We have favourable opportunities for external financing
- We have problems with competitive labourers, who are able to work with
this technology. We have to develop our own employees, because we can-
not find adequate workers in the labour market, in our region
- This technology enables us to achieve a higher three micro-meter precision
and thus increases our quality enormously
- The requirements of our customers from the machine sector represent the
main driver for this investment

116
Company
code
Basic data Region/
country
User/
producer
AMT investments Drivers/barriers
ICT-enabled intelligent
manufacturing technology:
3D modelling CAD/CAM
- We have problems with high competitive pressure. The competitors who
are able to produce favourable prices threaten our business
- Our unique selling point is the quality that we are able to offer, with our
high precision technology
- It is really difficult to find new labour in our region that is capable of working
with this technology. Thus, we have to re-qualify our own employees. This
costs too much in time and money
- This technology allows us to programme our machines centrally, controlling
them from our design and construction unit. This improves our processes
significantly
- Our customers send us the documentation for production as digital
CAD/CAM data. We have to be able to work with this data. This was the
main reason for our integrating this technology into our manufacturing pro-
cess
Sustainable manufacturing
technology: LED lighting
- We were able to finance the adoption of this technology from our cash flow
- All high precision machines have their own lighting, installed directly on the
machine, which improves the quality of the work
- The higher quality requirements of our customers from the machine sector,
but also from the automotive sector, represent important drivers for in-
vestments in such technologies. Every single step in quality improvement
and cost saving makes our business more competitive on the market
- This technology enables significant reduction of our energy consumption
and thus, positively influences our competitiveness

117
Company
code
Basic data Region/
country
User/
producer
AMT investments Drivers/barriers
High performance
manufacturing technology:
additive manufacturing
technologies (not made)
- This technology is too expensive and we do not have the demand that
would cover the investment
- We are producing large batch sizes. Thus, 3D printing is not suitable for our
production
- We would not achieve higher competitiveness with this technology, because
our niche is the automotive industry, where we are produce large batches
- We do not have competencies for additive manufacturing
- We are producing large batch sizes. Thus, 3D printing is not suitable for our
production

118
7.2 ANNEX B: Main drivers and barriers identified in the case studies
Table 39: Drivers and barriers related to financial situation
Financial situation
Drivers Internal:
Investing in AMT can improve the financial situation through lower cost and better products
and services
The ultimate goal for any investment is to improve or at least maintain the financial situation in
a changing situation, and this is what is expected from AMT as well
The necessity that causes AMT to stay competitive is a central driver for investment in AMT
External:
External financial support can be a driver for investing in AMT
Financial support for research can improve readiness to invest in AMT
Co-creation and co-financing with customers is a central driver for investing in AMT
Public investment in infrastructure can, as an indirect support, be a driver for investment in
AMT
Barriers
Internal:
- Weak financial situation and poor access to capital markets
- Company does not have the necessary skills and resources to apply for public funding
External:
- Lack of public financial support for AMT investments at a national or EU level
- Complex bureaucracy in applying for public funding
- Lack of opportunity for financial cooperation with customers
- Uncertainty of demand
- Weak payback due to limited impact on processes and performance
- Technology is too expensive

119
Table 40: Drivers and barriers related to demand situation
Demand situation
Drivers External:
Sufficient demand situation is a prerequisite for investment in AMT
The demand situation can be improved through improved customer value. AMT can help to
improve this value, both in products and services
Value for the customer is achieved through high quality products and services. ICT-enabled
technology is part of the product and an enabler of services. Continuous availability for mainte-
nance and training of operators are ICT-enabled services, which can affect how the customers
invest in new technology
Barriers
Internal:
- The demand for products produced using AMT is not strong enough to guarantee the return on
investment in the user organisation
External:
- Limited demand or uncertainty regarding future demand is a barrier to investment. For in-
stance, excessive concentration of sales on a few large customers introduces an element of risk
in increasing productive capacity, as the loss of a single customer could compromise the return
on investment
- Little demand for mass produced products reduces the need and opportunity for automation of
processes

120
Table 41: Drivers and barriers related to competitive situation
Competitive situation
Drivers Internal:
Through the use of AMT, companies can achieve unique product and service characteristics
differentiating them from the competition. In some cases, the AMT can provide a unique selling
proposition, for the company
AMT can improve process performance, improve product and service quality, allow for faster
reaction to customer needs, improve production speed, improve development flexibility and
production processes, etc.
The use of AMT can also allow for more competitive pricing of products and services. In some
cases, AMT can provide both better product or service quality and a lower price than the com-
petition
External:
Introduction of AMT can also be a necessity to keep up with the competition
The use of AMT-like sustainable technology can improve the image of the company. Being able
to show customers that you are able to operate sustainably can convince the customer of your
ability to provide high quality, sustainable products and services
Competitors already possess or can offer services based on AMT
Barriers
Internal:
- Lack of competency to compete in economies of scale reduces the need to automate, and
possibility of, automating processes

121
Table 42: Drivers and barriers related to know-how, competence and skills
Know-how, competence and skills
Drivers Internal:
Internal access to necessary know-how, competence and skills is a driver for implementing new
AMT
AMT can provide data about production, products or services. This is a good opportunity for the
technology provider and users to learn and develop knowledge and competencies.
Training of staff is often necessary, as experienced labour is not available
External:
Providers support users in developing the necessary know-how, competence and skills
Barriers
Internal:
- Lack of trained or experienced labour force in the region
- Lack of managerial know-how regarding new AMT
- Use of new technologies, such as additive manufacturing, requires completely new knowledge
of how to design and produce a product or service. Especially in small companies, the time and
money needed for this investment can be hard to find
- In large companies, the complex organisational situation, with decentralised units in charge of
different products, can become a barrier to the adoption of new technologies. The complexity
of the organisation affects internal communication and decision-making
- Organisational culture and know-how, in the company and in the value network, do not sup-
port implementation of high-tech digital tools. For instance, lean manufacturing involving facto-
ry employees in development can be a barrier to implementation of digital tools
External:
- Lack of engineers in the region

122
Table 43: Drivers and barriers related to process performance
Process performance
Drivers Internal:
Products cannot be produced by other means
AMT can provide increased capacity, compared with traditional means
AMT improve process performance and service levels through higher quality, faster production,
greater flexibility in development and production, higher productivity, etc.
Flexible automation can provide reductions in labour costs and improvements in labour
productivity, in a heavy manufacturing industry
AMT improve the flexibility of both manufacturing and R&D
AMT improve the working environment in the factory. Sustainable technology can improve the
situation both inside and outside the factory
AMT can improve machine usability through improvements in maintenance
AMT provide better communication and linkage between the product development and manu-
facturing processes
AMT improve information management and communication in internal and external processes
AMT provide more freedom for the design of products and services
External:
The growing capacity of computers enables the development of increasingly flexible automa-
tion systems. This is a technical enabler for AM technology, now and in the future
Barriers
Internal:
- The need for constant, undisrupted process performance is a barrier to implementation of new
technology
- Integration of AMT, in existing processes, requires extensive re-engineering and training of
personnel
- Earlier failures to implement a specific technology can become a barrier, even though technol-
ogy develops and the situation changes
- Unreliable technology cannot be introduced into production
External:
- AMT are not suitable for the production (manual assembly, one-of-a-kind) that is not mature
enough or is too expensive in comparison to existing technology
- The technologies are too expensive or the effect on the manufacturing process is insufficient to
cover the extra cost of investment

123
Table 44: Drivers and barriers related to customer requirements
Customer requirements
Drivers Internal:
In small flexible companies, such as the interviewed AMT provider companies, customer re-
quirements and the fulfilment of these requirements are at the core of their business model.
AMT help these suppliers to provide solutions to these requirements through better perfor-
mance of products, better service and product quality and greater price flexibility
AMT provides the means for undisturbed operations in the manufacturing process
AMT enables production of a higher quality at a lower price
External:
Price pressure from customers
Customers requiring new products and services
Customers requiring increased speed of production
Customers requiring high quality of products and services
Customers requiring data transfer technologies
Sustainability is an image issue for customers
Barriers
Internal:
- In mass production of user companies, growing customer requirements are not the main driv-
ers of the adoption of innovative manufacturing technologies

124
Table 45: Drivers and barriers related to legislative, regulation, political situation
Legislative, regulatory and political situation
Drivers External:
Regulation can be a market driver creating new markets for sustainable technology. This can
also be a driver for investment in AMT. For instance, high requirements in terms of technology
can make investment in AMT profitable
Certification and standards provide a platform for a market
Regulation can also push companies to use greener manufacturing technology or to develop
processes
A driver could be the automation of physically heavy tasks, avoiding exposure to dangerous
chemicals, or improving ergonomics or safety
Material regulations are often drivers of product performance (e.g. fire behaviour) and process
improvements
Barriers
Internal:
- Applying for EU subsidies is a bureaucratic process requiring skills and resources that many
SMEs do not possess
External:
- Instability of political decisions regarding tax policies and support for innovation implies addi-
tional uncertainty over available resources to be dedicated to innovation activities
- Old regulations can be a barrier to developing and adopting AMT. For instance, re-usage of
components is, in some areas, still hindered by regulatory issues
- Lack of national support for investing in AMT
- Lack of information about new technology can, in certain regions, be a barrier to investment in
AMT
- Lack of standards for new AMT, such as additive manufacturing

125
Table 46: Drivers and barriers related to sustainability
Sustainability
Drivers Internal:
Sustainability is becoming a new element affecting innovation decisions, in order to pursue
environmental compliance and develop a sustainable image
More efficient manufacturing processes – less waste and scrap
Reduces environmental impact through emission control
Sustainability is an image issue for customers
External:
National support for sustainable technology and investment
Usage of waste and scrap
Barriers
External:
- New standards and certificates, with higher requirements, raise costs
- Difficulties of using recycled materials due to regulatory constraints
- End-of-life take-back options that could enable remanufacturing are excluded due to high
logistical cost and low core value

126
7.3 ANNEX C: Case company comments on EU policy
At the end of the interviews, the interviewees were asked what the EU could do to improve the use
of AMT in Europe. The comments from the interviewees were grouped under ten major topics. These
are:
1) Support for AMT investments;
2) Information for SMEs;
3) Managing regulation;
4) Training of personnel;
5) Improving labour force competitiveness;
6) Regulation of competition;
7) Reducing bureaucracy;
8) Avoiding market disturbances;
9) Managing the EU’s innovation system;
10) Support for new Member States.
1. Support for AMT investments
- At a national and European level, there are few policy support actions in favour of investment
in AMT. In regions like Singapore, the government is making it easier for companies to invest in
automation and in the US, re-industrialisation is supported through public subsidies. If there
were more AMT-friendly policies, Europe would be more competitive than it is today. Industry
would have more support in improving its processes, validating new technologies and invest-
ing in new equipment and technologies.
- European policy supports research and development, but in industry there is a need for invest-
ing in technologies which have been previously validated in labs or industrial environments.
The EU could increase the speed of introducing AMT into companies through labs accessible to
companies at competitive prices, through know-how transmission to companies and through
incentives to invest in new technologies.
- Currently, the majority of European programmes cover technology development until TRL 7.
This is a strong barrier to market for industrial companies that have to supply AMT to manu-
facturers, especially if they are SMEs and they lack sufficient company resources to cover the
required investments. New instruments that contribute to removing this barrier such as Fast
Track to Innovation Pilot projects29
are very welcome.
29
The Fast Track to Innovation (FTI) pilot is a fully-bottom-up measure in Horizon 2020 to promote close-to-the-market innovation activities; it is open to all types of participants (https://ec.europa.eu/programmes/horizon2020/en/h2020-section/fast-track-innovation-pilot).

127
- Incorporation of subsidies in R&D and technological innovation projects, not only up to the
value of the amortisation during the project, but also to the total investment value of new
AMT equipment.
- Delocalisation of EU subsidy management to national or regional entities, while retaining EU
supervision. Some key agents could take up this responsibility at a national level, i.e. the Span-
ish Centre for the Development of Industrial Technology (CDTI – www.cdti.es) is a public or-
ganisation under the Ministry of Science and Innovation, the objective of which is to help
Spanish companies increase their technological profile. This state-owned company was set up
in 1977 and, since then, has financed more than 15 000 technology development projects.
- Too much focus is placed on working together with universities and research institutes,
whereas direct B2B contact can be more fruitful when discussing implementation of new but
proven technologies.
- New demonstration initiatives for SMEs would help companies get in contact with AMT and
prefigure and assess their potentialities, because without this step, the technologies of the fu-
ture will remain a dream for entrepreneurs.
- It is difficult for SMEs to approach universities and research centres, because there is the per-
ception that they are far from the industrial sector and that their research developments are
rarely applicable for the industry.
- It is also difficult to participate in EU projects. First of all, it is difficult for industrial people to
have a broad understanding of all the different formats and instruments and be able to navi-
gate among them. To do this, it is often necessary to employ dedicated consultants to screen
the different options and indicate those most suitable for the company. Even university or re-
search consultants are too expensive to hire for their expertise. Moreover, participation in EU
projects is extremely challenging for SMEs. The submission phase requires documents and de-
tails that are difficult to provide at early stages when the development project has not yet
started. Often, full-time resources are needed to fill out the required documents, preventing
these resources from working on their daily tasks in production which is difficult for small en-
terprises. In this regard, it could be more useful to provide resources and skills rather than
money in order to bring companies closer to research centres and university competencies.
- Another approach, which is found to be very useful, is matching; this entails bringing groups of
people from different sectors and backgrounds together to discuss different topics (e.g. digital
economy, business models, etc.). This works as a networking and cross-fertilisation opportuni-
ty where entrepreneurs are able to make contacts with other entrepreneurs to exchange opin-
ions, discuss novelties and find new opportunities. In this regard, matchmaking, fab-labs and
networking events are seen as useful initiatives for disseminating new visions and competen-
cies across the industry. The marketing orientation of the entrepreneur is the engine for such a
matching activity.
- For a company, it is important that the EU can ensure availability of capital.

128
2. Information for SMEs
- Getting EU grants via national institutions that represent providers of EU subsidies is a huge
problem for manufacturing companies in Croatia as well as in other developing countries, in
the region. However, there is an enormous lack of competencies in these institutions in terms
of designing calls and managing the submitted project proposals. For a country such as Croatia,
the procedures for the approval of grants by European institutions take too long. The situation
surrounding the evaluation of applications, before official funding, is also considered too long.
- SMEs need more information on the possibilities offered by sustainable manufacturing tech-
nologies. They do not know how to improve their manufacturing processes while at the same
time becoming more sustainable.
- SMEs are not well informed of the possibilities of European grants for R&D and innovation.
- There is a lack of institutions that could help with informing SMEs on the possibilities regarding
adoption of AMT. Even if they know about the grants, they do not know how to participate as
there is a lack of knowledge about EU project-writing in the region.
- As for the company, the main problem with EU funds is the intermediary function of consulting
companies, whose function is to supervise and make the processes easier. However, because
of the profitable nature of their work, they are motivated to get as many projects as possible.
In this process, the SMEs do not get enough information on the funding opportunities. The so-
lution to this problem would be to establish more independent local or regional non-profit or-
ganisations that could supervise EU projects for manufacturing SMEs and provide them with
the required information.
3. Managing regulations
- Perseverance is needed in taxation and other public policies. When policies are fluctuating, en-
trepreneurs and managers cannot build their strategic decisions and investments on existing
or planned policies.
- Regulation in Europe is often too strict and impedes the development of new technologies.
Ideally, regulation follows new technological developments and helps companies to comply
with regulatory conditions so that they can compete on equal terms. Administrations should
more rigorously contest non-compliant companies.
- Standards, certification and other qualification procedures should help to improve and assure
products and processes, and differentiate companies that do not comply with these standards
and certifications. Sustainability, environmental regulation and safety are crucial to many Eu-
ropean companies. Especially in the area of sustainable manufacturing technologies, regula-
tion is a market driver.

129
- Companies working illegally without paying taxes, selling without applying VAT, or complying
with different VAT in their home countries, have a clear but uncompetitive advantage. This
needs to be stopped.
- In the field, the RoHS directive and other compliance legislation plays a part. What is needed
and wanted is a level playing field.
4. Training of staff
- Lack of experienced staff is a challenge to all companies, but there are differences in the kind
of expertise that the companies are lacking. While one company lacks export sales personnel,
another company lacks competent engineers. Some companies may require more expertise to
assess investments in AMT. Due to the small number of case companies analysed, we cannot
determine what is causing these variations in staff requirements.
- The EU should make it more attractive for companies to gain access to training programmes.
- Suppliers should receive support to develop good training programmes that allow for the de-
velopment of good techniques for transferring technology to customers.
- Another important topic is the improvement of training and skills, and how policy makers can
support training and education.
5. Improving labour force competitiveness
- Labour force competitiveness is crucial to creating the environment for entrepreneurship and
investment. Creating an environment of efficiency and flexibility in the work force is more im-
portant than cutting salaries. One company stated that local agreements are needed in the la-
bour market.
6. Regulation of competition
- In areas such as gas, electricity and oil, there are problems with companies having a monopo-
listic position in the market. They are reluctant to adopt new technologies and it is difficult for
AMT providers to gain new projects in these sectors. The EU should increase its efforts to work
on regulating the competition.
- Europe should also work on entry barriers to Asian products, which are a problem for Europe-
an companies.
- In Eastern Europe, there is a lack of information on suppliers and potential customers of AMT.
Without good contacts with the local industry, it is hard for SMEs to find customers. There is a
need for more associations or clusters which could organise workshops, seminars and broker-
age events. The EU should invest more in improving this service in these countries.
- EU tax/customs regulation hinders trade and impairs competitiveness for companies in border-
ing countries.

130
7. Reducing bureaucracy
- Another important factor limiting the generation of interesting innovative solutions for com-
panies is the rigidity of the scheme of EU funded projects. EU projects usually last three to four
years. During its development, the project risks becoming technologically obsolete as the
company and the technological environment evolve in these four years. In this regard, the pro-
ject plan may become a major constraint because it is rigid. The contract is often perceived as
a prison, because technology development needs to look to the future and not to be stuck in
the past. For a company not to have the possibility of easily changing project targets and ob-
jectives during development is perceived to be a strong barrier to the effectiveness of Europe-
an funded projects. In order to overcome these barriers, it is suggested that EU projects should
adopt a more flexible modulation system that would enable it to reshape the project concept
at an intermediate point if needed. For example, there could be a mid-term project redesign
option, to rethink objectives and use cases that would simplify any current amendment diffi-
culties.
8. Avoiding market disturbance
- EU support should be easy to apply for. Today it requires too many resources and know-how.
However, there should not be too much support and too many subsidies as they can affect the
competitive situation in the market as large companies with more resources get more financial
support.
9. Managing the EU’s innovation system
- SME’s innovation priorities and problems are well represented by regional and national inter-
mediary institutions and the regional innovation system is seen as working reasonably well.
However, companies believe that the regional system is not sufficiently able to influence Euro-
pean policy. European institutions are perceived as being unstable in their decisions and una-
ble to carry forward precise and coherent political and economic strategies in support of SMEs.
The result is that, for companies adopting AMT, fluctuating taxation policies deeply hinder the
capability to remain competitive and, in particular, to innovate. Moreover, it is perceived that
every improvement gained through efforts towards the adoption of new technologies, lean
production and managerial innovation is absorbed by the increasing fiscal pressure.
- Other important hindering factors for the competitiveness of companies are the different
competitive conditions among different EU countries. Discrepancies in the costs of labour,
commercial policies and forms of protectionism in some countries and European impositions
above national economic affairs seem to undermine the potential for fair competition among
companies in the European market.
- European institutions should go beyond their administrative role and promote policies to cre-
ate a favourable, competitive framework within which companies can invest in AMT. Possible
measures could be the introduction of higher tax credits for innovation and the acquisition of

131
new competencies, the decrease of labour taxation and the addressing of specific territory
needs.
- Furthermore, it is necessary to design actions to introduce SMEs to the opportunities of Euro-
pean funding innovation programmes which are too wide and complicated for SMEs.
10. Support for new Member States
- It is difficult for SMEs from new Member States to find and get customers who are willing to
work and cooperate with them. Companies from developed European countries often have
prejudices against SMEs from developing countries such as Serbia. They doubt that they can
achieve the required quality. The solution involves arranging brokerage events, workshops and
seminars in places such as the Hungarian-Serbian border region.

132
7.4 ANNEX D: Questionnaire used for the case studies
Background
The European Commission considers that the European industry is a leader in production of AMT, but
is lagging behind other world regions in the use of these technologies in its own production process-
es. This interview is part of the project "An analysis of drivers, barriers and readiness factors of Euro-
pean companies for adopting advanced manufacturing products and technologies", funded by the
European Commission. The objective of the project is to find out which factors are driving or slowing
down the diffusion of AMT in the European industry and to make policy recommendations to the EU,
based on the findings. The project is led by Fraunhofer ISI, in Germany, in cooperation with IDEA Con-
sult of Belgium, ITIA of Italy and VTT of Finland.
The results of the interviews, in 15 companies, will be used to create an in-depth understanding of
the drivers of, and barriers to, use of AMT in European industry and to plan for an industry question-
naire. Interview answers from an individual company will not be reported or published without the
express agreement of that company.
In this project, we focus on three main groups of AMT: high performance manufacturing technolo-
gy, ICT-enabled technology and sustainable manufacturing technology. In the interview, we hope
you will consider what all three of these groups mean to your company.
The structure of the interview is based on four parts:
1. Part 1 (on the next page) includes a list of potential AMT. Please take 3-5 minutes to become familiar with them;
2. Part 2 of the interview focuses on your company’s business, on a general level;
3. Part 3 focuses on how your company utilises AMT;
4. Part 4 focuses on input for policy-making.

133
1. Advanced manufacturing technology
In the table below we list a number of AMT. These are the focus of our study, but the list is not exclu-
sive. You may have some other technologies in mind.
Table 47: Relevance of AMT
1. High Performance Manufacturing Technologies
- Industrial robots/handling systems
- Automated warehouse management systems
- Technologies for safe human‐machine cooperation
- Processing alloy construction materials
- Processing composite materials
- Manufacturing micro-mechanical components
- Additive manufacturing
- Other
2. ICT‐Enabled Technologies
- VR/simulation in production reconfiguration
- VR/simulation in product design
- Supply chain management with suppliers/customers
- Product life cycle management systems
- Enterprise resource planning
- Other
3. Sustainable Manufacturing Technologies
- Dry processing/minimum lubrication
- Recuperation of kinetic and process energy
- Control system for shut down of machines
- Combined cold, heat and power (Bi‐/Trigeneration)
- Recycling and waste/disposal management technolo-gies
- Energy efficient technologies
- Sustainable nanotechnology
- Biomanufacturing
- Other

134
2. Business environment
1. Describe your main business, products and services
2. How have market conditions for your products/services changed over the last five years?
3. What are your company’s main competitive means?
a. Economies of scale (low cost due to high volume) a. Low cost of labour b. High automation level
b. High quality niche products c. Flexibility and customisation d. Something else
4. How has the competitive situation developed over the last five years?
5. How has your company’s (business unit’s) financial situation been over the last five years? What
are the main factors affecting the financial situation?
6. On a scale from 1 – 5 (1 = basic level, 3 = average industry level, 5 = leading edge technology),
how would you describe the technological level in your company? Why? a. Product technology b. Production technology c. Use of ICT d. Management support to improve technological level
3. Use of AMT
1. What could be the drivers and barriers for European companies to invest in AMT? a. In High Performance Manufacturing Technologies b. In ICT‐Enabled Technologies c. In Sustainable Manufacturing Technologies
2. How is national and European policy supporting or preventing investment in AMT, in your coun-
try or Europe?
3. What AMT have you invested in and why?
What were the main drivers for investing?
4. What AMT have you decided not to invest in and why?
What were the main barriers to investment?
5. Regarding the investment you already made (see above): how did the following drivers and bar-
riers affect the investment decision?

135
6. Regarding the technology you are interested in but have not yet invested in: How have the fol-lowing drivers and barriers affected the investment decision?
Positive Decision How much did it affect the investment decision? (5
high – 1 low)
Comments
Financial situation
Demand situation
Competitive situation
Know-how, competence and skills
Process performance
Customer requirements
Legislative, regulation, political situation
Sustainability
Other external drivers?
7. Regarding the technology you are interested in but have not yet invested in: How have the fol-
lowing drivers and barriers affected the investment decision?
Negative Decision How much did it affect the investment decision? (5
high – 1 low)
Comments
Financial situation
Demand situation
Competitive situation
Know-how, competence and skills
Process performance
Customer requirements
Legislative, regulation, political situation
Sustainability
Other external drivers?
8. You are also a producer of AMT. Based on your contacts with your clients can you indicate the
dominant drivers and barriers that affected their investment decisions in Europe?
Decision-making How much did it affect the investment decision? (5
high – 1 low)
Comments
Financial situation
Demand situation
Competitive situation
Know-how, competence and skills
Process performance
Customer requirements
Legislative, regulation, political situation
Sustainability
Other external drivers?

136
4. Input to policy-making
1. How does regulation affect your business? a. Standards, certification and other qualification procedures b. Environmental regulation c. Tax framework d. Certification framework e. Regulatory conditions f. Other
2. In which of the abovementioned areas do you think EU or national policy could motivate you to
take additional investment and, if yes, how?
3. What could the EU do to improve the use of AMT in Europe?

137
7.5 ANNEX E: Online questionnaire for AMT users and producers

138

139

140

141

142

143

144
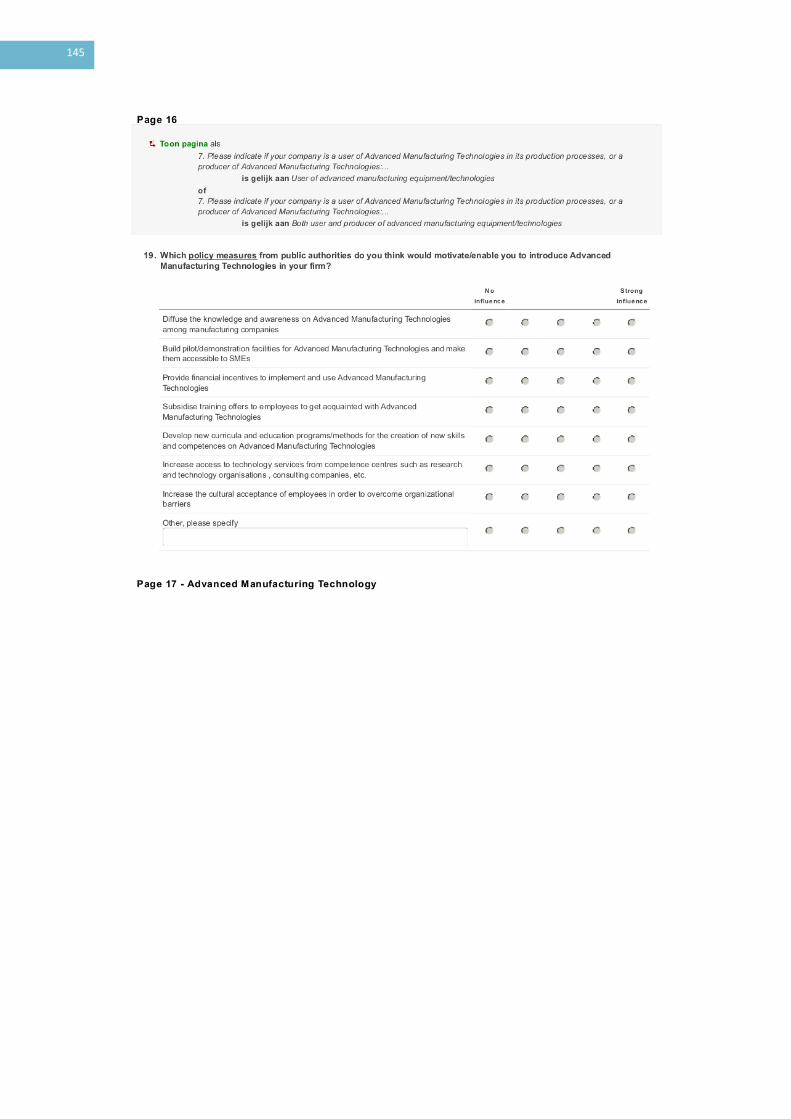
145
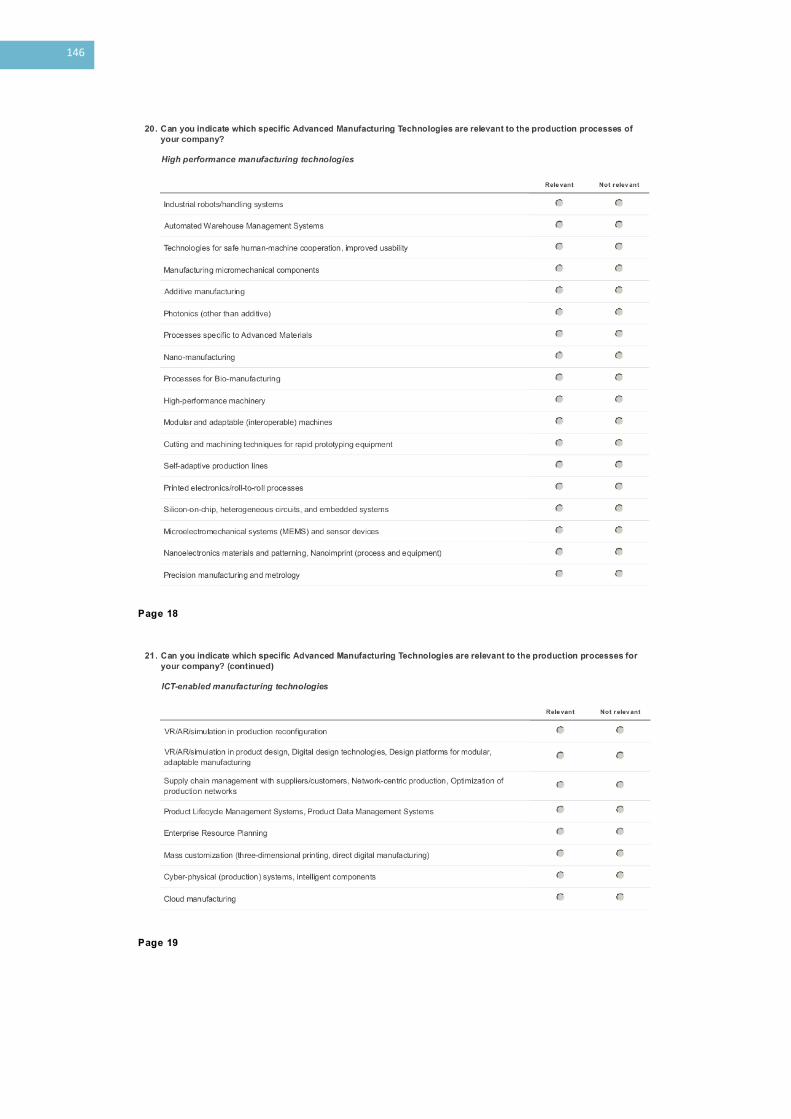
146

147

148