Embed Size (px)
DESCRIPTION
AN analysis of a paper published by Krishna Mazumdar for college purposebyAbha MahapatraXIMB
Citation preview

An Analysis of Causal Flow Between Social Development and Economic Growth: The Social Development IndexAuthor: Krishna MazumdarSource: The American Journal of Economics and SociologyPublished by: American Journal of Economics and Sociology, Inc

Abstract• Whether any causal relation is there between social
development and economic growth• Social development measured by social development index
(weighted composite index formed with eight indicators)• Economic growth indicated by indicated by Per Capita Real
Gross Domestic Product (PCRGDP)• Granger causality test on three group of samples: High,
medium and low income groups

The Literature on Causality• Evidence of relationship between social development and
economic growth has taken four different strands:• That social development is a product of economic growth
• Trickle down approach• That economic growth and social development are two unrelated
events• Zuvekas (1979): Without targeting the poor sections, the economic
growth can severely widen the gap between poor and wealthy• That neither social development nor economic growth is a primary
cause of other, but they are inter dependent• Srinivasan (1977): Can hurt economic growth which, in turn, would
damage future improvement in the basic needs fulfilment• That social development precedes economic growth
• "trickle-up“ effects :"basic needs is not primarily a welfare concept; improved education and health can make a major contribution to increased productivity

Choice Of Suitable Indicators• The standard measure of economic growth is per capita Gross
Domestic product (PCGDP)[Problem of Conversion]• The selection of appropriate indicators to represent social
development: (The Social Development Index)• UPOP: Urban population as percentage of total population• LIFE: Life expectancy at birth• CALO: Calorie supply per capita as a percentage of requirement• INFS: Infant survival rate as per 1000 of live birth• PHYS: Physician per 1000 of population• ADLI: Adult literacy rate as a percentage of total population over
age 15 year• TPRP: Teacher/pupil ratio in primary schooling• PCAR: Passenger cars per 1000 of population

Dividing the Sample• High Income Group: Australia, Austria, Belgium, Canada, Denmark,
Finland, France, Federal Republic of Germany , Hong Kong, Iceland, Italy, Japan, Netherlands, New Zealand, Norway, Singapore Spain, Sweden, United Kingdom, United States of America;
• Middle Income Group: Algeria, Argentina, Barbados, Bolivia, Brazil, Cameroon, Chile, Colombia, Congo, Costa Rica, Cyprus, Dominican Republic, Ecuador, El Salvador, Greece, Guatemala, Guyana, Iran, Iraq, Ireland, Israel, Jordan, Korea Republic, Malaysia, Mauritius, Mexico, Morocco, Panama, Papua New Guinea, Paraguay, Peru, Philippines, Portugal, Suriname, Syrian Arab Republic, Thailand, Trinidad and Tobago, Turkey, Uruguay, Venezuela;
• Low Income Group: Bangladesh, Burundi, Central African Republic, Egypt, Ethiopia, Gambia, Ghana, Guinea, Haiti, Honduras, India, Kenya, Liberia, Malaysia, Malawi, Mozambique, Myanmar, Nicaragua, Niger, Nigeria, Pakistan, Rwanda, Sierra Leone, Sri Lanka, Sudan, Tanzania, Togo, Upper Volta, Zaire, Zambia, Zimbabwe.

Construction of Composite Indices• M variables for n observations:
• Let Yij represent the ith transformed variable for the jth country:
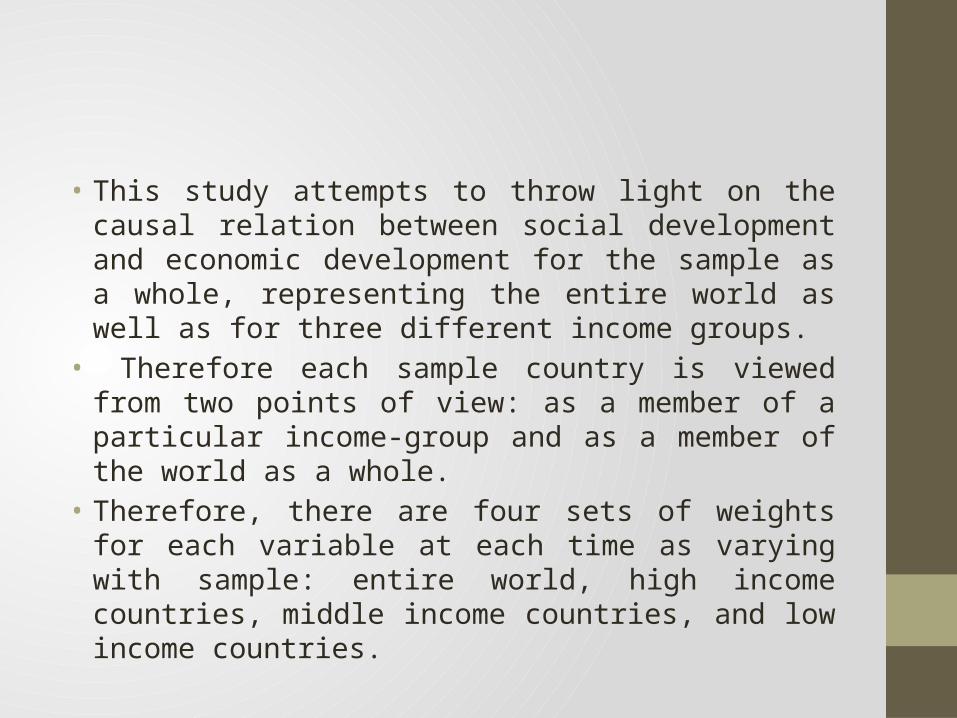
• This study attempts to throw light on the causal relation between social development and economic development for the sample as a whole, representing the entire world as well as for three different income groups.
• Therefore each sample country is viewed from two points of view: as a member of a particular income-group and as a member of the world as a whole.
• Therefore, there are four sets of weights for each variable at each time as varying with sample: entire world, high income countries, middle income countries, and low income countries.

Methodology• THE LAG-LEAD Relation between social development and
economic growth may be found by simple test of causality• Granger Causality is used. Basic assumptions about the
Granger Causality test:• Future cannot cause the past. It is the past and present which
cause the future and• Detection of causality is only possible between two stochastic
variables.
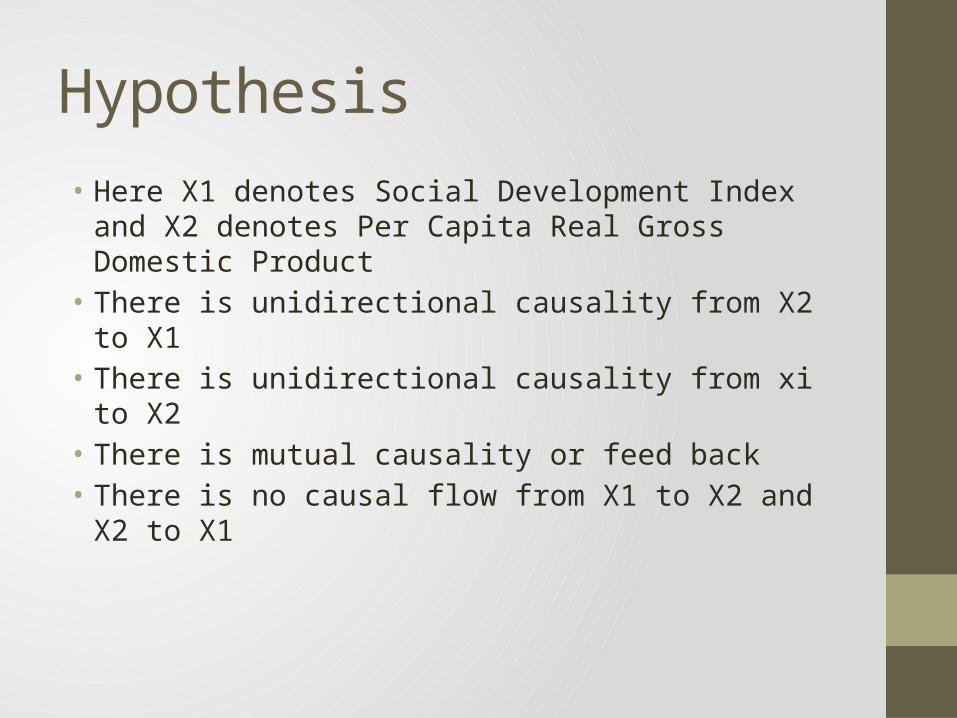
Hypothesis• Here X1 denotes Social Development Index and X2 denotes
Per Capita Real Gross Domestic Product• There is unidirectional causality from X2 to X1• There is unidirectional causality from xi to X2• There is mutual causality or feed back• There is no causal flow from X1 to X2 and X2 to X1

Results Obtained• Test of causality between SDI and PGRGDP
Sum of Coefficients F-Statistics R Square F-Ratio Inference on Causality
World (Entire Sample)
SDI PGRGDP
SDI 1.32 -0.42 23.50 0.95 311.76 SDI PCRGDP
PGRGDP 0.09 0.88 1.00 0.95 87.03
High Income Group
SDI 0.77 0.11 0.08 0.86 13.16 SDI
PGRGDP 0.25 0.90 0.24 0.84 11.82 PCRGDP
Middle Income Group
SDI 0.85 0.12 0.83 0.93 70.72 SDI
PGRGDP 0.32 0.52 3.30 0.75 67.83 PCRGDP
Low Income Group
SDI 0.93 0.03 0.13 0.89 34.50 SDI
PGRGDP 0.69 0.21 14.15 0.75 12.27 PCRGDP

Analysis• For the world, Per Capita Real Gross Domestic Product
precedes Social Development Index. • For the high income group (HIG), Social Development Index
(SDI) and Per Capita Gross Domestic Product (PCRGDP) are independent
• For the middle income group (MIG) and low income group (LIG), Social Development Index precedes Per Capita Real Gross Domestic Product. This sheds light to the fact that up to certain level of income there is a one way causal flow from Social Development Index to Per Capita Real Gross Domestic Product, but after attainment of certain minimum level of economic growth, a country's social development and economic growth may move independently

Reference• Ahsan, Syed M., Andy, C . C. Kwan and Balbir S . Sahani ( 1989). "Causality between Consumption
Expenditure and National Income: OECD countries." Public Finance Vol. XXXXIV, No. 2,204-24.• Atkinson A, . B. and Bourguignon F, . (1982). "The Comparison of Multidimensional Distributions of
Economic Studies." Review of Economic Studies Vol. 12, 183-201.• Balalock H, . M.,e d. (1985). Causal Models in Social Sciences (2nd ed. New York A: ldine Publishing
Co. Bardhan, Pranab (1995). "Research on Poverty and Development Twenty Years of after Redistribution with Growth. "Proceedings of the World Bank Annual Conference on Economic Development
• held in May 1995.• Chamberline G, . (1982). "The General Equivalence of Granger and Sims Causality. " Econometrica
Vol. 50, No. 3, 569-81. Chow, P. C. Y. (1987). "Causality between Export Growth and Industrial Performance: vidence from the NICs." Journal of Development Economics Vol. 26, 55-63. This content downloaded from 203.98.96.194 on Sun, 19 Jul 2015 13:58:35 UTC
• All use subject to JSTOR Terms and Conditions 382 American Journal of Economics and Sociology Chowdury, Khorshed (1992). "Sectoral Lead and Economic Growth in Bangladesh: Evidence from Granger Causality T est." The Bangladesh Development Studies Mar., Vol. XX, No. 1, 109-16.
• Fishlow, Albert( 1995). "Inequality, Poverty and Growth: Where Do We Stand? "Proceedings of the World Bank Annual Conference on Economic Development held in May 1995.
• Geweke J, . and Meese, D . (1983). "Comparing Alternative Tests of Causality in Temporal systems.“ Journal of Econometrics Vol. 21, 16-194.
• Goldstein, J. S. (1985). "Basic Human Needs: The Plateau Curve." World Development Vol. 13, No. 5, 595-609.