Embed Size (px)
Citation preview

This article was downloaded by: [New York University]On: 09 October 2014, At: 10:44Publisher: Taylor & FrancisInforma Ltd Registered in England and Wales Registered Number: 1072954 Registeredoffice: Mortimer House, 37-41 Mortimer Street, London W1T 3JH, UK
International Journal of ProductionResearchPublication details, including instructions for authors andsubscription information:http://www.tandfonline.com/loi/tprs20
An adaptive genetic algorithmapproach for the mixed-modelassembly line sequencing problemOnur Serkan Akgündüz a & Semra Tunalı aa Department of Industrial Engineering , Dokuz Eylul University ,Izmir, TurkeyPublished online: 27 Oct 2009.
To cite this article: Onur Serkan Akgündüz & Semra Tunalı (2010) An adaptive genetic algorithmapproach for the mixed-model assembly line sequencing problem, International Journal ofProduction Research, 48:17, 5157-5179, DOI: 10.1080/00207540903117857
To link to this article: http://dx.doi.org/10.1080/00207540903117857
PLEASE SCROLL DOWN FOR ARTICLE
Taylor & Francis makes every effort to ensure the accuracy of all the information (the“Content”) contained in the publications on our platform. However, Taylor & Francis,our agents, and our licensors make no representations or warranties whatsoever as tothe accuracy, completeness, or suitability for any purpose of the Content. Any opinionsand views expressed in this publication are the opinions and views of the authors,and are not the views of or endorsed by Taylor & Francis. The accuracy of the Contentshould not be relied upon and should be independently verified with primary sourcesof information. Taylor and Francis shall not be liable for any losses, actions, claims,proceedings, demands, costs, expenses, damages, and other liabilities whatsoever orhowsoever caused arising directly or indirectly in connection with, in relation to or arisingout of the use of the Content.
This article may be used for research, teaching, and private study purposes. Anysubstantial or systematic reproduction, redistribution, reselling, loan, sub-licensing,systematic supply, or distribution in any form to anyone is expressly forbidden. Terms &Conditions of access and use can be found at http://www.tandfonline.com/page/terms-and-conditions

International Journal of Production ResearchVol. 48, No. 17, 1 September 2010, 5157–5179
An adaptive genetic algorithm approach for the mixed-model
assembly line sequencing problem
Onur Serkan Akgunduz and Semra Tunal|*
Department of Industrial Engineering, Dokuz Eylul University, Izmir, Turkey
(Received 30 December 2008; final version received 8 June 2009)
A mixed-model assembly line (MMAL) is a type of production line that is capableof producing a variety of different product models simultaneously andcontinuously. The design and planning of such lines involve several long- andshort-term problems. Among these problems, determining the sequence ofproducts to be produced has received considerable attention from researchers.This problem is known as the Mixed-Model Assembly Line Sequencing Problem(MMALSP). This paper proposes an adaptive genetic algorithm approach tosolve MMALSP where multiple objectives such as variation in part consumptionrates, total utility work and setup costs are considered simultaneously. Theproposed approach integrates an adaptive parameter control (APC) mechanisminto a multi-objective genetic algorithm in order to improve the exploration andexploitation capabilities of the algorithm. The APC mechanism decides theprobability of mutation and the elites that will be preserved for succeedinggenerations, all based on the feedback obtained during the run of the algorithm.Experimental results show that the proposed adaptive GA-based approachoutperforms the non-adaptive algorithm in both solution quantity and quality.
Keywords: mixed-model assembly line; sequencing; mixed-model sequencing;genetic algorithm; multi-objective genetic algorithm
1. Introduction
In today’s industrial practice, varying customer demands and intense competition requirea highly diversified product portfolio provided in a cost-effective manner. In orderto provide increased flexibility for product diversification, many manufacturers haveupgraded their assembly lines that were originally developed for the cost-efficient massproduction of a single standardised product. The current trend is to design mixed-modelassembly lines (MMAL), which are capable of producing a variety of different productmodels simultaneously and continuously.
The design of a MMAL involves several issues such as line balancing (McMullen andTarasewich 2006, Tseng et al. 2008), layout design (Ho 2005), generic product modelling(Xu and Liang 2006) and model sequencing (Alpay 2008, Boysen et al. 2009). Determiningthe sequence of launching models to the assembly line is of particular importance forthe efficient use of MMALs. Several objectives and methods have been proposed in theliterature to judge the efficiency of different production sequences, including minimisingtotal utility work, keeping a constant rate of part usage, minimising total setup cost,
*Corresponding author. Email: [email protected]
ISSN 0020–7543 print/ISSN 1366–588X online
� 2010 Taylor & Francis
DOI: 10.1080/00207540903117857
http://www.informaworld.com
Dow
nloa
ded
by [
New
Yor
k U
nive
rsity
] at
10:
44 0
9 O
ctob
er 2
014

minimising the risk of stopping a conveyor, minimising the overall line length, levellingworkloads, etc. When an objective unconditionally rules over all the others, solving thesequencing problem under a single objective can be meaningful in practice, howeverseveral objectives, often conflicting with each other, need to be considered simultaneouslyand this makes the sequencing decision a multi-objective problem (Hyun et al. 1998).
An important issue that complicates the sequencing problem is its combinatorialnature. Typically, an enormous number of possible production sequences exist, even forrelatively small problems, so that finding the optimal solution is usually impractical.Various solution approaches have been proposed in the literature, including dynamicprogramming (Yano and Rachamadugu 1991), linear and integer programming (Drexland Kimms 2001), goal chasing methods (Monden 1993), branch and bound (Drexl et al.2006), tabu search (McMullen 1998), simulated annealing (McMullen and Frazier 2000),the ant colony optimisation technique (Boysen et al. 2007), evolutionary and geneticalgorithms (Hyun et al. 1998, Kim et al. 2000, 2006, McMullen et al. 2000, Ponnambalamet al. 2003, Mansouri 2005, Yu et al. 2006) and several other heuristics. Among thesemethods, genetic algorithms have been shown to be quite successful in dealing with manymanufacturing optimisation problems. A genetic algorithm (GA) is a highly simplifiedcomputational model of biological evolution. In this paper, we aim at solving multi-objective mixed-model sequencing problems using GAs.
The values of GA parameters greatly determine the performance of GAs. Choosing theright parameter values, however, is a time-consuming task. Furthermore, this task mayneed to be repeated for different instances of the problem. A recent trend in GA-basedresearch studies is to employ adaptive or self-adaptive parameter control mechanisms toremedy this situation (e.g. Eiben et al. 1999, Herrera and Lozano 2003, Zhao et al. 2005,Huang et al. 2006, Chang et al. 2007). During a survey of the current literature, however,we did not note any study employing adaptive or self-adaptive parameter controlmechanisms to solve the MMAL sequencing problem (MMALSP). To fill the perceivedresearch gap in this area, this paper proposes an adaptive genetic-algorithm-basedapproach to solve the multi-objective MMALSP. The proposed approach integrates amulti-objective GA with an adaptive parameter control (APC) mechanism that decides theprobability of mutation and the elites that will be preserved for succeeding generations, allbased on the feedback obtained during the run of the algorithm. The effect of the APCmechanism on algorithm performance is investigated from several aspects, i.e. number ofPareto-optimal solutions, quality of Pareto-optimal solutions and, finally, the deviationfrom the best objective function values.
The rest of the paper is organised as follows. Section 2 gives an extensive literaturereview related to solving MMALSP using GAs. Section 3 defines the mixed-modelassembly line sequencing problem. Section 4 proposes an adaptive genetic algorithmapproach to solve the multi-objective MMALSP. Section 5 evaluates the performance ofthe proposed approach using various benchmark problems. Finally, concluding remarksand future research directions are given in Section 6.
2. Literature review
The first research on the application of GAs to the sequencing problem in MMALs wascarried out by Kim et al. (1996). The performance of the GA was compared with those of aheuristic algorithm and a branch-and-bound method using a single objective function.
5158 O.S. Akgunduz and S. Tunal|
Dow
nloa
ded
by [
New
Yor
k U
nive
rsity
] at
10:
44 0
9 O
ctob
er 2
014

The results of the experimental studies suggested that the proposed GA greatly reducedthe computation time and provided a near-optimal solution. In their next publication, theauthors (Hyun et al. 1998) developed a method to find diverse Pareto optimal solutions,particularly for multiple objective MMALSPs. This new method was based on a newevaluation and selection mechanism, called the Pareto stratum-niche cubicle. Threeobjective functions, i.e. minimising total utility work, levelling part usage throughproduction rates and minimising total setup cost, were considered simultaneously.Comparison of the performance of the proposed algorithm with other existing multi-objective GAs revealed that the proposed method outperformed other GAs in terms of thediversity and quality of the solutions, especially for large size problems.
Another GA-based approach was proposed by McMullen et al. (2000) in which twoobjectives, minimising the number of setups and levelling part usage through productionrates, were combined using the weighted sum approach. The proposed GA was comparedwith the tabu search (TS) and simulated annealing (SA) approaches and it was found thatthe performance of TS was not good in comparison with SA and GA. The authors alsostated that GA and SA were equally well performing.
Being a just-in-time related goal, levelling parts usage rates has been considered byseveral researchers. Generally, it has been assumed that products require approximatelya mix of parts in the same amount, and therefore the levelling parts usage rates objectivewas substituted by smoothing the variation of production rates at final assembly. Unlikethis general trend, Ponnambalam et al. (2003) focused on four levels of production stages(i.e. product, subassembly, component, and raw materials) and assumed that everyproduct could have different part requirements. The authors extended the work of Hyunet al. (1998) by incorporating this new objective function into the multi-objective GAframework. They reported that the multiple-objective GA using the selection mechanismof Pareto stratum-niche cubicle performed better than that of the weighted sum of multipleobjective functions with variable weights.
Unlike the general trend of using fitness sharing methods in multi-objective approachesto maintain the diversity in the population, Yu et al. (2006) employed the dispersed-distance method. This method is known for awarding solutions located in sparse regions.The authors also used the dispersed-distance measure along with Pareto-ranks to computea new fitness value for each individual. The proposed multi-objective GA employing thePareto ranking and dispersed-distance calculation methods was claimed to guaranteeuniformly dispersed Pareto solutions.
Due to the ease of implementation, parameter tuning is the most widely used approach.This approach involves setting the values of the parameters based on the same set of initialexperiments. Mansouri (2005) proposed that, for crossover and mutation, using high rateswould increase the diversity, whereas low rates would improve the quality. To test hishypothesis, the author employed high rates at the beginning followed by exponentiallydecreasing rates from a break point onward and compared the performance of thedeveloped multi-objective GA (MOGA) against three search heuristics (i.e. GA, SA, TS)developed for multi-objective mixed-model sequencing problems. The results revealed thatthe proposed MOGA outperformed the benchmark algorithms in terms of the quality ofthe solutions. Concerning diversity, no significant difference was observed between theMOGA and the others.
It should be noted that only a few researchers have employed adaptive geneticalgorithms to solve MMALS. To solve the joint problem of balancing and sequencingin MMALs, Miltenburg (2002) proposed a single-objective genetic algorithm approach
International Journal of Production Research 5159
Dow
nloa
ded
by [
New
Yor
k U
nive
rsity
] at
10:
44 0
9 O
ctob
er 2
014

based on deterministic parameter control. The author assumed that diversity was moreimportant in early populations than in later ones, hence he set the probability of mutationto 0.5 for the first 10 populations and zero thereafter. However, this study lacks acomparative study evaluating the performance of the proposed deterministic approachagainst existing approaches in the literature.
Experimenting with different parameter settings, Mansouri (2005) observed that highrates were more effective for diversification rather than the quality of solutions along thefrontier and he stated that fixed rates did not result in quality as well as diverse frontiers atthe same time. Moreover, he noted that the rate of improvement became constantly slowerand slower until it ceased to improve between generations and the low rates for crossoverand mutation were found to be effective in improving the quality of solutions in a less-diverse frontier. To exploit the advantages of both scenarios, Mansouri proposed a newparameter control approach that changed the rates of the operators in such a way thathigh rates were allowed at the beginning followed by lower rates thereafter. Since the ratesvary according to time (t), this approach is also categorised as a deterministic parametercontrol method.
A recent trend in GA-based research studies is to employ adaptive or self-adaptiveparameter control mechanisms so that better performance can be gained in dealing withvarious optimisation problems. During a survey of the current literature, we did not noteany study employing adaptive or self-adaptive parameter control mechanisms to solve theMMAL sequencing problem. Considering the intense competition in global markets toprovide a rich product variety at low cost, we believe that developing new methodologiesto solve the MMAL sequencing problem efficiently is very important. Motivated by thisgap in the research, this study aims at solving the multi-objective MMALSP using anadaptive genetic algorithm.
3. Mixed-model assembly line sequencing
The mixed-model assembly line sequencing problem appears when variations of the samebasic product are produced on the same production line. These variations imply that,depending on the model to be processed, the processing times on the individual stationsmight differ. The total number of sequences for a mixed-model assembly sequencingproblem can be computed as follows:
total sequences ¼
PMm¼1 dm
� �!QM
m¼1 ðdm! Þ, ð1Þ
where M is the number of different models, m is the model type and dm is the demandof model m. As the problem increases in size, the number of feasible solutions increasesexponentially. Also, when the multi-objective nature of the problem is considered, findingproduction sequences with desirable levels of all objectives is NP-hard (Hyun et al. 1998).Conventional multi-objective optimisation techniques, including linear programming,gradient methods, methods of inequalities, goal attainment or the weighted sum approach,all have shortcomings, as pointed out by Deb (1999). Emulating the biological evolutionmechanism and Darwin’s principle of the ‘survival-of-the-fittest’, genetic algorithms arerecognised to be well suited for multi-objective optimisation problems where conventionaltools fail to work well (Tan et al. 2002).
5160 O.S. Akgunduz and S. Tunal|
Dow
nloa
ded
by [
New
Yor
k U
nive
rsity
] at
10:
44 0
9 O
ctob
er 2
014

The MMALSP has been studied under various objective functions. Among theseobjective functions, the most commonly used are minimising the total utility work (UW),minimising the variation of part consumption rates (VPC) and minimising the total setupcost (SC). The following section presents the mathematical models developed to deal withMMALSP under these objective functions. All models rely on the following assumptionsof Hyun et al. (1998).
. The assembly line is a conveyor system moving at a constant speed (vc).
. The line is partitioned into J stations.
. All stations are closed so that workers cannot cross station boundaries.
. Minimum part set (MPS) production is used. MPS is a vector representing aproduct mix, such that ðd1, . . . , dmÞ ¼ ðD1=h, . . . ,DM=hÞ, where M is the totalnumber of models, Dm is the number of products of model type m that needs to beassembled during the entire planning horizon and h is the greatest commondivisor or highest common factor of D1,D2, . . . ,DM. This strategy operates in acyclical manner. The number of products produced in one cycle is I ¼
PMm¼1 dm.
Obviously, h times repetition of the MPS can meet the total demand in theplanning horizon.
. Products are launched onto the conveyor at a fixed rate. The launch interval (�) isset to T=ðI� J Þ, where T is the total operation time required to produce one cycleof MPS products (T ¼
PJj¼1
PMm¼1 tjmdm, where tjm is the operation time for model
m at station j ).. Processing times are deterministic.. Workers’ moving time is ignored.
3.1 Minimising the total utility work
Utility work occurs whenever the operations of a work piece cannot be finished within theboundaries of a station. This situation might be handled either by stopping the wholeassembly line until all stations complete the processing of their current work piece or byemploying utility workers so that the operator(s) of the station finish the current work justbefore the border of the station is reached. To avoid such costly compensation, the modelsare scheduled at each station and cycle by explicitly taking into account processing times,worker movements, station borders and further operational characteristics of the line(Wester and Kilbridge 1964).
The notation used for this type of MMALSP is as follows:
Uij the amount of utility work required for the ith product in a sequenceat station j
Zij starting position of the work on the ith product in a sequence atstation j
Lj fixed line length of station j
The following model presented by Hyun et al. (1998) solves the MMALSP under theobjective function of minimising total utility work:
MinimiseXJj¼1
XIi¼1
Uij þ Zðiþ1Þ j=vc
!, ð2Þ
International Journal of Production Research 5161
Dow
nloa
ded
by [
New
Yor
k U
nive
rsity
] at
10:
44 0
9 O
ctob
er 2
014

subject to
XMm¼1
xim ¼ 1, 8i, ð2:1Þ
XIi¼1
xim ¼ dm, 8m, ð2:2Þ
Zðiþ1Þ j ¼ max 0, min Zij þ vcXMm¼1
ximtjm � ð� � vcÞ,Lj � ð� � vcÞ
!" #, 8i, j, ð2:3Þ
Uij ¼ max 0, Zij þ vcXMm¼1
ximtjm � Lj
!=vc
" #, 8i, j, ð2:4Þ
xim ¼ 0 or 1, 8i,m, ð2:5Þ
Z1j ¼ 0, Zij � 0, 8i, j, ð2:6Þ
Uij � 0, 8i, j, ð2:7Þ
where xim is 1 if the ith product in a sequence is model m; otherwise xim is 0. The secondterm in the objective function takes into account the utility work that may be requiredat the end of a cycle. Equation (2.1) ensures that exactly one product is assigned to eachposition in a sequence. Equation (2.2) guarantees that demand for each model is satisfied.Equation (2.3) indicates the starting position of the worker at each station j on productiþ 1 in a sequence. Utility work Uij for the ith product in a sequence at station j isdetermined by Equation (2.4).
3.2 Minimising the variation of part consumption rates
Keeping part consumption at a constant rate is considered to be an important goalfor JIT production systems. These systems rely on continual and stable part supply.Therefore, it is important to keep part demand rates as constant as possible over time.This can be achieved by minimising the variation of actual part consumption rates fromthe expected rates.
The notation used for this type of MMALSP is as follows:
g level number (level 4, raw material; level 3, components; level 2,subassemblies; level 1, final assembly)
ng number of outputs at level g, where g ¼ 1, 2, 3, 4di1 demand for product i ¼ 1, 2, . . . , n1tigl number of units of output i at level g used to produce one unit of
product l, i ¼ 1, 2, . . . , ng, g ¼ 2, 3, 4, l ¼ 1, 2, . . . , n1dig ¼
Pn1h¼1 tighdh1 demand for output i at level g
DTg ¼Png
i¼1 dig total demand for production at level g, where g ¼ 1, 2, 3, 4
5162 O.S. Akgunduz and S. Tunal|
Dow
nloa
ded
by [
New
Yor
k U
nive
rsity
] at
10:
44 0
9 O
ctob
er 2
014

rig ¼ dig=DTg ratio of level g production devoted to output i, i ¼ 1, 2, . . . , ng,g ¼ 1, 2, 3, 4
According to the above notation, DT1 products must be assembled on the finalassembly line during the planning horizon. Suppose that the planning horizon is composedof DT1 consecutive stages and a product is assigned to each of these stages. This forms aschedule that is represented in the model by the following variables:
xi1k number of units of product i produced during stages 1, 2, . . . , k.The notation k is used throughout to denote the stage number
xigk ¼Pn1
h¼1 ðtigh � xh1kÞ number of units of output i at level g produced during stages1, 2, . . . , k
XTgk ¼Png
i¼1 xigk total production at level g during stages 1, 2, . . . , kwg weights, g ¼ 1, 2, 3, 4
If production was strictly synchronised with demand, after k stages the total outputof part i at level g, xigk, would be equal to ðXTgk � rigÞ. However, since ensuring equalitymay not always be possible, the system is scheduled so as to make xigk close to ðXTgk � rigÞfor each i, g and k. Equipped with these definitions and notation, Miltenburg andSinnamon (1989) formulated the scheduling problem as follows:
Select xigk, i ¼ 1, 2, . . . , n1, k ¼ 1, 2, . . . ,DT1,
to minimiseXDT1
k¼1
X4g¼1
Xngi¼1
wg½xigk � ðXTgk � rigÞ�2,
ð3Þ
subject to
XT1k ¼ k, k ¼ 1, 2, . . . ,DT1, ð3:1Þ
0 � xi1k � xi1ðk�1Þ and xi1k is an intenger, i ¼ 1, 2, . . . , n1, k ¼ 1, 2, . . . ,DT, ð3:2Þ
xi1DT1¼ di1, i ¼ 1, 2, . . . , n1: ð3:3Þ
Equation (3.1) ensures that exactly k products are scheduled during k stages.Equation (3.2) ensures that exactly one unit is scheduled for each stage. Equation (3.3)ensures that exactly the right number of each type of model is produced during theplanning horizon (Ponnambalam et al. 2003).
3.3 Minimising the total setup cost
In many industries, sequence-dependent setups are considered an important issuein assembly operations. A setup is required each time two consecutive items in theproduction sequence are different. Therefore, this objective function aims at minimisingproduct changes in the production schedule by batching products as much as possible.A mathematical model considering sequence-dependent setups has been developed byHyun et al. (1998), as follows:
MinimiseXJj¼1
XIi¼1
XMm¼1
XMr¼1
ximrcjmr, ð4Þ
International Journal of Production Research 5163
Dow
nloa
ded
by [
New
Yor
k U
nive
rsity
] at
10:
44 0
9 O
ctob
er 2
014

subject to
XMm¼1
XMr¼1
ximr ¼ 1, 8i, ð4:1Þ
XMm¼1
ximr ¼XMp¼1
xðiþ1Þrp, i ¼ 1, . . . , I� 1,8r, ð4:2Þ
XMm¼1
ximr ¼XMp¼1
x1rp, 8r, ð4:3Þ
XIi¼1
XMr¼1
ximr ¼ dm, 8m, ð4:4Þ
ximr ¼ 0 or 1, 8i,m, r, ð4:5Þ
where cjmr is the setup cost incurred when the model type is changed from m to r at station jand ximr is 1 if model types m and r are assigned to the ith and ðiþ 1Þth positions in asequence, respectively; otherwise ximr is 0. Equation (4.1) is a set of position constraintsindicating that every position in a sequence is occupied by exactly one product. Equations(4.2) and (4.3) ensure that the sequence of products must be maintained while repeating thecyclic production. Equation (4.4) imposes the restriction that the demand for each modelmust be satisfied as given in the Master Production Schedule (MPS).
4. The proposed adaptive GA approach
This section discusses in detail how the APC mechanism is integrated into a multi-objective GA to solve the MMALSP. As can be seen from Figure 1, the proposedalgorithm consists of three major components. The main component, the GA,incorporates an APC mechanism that modifies the values of the GA parameters anda multi-objective selection mechanism, the Pareto stratum-niche cubicle (PS-NC), whichranks the individuals. An individual is a sequence of all the models simply listed in theirlaunching order. Suppose that, during a cycle, three types of products, A, B, and C, arerequired to be produced in quantities of 1, 2 and 3, respectively. An alternative individualfor this sequencing problem can be represented as the string (C B C A C B). To evaluatethe fitness of each individual, the three objective functions introduced in Section 3, thetotal utility work (Equation (2)), variation of parts consumption rates (Equation (3)) andtotal setup costs (Equation (4)), are employed. The other details regarding geneticoperators, selection schemes and ranking are explained in the following sections.
4.1 Ranking and selection
In this paper, the PS-NC selection mechanism proposed by Hyun et al. (1998) is used todetermine the selection probability for each individual. A niche cubicle is a rectangularregion whose centre is the individual. Suppose a problem has n objectives and MAXlt andMINlt are the maximum and the minimum of the lth objective function at generation t,respectively. Then �lt, the niche size for the lth objective, is computed using the equation
�lt ¼MAXlt �MINltffiffiffiffiffiffiffiffiffiffiffiffiffiffiffiffi
pop:sizenp , l ¼ 1, 2, . . . , n, ð5Þ
5164 O.S. Akgunduz and S. Tunal|
Dow
nloa
ded
by [
New
Yor
k U
nive
rsity
] at
10:
44 0
9 O
ctob
er 2
014

where pop.size is the size of the population. It should be noted that the niche size iscalculated at every generation. Figure 2 illustrates the construction of niche cubicles whenn¼ 2 and pop.size¼ 25. Two niche cubicles are shown for arbitrarily chosen individuals,p1 and p2. Since the size of every niche cubicle is the same, the solution density of a nichecubicle can be simply measured by the number of individuals included in the cubicle.A solution located in a less-dense cubicle is allowed to have a higher probability to survivein the next generation.
Next, Pareto strata are identified. Given a population of solutions, some of them arenon-dominated solutions. Such solutions form a Pareto stratum as illustrated in Figure 3,where two objectives, f1 and f2, are minimised simultaneously. Removing the stratumfrom the population uncovers the next Pareto stratum. This can be repeated until all thesolutions are used up. A solution found in an earlier stratum is allowed to have a higherprobability to survive in the next generation.
The GA-based approach proposed in this study combines the Pareto ranking andfitness sharing schemes. The Pareto ranking scheme focuses on improving the solutionquality, hence it emphasises the exploitation issue. The fitness of each string is determinedby a non-dominated sorting procedure. This, however, has no real control over solutiondiversity. Unlike the Pareto ranking scheme, the fitness sharing scheme (niche-cubicle)emphasises the exploration issue. This strategy introduces a niching concept that canimprove the diversity of solutions in a population; however, it has limitations in finding
Figure 1. General structure of the proposed multi-objective adaptive GA.
International Journal of Production Research 5165
Dow
nloa
ded
by [
New
Yor
k U
nive
rsity
] at
10:
44 0
9 O
ctob
er 2
014

good solutions. Therefore, these two methods are combined to compensate for the other’sweakness, and to attempt to simultaneously deal with the two issues of exploration andexploitation. The overall selection procedure combining the Pareto stratum and the nichecubicle along with the related notation are provided below:
pv the individual whose rank is vP(t)¼{p1, p2, . . . , ppop.size} population at generation t
PSu uth Pareto stratumbi solution density of the niche cubicle associated with
individual piq selection parameter (05 q5 1)
Prob½ pv� probability of survival for individual pvCProb½ pv� cumulative probability of survival for individual pv
Step (0): Set v¼ 0, u¼ 1 and Pu¼P(t).
Step (1): Construct the niche cubicle and calculate the solution density of this cubiclefor each individual in P(t).
Figure 3. Pareto strata.
Figure 2. Niche cubicles.
5166 O.S. Akgunduz and S. Tunal|
Dow
nloa
ded
by [
New
Yor
k U
nive
rsity
] at
10:
44 0
9 O
ctob
er 2
014

Step (2): Find the uth Pareto stratum, PSu¼{(pi, bi) j pi is a non-dominated solution to Pu,bi is the solution density of the niche cubicle associated with pi}.
Step (3): Sort the individuals of PSu in increasing order of bi, and assign the rank (vþ s)to the sth individual, for s¼ 1, 2, . . . , jPSuj.
Step (4): Set v¼ vþ jPSuj, u¼ uþ 1 and Pu¼Pu–1–PSu–1. If Pu¼Ø, go to step 2;otherwise, go to step 5.
Step (5): Determine the probability of survival for each individual using a rank-basedselection scheme wherein the following geometric distribution is employed:
Prob½ pv� ¼ qð1� qÞv�1, v ¼ 1, 2, 3, . . . , pop:size: ð6Þ
Step (6): Calculate the cumulative probability of survival for each individual pv, using theequation
CProb½ pv� ¼Xvi¼1
Prob½ pi�: ð7Þ
As for parent selection, a random number between 0 and CProb½ ppop:size�, r, isgenerated and the individual, pv, that satisfies the following condition is selected as aparent:
CProb½ pv�1�5 r5CProb½ pv�: ð8Þ
This selection process is repeated as many times as the size of the population.
4.1.1 Illustrative example
Consider a MMALSP with a MPS of (2, 3, 2) being solved with the algorithm usinga population size of 10. Table 1 lists all the individuals of an arbitrary generation. The firstcolumn of the table shows the production sequences, and the following three columns list
Table 1. Sample population.
Sequence UW VPC SC bi PS v Prob½ pv� CProb½ pv�
BBCBCAA 19.4 24.7 20.0 2 1 1 0.300 0.300BACBCBA 19.0 4.5 40.0 2 1 2 0.210 0.510BBCCBAA 20.1 20.6 16.0 4 1 3 0.147 0.657BCCBABA 20.1 10.0 36.0 4 1 4 0.103 0.760CBBBAAC 25.1 15.6 24.0 4 1 5 0.072 0.832CBABBAC 25.1 5.5 44.0 3 2 6 0.050 0.882BABCBCA 20.3 7.7 40.0 3 2 7 0.035 0.918BBCCBAA 20.1 20.6 16.0 4 2 8 0.025 0.942BABABCC 29.6 9.6 44.0 1 3 9 0.017 0.960BBBACCA 24.9 24.3 28.0 3 3 10 0.012 0.972MAXlt 29.6 24.7 44.0MINlt 19.0 4.5 16.0�lt 4.9 9.4 13.1
International Journal of Production Research 5167
Dow
nloa
ded
by [
New
Yor
k U
nive
rsity
] at
10:
44 0
9 O
ctob
er 2
014

the values for the three objective functions obtained using Equations (2), (3) and (4),
respectively. The maximum (MAXlt) and the minimum (MINlt) values for each objective
function found in this population can also be seen in the table. The selection procedure
described above works as follows. First, the niche size (�lt) for each objective function is
computed using Equation (5). These values are shown in the last row of the table.Secondly, the computed niche sizes are used to determine the solution density (bi) in each
individual’s niche-cubicle. For example, the UW niche for the first sequence in the list
is ð 19:4� 4, 9=2 19:4þ 4, 9=2 Þ ffi ð 17 21:9 Þ. There are only five individuals with UW
values within this range. However, when the VPC and SC niches are also considered, this
number goes down to 2 as only two individuals, i.e. the third and the eighth, stay in the
first individual’s niche-cubicle. Hence the density of the first individual’s niche-cubicle
is found to be 2. The density values of the remaining individuals are computed similarly(see the fifth column of Table 1). Next, the individuals are compared with each other
in order to identify the non-dominated individuals. For example, the third individual has
better values than the tenth individual in all three objective functions, therefore the tenth
individual is dominated. When all the individuals are compared with each other, some
of them will remain non-dominated. These non-dominated individuals will form the first
Pareto stratum (PS1). Next, the PS1 individuals are sorted by their density in ascending
order and they are assigned ranks starting from the top of the list. As can be seen from thesixth column of Table 1, the PS1 consists of the first five individuals. Two of these
individuals have a density of 2 and the other three have a density of 4. Therefore, the
individuals with a density of 2 will be assigned the first two ranks and the others will be
assigned the next three ranks. When the PS1 individuals are removed from the population,
another group of non-dominated individuals can be obtained. These individuals will form
the PS2. In this example, the PS2 has three individuals and they will be ranked as sixth,
seventh and eighth, respectively. Finally, when the individuals in PS2 are removed, onlytwo individuals will remain. Since neither of them is better than the other, they will form
the third and the last Pareto stratum, PS3, and they will be assigned the ninth and tenth
ranks. The next step of the selection procedure is to calculate the probability of survival
(Prob½ pv�) for each individual. Using Equation (6) and a selection parameter (q) of 0.3,
these values are calculated as shown in the eighth column of Table 1. In the last step, the
cumulative survival probabilities (CProb½ pv�) are calculated using Equation (7) (see the
last column of Table 1). Once the cumulative survival probabilities are known, the actualselection (mating) can take place. For our example, this is achieved by generating a
random number in the range (0, 0.972) and choosing the individual satisfying condition
(8). For example, if two consecutive random numbers were generated as 0.55 and 0.78,
the individuals that will be selected for mating would be the third and the fifth.
4.2 Genetic operators and survival scheme
The order crossover (OX) and inversion operators were used jointly as crossover andmutation operators. To illustrate how the order crossover works, consider the following
two parent individuals of length 7:
ð1Þ BBjCBCjAA,
ð2Þ ABjBCAjBC:
5168 O.S. Akgunduz and S. Tunal|
Dow
nloa
ded
by [
New
Yor
k U
nive
rsity
] at
10:
44 0
9 O
ctob
er 2
014
The vertical lines correspond to the two randomly selected crossover points. The OXbegins by moving all the characters positioned after the right line to the beginning of thestring. This will result in the following intermediate strings:
ð1Þ aAbBcBC ðABBCÞ,
ð2Þ bcABBcA ðABBAÞ:
From each intermediate string, the other parent’s characters that are positionedbetween the lines are removed (the characters that will be removed are shown in bold lowercase letters). For example, from the first intermediate string, the first B, the first C and thefirst A will be removed since the string between the lines of the second parent is ‘BCA’.This will produce the shortened strings given in parentheses. Finally, the string between thelines of a parent will be combined with the shortened intermediate string of the otherparent in order to produce the offspring. This is achieved by starting from the secondline and adding shortened intermediate strings by wrapping around to the beginning of thestring. The offspring resulting from this procedure are given below:
ð1Þ BAjCBCjAB,
ð2Þ BCjBCAjAB:
Inversion is performed by randomly selecting two points in the string and inverting theorder of the characters between these two points. This process is illustrated below:
BjCCBAjAB ðbeforeÞ,
BjABCCjAB ðafterÞ:
To determine which individuals will survive to the next generation, an adaptive elitiststrategy is proposed. The number of elites to be selected is determined after a dominationcheck between the two populations, i.e. parents and offspring. Both the parent andoffspring populations are subject to a cross-population check, where non-dominatedindividuals of the parent population are identified. These elite individuals are thentransferred directly to the new generation. The remaining population quota is completedwith the offspring individuals, starting from the one with the highest rank.
4.3 Performance evaluation and adaptation
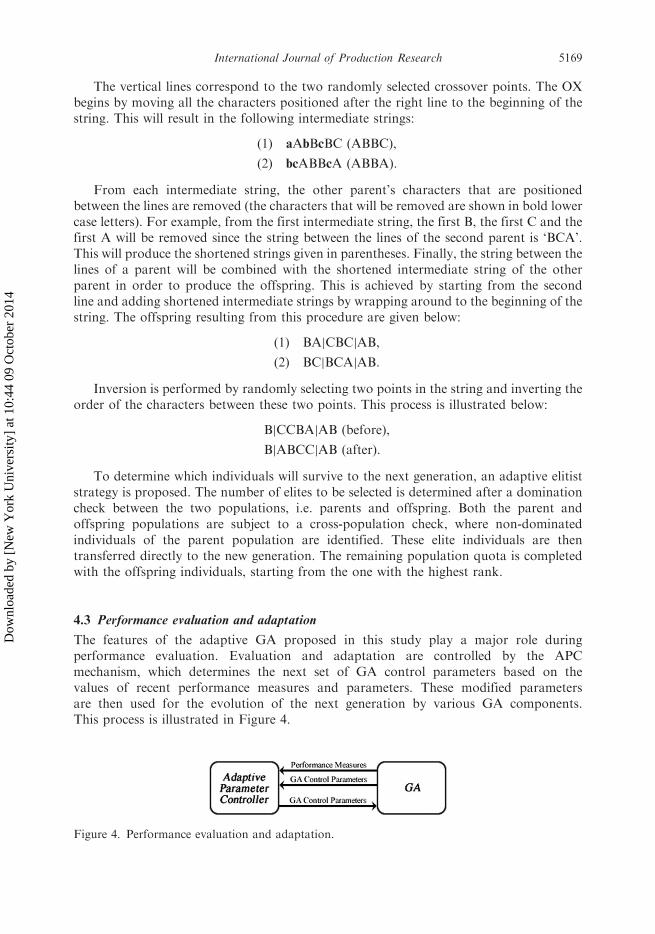
The features of the adaptive GA proposed in this study play a major role duringperformance evaluation. Evaluation and adaptation are controlled by the APCmechanism, which determines the next set of GA control parameters based on thevalues of recent performance measures and parameters. These modified parametersare then used for the evolution of the next generation by various GA components.This process is illustrated in Figure 4.
Figure 4. Performance evaluation and adaptation.
International Journal of Production Research 5169
Dow
nloa
ded
by [
New
Yor
k U
nive
rsity
] at
10:
44 0
9 O
ctob
er 2
014

The APC mechanism, which aims at adapting the mutation probability ð pmÞ during the
run of the algorithm, was developed based on the approach described by Herrera and
Lozano (2003). The controller evaluates the algorithm performance every G generations.
It takes into account the pm value used during the last G generations and the improvement
achieved on fb (fitness values for the best elements found so far). Then, it computes a new
value for pm that will be used during the next G generations. To accomplish this task, a set
of rules are defined and used by the controller. Herrera and Lozano (2003) employed a set
of fuzzy rules; in other words, they fired multiple rules simultaneously for the same input.
In this study, unlike theirs, the fuzzy logic was left out for the sake of simplification and
only one rule was fired at a time.There are two categories of controller input, as can be seen in Figure 4. These are
performance measures (e.g. convergence of the objective function values), which are
evaluated after every G generations, and the GA control parameters (e.g. crossover and
mutation operators, probabilities, etc.), which are modified G generations before.Convergence (CM ) is a measure of the progress made in the best objective function
values during a number of generations. Since there are three objective functions, there are
three separate convergence measures that can be calculated using the equation
CMi ¼ f bi =f0i , i ¼ 1, 2, 3, ð9Þ
where f bi is the value of the ith objective function for the current best element (for the ith
objective function) found so far and f 0i is the value of the ith objective function for the best
element found before the last G generations. Since an elitist strategy is used, CM belongs
to [0, 1]. If CM is low, then convergence is high, i.e. no progress was made during the last G
generations, whereas if it is high, the GA finds a new best element that outperforms the
previous one.The proposed algorithm uses a fuzzy concept in order to determine if a given CM value
should be treated as low or high. This requires the use of a set of linguistic labels associated
with membership functions (see Figure 5(a)). The set of linguistic labels for CM is {Low,
High}. The Low label corresponds to a CM with a value of 0.7 or lower, whereas the High
label corresponds to a CM with a value of 0.95 or greater. If the CM value is in the
(0.7, 0.95) range, then both labels are possible. In such a case, the label is determined using
a random number (r) as follows:
CM label ¼Low, r �
0:95� CM
0:95� 0:7,
High, otherwise:
8><>: ð10Þ
Remark Both membership functions are constructed based on the insight gained through
experimental study and they merely represent the authors’ interpretation of the linguistic
labels.
The mutation probability is used as the GA control parameter. Mutation helps to
maintain the diversity in the population and it also helps to prevent the algorithm
becoming stuck in local optima. Thus, by adapting the mutation probability during the
run, we hope to improve the performance of the algorithm. The set of linguistic labels
associated with mutation probability is {Low,Medium,High}. Each of these labels
corresponds to a triangular distribution as depicted in Figure 5(b). For example, the Low
5170 O.S. Akgunduz and S. Tunal|
Dow
nloa
ded
by [
New
Yor
k U
nive
rsity
] at
10:
44 0
9 O
ctob
er 2
014

label corresponds to a triangular distribution with a lower limit of 0.10, a mode of 0.15 and
an upper limit of 0.20.When combined with the above CM performance measure, the current mutation
probability (which is used for the last G generations) forms the necessary input for the next
step – progress evaluation.In order to produce a new set of parameter values that properly responds to a poor
performance in a specific measure or allows the performance to be improved even more,
the proposed APC mechanism uses a set of rules. The rules that describe the relation
between the inputs and outputs are presented in Table 2.These rules were developed using the following heuristics.
. Heuristic 1. This heuristic involves reducing the value of pm when progress is made
and increasing it when there is no improvement. If a stationary state is detected,
meaning that CM is high, this could be due to a very low value of pm inducing
premature convergence, with the search process being trapped in a local optimum.
Heuristic 1 deals with this problem by increasing the value of pm so that more
diversity is introduced with the possibility of escaping from the local optimum.
It should be noted that rules 1, 2, 4, 5 and 6 listed in Table 2 employ this heuristic.. Heuristic 2. This heuristic involves reducing the value of pm when it is high and
there is still no progress. Another possible cause of poor performance may be due
to the use of a very high value for pm, which does not allow convergence towards
Figure 5. Meanings of the linguistic terms.
Table 2. Rule base for the control of pm.
Rule CM pm p0m
1 High Low Medium2 High Medium High3 High High Low4 Low Low Low5 Low Medium Low6 Low High Medium
International Journal of Production Research 5171
Dow
nloa
ded
by [
New
Yor
k U
nive
rsity
] at
10:
44 0
9 O
ctob
er 2
014

better individuals. Heuristic 2 deals with this problem by decreasing the valueof pm when both CM and pm are high. It should be noted that rule 3 listed inTable 2 employs this heuristic.
Progress evaluation and adaptation can be summarised as follows. First, the CM valueis calculated, and then its linguistic label is determined as Low or High. This informationis matched with the current pm label in Table 2 and the resulting p0m label is found.Finally, the new mutation probability is calculated according to the label of p0m.
5. Experimental results
In order to investigate the effectiveness of the proposed GA approach in solving the multi-objective MMALSP, various experimental studies were carried out using both relevantbenchmark problems in the literature and also some newly generated test problems.The characteristics of these test problems and the results obtained are summarised in thefollowing sections.
5.1 Problem sets and the algorithms compared
The experimental studies involve 60 problems generated by focusing on three factors. Thefirst factor, which shows the number of models produced on the assembly line, has threelevels, 3–5 models, 6–8 models and 9–11 models. The second factor is the MPS (minimumpart set), which is to be repeated to satisfy the demand for a specified planning horizon.This factor, which is uniformly distributed, also has three levels, 10–20, 20–30, and 30–40.Lastly, the third factor, which shows the number of sub-assemblies, components and rawmaterials, is chosen in the range of 3–6. Using these factors, the 60 problems are dividedinto six problem sets, each containing 10 problems. These sets, accompanied by theiraverage solution space, can be seen in Table 3.
The data for the first four problem sets were taken from Ponnambalam et al. (2003),where the generated problems were solved with the objective of minimising the variation
Table 3. Problem sets (PSs).
Total demand
Number of models
[3, 5] [6, 8] [9, 11]
[10, 20] I III[20, 30] II IV V*[30, 40] VI*
PSs Average number of solutions
I 1.6*107
II 3.4*109
III 8.2*1012
IV 2.1*1017
V 6.2*1019
VI 1.0*1030
*Additional problem sets.
5172 O.S. Akgunduz and S. Tunal|
Dow
nloa
ded
by [
New
Yor
k U
nive
rsity
] at
10:
44 0
9 O
ctob
er 2
014

of part consumption rates. In this study, in addition to minimising the variation of partconsumption rates, minimising the total setup cost and minimising the total utility workwere also considered. These objective functions take into consideration the sequence-dependent setup costs, model assembly times and workstation lengths. Moreover, in orderto create a comparable problem set, all these features were added to the first four problemsets given in Table 3.
It should also be noted that problem sets V and VI in Table 3 were generated mainlyto investigate the effectiveness of the proposed algorithm in more realistic scenarios.
The characteristics and the search capability of the proposed adaptive algorithm werecompared with those of a non-adaptive GA. The non-adaptive GA (referred to below asthe standard algorithm) is implemented based on the definitions given by Ponnambalamet al. (2003). These two algorithms, together with their main differences, are listed inTable 4. Each algorithm was run 10 times for each of the 60 problem instances in orderto obtain more reliable results.
5.2 Parameter setting
The algorithm is programmed in C, and implemented on a PC with a 2GHz CPU. Theinitial populations are generated randomly. The values of the genetic parameters weredetermined by preliminary experiments. For all problems, the population size was set to100. The initial rates for crossover and mutation were set to 0.8 and 0.2, respectively.While the crossover rate is fixed throughout the generations, the mutation rate is allowedto vary in the range 0:10, 0:30½ �. For the non-adaptive algorithm, the number of elites is setto 20. The selection parameter, q, is fixed to 3=popsize (see Equation (6)), the adaptivecontroller is called once every 10 generations and, finally, for the termination of thealgorithm, the maximum number of generations is set to 250.
5.3 Performance measures
The performance metrics employed to compare the strengths and weaknesses of thestandard and adaptive genetic algorithm approaches are as follows.
. Number of First Pareto Stratum Individuals (NPS1). This performance metricsimply shows the number of individuals in the first Pareto stratum of thepopulation. A higher number means more alternatives are available for decisionmakers.
. Number of Non-dominated Individuals (NNI). When a population is comparedwith another, some of its first Pareto stratum individuals might be dominated bythose of the other population. The number of remaining non-dominated
Table 4. The algorithms compared.
Standard Adaptive
Mutation rate Fixed to 0.2 Varies in the range [0.10, 0.30]Number of elites Fixed to 20 Varies
International Journal of Production Research 5173
Dow
nloa
ded
by [
New
Yor
k U
nive
rsity
] at
10:
44 0
9 O
ctob
er 2
014

individuals is denoted NNI. The higher the value of NNI, the better the solutionquality, and hence the better the algorithm performance.
. Convergence. Convergence pertains to the speed at which the algorithmapproaches the optimal or near-optimal solution. Since we use a multi-objectiveapproach, convergence values are calculated for each objective functionseparately. For the sake of simplification, actual values are normalised usingthe equation
b0g ¼bg � Bmin
Bmax � Bmin, g ¼ 1, 2, . . . , 250, ð11Þ
where b0g is the normalised best value obtained in generation g, bg is the actual bestvalue obtained in generation g, Bmin is the minimum best value and Bmax is themaximum best value obtained during the whole experiment. It follows fromEquation (11) that b0g is in the range [0, 1], i.e. 0 � b0g � 1. For each objectivefunction, bg values are calculated for the last generation to compare theconvergence of the algorithms.
5.4 Results
In this section, the results of the experiments are presented and analysed in termsof previously reported performance measures. The results are provided as averages of 10problems in each problem set.
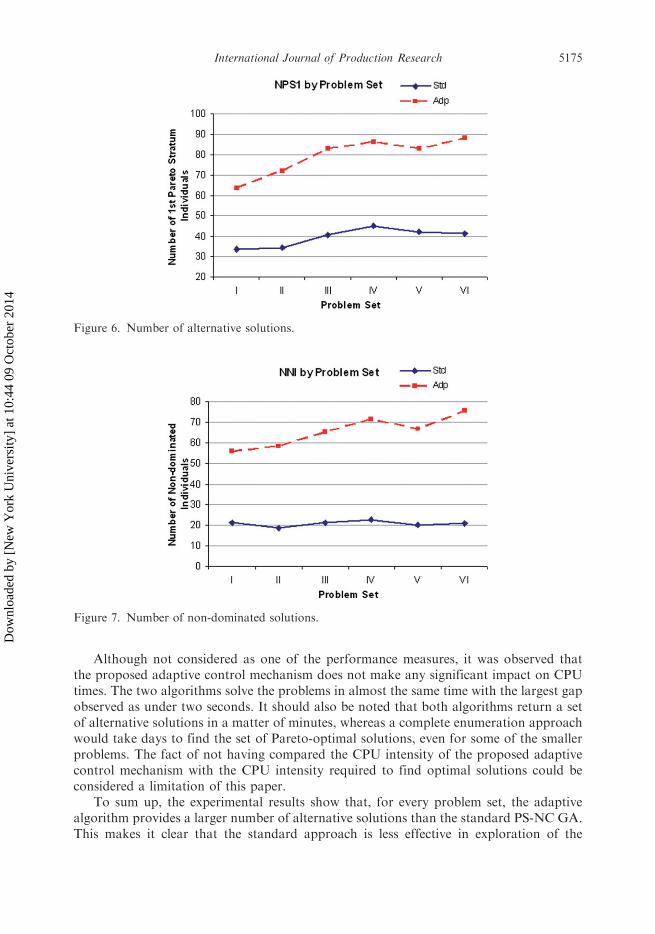
Figures 6 and 7 depict the number of first Pareto stratum individuals (NPS1) andnon-dominated individuals (NNI), respectively. In each figure, it is possible to see theperformance of both algorithms for every problem set.
Based on Figure 6, we can state that both of the algorithms tend to provide morealternative solutions as the problem size expands. Moreover, the adaptive algorithmprovides a larger number of solutions than the standard algorithm. Figure 7 shows theaverage number of non-dominated individuals for each algorithm and in each problem set.It is clear from this figure that the adaptive algorithm outperforms the standardalgorithms. The number of non-dominated individuals provided by the adaptive algorithmstarts from 55 and tends to increase as the problem size expands, whereas the performanceof the standard algorithm seems to stabilise around 20.
Figures 8 and 9 compare the standard and adaptive algorithms with respect toconvergence performance in the VPC and SC objectives, respectively. The deviations fromthe best value given on the y axis are obtained using Equation (11) for the last generationof each run. These values are then plotted for all six problem sets. It should be noted that,in these sets of comparative studies, the third objective function minimising utility workis ignored as the experiments show that this objective does not interfere with the other twoand generally converges to the best value very quickly.
Figure 8 shows that the results of the adaptive algorithm usually stay in the 5% vicinityof the best VPC values. However, the standard algorithm starts within the 5% vicinity andits performance becomes worse as the problem size expands. On the other hand, fromFigure 9 it can be seen that while the standard algorithm provides better SC results for thefirst three problem sets, the adaptive algorithm outperforms the standard algorithmfor large size problems.
5174 O.S. Akgunduz and S. Tunal|
Dow
nloa
ded
by [
New
Yor
k U
nive
rsity
] at
10:
44 0
9 O
ctob
er 2
014
Although not considered as one of the performance measures, it was observed thatthe proposed adaptive control mechanism does not make any significant impact on CPUtimes. The two algorithms solve the problems in almost the same time with the largest gapobserved as under two seconds. It should also be noted that both algorithms return a setof alternative solutions in a matter of minutes, whereas a complete enumeration approachwould take days to find the set of Pareto-optimal solutions, even for some of the smallerproblems. The fact of not having compared the CPU intensity of the proposed adaptivecontrol mechanism with the CPU intensity required to find optimal solutions could beconsidered a limitation of this paper.
To sum up, the experimental results show that, for every problem set, the adaptivealgorithm provides a larger number of alternative solutions than the standard PS-NC GA.This makes it clear that the standard approach is less effective in exploration of the
Figure 6. Number of alternative solutions.
Figure 7. Number of non-dominated solutions.
International Journal of Production Research 5175
Dow
nloa
ded
by [
New
Yor
k U
nive
rsity
] at
10:
44 0
9 O
ctob
er 2
014

solution space. Besides the quantity of solutions, it is also shown that the solution qualityof the adaptive approach is much better than that of the standard algorithm. This isreflected in the number of non-dominated individuals (see Figure 7). Lastly, the adaptivealgorithm converges to better results, which means it is much more effective in exploitationof the solution space.
6. Conclusion
A mixed-model assembly line is a type of production line that is capable of producinga variety of different product models simultaneously and continuously. Determiningthe sequence of products to be produced on MMALs has received considerable
Figure 8. VPC convergence performance.
Figure 9. SC convergence performance.
5176 O.S. Akgunduz and S. Tunal|
Dow
nloa
ded
by [
New
Yor
k U
nive
rsity
] at
10:
44 0
9 O
ctob
er 2
014

attention from researchers. This problem is known as the Mixed-Model Assembly LineSequencing Problem.
In the MMALSP literature, several objectives have been proposed to judge theefficiency of different production sequences. Particularly, for JIT systems, continual andstable part supply is an important requirement. Since this requirement can be realisedwhen the demand rate of parts is constant over time, minimising the variation in partconsumption rates is an important objective to be considered. Among other objectives,the minimisation of utility work and sequence-dependent setups has also attracted theattention of researchers. Considering the nature of real-world applications, it is oftennecessary to employ more than one objective when solving MMALSP efficiently. In sucha case, MMALSP becomes a multi-objective problem.
In this paper, we address the mixed-model assembly line sequencing problem, wherethere are multiple conflicting objectives. It is known that these types of sequencingproblems fall into the NP-hard class of combinatorial optimisation problems. Among theproposed solution approaches in the literature, genetic algorithms have been shown to bequite successful in dealing with many manufacturing optimisation problems. However,choosing the right values for the GA parameters is a time-consuming task. Moreover,different values of the parameters might be optimal for different stages of the searchprocess, which means that the use of fixed parameter values may lead to inferior algorithmperformance. Hence, in order to solve the multi-objective mixed-model assembly linesequencing problem efficiently, we propose an adaptive genetic-algorithm-based approachthat integrates an adaptive parameter control mechanism into the PS-NC geneticalgorithm presented by Ponnambalam et al. (2003). The APC mechanism modifiesthe probability of mutation and decides the elite individuals that will be preserved forsucceeding generations according to the feedback obtained during the run of thealgorithm.
Finally, we compared the performance of the proposed adaptive GA with the standardPS-NC GA in 60 test problems including those specifically constructed to simulate morerealistic scenarios (see problem sets V and VI). The experiments showed that the adaptiveGA-based approach outperformed the standard PS-NC GA in both the solution quantityand solution quality. As a result of this comparative study, we can state that both theexploration and exploitation performance of a genetic algorithm can be improvednoticeably using adaptive parameter control techniques.
References
Alpay, S., 2008. GRASP with path relinking for a multiple objective sequencing problem for amixed-model assembly line. International Journal of Production Research, DOI: 10.1080/
00207540802158291.Boysen, N., Fliedner, M., and Scholl, A., 2007. Sequencing mixed-model assembly lines to minimize
part inventory cost. OR Spectrum, 30 (3), 611–633.Boysen, N., Fliedner, M., and Scholl, A., 2009. Level scheduling of mixed-model assembly lines
under storage constraints. International Journal of Production Research, 47 (10), 2669–2684.Chang, P.-C., Hsieh, J.-C., and Wang, C.-Y., 2007. Adaptive multi-objective genetic algorithms
for scheduling of drilling operation in printed circuit board industry. Applied Soft ComputingJournal, 7 (3), 800–806.
Deb, K., 1999. Evolutionary algorithms for multi-criterion optimization in engineering design,
In: K. Miettinen, et al., eds. Evolutionary algorithms in engineering and computer science: recent
International Journal of Production Research 5177
Dow
nloa
ded
by [
New
Yor
k U
nive
rsity
] at
10:
44 0
9 O
ctob
er 2
014
advances in genetic algorithms, evolution strategies, evolutionary programming, genetic
programming, and industrial applications. New York: Wiley.
Drexl, A. and Kimms, A., 2001. Sequencing JIT mixed-model assembly lines under station-load and
part-usage constraints. Management Science, 47 (3), 489–491.
Drexl, A., Kimms, A., and Matthießen, L., 2006. Algorithms for the car sequencing and the level
scheduling problem. Journal of Scheduling, 9 (2), 153–176.
Eiben, A.E., Hinterding, R., and Michalewicz, Z., 1999. Parameter control in evolutionary
algorithms. IEEE Transactions on Evolutionary Computing, 3 (2), 124–141.
Herrera, F. and Lozano, M., 2003. Fuzzy adaptive genetic algorithms: design, taxonomy, and future
directions. Soft Computing, 7 (8), 545–562.
Ho, J.K.L., 2005. A proposed approach for reconfiguration of flexible assembly line systems by
motion genes. International Journal of Production Research, 43 (9), 1729–1749.
Huang, Y.P., Chang, Y.T., and Sandnes, F.E., 2006. Using fuzzy adaptive genetic algorithm for
function optimization, Fuzzy Information Processing Society. Proceedings of the Annual
Meeting of the North American, NAFIPS, 484–489.Hyun, C.J., Kim, Y.K., and Kim, Y., 1998. A genetic algorithm for multiple objective
sequencing problems in mixed model assembly lines. Computers and Operations Research,
25 (7–8), 675–690.Kim, Y.K., Hyun, C.J., and Kim, Y., 1996. Sequencing in mixed model assembly lines: A genetic
algorithm approach. Computers & Operations Research, 23 (12), 1131–1145.Kim, Y.K., Kim, J.Y., and Kim, Y., 2000. A coevolutionary algorithm for balancing and sequencing
in mixed model assembly lines. Applied Intelligence, 13 (3), 247–258.Kim, Y.K., Kim, J.Y., and Kim, Y., 2006. An endosymbiotic evolutionary algorithm for the
integration of balancing and sequencing in mixed-model U-lines. European Journal of
Operational Research, 168 (3), 838–852.
Mansouri, S.A., 2005. A multi-objective genetic algorithm for mixed-model sequencing on JIT
assembly lines. European Journal of Operational Research, 167 (3), 696–716.
McMullen, P.R., 1998. JIT sequencing for mixed-model assembly lines with setups using Tabu
search. Production Planning & Control, 9 (5), 504–510.
McMullen, P.R. and Frazier, G.V., 2000. A simulated annealing approach to mixed-model
sequencing with multiple objectives on a just-in-time line. IIE Transactions, 32 (8), 679–686.
McMullen, P.R., Tarasewich, P., and Frazier, G.V., 2000. Using genetic algorithms to solve the
multi-product JIT sequencing problem with set-ups. International Journal of Production
Research, 38 (12), 2653–2670.McMullen, P.R. and Tarasewich, P., 2006. Multi-objective assembly line balancing via a modified
ant colony optimization technique. International Journal of Production Research, 44 (1), 27–42.Miltenburg, J., 2002. Balancing and scheduling mixed-model U-shaped production lines. The
International Journal of Flexible Manufacturing Systems, 14 (2), 119–151.Miltenburg, J. and Sinnamon, G., 1989. Scheduling mixed-model multi-level just-in-time production
systems. International Journal of Production Research, 27 (9), 1487–1509.Monden, Y., 1993. Toyota production system. 2nd ed. GA: Industrial Engineering Press.
Ponnambalam, S.G., Aravindan, P., and Rao, M.S., 2003. Genetic algorithms for sequencing
problems in mixed model assembly lines. Computers & Industrial Engineering, 45 (4), 669–690.
Tan, K.C., Lee, T.H., and Khor, E.F., 2002. Evolutionary algorithms for multi-objective
optimization: performance assessments and comparisons. Artificial Intelligence Review,
17 (4), 253–290.Tseng, H.-E., et al., 2008. Hybrid evolutionary multi-objective algorithms for integrating assembly
sequence planning and assembly line balancing. International Journal of Production Research,
46 (21), 5951–5977.Wester, L. and Kilbridge, M., 1964. The assembly line model-mix sequencing problem. In: Third
international conference on operation research, 247–260.
5178 O.S. Akgunduz and S. Tunal|
Dow
nloa
ded
by [
New
Yor
k U
nive
rsity
] at
10:
44 0
9 O
ctob
er 2
014

Xu, Z. and Liang, M., 2006. Integrated planning for product module selection and assembly linedesign/reconfiguration. International Journal of Production Research, 44 (11), 2091–2117.
Yano, C.A. and Rachamadugu, R., 1991. Sequencing to minimize work overload in assembly lineswith product options. Management Science, 37 (5), 572–586.
Yu, J., Yin, Y., and Chen, Z., 2006. Scheduling of an assembly line with a multi-objective geneticalgorithm. The International Journal of Advanced Manufacturing Technology, 28 (5–6),551–555.
Zhao, S., Zhao, J., and Jiao, L. 2005. Adaptive genetic algorithm based approach for evolutionarydesign and multi-objective optimization of logic circuits. In: Proceedings of the 2005 NASA/DoD conference of evolution hardware, 67–72.
International Journal of Production Research 5179
Dow
nloa
ded
by [
New
Yor
k U
nive
rsity
] at
10:
44 0
9 O
ctob
er 2
014