Embed Size (px)
Citation preview

DOI: 10.1002/cssc.201100287
An Acrylate-Polymer-Based Electrolyte Membrane for Alkaline Fuel CellApplications
Yanting Luo,[a] Juchen Guo,[a] Chunsheng Wang,*[a] and Deryn Chu[b]
Alkaline fuel cells (AFCs) recently attracted renewed attentionbecause of their potential to surpass proton exchange mem-brane fuel cells (PEMFCs). The long-existing issues of PEMFCs,including expensive noble-metal catalysts and polymer electro-lytes,[1] as well as CO poisoning and inferior temperature en-durance,[1, 2] prevented them from being used in a broad rangeof applications.[3] Contrarily, advantages of AFCs include fast ki-netics in the reduction of the oxidizing agent[4] and the possi-bility to use base-metal catalysts.[5] However, a critical chal-lenge for conventional AFCs is the use of aqueous alkalineelectrolytes, which can react with CO2 from air to form carbon-ate salts (e.g. , K2CO3). As a result, the performance of the fuelcell would quickly deteriorate. To solve this problem, recent in-vestigations focused on intrinsically OH�-conducting alkalinepolymer electrolyte (APE) materials to replace the alkaline elec-trolytes. By using APEs, the formation of carbonate salts canbe prevented, which is attributable to the absence of metalions. However, carbonate ions might still be formed through areaction with CO2, which would result in a reduced OH� con-ductivity.[5–7] Application of APEs can also enable a compactdesign[8] and eliminate corrosion from alkaline solutions. Theseadvantages confirm that APE fuel cells (APEFCs) present a verypromising energy conversion technology. Because APEs are akey component determining the ultimate performance, theyshould exhibit a high OH� conductivity and superior mechani-cal properties, and in addition be of low cost.[9]
To date, the most common synthesis route for APEs is chlor-omethylation of polymers having a phenyl structured back-bone, which is followed by quaternization. Many polymershave been used as precursors to synthesize APEs, includingpolysulfone,[10–12] poly(arylene ether sulfone),[13] polyetherke-tone,[14] poly(ether imide),[15] polyethersulfone cardo,[16] poly(-phthalazinon ether sulfone ketone),[17] poly(dimethyl phenyleneoxide),[18] and poly(phenylene).[19, 20] Also, a recent study by Linand co-workers[21] reported high conductivity and mechanicalstrength for an alkaline polymer electrolyte based on a cross-linked ionic liquid. The phenyl backbones of the polymershave in common that they are all excellent engineering poly-mers exhibiting good mechanical properties because of rigid
ring structures. However, this advantage can be seriouslyweakened by the chloromethylation–quaternization process,which converts the polymer from an ionic insulator into anionomer and thus, from hydrophobic to hydrophilic. As aresult of the hydrophilicity, the mechanical properties of theAPEs in the humid working environment of a fuel cell can bevery different from that of the precursors. Because their back-bones consist of aromatic groups, these precursor polymerscan be modified to exhibit extreme hydrophilicity through thechloromethylation–quaternization process. The resulting APEmay have a very high anionic conductivity, but with very poormechanical properties in humid environment. Therefore, anobvious shortcoming of the chloromethylation–quaternizationprocess is the difficulty to control the degree of chloromethyla-tion and quaternization precisely,[11] thus making it difficult tobalance conductivity and mechanical properties. Cost is also aconcern, since the aforementioned APE precursors are high-cost polymers because of the sophisticated synthesis pro-cess.[22]
In a previous study, we reported a novel APE made frompoly (methyl methacrylate-co-butyl acrylate-co-vinylbenzylchloride) (PMBV).[7] This copolymer was synthesized using solu-tion-free radical polymerization. Xu and co-workers also report-ed an independent study on APE made from a copolymerusing similar polymerization methods.[23] Although this copoly-mer exhibits a promising performance, our previous study en-countered two problems: The three monomers, methyl metha-crylate (MMA), butyl acrylate (BA), and 4-vinylbenzyl chloride(VBC), have different reactivity ratios so that they polymerize atdifferent reaction rates. Because of the slow diffusion of propa-gating copolymer chains and the diluted monomer concentra-tion in the polymerization solution, the monomers with lowerreactivity ratios have a smaller possibility for complete conver-sion. Therefore, the copolymer composition did not match thedesigned monomer ratio. The second concern is that the mo-lecular weight of the copolymer in our previous study was notas high as expected, which could considerably weaken the me-chanical strength. To address these problems, we demonstratea novel bottom-up synthesis of PMBV by using mini-emulsionpolymerization for the first time. Unlike chloromethylation ofexisting polymers, we synthesized PMBV by using various mon-omers selected to meet the specifications for conductivity andmechanical strength. Specifically, VBC (15 mol %) contained thechloromethyl functional group, which could be quaternizedand then successively ion-exchanged to obtain OH� conductiv-ity.[24] Polymerized MMA exhibits a high rigidity and toughness.As a result, the MMA monomer (80 mol. %) was chosen to pro-vide mechanical strength. The brittleness inherent to MMA andVBC was overcome by adding a small portion of BA (5 mol %),which conferred flexibility to the resulting APE.
[a] Y. Luo, Dr. J. Guo, Prof. Dr. C. WangChemical and Biomolecular Engineering2113 Chemical and Nuclear EngineeringUniversity of Maryland, College Park, MD 20742 (USA)Fax: (+ 1) 301-314-9126E-mail : [email protected]
[b] Dr. D. ChuSensors and Electron Device DirectorateUS Army Research LaboratoryAdelphi, MD 20783 (USA)
Supporting Information for this article is available on the WWW underhttp://dx.doi.org/10.1002/cssc.201100287.
ChemSusChem 0000, 00, 1 – 4 � 2011 Wiley-VCH Verlag GmbH & Co. KGaA, Weinheim &1&
These are not the final page numbers! ��

The mini-emulsion polymerization (see the Supporting Infor-mation for mechanism schematics and polymer characteriza-tion) is a unique emulsion polymerization technique.[25, 26] Highshear force (e.g. , sonication) is usually employed to dispersemonomers in an aqueous phase as droplets. Compared to con-ventional emulsion techniques, the monomer droplet size ismuch smaller (a few hundreds of nanometers), and the dropletsize distribution is much more uniform. Because of the highsurface area of the monomer droplets, all surfactants are ad-sorbed on the droplet surface to stabilize the dispersion. More-over, small amounts of an extremely hydrophobic non-activereagent (e.g. , hexadecane) dissolved in the monomer dropletsare also used as co-stabilizer to further prevent Ostwald ripen-ing. Polymerization is primarily through radical (primary or oli-gomeric) entry into monomer droplets, when water phase ini-tiator is employed.[27] In mini-emulsions, each monomer drop-let can be considered as an individual reactor for bulk poly-merization. Because of the small reactor (i.e. , droplet) size, theeffect of slow diffusion of the propagating chains can be re-duced, and high monomer conversions can be achieved.Therefore, the composition of obtained copolymer is in goodagreement with the monomer ratio. Also, high molecularweights can be achieved through mini-emulsion polymeri-zation using mild conditions, thus eliminating the difficulties inmixing and heat management in bulk polymerizations.[28]
Moreover, water was used as the reaction medium in this mini-emulsion copolymerization, which made it environmentallyfriendly.
In our experiment, 97 % overall monomer conversion wasachieved after 120 min reaction (Figure S2 in the SupportingInformation). The molecular weight of the obtained PMBV co-polymer was 1.5 � 106 g mol�1 (Figure S3), which is six timeshigher than that of the copolymer in our previous study.[7] Thecomposition of the resulting PMBV was 78.8:4.8:16.4 (molar %of MMA/BA/VBC) according to calculations based on the1H NMR spectrum (Figure S4). This composition is in goodagreement with the monomer ratio in the reactant mixture(80:5:15). The glass transition temperature (Tg) of the PMBV co-polymer was 102 8C as determined by using differential scan-ning calorimetry (DSC, Figure S5), which is in agreement withresults calculated from measurements performed at 93 8C andbased on the composition.[29]
The complete synthesis route for the APE (see the Support-ing Information for details of membrane preparation and char-acterization) is shown in Scheme 1. Firstly, the PMBV copoly-mer was synthesized by using mini-emulsion polymerization.This was followed by quaternization of PMBV by reaction withtrimethylamine (Me3N) in dimethylformamide (DMF). The qua-ternized PMBV (QPMBV) was then cast to obtain a membraneand soaked in 6 m KOH at room temperature for 24 h to ex-change Cl� with OH� . After ion-exchange, the polymer mem-brane was washed with abundant water until pH7 wasreached. The final product, QPMBV-APE, was obtained afterdrying was completed. Elemental analysis revealed completequaternization (all VBC groups were quaternized). The productsfor each synthesis step are shown in Figure 1. Acid-basedback-titration measurements[30] indicated an ion-exchange ca-
pacity (IEC) of 1.28 mmol g�1, and the efficiency of ion-ex-change was estimated to be approximately 90 % (see the Sup-porting Information). The nature of conducting ions in QPMBV-APE was identified by using a titration method (Figure S8). Thetitration results indicated that most of the conducting ions(OH�) were converted to HCO3
� and/or CO32� approximately
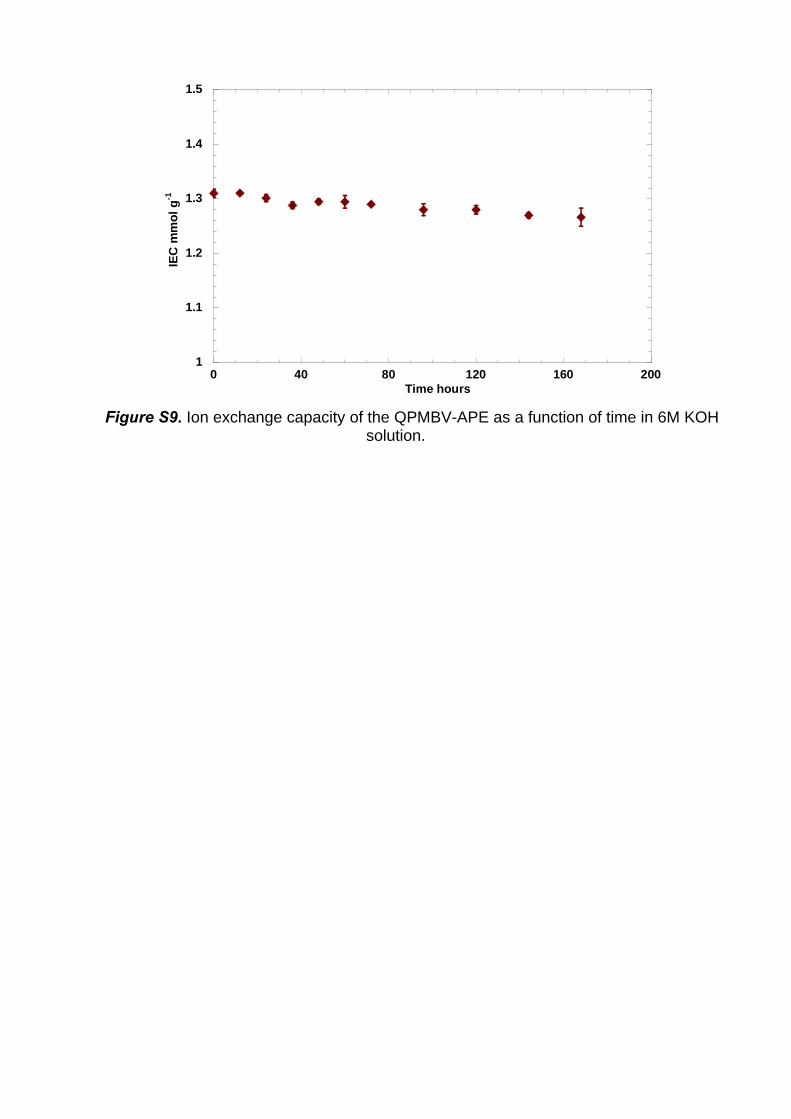
60 min after QPMBV-APE was neutralized. The stability of theconductivity at high pH values was also tested in a 6 m KOHsolution (Figure S9). The stability test indicated a 3.3 % de-crease in the IEC of QPMBV-APE being soaked in 6 m KOH solu-tion for 7 days.
Both water uptake and anionic conductivity of the QPMBVelectrolyte membranes were measured under fuel-cell opera-
Scheme 1. Synthesis of QPMBV-APE: mini-emulsion copolymerization (initia-tor: K2S2O8, surfactant: sodium dodecyl sulfate, co-stabilizer: hexadecane),APE quaternization, and ion-exchange.
Figure 1. a) PMBV copolymer powder after mini-emulsion copolymerisation;b) QPMBV membrane before ion-exchange being bent; c) ion-exchangedQPMBV-APE membrane being stretched; and d) MEA with QPMBV-APE mem-brane.
&2& www.chemsuschem.org � 2011 Wiley-VCH Verlag GmbH & Co. KGaA, Weinheim ChemSusChem 0000, 00, 1 – 4
�� These are not the final page numbers!

tion conditions [80 % relative humidity (RH) and 40–70 8C].Figure 2 depicts the water uptake of the QPMBV-APE mem-brane at 80 % RH as a function of temperature. The results arebased on triplicate measurements. The water uptake at 80 %RH was between 20 and 30 wt % in the temperature rangefrom 40 to 70 8C.
The anionic conductivity of QPMBV-APE was measured in afour-probe testing cell (BekkTech, BT-112) by using electro-chemical impedance spectroscopy (EIS, Figure S7). Figure 3shows the development of the conductivities in a temperaturerange from 50 to 80 8C and at 80 % RH. The calculated activa-tion energy was 52.2 kJ mol�1. The high anionic conductivity ofQPMBV-APE of up to 43 mS cm�1 could be attributed to15 mol % anions attached to the VBC group in the copolymer.
Prior to performance tests of fuel cells using APE (APE-FC), amembrane electrode assembly (MEA) was fabricated followingthe standard procedure detailed in the experimental section[31]
by using a 50 mm thick QPMBV-APE membrane as electrolyte
and QPMBV in an ethanol/water solution as ionomer. Pt wasused as a catalyst using a loading of 0.4 mg cm�2. Hydrogenand oxygen were used as the fuel and oxidant, respectively, at100�2 sccm (standard cm3 min�1). The performance of theQPMBV-APE fuel cells was tested at 80 % relative humidity (RH)at various temperatures by using a current scan rate of3 mA s�1 and a back pressure of 105 Pa. The use of a low-cur-rent scan rate was to ensure that the fuel cell performancereached steady state. As shown in Figure 4, the initial voltagedrop (�100 mV) was mainly attributable to an activation lossof the interfacial electrochemical charge-transfer reaction inthe catalyst layer of the MEA.[32] After the initial activation loss,the fuel cell voltage deceased gradually with an increase incurrent density. The fuel-cell performance was improved whenthe temperature increased from 50 to 70 8C. At 70 8C, the cur-rent density reached 500 mA cm�2, and the fuel cell could de-liver a peak power density of 180 mW cm�2. Even at lower tem-peratures (60 8C and 50 8C), the fuel-cell performance usingQPMBV-APE had maximum power densities of 160 and115 mW cm�2, respectively. This is among the best performan-ces reported for APE membranes.[20, 33–36] The energy outputwas approximately four times higher than in our previousstudy.[7] This improvement can be attributed to the fivefold in-creased anionic conductivity and the twofold thinner mem-brane used. Although the Pt catalyst loading was smaller,these improvements give rise to a better performance.
In conclusion, a novel APE was synthesized through mini-emulsion copolymerization with designed hydrophobic andhydrophilic (anion conducting) segments to balance conductiv-ity with mechanical strength. Our results indicated that the in-tentionally incorporated VBC functional groups were almostcompletely quaternized and ion-exchanged. The exceptionalAPE-FC performance revealed the great potential of QPMBV-APE. Not only was a promising APE synthesized, but this studyalso demonstrated a novel concept: alkaline polymer electro-lytes can be designed bottom-up through mini-emulsion poly-merization by precisely selecting the functional monomers.Figure 2. Water uptake by the OH�-exchanged QPMBV-APE membrane as a
function of temperature at 80 % RH.
Figure 3. Conductivity of the QPMBV-APE membrane as a function of tem-perature at 80 % RH.
Figure 4. I–V polarization curves of the QPMBV-APE-FC at 80 % RH (* 50 8C;~ 60 8C; ^ 70 8C).
ChemSusChem 0000, 00, 1 – 4 � 2011 Wiley-VCH Verlag GmbH & Co. KGaA, Weinheim www.chemsuschem.org &3&
These are not the final page numbers! ��
The conductivity and mechanical durability of the APE can betailored by selecting desirable monomer and controlling thepolymerization process. In this way, both properties can be im-proved without compromising the other. Furthermore, themini-emulsion copolymerization process can be used to syn-thesize high molecular weight APEs with superior mechanicalproperties. Control of the polymerization process, such asstep-wise monomer feeding, can be used to introduce favora-ble polymer chain sequences that could lead to hydrophobicand hydrophilic micro-phase separation. This will the subjectof future studies.
Experimental Section
Mini-emulsion copolymerization
The mini-emulsion was prepared by dispersing a mixture of mono-mers (30 g) with a designed molar ratio (MMA/BA/VBC = 80:5:15)and hexadecane (0.12 g) in an aqueous sodium dodecyl sulfate so-lution (SDS, 0.01 mol L�1, 150 mL) by applying ultrasonic shearingto form a stable mini-emulsion using a homogenizer (Omni SonicRuptor 400) at 30 % power output for 9 min. The polymerizationwas initiated by injection of the initiator potassium peroxydisulfate(KPS) (0.01 mol L�1 in the water phase) into the mini-emulsion at70 8C under a nitrogen atmosphere. The reaction was terminatedafter 4 h by quenching in an ice bath. The copolymer was filteredand dried in a fume hood overnight and was further dried in avacuum oven at 60 8C for 24 h.
Membrane preparation
The obtained PMBV was dissolved in dimethylformamide (DMF) at80 8C and quaternized using trimethylamine (Me3N, Sigma–Aldrich)at 80 8C for 2 h by bubbling Me3N into the solution while stirring.The QPMBV solution in DMF was then cast as a film and dried in avacuum oven at 60 8C for 24 h. The obtained membrane wassoaked in a 6 m KOH solution overnight to exchange Cl� with OH� .The OH�-exchanged membrane was washed with deionized wateruntil pH7 was reached.
Fabrication of the membrane electrode assembly (MEA)
Carbon paper (Toray, TGP-H-60) was first brushed by using a PTFE/carbon black slurry ((35/65 wt %, 0.2�0.02 mg cm�2). The Pt/C cata-lyst (60/40 wt %) was dispersed in a dilute OH�-exchanged QPMBVsolution in an ethanol/water mixture (50/50 vol %) by sonication.This catalyst dispersion was sprayed onto the processed carbonpaper giving a Pt loading of 0.4�0.05 mg cm�2. Then the QPMBV-APE membrane was sandwiched between two catalyst-loadedcarbon papers (5 cm2) by using a hot-press (Carver 973214 A)under a pressure of 2 � 105 Pa at 60 8C for 10 min to obtain theMEA for the performance test.
Acknowledgements
This work was supported by the Office of Naval Research(N000140810717), the Army Research Lab (W911NF0920007), and
the Army Research Office (W911NF0910028). The authors aregrateful to Prof. P. Kofinas at the University of Maryland for thetechnical support.
Keywords: energy conversion · fuel cells · membranes ·polymer electrolytes · polymerization
[1] R. Devanathan, Energy. Environ. Sci. 2008, 1, 101 – 119.[2] J. J. Baschuk, X. Li, Int. J. Energy Res. 2001, 25, 695 – 713.[3] S. J. Hamrock, M. A. Yandrasits, Polym. Rev. 2006, 46, 219 – 244.[4] B. Y. S. Lin, D. W. Kirk, S. J. Thorpe, J. Power Sources 2006, 161, 474 – 483.[5] H. Yanagi, K. Fukuta, ECS Trans. 2008, 16, 257 – 262.[6] A. Filpi, M. Boccia, H. A. Gasteiger, ECS Trans. 2008, 16, 1835 – 1845.[7] Y. Luo, J. Guo, C. Wang, D. Chu, J. Power Sources 2010, 195, 3765 – 3771.[8] J. R. Varcoe, R. C. T. Slade, Fuel Cells 2005, 5, 187 – 200.[9] D. Tang, J. Pan, S. Lu, L. Zhuang, J. Lu, Sci. China : Chem. 2010, 53, 357 –
364.[10] J. Pan, S. Lu, Y. Li, A. Huang, L. Zhang, J. Lu, Adv. Funct. Mater. 2010, 20,
312 – 319.[11] G. Wang, Y. Weng, D. Chu, R. Chen, D. Xie, J. Membr. Sci. 2009, 332, 63 –
68.[12] S. Lu, J. Pan, A. Huang, L. Zhuang, J. Lu, Proc. Natl. Acad. Sci. USA 2008,
105, 20611 – 20614.[13] J. Zhou, M. Unlu, J. A. Vega, P. A. Kohl, J. Power Sources 2009, 190, 285 –
292.[14] Y. Xiong, Q. Liu, Q. Zeng, J. Power Sources 2009, 193, 541 – 546.[15] G. Wang, Y. Weng, J. Zhao, R. Chen, D. Xie, J. Appl. Polym. Sci. 2009, 112,
721 – 727.[16] L. Li, Y, Wang, J. Membr. Sci. 2005, 262, 1 – 4.[17] J. Fang, P. Shen, J. Membr. Sci. 2006, 285, 317 – 322.[18] L. Wu, T. Xu, D. Wu, X. Zheng, J. Membr. Sci. 2008, 310, 577 – 585.[19] M. R. Hibbs, C. H. Fujimoto, C. J. Cornelius, Macromolecules 2009, 42,
8316 – 8321.[20] E. E. Switzer, T. S. Olson, A. K. Datye, P. Atanassov, M. R. Hibbs, C. Fujimo-
to, C. J. Cornelius, Electrochim. Acta 2010, 55, 3404 – 3408.[21] B. Lin, L. Qiu, J. Lu, F. Yan, Chem. Mater. 2010, 22, 6718 – 6725.[22] K. Cousins, Polymers for Electronic Components, Rapra Technology, UK,
2001, p. 15.[23] H. Xu, J. Fang, M. Guo, X. Lu, X. Wei, S. Tu, J. Membr. Sci. 2010, 354,
206 – 211.[24] L. Dominguez, J. Economy, K. Benak, C. L. Mangun, Polym. Adv. Technol.
2003, 14, 632 – 637.[25] J. Reimers, F. J. Schork, J. Appl. Polym. Sci. 1996, 59, 1833 – 1841.[26] F. J. Schork, J. Guo, Macromol. React. Eng. 2008, 2, 287 – 303.[27] J. Guo, F. J. Schork, Macromol. React. Eng. 2008, 2, 265 – 276.[28] Y. Luo, I. Chou, W. Chiu, C. Lee, J. Polym. Sci. , Part A: Polym. Chem. 2009,
47, 4435 – 4445.[29] J. E. Mark, A. Eisenberg, W. W. Graessley, Physical Properties of Polymers,
American Chemical Society, Washington DC, USA, 1993, p. 87.[30] G. Hwang, H. Ohya, J. Membr. Sci. 1998, 140, 195 – 203.[31] S. Gamburzev, A. J. Appleby, J. Power Sources 2002, 107, 5 – 12.[32] R. O’Hayre, S.-W. Cha, F. B. Prinz, W. Colella, Fuel Cell Fundamentals, John
Wiley & Sons, New York, 2005, pp. 204 – 224.[33] E. Agel, J. Bouet, J. F. Fauvarque, J. Power Sources 2001, 101, 267 – 274.[34] K. Matsuoka, Y. Iriyama, T. Abe, M. Matsuoka, Z. Ogumi, J. Power Sources
2005, 150, 27 – 31.[35] J. R. Varcoe, R. C. T. Slade, Electrochem. Commun. 2006, 8, 839 – 843.[36] S. Gu, R. Cai, T. Luo, Z. Chen, M. Sun, Y. Liu, G. He, Y. Yan, Angew. Chem.
2009, 121, 6621 – 6624; Angew. Chem. Int. Ed. 2009, 48, 6499 – 6502.
Received: June 9, 2011Published online on && &&, 0000
&4& www.chemsuschem.org � 2011 Wiley-VCH Verlag GmbH & Co. KGaA, Weinheim ChemSusChem 0000, 00, 1 – 4
�� These are not the final page numbers!

COMMUNICATIONS
Y. Luo, J. Guo, C. Wang,* D. Chu
&& –&&
An Acrylate-Polymer-Based ElectrolyteMembrane for Alkaline Fuel CellApplications
Monomers rule: A novel bottom-upsynthesis of an alkaline polymer electro-lyte by applying mini-emulsion copoly-merization is demonstrated. This synthe-sis approach can be used to control andtune conductivity and mechanical prop-erties of the electrolyte. The processedelectrolyte membrane exhibits superiorpower performance in alkaline fuel cells,which demonstrates the great potentialof these membranes to be used in nextgeneration energy conversion systems.
ChemSusChem 0000, 00, 1 – 4 � 2011 Wiley-VCH Verlag GmbH & Co. KGaA, Weinheim www.chemsuschem.org &5&
These are not the final page numbers! ��

Supporting Information� Copyright Wiley-VCH Verlag GmbH & Co. KGaA, 69451 Weinheim, 2011
An Acrylate-Polymer-Based Electrolyte Membrane for Alkaline Fuel CellApplications
Yanting Luo,[a] Juchen Guo,[a] Chunsheng Wang,*[a] and Deryn Chu[b]
cssc_201100287_sm_miscellaneous_information.pdf

1. Miniemulsion Copolymerization and Polymer Chracterization
• Only Monomer Droplets • Droplet Diameter ( 50-300 nm ) • Sonication or Homogenization • Costabilized (hexadecane, cetyl alcohol) • Nucleation in Droplets • No Mass Transfer (except aq. radicals)
Figure S1. Miniemulsion copolymerization system schematics.
Conversion Test: Prior to the copolymerization, aluminum weight pans pre-loaded with trace amount of hydroquinone (as polymerization terminator) were weighted and recorded. During the copolymerization, small amount of miniemulsion reaction content was drawn from the reactor flusk from various intervals, and put in the aluminum pan and weighted. After completely drying the drawn miniemulsion content in vaccum oven overnight, the obtained residue (with the pan) was weighted again. The monomer conversion was cacluated by gravimetric method using following equation
ηwetW
HD)wt%KPS(SDSwetWWConversion dry
×
++×−= (1)
where Wdry was the weight of the residue in the weighting plate; (SDS+KPS+HD) wt% is the total weight percentage of SDS (surfactant), KPS (initiator), and hexadecane (costabilizer) in the reactant mixture; Wwet was the weight of the miniemulsion content drawn to the weight pan; and η is the weight percentage of monomers in the entire reactant mixture. Figure S2 is the overall monomer conversion as a function of reaction time. It indicates 97% conversion of the monomers after 120 min.
0
0.2
0.4
0.6
0.8
1
0 50 100 150
Con
vers
ion
Time min
200
Figure S2. Miniemulsion copolymerization monomer conversion plot.
Molecular Weight: GPC (gel permeation chromatography, Waters 2410 Refractive Index Detector, Polymer Labs mixed-bed column ranged from 500 to 10,000,000 g/mol) was used to determine the molecular weight of PMBV. Tetrahydrofuran (THF) was used as the carrier solvent in GPC. The flow rate of THF was 1 ml min-1. Five PMMA standard samples (polymer laboratory®) with different

molecular weights (GPC spectra shown in Figure S3a) were used as the standards to obtain a third-order polynomial equation for the calibration curve of molecular weight versus retention time. Figure S3b was the GPC spectrum of the PMBV copolymer. Table S1 listed the GPC results of the PMBV copolymer.
Table S1. MWs of PMBV PMBV
Number-average MW g/mol 6.4×10⁵
Weight-average MW g/mol 1.5×10⁶
PDI 2.3
9 10 11 12 13 14 15 16 17 18
Time min
948,500 g/mol
485,300 g/mol
106,100 g/mol
20,050 g/mol
1,970 g/mol
Figure S3. (a) GPC spectra of standard polymer.
9 10 11 12 13 14 15 16 17 18
Time / min
Figure S3. (b) GPC spectrum of PMBV. Polymer Composition: 1H-NMR (proton nuclear magnetic resonance, Bruker DRX-400 high resolution) spectrum was used to calculate the composition of the obtained PMBV. Figure S4 was the 1H-NMR spectrum of copolymer PMBV. Characteristic peaks of chemical shifts(δppm) at 4.495(d, 2H, -CH2Cl in VBC), 3.995(d, 2H, -OCH2- in BA), and 3.595(t, 3H, -OCH3 in MMA) confirmed PMBV copolymer. The composition was list in Table S2. It was shown that the composition in PMBV caculated from NMR is in great agreement with that of monomers.
Table S2. composition of PMBV MMA BA VBC
Composition in PMBV mol.% 78.8 4.8 16.4 Recipe Monomer Ratio mol.% 80 5 15

Figure S4. 1H-NMR spectrum of copolymer PMBV
MMA
VBC
BA
Glass Transition Temperature: The glass transition temperature (Tg) of PMBV copolymer could be
estimated by the following expression
1 PVBCPMMA PBA
PMMA PBA PVBC
WW W
Tg Tg Tg Tg= + +
(2)
where W with subscript is the mass ratio of each component in the polymer, and Tg with subscript represents the glass transition temperature of the corresponding homopolymer. Table S3 listed the Tg of homopolymers for the PMBV content (Data were obtained from the Polymer Hand Book). The Tg of PMBV was caculated from Equation (2). DSC (Differential scanning calorimetry, TA Instruments Q100) was also used to determine the Tg of PMBV. Figure S5 was the DSC plot of PMBV. The peak of the derivative heat flow versus temprature curve indicated a Tg of 102 ºC. The difference between glass transition temperatures obtained from these two methods is mainly from the rotational barriers between two different monomer pairs.
Table S3. estimated Tg in ideal situation for PMBV Tg
PMMA (78.8 mol. %) 105 PBA (4.8 mol. %) -49
PVBC (16.4 mol. %) 114 PMBV 92.9

-3
-2
-1
0
1
-0.1
-0.05
0
0.05
-40 0 40 80 120 160 200
Hea
t Flo
w m
W
Derivative H
eat Flow dm
W/dT
Temperature ℃ Figure S5. DSC thermo gram of PMBV 2. Electrolyte Membrane Preparation and Characterization
Element Analysis: The degree of quaternization was determined by elemental analysis (Atlantic Microlab® of combustion). Assuming all functional group VBC was reacted with TMA (Me3N), the theoretical composition of N in the QPMBV copolymer can be calculated by
3
100%( )
N VBCN
MMA MMA BA BA VBC Me N VBC
M WWM W M W M M W
×=
× + × + + ×× (3)
where M with subscript is the molecular weight of the corresponding monomer, compound, or element; W with subscript is the composition molar ratio of the corresponding substance. Using this formula, the theoretical weight percentage of N element was 2 wt. % in the QPMBV. Combustion test result suggested 2.26 wt. % N in the QPMBV after two hours of quaternization, and did not change afterwards. This value is within the experimental error (±0.5%). The excess amount of N is possibly due to the trace of DMF solvent left in the membrane even after vacuum drying.
Ion Exchange Capacity (IEC) and Ion Exchange Efficiency (IEE): The IEC of APE membrane was measured by acid-based back-titration. The dry membrane sample was immersed in 6M KOH solution overnight to exchange into OH- form. After being washed with de-ion water until pH reaching 7, the sample was soaked in 30mL of 0.01M standardized HCl solution for one day to ensure the neutralization of OH- in the membrane. The IEC value was then determined from back-titration of the excess HCl with 0.01M NaOH solution, which can be calculated by
1( ) (HCl NaOH
dry
V V CIEC mmol gm
−− ×= )⋅ (4)
where VHCl is the volume of HCl solution for membrane soaking; VNaOH is the volume of NaOH solution used in back-titration; C is the concentration of HCl and NaOH solution in mmol mL-1. mdry is the mass of the dry membrane. The OH- weight percentage of the exchanged cation sites can be calcuated as
(5) 100%OH OHW IEC M= × ×
where MOH is the molecular weight of OH-. The calculation showed that the changed OH- weight percentage was 2.2%. That indicated an IEE (Equation 6) of 89.6% for paired cation sites that changed from Cl- to OH- form.
OH
OHN
N
WIEE MWM
=×
(6)
QPMBV-APE Tensile Test: Tensile test was performed at the stretch rate of 1N/min at room temperature. The tensile test was performed in the worst scenario of fuel cell operation environment, i.e. the QPMBV-APE was fully saturated with DI water by soaking in

DI water for one hour before the test. Water uptake at full water saturation was determined by gravimetric method. The strain vs. stress plot is shown in Figure s6, and the obtained mechanical properties are listed in Table S4. The Young’s modulus and elongation indicated an elastic QPMBV-APE membrane.
0
0.2
0.4
0.6
0.8
1
1.2
1.4
0 50 100
Stre
ss (M
Pa)
Strain % 150
Figure S6. stress-strain plot for water saturated QPMBV-APE.
Table S4. Basic properties of QPMBV-APE
Properties at ambient temperature QPMBV-APE Thickness(µm) 50
Young’s modulus(MPa) a 0.93Yield Stress(MPa) a 1.25Elongation at yield a 130%Water uptake a 325 ± 32 %
a saturated with water
Swelling ratios: Three dimementional (length, width, and thickness) swelling ratios were measured in the situation of fully saturated with water at room temperature. The dimentional swelling ratios was calculated as:
100%dry
SRl
= ×wet dryl l− (7)
The three dimentional swelling ratios at room temperatures are listed in Table S5.
Table S5.Swelling ratios at room temperature in fully water saturated situation Length Width Thickness
Swelling Ratio (%) 31.6 29.0 91.6
Mechanical Stability in Hot Water: Swelling ratios of the membrane in 70 °C water were also measured after full water saturation. The swelling ratios were measured again after 24 hrs soaking in 70 °C water as an indication of the mechanical stability in high temperature water. There was only a slight increase in swelling ratios after 24 hrs as shown in Table S6, which implied that our QPMBV membrane was durable in hot water.

Table S6. Mechanical stability in hot water 70 °C 70 °C after 24hrs
Swelling Ratios (%)
Length 50.6 52.5 Width 40.3 44.8
Thickness 125.0 137.5
Conductivity Measurement: Anion conductivities were measured using EIS (electrochemical impedance spectroscopy, Gamry Instruments 3000, Potentiostat/ Galvanostat/ ZRA) with the fixture of conductivity cell (BekkTech, BT-112). The temperature and humidity in the conductivity cell were controlled using the fuel cell test station (Arbin, 2000). The relativive humidity (RH) was adjusted by dew point temperature (DPT) and gas supply temperature (GST) from Arbin test station. Figure S7 showed the Nyquist plot of the QPMBV-APE in different temperatures. The conductivies of QPMBV-APE at different temperatures at 80% RH were calculated using equation 7 and summerized in Table S6.
Rab=σ l (8)
where l is the membrane thickness, a is the membrane width, b is the membrane length between the probes and R is the resistance obtained from EIS.
0
500
1000
1500
2000
2000 5000 8000 11000 14000 17000
-Zim
ag O
hm
Zreal Ohm
50 ℃
60 ℃65 ℃
70 ℃75 ℃80 ℃
2500
Figure S7. Nyquist plot of APE from 50 ℃ to 80℃
Table S7. Conductivities of QPMBV-APE at different temperatures at 80% RH
T (°C) 50 60 65 70 75 80 Conductivity(S cm-1) 0.84×10⁻² 1.5×10⁻² 1.9×10⁻² 2.7×10⁻² 3.4×10⁻² 4.3×10⁻²
Determination of Conducting Ion: Warder titration was used to identify different conducting Ions. The detailed procedure was as follows: The QPMBV memebranes were kept in 6M KOH sultion. Prerior to the tiration, a number of QPMBV membranes were taken out of the KOH solution at the same time, and rinsed with de-ionized (DI) water until the pH of these membranes reached 7. Then, one of these
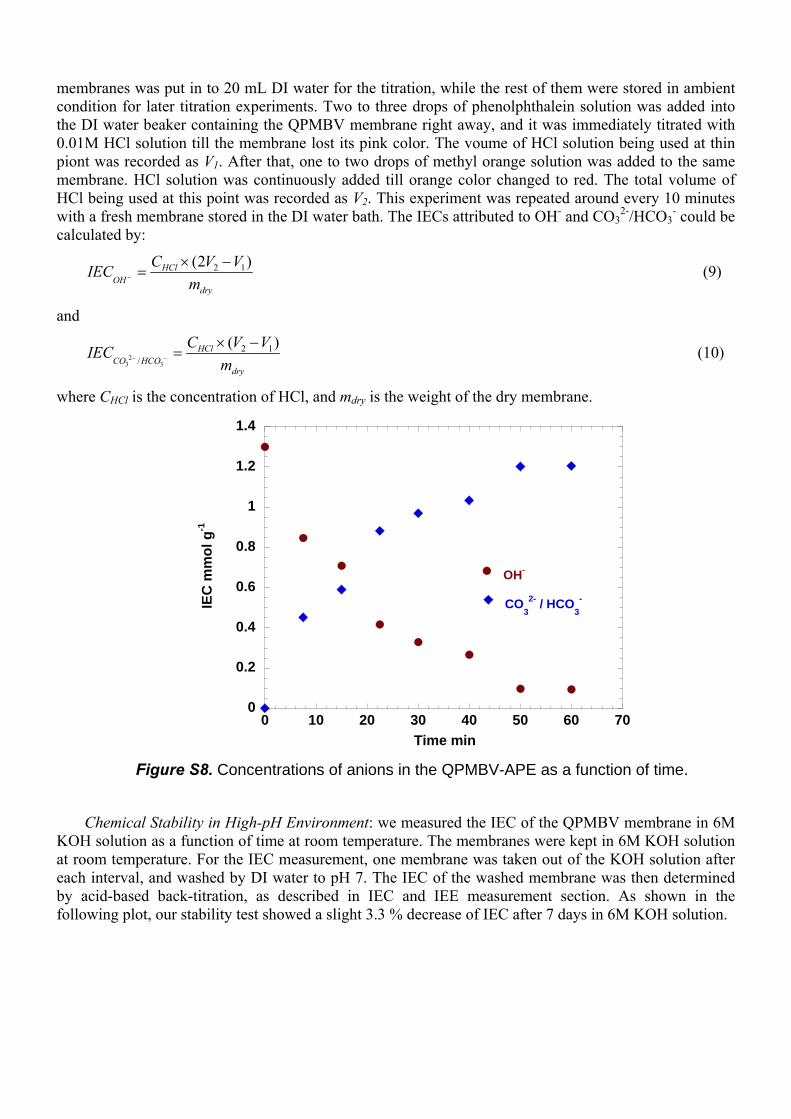
membranes was put in to 20 mL DI water for the titration, while the rest of them were stored in ambient condition for later titration experiments. Two to three drops of phenolphthalein solution was added into the DI water beaker containing the QPMBV membrane right away, and it was immediately titrated with 0.01M HCl solution till the membrane lost its pink color. The voume of HCl solution being used at thin piont was recorded as V1. After that, one to two drops of methyl orange solution was added to the same membrane. HCl solution was continuously added till orange color changed to red. The total volume of HCl being used at this point was recorded as V2. This experiment was repeated around every 10 minutes with a fresh membrane stored in the DI water bath. The IECs attributed to OH- and CO3
2-/HCO3- could be
calculated by:
2 1(2 )HClOH
dry
C V VIECm−
× −= (9)
and
23 3
2 1/
(HClCO HCO
dry
C V VIECm− −
× −=
) (10)
where CHCl is the concentration of HCl, and mdry is the weight of the dry membrane.
0
0.2
0.4
0.6
0.8
1
1.2
1.4
0 10 20 30 40 50 60 70
OH-
CO32- / HCO
3-IE
C m
mol
g-1
Time min
Figure S8. Concentrations of anions in the QPMBV-APE as a function of time.
Chemical Stability in High-pH Environment: we measured the IEC of the QPMBV membrane in 6M KOH solution as a function of time at room temperature. The membranes were kept in 6M KOH solution at room temperature. For the IEC measurement, one membrane was taken out of the KOH solution after each interval, and washed by DI water to pH 7. The IEC of the washed membrane was then determined by acid-based back-titration, as described in IEC and IEE measurement section. As shown in the following plot, our stability test showed a slight 3.3 % decrease of IEC after 7 days in 6M KOH solution.
1
1.1
1.2
1.3
1.4
1.5
0 40 80 120 160 200
IEC
mm
ol g
-1
Time hours
Figure S9. Ion exchange capacity of the QPMBV-APE as a function of time in 6M KOH solution.


![Development and testing of novel catalyst-coated membrane with … for alkaline water... · overpotential [3-6] or by using alkaline polymer electrolyte membrane separators [1, 7-9]](https://img.dokumen.tips/doc/110x75/60e00dfbc57c1c3e80321786/development-and-testing-of-novel-catalyst-coated-membrane-with-for-alkaline-water.jpg)