Embed Size (px)
Citation preview

AN ABSTRACT OF THE DISSERTATION OF
David B. Rolloff for the degree of Doctor of Philosophy in Forest Resources
presented on May 22, 1998. Title: Scenic Quality at Crater Lake National Park:
Visitor Perceptions of Natural and Human Inf1uenc.
Abstract approved:
Bo/Shelby
This study explored park visitors' preferences for scenic vistas at Crater Lake
National Park, and whether their scenic evaluations would be affected if water levels
of Crater Lake changed. Three main areas were addressed in the study. The first
tested park visitors' ability to perceive differences in the level of Crater Lake if it was
lowered, and if the present lake level would be preferable to depictions showing
reductions of 25, 75 and 125 feet. The second area investigated whether visitors would
find alternative human uses of Crater Lake water acceptable. The third area
considered the influence of information as it relates to natural variation and human
influence on scenic perception at Crater Lake.
Study participants included 1202 visitors at Crater Lake National Park during
summer and fall seasons of 1996 and 1997. A multi-method approach to scenic
perception and preference was utilized in this study, including a visual experiment, an

attitudinal survey, and group interviews. Survey methods were based on photographs
of three Crater Lake views depicting the current level and three lowered lake levels.
The simulation of the visual change in photographs was created using a computer
graphics program.
Results of the study indicate that visitors prefer views of the lake that reflect
Crater Lake with water levels at their present level. This was true when visitors had
no information about the changing lake levels, and was more pronounced when
visitors were informed about the lowered levels. Results also indicated that when
respondents were informed that lake levels were changing due to human uses of Crater
Lake water, the information had a more negative affect on respondents' preferences
than other types of information. This was consistent with the results on visitor
attitudes toward alternative uses of Crater Lake water as expressed in the survey and
interviews.
The sensitivity of public attitudes toward national park preservation and
natural scenery is well documented in the literature. Results from this study at Crater
Lake confirm that park visitors' scenic evaluations can be negatively influenced by
perceived changes in scenery, and that potential human use of Crater Lake water is
unacceptable.

Scenic Quality at Crater Lake National Park:
Visitor Perceptions of Natural and Human Influence
by
David B. Rolloff
A DISSERTATION
submitted to
Oregon State University
in partial fulfillment ofthe requirements for the
degree of
Doctor of Philosophy
Presented May 22, 1998Commencement June 1999

ACKNOWLEDGMENTS
My committee has provided me with considerable guidance and patience. My
major professor, Bo Shelby, gave much encouragement and has offered me many
opportunities for which I am particularly grateful. Rebecca Johnson and George
Stankey offered insight, guidance, humor, and became important mentors. Catherine
Knott introduced me to rural communities in Oregon and provided much assurance.
I am grateful for the analytical insights of Thomas Maan, Dept. of Statistics,
OSU and Yeon-Su Kim, Dept. of Forest Resources, OSU. Ruth Jacobs, Cooperative
Park Studies Unit, OSU, provided invaluable assistance. Contributing much help
from the National Park Service were Mac Brock and Kent Taylor at Crater Lake
National Park and Jeff Albright with the NPS' Water Resources Division.
My friends, Kiko, Marlys, RJ, Stefan, and Sandie, are valued tremendously. I
have particular thankfulness for Barb, a source of home and spirit. Thanks especially
to Troy, my colleague, trailmate, and friend, for showing me the field.
I am fortunate that my family has been a profound source of support
throughout my academic and outdoor years. My sisters Kristi and Sally gave much
needed assurance across the miles. Gratitude is held especially for my parents, who
encouraged me through all my years outdoors and reminded me where home is.
I have life more abundantly because of them.

TABLE OF CONTENTS
Page
Chapter 1. INTRODUCTION 1
Motivation for Studying Scenic Quality at Crater Lake National Park 4
Study Design 4
Study Goals and Objectives 5
Organization of the Dissertation 9
Chapter 2. LITERATURE REVIEW 11
A Note on Scenic Quality Phrases. 12
Scenic Values Over Time 13
Scenic Preservation and Natural Resource Policy 15
Scenic Quality Evaluation: Theoretical Developments 18
Scenic Quality Evaluation: Methodology 20
Evaluation Methods: The use of photographic representations 26
Effects of Information on Scenic Quality Judgments 29
Scenic Quality Research in the National Park System 31
Scenic Quality and Preservation Values at Crater Lake National Park 33
Theoretical and Applied Issues 35

TABLE OF CONTENTS (Continued)
Page
Chapter 3. METHODS 37
Objectivist and Subjectivist Perspectives 37
The Transactional Approach 39
Overall Study Design 39
Scenic Preference and Attitude Study 40
Scales of Measurement 52
Data Analysis 54
Calculation of the Dscore 57
Focused Interview Study 62
Chapter 4. RESULTS 64
Study Sample 64
Instrumental Consistency 68
Mean Responses to Slide Pairs 73
The Mean Number of Times a View was Preferred 82
Perceived Difference in Crater Lake Levels 85
Participants' Preferences for Crater Lake Levels 90
Attitudes Toward Use of Crater Lake Water 91
Modeling Perception of Differences 97

TABLE OF CONTENTS (Continued)
Page
Chapter 5. DISCUSSION 101
Overall Implications 101
Visual Perception and Preference 102
Effect of Information 105
Acceptability of Potential Human Uses of Crater Lake Water 106
Study Limitations 107
Future Research 108
Theoretical Implications 114
Implications for Park Management 115
REFERENCES 118
APPENDICES 133
Appendix A: VISITOR CENTER SCENIC PREFERENCE SURVEY 134
Appendix B: RIM VILLAGE SAMPLE SURVEY 140
Appendix C: VISITOR SURVEY INSTRUCTIONS 143
Appendix D: SLIDE IMAGES 146
Appendix E: GROUP INTERVIEW INSTRUCTIONS 155
Appendix F: GROUP INTERVIEW SURVEY FORM 160
Appendix G: RESULTS FROM THE PSCORE ANALYSIS 162

LIST OF FIGURES
Figure Page
2.1. Diagram of Relational Model of Landscape Assessment 23
3.1. Location of Study Viewpoints 46
4.1. View 1 (Rim Village) 74
4.2. View 2 (Discovery Point) 74
4.3. View 3 (Merriam Point) 74
4.4. View 1 (Rim Village) 76
4.5. View 2 (Discovery Point) 76
4.6. View 3 (Merriam Point) 76
4.7. View 1 (Rim Village) 78
4.8. View 2 (Discovery Point) 78
4.9. View 3 (Merriam Point) 78
4.10. View 1 (Rim Village) 80
4.11. View 2 (Discovery Point) 80
4.12. View 3 (Merriam Point) 80
4.13. View 1 (Rim Village) 81
4.14. View 2 (Discovery Point) 81
4.15. View 3 (Merriam Point) 81
4.16. Visitor Attitudes Toward Use of Crater Lake Water 92

LIST OF TABLES
Table Page
3.1. Slide Set Format 48
3.2. Information Treatments 52
3.3. Scoring System for Correctly Perceived Differences 57
3.4. Expected Counts Table 58
3.5. Observed Counts Table. (Far from expected) 59
3.6. Observed Counts Table. (Close to expected) 59
3.7. Worst Case Counts Table. (Furthest from expected). 60
4.1. Participant Characteristics and Trip Information. 65
4.2. View Preferences. 83
4.3. Analysis of Variance Table for Difference Scores. 87
4.4. Mean Difference Scores for the 5 Treatment Groups 87
4.5. Contrast Table for Treatment Comparisons Relating to the Dscore 89
4.6. Final Model from the Dscore. 98

LIST OF APPENDIX FIGURES
Figure Page
DI. View 1 Level 1, Rim Village, average level 147
View 1 Level 2. Rim Village, - 25 feet 147
View 1 Level 3. Rim Village, - 75 feet 148
View 1 Level 4. Rim Village, - 125 feet 148
View 2 Level 1. Discovery Point, average level 149
View 2 Level 2. Discovery Point, - 25 feet 149
View 2 Level 3. Discovery Point, - 75 feet 150
View 2 Level 4. Discovery Point, - 125 feet 150
View 3 Level 1. Merriam Point, average level 151
View 3 Level 2. Merriam Point, -25 feet 151
D. 11. View 3 Level 3. Merriam Point, - 75 feet 152
D.12. View 3 Level 4. Merriam Point, - 125 feet 152
Information Treatments 3 & 4. Example of label for average lake level 153
Information Treatment 3. Example of natural variation label 153
D.15. Information Treatment 4. Example of human uses label 154

LIST OF APPENDIX TABLES
Table Page
Analysis of Variance Table for Preference Scores. 165
Mean Preference Scores for the 5 Treatment Groups. 165
Contrast Table for Treatment Comparisons Relating to the Pscore. 166
Final Model from the Pscore. 168

SCENIC QUALITY AT CRATER LAKE NATIONAL PARK:
VISITOR PERCEPTIONS OF NATURAL AND HUMAN INFLUENCE
Chapter 1. INTRODUCTION
This study explores visitor perceptions of the scenic quality of Crater Lake
National Park. In particular, the role of information implying natural and human
change is explored as it affects visitors' scenic evaluations of the lake. Visitor attitudes
toward potential human influence of Crater Lake were also investigated.
Recognition of quality scenery as a valued natural resource is a notable
development in the field of natural resource management (Cubbage et al., 1993;
Dearden, 1985). Indeed, the 1990 Resources Planning Act Program Update (in
Galliano and Loeffler, 1995) indicated that viewing scenery had the highest
participation rate of any recreational activity in the United States. The Program
Update reported that over 20% of Americans participate in viewing scenery as part of
their leisure activities. While the intangible "amenity" value of scenery has often
placed it in a priority below commodity values such as timber, mining, and tourism
development, scenery has become recognized as a significant natural and recreational
resource (Daniel et al., 1989; Magill, 1992). While viewing scenery as a recreational
priority of many Americans is recognized in the Program Update, other studies
indicate that viewing scenery is an important subcomponent in recreational activities
such as fishing and hunting (Allen, 1988). Scenic management and preservation are

2
subsequently playing an ever increasing role as an integral part of natural
resource and recreation management, particulary where water resources are concerned
(Taylor et al., 1995).
An abundance of scenic resource issues face land managers. The preservation
of historic natural scenes (such as national parks), creation of additional scenic vistas,
monitoring of increasing real estate and tourism development, and protection of air
and water quality are all considerations land managers should bear in mind.
Maintaining awareness of scenic resources is critical, because managers' decisions about
human influences can directly or indirectly affect the appearance of natural land
features. However, even the most carefully planned management activities can be met
with varied public acceptance, and negative reactions often take managers by surprise
(Allen and Gould, 1986). Land managers not informed about social and scenic values
can overlook the impact their decisions have on the appearance of public lands as well
as their effects on the perceptions of people who view them (Shindler et al., 1993).
Because beauty is in the eye of the beholder, public impressions of changes in the
natural landscape can be extraordinarily difficult to describe, let alone predict or
understand.
The research literature in scenic quality indicates that people's perceptions and
judgments of scenic quality are complex, multi-leveled and often transient (Arthur et

3
al., 1977; Bourassa, 1990; Craik, 1983; Herzog, 1985; Meining, 1976;
Schroeder, 1984). Because of the continual shifting of public values regarding natural
resources, including values for scenic landscapes, continued research in scenic values is
justified.
The eclectic and multidisciplinary field of scenic aesthetics has produced a
volume of research in the fields of forestry, sociology, geography, psychology,
anthropology, and landscape architecture. The study of scenic beauty has been the
subject of much debate, revealing a rich variety of philosophical beliefs about the
nature of beauty. Description and measurement of what is considered an intangible
product of human interaction with the natural world has been a particular challenge
for the sciences because the construct of beauty has no obvious physical referents
upon which to base measurement (Hull et al., 1984).
Understanding the nature of the human aesthetic response to the natural world
has been the subject of human interest for centuries (Taylor et al., 1987). However,
within the last three decades, a variety of methodologies have been developed for use
by land managers and researchers interested in describing the human perception of
scenic beauty. Methods for measuring, describing, and predicting scenic preference
can be found along the philosophical spectrum of scientific and aesthetic inquiry, from
the objectivist orientation on one end to the subjectivist perspective at the other.

Motivation for Studying Scenic Quality at Crater Lake National Park
The water rights adjudication process in the Kiamath Basin has prompted
concerns that potential water withdrawals from Crater Lake could detract from park
visitors' scenic experiences while in the National Park. The National Park Service
requested a study of the scenic value of Crater Lake, and whether scenic value would
change if water levels in the lake changed. The objective of this study was to explore
the visual effects of such changes in Crater Lake on visitors' evaluations of lake views.
Study Design
This dissertation reports results of a study at Crater Lake National Park using
psychophysical, attitudinal, and interview approaches. The goal of the study is to
understand and predict park visitor values for scenic vistas and naturalness as part of
their aesthetic experience at Crater Lake. The study was focused on the scenic views
of Crater Lake from Rim Drive. Surveys and interviews were conducted using
volunteer participants at commonly-visited park areas.
An additional part of the study explored the role of information on
participants' scenic evaluations of the slide images. Five information treatments were
designed to explore the potential informational influence of implied natural variation
and human influence on visitors' scenic judgments of Crater Lake. In addition to

5
participating in the above visual experiment, study participants were also
asked to rate the acceptability of a number of potential human uses for the water in
Crater Lake.
A series of group interviews with park visitors was conducted as the final part
of the study. These interviews provide insights into park visitors' beliefs and attitudes
that were not available from the survey methodology used in the first two parts of this
study.
Study Goals and Objectives
Scenic Perception and Preference. Research questions relating to the natural
integrity of Crater Lake National Park are tied closely with scenic quality issues at
both theoretical and practical levels as discussed in the literature review in Chapter 2.
Information was needed at Crater Lake for exploration into how lake level changes
would affect participants' visual perceptions and scenic preferences for views of the
lake.
The Role of Information. Because national parks are sites of significant
interpretation regarding ecological and historical processes, additional research
questions focused on the role of information on scenic quality judgments.
Interpretive services at national parks typically provide visitor information that is
both visual (e.g., interpretive displays) and verbal (e.g., presentations by park rangers).

6
Information about the ecological condition of parks plays an important role
in a park's interpretive programs. In this way, understanding the role of information
as it affects visitors' perceptions can be a key part of the park managers' role in
facilitating the visitor experience. This visual-perceptual study explores how
information can influence what visitors see within specific questions relating to Crater
Lake water levels.
The following questions correspond to these issues:
Do park visitors detect differences in depictions of Crater Lake water levels
at the scaled drops of 25 to 125 feet?
Does information regarding changing lake levels affect visitors' abilities to
perceive differences in lake levels?
Is there a difference between park visitors' scenic preferences for current
lake levels compared to images depicting lowered lake levels?
Does information regarding changing lake levels affect visitors' scenic
preferences?
Is there a difference between visitors' scenic evaluations when they are
informed verbally that the lake levels are changing, compared with visitors who were
given no information?

7
Is there a difference between visitors' scenic evaluations when they
are informed verbally that the lake levels are changing, compared with visitors who
were given information via text in the slides explaining that lake levels were changing
because of natural variation or human use of lake water?
Is there a difference between visitors' scenic preferences when comparing
natural variation information with human use information?
When visitors complete a written survey question relating to specific human
uses of Crater Lake water, is there evidence of a priming effect when this type of
treatment is compared to human use information embedded in text format on the
slides?
Attitudes Toward Human Use of Crater Lake Water. In addition to the
questions relating to park visitors' perceptions of the lake, questions relating to visitor
acceptability of potential human uses of Crater Lake water were proposed.
Are visitors generally opposed to potential human uses of Crater Lake
water?
When visitors are questioned regarding specific potential human uses of
Crater Lake water (for example: hydropower, industrial, commercial, municipal,
agricultural or park visitor use), are some uses more acceptable to visitors than others?

8
Qualitative Insights. Research questions asked in the group interviews
were used to explore the visual and attitudinal segments of the study, but they also
provide insights into park visitors' beliefs and attitudes not available from the survey
methodology. As Krueger (1988) notes, due to the inductive nature of group
interview research, greater attention is directed to discovering the manner and way in
which respondents perceive issues. In this manner, the second area of insight provided
by the group interviews related to visitors' attitudes regarding their perceptions of
natural change versus human influence in national parks. The research questions
addressed in the interviews included:
Are visitors' scenic judgments after viewing photographic images based on
the water level depictions, or are there other variables (such as perceived color
differences) affecting their preferences?
What are park visitors' reactions to being informed that the lowered lake
level images reflect changes due to human uses of the lake water?
Are there any potential human uses which participants find more
appropriate than others?

9
Organization of the Dissertation.
Chapter 2 comprises a review of the research literature in scenic quality, as well
as research into the effects of information on scenic beauty judgments. Specific areas
relating to landscape aesthetic theory, policy mandates, research methodologies, and
scenic quality research in the national parks will be included as part of the literature
review. The methodological approaches represented in the three parts of this study
will be described in Chapter 3. Chapter 4 will report the results of the visual
experiment and information treatments, including information yielded by the group
interviews. Attitudes toward potential human uses will also be described in Chapter
4. Results from the group interviews as they relate to participants' attitudes toward
the potential uses will also be reported here. Chapter 5 will conclude the dissertation,
with a discussion focusing on theoretical and management implications of this study.

10
Seven appendices are included: Appendix A contains the survey used
on-site at Crater Lake for the experimental slide portion of the study as well as the
attitudinal measures associated with potential human uses of the water in the lake.
Appendix B provides a copy of the survey instrument used to compare participants
from the Visitor Center sample with visitors at Rim Village. Instructions for the
Visitor Center portions of the study are provided in Appendix C. Photographic
images used in the visual portion of the study are contained in Appendix D. The
interview protocol for the group interview portion of the study has been provided in
Appendix E. Appendix F contains the survey form used in the group interviews.
Appendix G provides additional analysis regarding visitors' preferences for higher lake
levels.

Chapter 2. LITERATURE REVIEW
The 20th century has been a period of rapid change in attitudes toward natural
resource conservation and land management. The popularity of Aldo Leopold's book
A Sand County Almanac is emblematic of a broadened ecological sensibility which
gained widespread influence over the values of post-World War II Americans. This
heightened ecological awareness pushed Americans to reconsider the beauty of the
land as more than skin deep. With many other factors, the popularity of Leopold's
work is symbolic of this period in history in that it showed how profoundly altered
people's views of natural resources had become. In turn, the way Americans
interacted with their natural landscape reached the stage where quality scenery was
not only considered important, it was deemed a vital national resource.
Motivated partly by an increased ecological awareness, the will of the
American people eventually expressed itself in the passage of far-reaching
environmental protection laws by Congress in the 1960's and 70's. One component
of these mandates was the recognition that the intangible values of scenery and natural
beauty were worthy of legislative protection. The laws passed recognized the scenic
value of the natural American landscape and declared that scenery should be granted
priority as a resource of national significance.
11

12
A Note on Scenic Quality Phrases
Amadeo et al (1989) note that in practice, people's notions regarding what is
"scenic" are likely to included a mixed and unknown assortment of their perspectives
on many different aspects of natural environments. To the beholder, "scenic," implies
a concept that is at a high level of abstraction which can be perceptually transient in
the beholder, flexible in its application, and potentially influential in the emotional
response of the individual to physical settings (Blumenthal, 1977). The semantic
dimension of quality as it relates to natural landscapes has been variously labeled as
"scenic quality" (Brunson and Shelby, 1992; Craik, 1983; Daniel et al., 1973; Orland et
al., 1996; Tips and Savasdisara, 1986; Zube, 1974), "aesthetic quality" (Cook, 1972;
Pepper, 1937), "visual attractiveness" (Pitt, 1989), "visual quality" (Hull, 1988; Lien
and Buhyoff, 1986; Manning et al., 1996), and "landscape preference" (Abbelo and
Bernaldez, 1986; Buhyoff et al., 1983; Kreimer, 1977; Purcell et al., 1994). Daniel and
Boster (1976) weighed alternatives and concluded that "scenic beauty" served the best
purposes of most natural landscape quality which is motivated by environmental
policy and public land management. Subsequently, the use of the phrase scenic
quality has come to include most of the above. This study, particularly in the
literature review, takes a broader view of the field and uses the terms "scenic quality",

"landscape quality", and "scenic beauty" on a relatively interchangeable basis unless
otherwise stated.
Scenic Values Over Time
Origins of the Picturesque. The human fascination with nature has been a
subject of interest since the Romantic Era, when humans began showing a
sympathetic interest in the qualities of the natural world (Nash, 1968). One
consequence of the romance period was that the notions of the sublime in nature
gained recognition: beauty was no longer focused on the cultivated, pastoral, ordered
and subdued nature, but encompassed the wilder and natural qualities of landscapes
(Gilpin, 1792; Zube, 1992).
Previous to this century, the appreciation for natural beauty was more or less
tied to the picturesque, (Hu.ssey, 1927) rather than any intimate connection to
evolutionary processes at play in the land itself (Callicot, 1992). The study of natural
beauty in landscapes was most often undertaken by those concerned with the aesthetic
and design values of landscape in art and architecture. However, as Gobster (1996)
notes, the developed aesthetic preference for these scenes was not so much "natural" as
it was a preference for "naturalistic" scenes. The aesthetics of naturalness were
influenced as much by the preferences of designers and artists. In turn, this view of
13

14
nature furthered the idea that there is an ideal nature which is tidy, and unchanging
(Wood, 1989).
The development of the 20th century ecological aesthetic required, according
to Leopold, a higher understanding of the complexity of nature, and the cultivation of
"a more refined taste in natural objects" (Leopold, 1953 pp. 32). With the
development of the natural resource management fields and the passage of laws
requiring the preservation and inventory of scenic resources, the desire to obtain an
ordered, scientific understanding of the human appreciation for scenery became
increasingly important.
The Land Aesthetic. Aldo Leopold's introduction of the concept of the land
ethic into the field of natural resource management symbolized the shift in human
ecological attitudes. Leopold's vision of land management encompassed more than
technical manipulation of resources for commercial gain. He asserted that the 20th
Century was the ground from which the human ecological conscience would rise. A
new conception of resource conservation was developing which broadened
professional and popular beliefs regarding which resources were worth preserving.
Leopold maintained that, "A thing is right when it tends to preserve the integrity,
stability, and beauty of the biotic community." (Leopold, 1949 p. 262).

15
Recently published essays of Leopold's from the 1930's contain a relatively
unknown concept which he called the land aesthetic. The land aesthetic is increasingly
recognized for exerting an even greater influence on the natural resource conservation
movement than Leopold's concept of the land ethic (Leopold, 1991). Callicot (1992)
illustrates this concept by asserting that one of the main reasons certain natural areas
(such as parks and natural areas) were preserved was simply because people considered
them beautiful. As Callicot states simply, people believed places were beautiful and
therefore had value, so they preserved them. However, this simple explanation hides a
more complex understanding of beauty that Leopold implied. While visual
appearance may have been critical in the preservation of special places, Leopold's
vision of natural beauty included more than the physical. For Aldo Leopold, the
aesthetic natural experience was a dynamic involving human cognition with the
sensory abilities of smell, sight, sound, and touch in an interplay with the physical
landscape. He asserted that the land aesthetic included not only the appreciation of
visual scenery, but also the evolutionary heritage, ecological processes, and natural
integrity at play in the landscape.
Scenic Preservation and Natural Resource Policy
While the popularized ecological movements of the 1960's and 1970's
contributed to the flurry of environmental legislation, there is much evidence of

16
public concern for preservation of scenic places in over a century of national park
preservation activity prior to this. The preservation of Yosemite National Park in
1864 and the creation of the National Park Service in 1916 show that considerable
interest in preservation of scenic resources had existed (Hendee et al., 1990; Nash,
1968), but the significance of these events rests in their foreshadowing of much
broader resource protection to follow.
The passage of numerous landmark environmental protection laws by
Congress in legislation during the 1960's and 1970's was evidence of the advancing
ecological conscience of America. The inclusion of protection for scenic resources
featured significantly in much of the sweeping environmental legislation of the era.
The protective clauses of individual environmental legislation were more
significant for scenic preservation in that they called for the management of the
aesthetic qualities of the land on par with commodity values. For example, beginning
with the Multiple Use Sustained Yield Act (MUSY) in 1960, Congress directed the
Forest Service to combine both economic and environmental considerations in forest
administration, requiring the agency to considerforest aesthetics as part of its mission
(Schafer, 1967).
The report of the Outdoor Recreation Resources Review Conunission
(ORRRC, 1962) contained a substantial list of recommendations for legislation to be

17
passed for landscape preservation. As a result of the ORRRC report, the National
Wild and Scenic Rivers Act (1968) and the National Recreation and Scenic Trails
System Act (1968) became law. Also in the 1960's, the Highway Beautification Act
(1965) mandated that scenic reviews be conducted as part of transportation route
construction. All these pieces of legislation called for land management agencies to
carefully consider visual impacts in their planning.
Perhaps the most broad-reaching policy mandate covering scenic resources was
contained in the National Environmental Policy Act (NEPA) of 1969. Section
102(2)(b) of NEPA mandated agencies of the federal government to
identify and develop methods and procedures.. .which will ensure thatpresently unquantified environmental amenities and values may be given
appropriate consideration in decision making along with economic and
technical considerations.
In the 1970's, the Forest and Rangeland Renewable Resources Planning Act
(1974) as well as the National Forest Management Act (1976) reinforced the mandates
of earlier policies to consider aesthetic resources, and emphasized the evaluation of
scenic quality tradeoffs among competing demands for national resources (Brown et
al., 1983). Such policy statements directed land managers' attention to aesthetic
impacts associated with forestry, recreation, and transportation. Mostly managers
were required to identify and inventory scenic resources. At the same time, increasing

18
numbers of scientists became interested in the nature of the human aesthetic
relationship to natural landscapes and ecological heritage.
Scenic resource protection has continued to receive attention in the formation
of land management policies into the 1990's. For example, in the report of the Forest
Ecosystem Management Assessment Team (FEMAT 1993), scenic values for natural
appearing landscapes continue to emerge as key public concerns. The report also
emphasizes that the creation (emphasis added) of more naturally appearing landscapes
would be consistent with conservation objectives addressed by the FEMAT document.
Citing the Oregon and Washington State Comprehensive Outdoor Recreation Plans,
the FEMAT report indicated that increasing acreages of natural landscapes will be
needed to meet projected demands by the year 2000.
Scenic Quality Evaluation: Theoretical Developments
Much landscape perception research derives theoretically from the field of
psychometric measurement, which focuses on establishing quantitative relationships
between physical features of environmental stimuli and human perceptual responses
(Fechner, 1860/1966; Buyhoff, 1980). Usually this type of analysis focuses on rating
exercises which produce numerical indicators of observers' perceptions of the relative
position of one stimulus versus another along a specified psychological dimension
representing scenic beauty (Brown and Daniel, 1990). This conceptual approach in

19
visual perception is derived from the Theory of Signal Detection as formulated by
Green and Sweets (1966). Signal detection has its foundations in classical psycho-
physical scaling methods originated by Thurstone (1927), which was further
developed by Torgerson (1958).
A review of the literature indicates that the applied nature of scenic beauty
assessment has left a relatively limited number of attempts at outlining the area's
theoretical underpinnings (Bourassa, 1990). Appleton (1975) asserted that theoretical
understanding of aesthetic judgments is not just a scholarly endeavor but necessary for
rationalizing applications of scenic quality analysis. Zube (1982) also contended that
assumptions behind much of what is called landscape scenic quality have not been
examined in an ordered fashion. For example, is scenic beauty an objective property
inherent in the landscape or a subjective impression based on individual cognitive
processes? Is scenic beauty a constant over time and between individuals? Indeed,
Wohlwill (1976) questioned earlier whether researchers are measuring the same thing
when describing scenic beauty. The debate has continued for over two decades with a
degree of clarity settling into an understanding that both the physical landscape and
human cognitive processes must be considered in an integrated fashion. Zube et al.
(1982) summarize this integrated understanding when they suggest that scenic beauty
evaluation should focus on the nature of human-landscape interactions and their

outcomes (which include preference, values, satisfaction, well-being, predictive
equations, and salient physical landscape elements).
Scenic Quality Evaluation: Methodology
In response to the need for information relating to scenic quality, a
considerable number of assessment methodologies were developed in the 1960's and
1970's. Numerous researchers explored the physical features which contribute to
scenic quality and attempted to describe attendant scenic aesthetic values (Arthur et
al., 1977; Daniel and Boster, 1976; Daniel and Vining, 1983; MacFarland et al., 1983;
Zube et al., 1982). Research throughout the early years of scenic assessment was
dominated by the field of landscape architecture. For example, Zube (1982) noted that
in a 15 year period from 1965 to 1980, twice as many research articles concerning
scenic quality were published by researchers in landscape architecture than in any
other field.
The primary emphasis of most work in scenic assessment has been observer-
based; that is, scenic value has been judged by either experts (such as landscape
architects or land planners) or laypersons (landowners, recreationists, or other
members of the public). Because the aesthetic value of a landscape logically resides in
its visual desirability, a large amount of observer-based research has focused on the
perceptual experience of the viewer. Much of this research descends theoretically
20

21
from the work of Ittelson (1973), who outlined three general principles regarding the
nature of human perception: 1) perceiving is relatively free from direct control of the
stimulus; 2) it is inseparably linked to and indistinguishable from other aspects of
psychological functioning; and 3) perception is relevant and appropriate to the
environmental context in which it occurs.
Scenic Quality Assessment Approaches. Arthur et al. (1977) separated scenic
quality assessment approaches into two categories: the descriptive inventory and the
public preference model. Descriptive inventories usually rely on judgments and
standards of trained, highly skilled field experts. This expert approach makes several
assumptions. First, that there are aesthetic qualities inherent in a given landscape
which, when analyzed, would provide an objective, evaluative measure of its scenic
quality. Second, the expert inventory assumes that with enough training and
expertise, the preferences of the general public can be objectively determined without
asking them. The expert approach presumes that there are a limited number of criteria
which need to be met in order to analyze a scenic view for its aesthetic appeal. Much
of the visual assessments conducted by the federal land management agencies have
followed the expert approach. Efforts to systematically identify and classify scenic
quality to promote sound resource management have resulted in the development of

22
such inventories as the Scenery Management System by the U.S. Forest Service
(USDA, 1996).
A number of researchers (Arthur et aL, 1977; Vining and Stevens, 1986) have
been critical of the expert model of scenic assessment, arguing that the public
preference model is appropriate when management considerations for public resources
are in question. The public preference model is based conceptually on scenic
preference as a function of the physical characteristics of the landscape in question,
real or implied presence of management, as well as the attitudes, expectations and
perceptions of the observing individual. This process-based, relational model of
landscape assessment (Vining and Stevens, 1986) is diagrammed below in Figure 2.1.
Public Preference Subcategories. Zube (1982) separated the public preference
approach described above into three subcategories: psychophysical, cognitive, and
experiential. The psychophysical model often involves testing an experimental group
of subjects in order to collect their perceptual evaluations of scenic qualities in a
particular landscape. External landscape properties are assumed to carry a
correlational, or stimulus-response relationship, to the viewer's evaluations of what is
observed (Daniel and Boster, 1976). Numerical or statistical expressions of perceived
aesthetic values are usually the focus of discussion in the psychophysical

Figure 2.1 Diagram of the Relational Model of Landscape Assessment
(Vining and Stevens, 1986)
The Viewed Landscape
Sensory Input
Perceptual Processes
Cognitive Processes
1r
Observer Judgment
23

24
approach (Hull et al., 1987; Magill, 1990). Much research in recreation and amenity
values for natural resources has been conducted using techniques which can be
classified as psychophysical in their methodology (Daniel et al., 1989; Shelby and
Harris, 1985).
The cognitive model of landscape assessment involves a search for how
information is received by the human observer in connection with past experience and
future expectations. This information, along with sociocultural values, is combined
into a meaning-filled, internalized representation. Human factors affecting scenic
preference include education, personality, profession, involvement, and socio-cultural
groupings (Buhyoff et al., 1983; Zube et aL, 1982). Ratings of preference or levels of
satisfaction-dissatisfaction are likely to be the focus of cognitive approaches to
landscape assessment. Much of the work relating to the natural vs. human influence
on landscapes has been conducted from the cognitive approach to landscape analysis
(Calvin et al., 1972; Carls, 1974; Hodgson and Thayer, 1980; Ulrich, 1986).
The experiential or phenomenological approach considers humans to be active
participants in the landscape as opposed to being merely observers. Landscape values
rise from the interaction between the human observer and the landscape itself. This
perspective approaches landscapes as repositories for human meaning and symbol
(Greider and Garkovich, 1994). The experiential model goes further than the human

25
response to a visual scene and focuses on the product of human transformations of
landscapes, both mental and physical. Researchers focusing on landscape values as an
individual expression would be categorized within this approach, particularly those
who work with the sense ofplace phenomenon in landscape inquiry (Mitchell et al.,
1993; Owens, 1988; Proshansky et al., 1983; Schreyer and Roggenbuck, 1981; Tuan,
1976). The emphasis on literary and artistic endeavors as the analytical focus of
landscape quality also comprises part of the experiential approach (Reiph, 1976;
Stegner, 1989) and is a growing area of inquiry (Snow, 1997).
The Integrated Approach. Seeing no reason to separate the psychophysical and
cognitive approaches to analyzing scenic quality in landscapes, Vining and Stevens
(1986) opted to study the association between the existence of physical traits in the
landscape and the resulting perceptual response of the individual observer. Their
orientation of theoretical psychophysics moves toward a combination of the physical
environment and the observer's cognitive structure, as illustrated in Figure 2.1.
Vining and Stevens asserted that the observer's response is a function of a complex and
interactive process. Interpretation of observer responses should acknowledge the
operation of processes such as judgment and decision making, the observer's frame of
reference, and their distinctively individual experience.

26
The inclusion of more than an observer's perceptual response has often not
been included within the traditional psychometric method. More broadly, an
integrated approach considers cognitive processes which mediate the response to a
visual stimulus. While these invisible processes are not directly observable, this more
complex view of landscape perception is more satisfying than merely studying and
then constructing an inventory of what is visually perceived. That a response should
acknowledge underlying cognitive processes such as environmental attitudes or
acceptability of impact, as well as the observer's particular frame of reference, seems a
necessary area of inquiry and worthwhile for research.
Evaluation Methods: The use of photographic representations
Visual representations have been used to model potential visual changes in the
landscape since the beginning of the 14th century (Zube, 1986). Pictorial simulations
are commonly used by planners and land managers for use in their assessment of the
visual consequences of potential alterations to scenery (Orland, 1993). Not
surprisingly, much research in the area of scenic quality has focused on natural scenes
in the form of artist representations, slides, photographs, and computer digitized
images. Scenic quality assessments have often utilized photographic representations of
natural scenes in order to elicit perceptual and cognitive responses from participating

27
observers (Bishop and Hull, 1989; Bishop and Leahy, 1989; Manning and Lime, 1995;
Nassauer, 1983).
Use of Photographs for Observer judgments. A number of studies have
reported high degrees of similarity between observer judgments made on-site
compared with those derived from photographs (McKechnie, 1977; Nassauer, 1983;
Shuttleworth, 1980; Stewart et al., 1984). The majority of these studies focused on
observer preferences for natural landscapes (Bishop and Hull, 1989; Bishop and Leahy,
1989; Daniel and Orland, 1992). Other research has indicated that alternative forms of
transmitting visual information are adequate substitutes for either photographic or on-
site observation. For example, Shelby and Harris (1985) reported that evaluations
based on written descriptions of wilderness campsites did not differ significantly from
those based on actual visits to those sites. Comparisons of computer simulated images
to the more traditional analytical medium of photographs have also indicated high
degrees of correlation (Bishop and Leahy, 1989; Orland, 1988; Orland, 1993; Vining
and Orland, 1989).
Challenging the Use of Photographs. A small group of studies have challenged
the generally accepted notion that photographs and on-site observations are actually
similar. The correspondence between experimental (photographic) and "real life" (on-
site) contexts was questioned by Hull and Stewart (1992) who brought up the broader

28
question of ecological validity when photographic representations of visual scenes are
used to analyze scenic beauty. Their concern echoed other studies which speculated
that qualitative differences in the experience of the observer call into question the
similarities found by previous research between various visual contexts (Ulrich, 1983;
Wohiwill, 1976). The effect of factors such as novelty, surprise, variety and other
sensory inputs (sound, smell) are characteristics of the on-site observer experience
which photographs cannot convey.
Hull and Stewart's (1992) results were mixed regarding the differences between
individual participant's on-site and photo-based scenic judgments, with indications
implying a limited level of correlation between the two. They attributed their
findings to differences in meaning, novelty, and mood between the visual contexts,
but the primary difference they found was in the units of analysis. Their scenic
quality analysis focused on the individual rater as the unit of analysis, as opposed to
group averages, or standardized scores. For example, they noted that when group
averages were examined, on-site scenic beauty ratings were highly similar to the
average photo-based ratings, but when individual raters were compared, there were
considerable differences in their scenic judgments.
Relevant Dimensional Aspects. Several studies have asserted that the validity
of photographs as surrogates for field observation depends on the degree to which

29
relevant aspects of the environment are represented in the photographs (Sheppard,
1989; Stewart et at, 1984) and that visual aspects are more important and relevant than
peripheral aspects of experience. Relevant dimensional aspects of the environment
would include clarity, color, border, viewpoint, and cloud cover. Stewart asserted that
the validity of photographs as visual alternatives to on-site judgments depends on the
following characteristics: 1) vision is the dominant sense used to gather relevant
information 2) observers are stationary when the judgments are made 3) relevant
visual information is located far from the observer 4) visual information out of the
observer's field of view should be irrelevant to the judgment 5) observers are trained
to make sound visual judgments 6) visual distortions (e.g. color) in photographs are
replaced by other information of equivalent value.
Effects of Information on Scenic Quality Judgments
People endow meaning to landscapes and it is through analysis of individual
preferences and attitudes that people can offer clues about the value they assign to
scenic quality. The aesthetic philosopher S.C. Pepper (1937) proposed that knowledge
of the context and meaning of an object can intensify the emotional appreciation of
that object. Fazio and Zanna (1981) demonstrated that attitudes toward an object are
stronger and more accessible when they are based on direct, behavioral experience
with the attitude object (in this instance, a scenic national park). Magill (1990; 1992)

30
noted that understanding meanings and attitudes associated with landscapes is
particularly important in tenus of the influence that human activity might have on
the scenic appearance of natural areas, especially if those activities are related to
management activities. Despite the volume of research into the dynamics of scenic
beauty judgments, there is relatively little research in the literature relating to effects
of real or implied human influence on scenic vistas. Indeed, only four studies could be
found that make up the core of published inquiry into this area.
By the 1970's, researchers began examining the effect of direct or implied
human influence on scenic quality (Zube et al., 1975). Cans (1974) asserted that the
character of the landscape is determined by natural conditions of the site and visual
artifacts of human activity. Using color photographs as representatives of landscape
scenes, he investigated the influence of people and human-influenced conditions on
preferences for outdoor recreation settings. His study used the presence of
recreational developments as evidence of human influence. Carls' findings suggested
that as landscapes change to reflect increased levels of development there will be an
attendant decrease in observers scenic quality ratings. However, the results from his
study are somewhat limited in that they seem to imply more about people's
preferences for recreational developments than the effect of human influence on a
natural setting.

31
Hodgson and Thayer (1980) demonstrated the negative effects of implied
human influence on natural settings by changing the labels on landscape photographs
to imply human influence. They found that photos with natural labels attached (lake,
pond) were ranked higher in scenic quality than photos with labels implying human
influence (reservoir, irrigation). The researchers agreed with Leff (1974) who asserted
earlier that at least some of the beauty inherent in the physical environment derives
from the observer's knowledge about the place in question.
Another study which explored the social factor of information effects on scenic
quality was conducted by Anderson (1981), who investigated the effect of land use
designations on scenic judgments in forest landscapes. Anderson found that observers
judgments were sensitive to the labels on scenic slides as well as information provided
while on-site. She concluded that for scenes of high scenic quality (such as in national
parks and wilderness areas), an enhancing natural label can raise aesthetic values, but a
detracting label implying human influence had only a slightly detrimental effect.
Scenic Quality Research in the National Park System
Previous research has indicated that viewing natural scenery is one of the
primary reasons visitors travel to the national parks (Lee and Brown, 1992; Rolloff et
al., 1996). Therefore, understanding scenic values should be especially important to
managers in the National Park Service. The exploration of visitors' scenic values has

32
been particularly useful in visual quality assessment within the Park Service, and the
predominance of research within the parks has often been focused on the observed
experience of the park visitor (Bromley, 1980). Visual assessment techniques have
been commonly utilized by researchers and managers for studying visitor perceptions
of existing natural and environmental conditions (Rowe and Chesnut, 1983).
Park visitors generally place value on the quality of naturalness as part of their
park experience (Bonnicksen and Stone, 1985). Subsequently, much of the research in
national parks investigates visitors' levels of satisfaction with varying levels of scenic
degradation. The majority of visual perception studies relating to national park visual
resources have considered park air quality and visibility (Burdge et al., 1983; Greene et
al., 1982; MacFarland et al., 1983; Malm et al., 1981; Schultze et al, 1983), but general
scenic beauty evaluations have also been the focus of scenic research with park visitors
(Call et al., 1981; Steinitz, 1990). Through their participation in such research,
national park visitors have played an important role in providing park managers and
planners with important scenic feedback (Bromley, 1980). This has been the case
particularly in studies relating to visitors' current values for scenery (Taylor et al.,
1995) as well as visitors' reactions to potential changes in the appearance of scenic
views (Johnson and Haspel, 1983).

33
Scenic Quality and Preservation Values at Crater Lake National Park
Recognition of Crater Lake as a scenic resource is long-standing. Reports of
the first white explorers' visit to Crater Lake in 1853 account their amazement at the
water's scenic beauty, which they first named "Deep Blue Lake." By the late 19th
Century, Crater Lake was recognized as a site of national importance, due in part to
its scenic value (Cranson, 1982).
By the late 1800's, increased appreciation for the nation's natural wonders
involved both scenic and commercial values, creating conflicts over the preservation
and use of national scenic treasures (Nash, 1968). For example, in response to the
conflict between commercial and preservation value, the federal government protected
the natural wonders in northwest Wyoming by creating Yellowstone National Park in
1872. The enabling legislation of Yellowstone National Park included provisions for
the preservation of the natural setting, ensuring "their retention in their natural
condition."
Efforts aimed at preserving Crater Lake had developed by the 1880's, with
petitions appealing to President Cleveland for protection of the area as a public park.
In recognition of the preservation value of the site, Cleveland withdrew from the
public domain ten townships of land surrounding Crater Lake in 1886. In 1902,

34
President Theodore Roosevelt signed a bill into law giving Crater Lake national park
status. This law stated that the Secretary of Interior should
cause adequate measures to be taken for the preservation of the naturalobjects within said park, and also for the protection of the timber fromwanton depredation, the preservation of all kinds of game and fish.. .andthe prevention and extinguishment of forest fires.
(16 USC 122)
In the first decades of this century, maintaining natural scenes for their
aesthetic values was reaffirmed in the creation of the National Park Service. In
establishing the National Park Service with the Organic Act of 1916 Congress made
clear the fundamental purpose of the park system was to conserve scenery and natural
and historic objects. The Park Service was called to
promote and regulate the use of the Federal areas known as national parks...by such means and measures as conform to the fundamental purpose of saidparks.. .which purpose is to conserve the scenery and the natural andhistoric objects... therein and to provide for the enjoyment of the same insuch manner and by such means as will leave them unimpaired for theenjoyment of future generations.
(16 USC 1)
Since its establishment, the National Park Service has recognized the
importance of providing for the use and enjoyment of park visitors as well as the

35
preservation of park resources. The centrality of scenic opportunities at Crater Lake
is illustrated in the fact that by 1918, a road had been completed around the rim of the
lake for visitors to travel. The importance of the condition of Crater Lake has been a
long-standing concern of researchers; its remarkable blue color and extreme water
clarity was the focus of early research in the park (Pettit, 1936). Providing for the
preservation of scenic opportunities based on landscape features at sites such as Crater
Lake has remained one of the primary tasks of the National Park Service for over 80
years. However, the varying disciplines of National Park Service managers (landscape
architects, biologists, and engineers) have historically produced conflicting
interpretations of the meaning of "unimpaired" (Sellars, 1997).
Theoretical and Applied Issues
Leopold's conceptualization of the land aesthetic has relevance for current park
management in that it lies at the heart of an understanding of modern American
environmental sensibilities: the desire for quality scenery in a landscape with its
natural integrity intact. But when do people begin to notice change when it is
occurring and do such changes represent a threat to the natural integrity of a view? Is
there more to the beauty of the land than what appears on the surface? Do people
value landscapes less when they know more about the naturalness, or unnaturalness,
of what rests before them in a scenic view?

36
The issue of whether or not scenic beauty is an objective quality inherent in the
landscape or a subjective impression based on individual human perception remains
open to investigation. The duality represented in past research by the separation of
objectivist and subjectivist approaches to scenic quality has become increasingly
criticized as limited and fragmentary by researchers (Bourassa, 1990; Vining and
Stevens, 1986). An integrated approach needs to be utilized for both theory and
application to progress. This integration would include salient physical landscape
characteristics partnered with human preferences, values, and predictive equations
(Zube 1982). The inclusion of public preferences in analysis of landscapes of national
significance (such as national parks, wild and scenic rivers, and wilderness areas)
follows as an attendant characteristic of an effective integrated scenic quality analysis.
Substantial research findings support the appropriate use of photographic
representation of landscapes in public preference analysis. However, concerns relating
to the representation of relevant visual dimensions in analysis remain in consideration
as the field of landscape analysis has recently moved into the regular use of computer-
generated visual images. The complexity of scenic quality analysis suggest that use of
multiple methods will capture the dimensional aspects of perception, preference, and
attitude (Egan et al., 1995).

Chapter 3. METHODS
Objectivist and Sub jectivist Perspectives
Research associated with the objectivist perspective in scenic assessment has
focused measurement of landscape parameters, largely based in psychophysical theory
(Daniel and Boster, 1976; Fechner, 1860/1966; Hull et al., 1984). This approach has
been dominated by the disciplines of landscape architecture, psychology, and
sociology. Psychophysical techniques are commonly associated with those of the
physical and quantitative sciences. These are based on the assumption that specific,
measurable parameters contribute to the perception of beauty and therefore can be
described and predicted. Visual elements, such as the presence of geological features
(such as water or mountains), or evidence of land use patterns, are often the focus of
empirical analysis. A good example of this approach is the Scenic Beauty Estimation
method, the dominant landscape assessment tool used by the U.S. Forest Service
(Daniel and Boster, 1976). The primary assumption of the Scenic Beauty Estimation
method is that people are consistent in their perception of the physical characteristics
of objects, which in turn become the physical referent upon which to base the
measurement of the construct of beauty. Previous empirical research has documented
37

38
wide variation regarding what composes scenic quality (Dearden, 1985; Zube et al.,
1987) and the debate has continued into the 1990's as more techniques, such as the use
of computer-imagery, have developed (Orland, 1994; Orland et al., 1996).
This approach represents the perspective that beauty is in the eye of the beholder,
and that the focus of study is the individual perceiver, not the landscape itself. From
this viewpoint, the landscape exists only as it is perceived by the individuals under
scrutiny. Therefore, personal perception comprises the heart of this approach, with
internalized attitudes and values comprising the units of study. Tools used from the
standpoint of the subjectivist perspective in landscape assessment include interviews,
participant observation, and insights obtained through observations in literature, art,
and even postcards (Marsh, 1985). In recent years, the human sense ofplace and place
attachment have gained attention from researchers studying scenic quality (Mitchell et
al., 1993). In one example, Mitchell notes that the Limits of Acceptable Change
process (Stankey et al., 1985) utilized by the U.S. Forest Service could be adopted by
managers to identify limits of change for place attachments, or affection thresholds, as
part of incorporating personal place values into planning endeavors.

39
The Transactional Approach
It is proposed that both the objectivist and the subjectivist perspectives will
provide useful insights into the research questions considered in this study. Indeed,
both approaches have their merits, with elements of each contributing to a broader
understanding of the physical elements of landscape quality and the human
perceptions of scenic beauty. From a psychological perspective, Ittelson (1973)
theorized that environments and human behavior are based on an interactional
process, which he calls the transactional view of landscape experience. Dearden (1985)
suggested that beauty should be considered a relational force, with scenic quality
functioning as a dynamic interaction between the observer and the landscape, rather
than residing in one or the other. Because elements of beauty comprise both the
external physical environment as well as internal perceptions and attitudes, it seems
logical that both should be considered as components of scenic quality. This study
adopts a relational, or transactive perspective and explores both from the standpoint of
the visitor experience at Crater Lake.
Overall Study Design
Data collection for the study was conducted during 1996 and 1997 at Crater
Lake National Park. During 1996, a visitor study was conducted at the park Visitor

40
Center (in the Steele Center) and at Rim Village. The Visitor Center portion of the
study consisted of a cross-sectional attitude survey. The purpose of the survey was to
make inferences regarding park visitors' scenic judgments of Crater Lake as well as
their attitudes toward potential human uses of the lake water. At the same time, the
Rim Village portion of the study tested the representativeness of the Visitor Center
sample. The study conducted in 1997 consisted of a series of qualitative group
interviews conducted at the Visitor Center. The purpose of the interviews was to
explore visitors' scenic preferences and attitudes on an interactive, discussion-based
level.
Scenic Preference and Attitude Study
Subjects. Individuals participating in the scenic preference and attitude survey
during the 1996 portion of the study were 1,168 visitors to Crater Lake National Park
during August and September. The population in the study is defined as all visitors to
Crater Lake National Park during the study period. Participant characteristics from
visitors in the 1996 study have been included in Chapter 4, Table 4.1.
1996 Survey Instruments. Two surveys were designed for the 1996 portion of
study. For the Visitor Center study, a survey was developed for gathering
information from park visitors on their scenic preferences for Crater Lake vistas as

41
well as their attitudes toward park resources. A copy of the Visitor Center survey has
been provided in Appendix A. The second survey was a brief questionnaire used to
investigate visitor characteristics at the most commonly visited area in the park, Rim
Village. The Rim Village questionnaire has been included in Appendix B. The goal of
these types of cross-sectional surveys is to provide a description of the park visitor
population at a single point in time from which observations and inferences can be
drawn.
A pre-test of the survey instrument used at the Visitor Center was conducted
during the winter of 1996 utilizing students at Oregon State University, and again in
July with visitors at Crater Lake National Park. From information gathered in these
pretests, refinements were made in the photographic images and experimental design
of the study. For example, adjustments were made to improve the color balance and
saturation in the computer generated slide images. During the pretests, researchers
also realized the importance of obtaining the same focal length of slide projector lenses
for the two projectors used in the study so that image appearance, size, and focus
would be as balanced as possible.
Procedures. Principal data collection for the Visitor Center and Rim Village
portions of the study commenced on August 11 and concluded on September 14, 1996.
The time frame for the survey included 16 randomly selected days for data collection.

42
The scenic preference portion of the study was conducted in the 50-seat auditorium at
the Visitor Center. Administration of this part of the survey occurred between the
hourly showing of an interpretive video. A total of 958 visitors participated in the
Visitor Center portion of the study. The shorter survey conducted among visitors
along the rim walkway at Rim Village, had 210 visitors participating. The purpose of
this more limited survey was to gather socio-economic and visitation data from
individuals at the Rim to determine if the people participating in the survey at the
Visitor Center were representative of all visitors to Crater Lake National Park.
People at the Visitor Center were requested to participate in the study through
two means. An invitation was made to visitors at the conclusion of the 18-minute
interpretive video. Visitors were also invited to participate in the study through a
general announcement in the Visitor Center lobby. Both invitations explained that
information gained in the study would aid National Park Service managers by
providing them with valuable information about visitors' attitudes toward Crater
Lake National Park resources. In addition, the researcher explained that the study
took approximately 20 minutes to complete. A participation incentive was offered to
visitors in the form of a photographic viewbook of Crater Lake, The Story Behind the
Scenery (Warfield et al., 1996). Participants were assured verbally and in written form
that their responses were completely voluntary and confidential. Participation in all

43
parts of the study was limited to individuals who were 18 years of age and older.
Visitors in the Rim Village sample were approached individually by the study
research assistant. During randomized sampling periods, participants were selected by
approaching every other group that passed along the rim walk at Rim Village. Each
group encountered using this sampling technique was invited to participate in a
voluntary visitor study. No incentive was offered to visitors for this portion of the
study. The total time used by visitors in filling out the Rim survey was approximately
one minute. Visitors in the Rim Village sample were assured both verbally and on the
survey form that the information they provided would be used only for research
purposes and that their responses were anonymous and confidential.
Sampling. From information provided by National Park Service managers, it
was resolved that sampling evenly throughout the day would give the best
representation of daily visit distribution since no specific visitation frequencies were
available for the current Visitor Center location (the last visitor studies were
conducted before 1988 when the current interpretive center location was established).
Hourly sampling of visitors began at 10:00 a.m. and concluded at 4:00 p.m. These
hourly samples are hereafter referred to as "sessions" in the study. The scheduling of
data collection was also designed to reflect the distribution of visitors during the
park's high and low use seasons. The sampling framework reflects this distribution,

44
with 80% of the data collection during the high use season (before Labor Day) and
20% during the low use season (after Labor Day). While sampling dates were
determined randomly, each day of the week was represented at least once during the
data collection.
A goal during survey development was to depict views most commonly seen
by visitors. From a previous study of visitor traffic patterns at Crater Lake (Shelby
and Wolf, 1981), it was observed that 76% of visitors travel along the route between
Rim Village and the northwestern corner of Crater Lake. Further, the report
indicated that 90% of park vehicle traffic passed park headquarters at the Steele Center
(the site of the present Visitor Center). This information was corroborated by present
Park Service managers, who indicated that most visitors enter from the south and then
exit through the north, or vice versa. The most regularly traveled segments of Rim
Drive were taken into consideration when selecting which viewpoints to use in the
study.
The Survey Instrument. The three images chosen for the study represent
commonly visited viewpoints of Crater Lake on the route along the lake's western rim
(Figure 3.1). Common to all views was the presence of Wizard Island, a partially
forested, 764 ft. cinder cone rising from the central-western side of the lake. The first
view faces north from Rim Village toward Llao Rock. The second view faces

45
northeast from Discovery Point toward Llao Rock. From above Merriam Point, the
third view faces south toward Rim Village at the northwestern edge of the rim. All
three views have Wizard Island placed in the foreground. Viewpoints from Rim
Village and Merriam Point are both 1.5 miles from the nearest shore of Wizard Island,
while the view from Discovery Point is 1 mile distant from the shore of the island.
Slides taken from Merriam Point and Rim Village have prominent views of Skell
Channel between Wizard Island and the caldera wall (channel water depth 20 feet at
the time of slide exposure). The image from Discovery Point (View 2) does not show
Skell Channel. These rim views are at an elevation of approximately 7,100 feet above
sea level, placing them just under 1,000 feet above the level of the lake. At the time
the slides were taken, the elevation of the lake surface was 6,168 feet. Historically,
Crater Lake levels have ranged from approximately 3 meters below to 2 meters above
the lake level on September 5, 1995. From Crater Lake limnological studies
(Redmond, 1993), a mean of 6,175 feet has been established for the lake level over the
last century. Therefore, the level of 6,168 feet used in this study is within typical
fluctuations of the lake level.

View 2. Discovery PointCnter
LakeLodge
View 1. Rim Village
46
Figure 3.1. Location of Study Viewpoints /
NView 3. Above Merriam Point

47
Slide exposures used in the study were taken on September 5, 1995 between
10:00 a.m. and 2:00 p.m. A Nikon N5005 with a 28-200mm Tamron lens was fixed on
a high-angle Gitzo tripod. Velvia professional slide film was used for the images.
After the slides were processed, they were digitized and placed in CD-Rom format.
Images in the CD-Rom were formatted at a high resolution (1536 X 1024 pixels) with
a 24-bit color depth. Digitized versions of the lake views were edited with Adobe
Photoshop software (Version 3) on a Macintosh PowerPC computer. Adobe
Photoshop is commonly utilized software for creating images reflecting environmental
changes such as those in this study (Orland et al., 1996). Consultants in the creation
of the image sets included an oceanographer and an aquatic biologist who are members
of the faculty of Oregon State University involved in the lake research program at
Crater Lake. Additionally, a computer graphic artist was involved in the creation and
editing of the image sets.
The elevation of Wizard Island and the contours surrounding the island were
used as scale references in the creation of images reflecting lake levels dropping to 25,
75 and 125 feet below the original level shown in photos from September 5, 1995.
Lake level changes were determined by using the height of Wizard Island as a reference
point against the numeric scale on the top and bottom of the workspace in Adobe
Photoshop. Information regarding the bathymetric contours surrounding Wizard

48
Island was used in combination with the known height of the island to determine the
vertical change in lake level as well as change in shoreline on the island.
The three lake level changes were chosen after the pretest of the survey showed
the extent to which people noticed different changes in iake levels. No images taken
from the surface of the lake were included in the study because the scale of changes up
to 125 feet did not lend themselves to available surface-level images. Park managers
also noted that only 5% of Crater Lake visitors made the effort to walk down to the
lake level for a boat ride. Therefore, researchers decided to use images taken from the
elevation of Rim Drive, where the majority of park visitors view the lake.
Slide Presentation. Table 3.1 lists all slide views and lake level depictions
created for the study. Photographic reproductions of each of the slide views have been
included in Appendix D.
Table 3.1 Slide Set Format
View 1Rim Village
View 2Discovery Point
View 3Merriam Point
1. Average level 1. Average level 1. Average level
2. - 25 feet 2. - 25 feet 2. - 25 feet
3. - 75 feet 3. - 75 feet 3. - 75 feet
4. - 125 feet 4. - 125 feet 4. - 125 feet

49
Instructions from the scenic preference portion of the survey have been
provided in Appendix C. Presentation format during data collection was organized so
that each slide within the three views was paired with the other slides in the same view
set. For example, the slide showing the original lake level in View 1 was paired with
every other level in the View 1 slide set, the -25 level slide was paired with -75 and -
125, and the -75 level was paired with -125 (a total of 6 pairs). Analogous pairings
were done for the View 2 and View 3 slide sets, resulting in 18 slide pair combinations.
The systematic pairing of visual stimuli, or the method of paired comparisons, is a
commonly utilized method for testing scenic judgments (Buhyoff and Weilman, 1979;
Vining and Stevens, 1986).
Instrumental Consistency. One question which arose during the pretesting of
the study was related to the consistency with participants rated the images in the slide
portion of the survey. When forming judgments about the scenic quality from the
slide views, would participants focus their attention on the changing lake levels, or
would they focus on some other perceived difference in the paired slides?
To investigate the possibility that participants' visual judgments were focused
on referents other than the water level, two "matched pairs" slide sets were included in
the visual portion of the study, which increased the total number of pairs to 20. For
example, a slide showing View 1 Level 1 would be matched with itself. In other

50
words, is it possible that study participants would see a difference when there is no
difference in slide views presented to them? In addition to the matched-pair method,
the consistency of participants' scenic judgments during the study were explored in
qualitative fashion during the group interview phase.
Slide View Survey Format. As stated previously, visitors were instructed to
provide two pieces of information for each slide pair they viewed. First, they were
asked if they saw a difference between the two views. Second, they were asked to
indicate their preference for one view over the other. The right and left position of
lower and higher lake levels was randomly assigned throughout the slide pairs. Right
and left carousel assignments were randomized between each slide session on each day
of data collection. The order of the slide pairs was also randomly changed between
survey dates.
As part of the instructions (Appendix C), study participants were asked to rate
the scenic quality of the view in the slides, not the slides' quality. Each slide pair was
shown for 20 seconds. After the slide portion of the survey, visitors were instructed
to fill out the rest of the survey at their own pace. Assurance of the confidential and
voluntary nature of the survey were made at the beginning and conclusion of the
survey session and was also written in the text of the survey instrument itself.

51
Information Treatments. Effects of information on visitors' scenic judgments
of the slide sets were also investigated. Respondents were randomly allocated to
treatment groups throughout the sampling period, and each group was exposed to a
different type of information about the slides they were rating (Table 3.2). The first
treatment group received no information about the fact that lake levels were changing
in the slides they were rating. The second treatment group received verbal
information which alerted them to the changing lake levels (with no explanation of
why the level was dropping). The third and fourth groups viewed slides which had
labels in white lettering embedded in the slide image at the bottom of the picture. The
labels contained information regarding the change in lake levels in feet, as well as the
reason for the change. For example, the third group's labels stated "lake levels [25, 75,
125J feet lower due to natural variation," while the fourth group's labels stated "lake
level [25, 75, 125] feet lower due to human use of lake water." Instructions used by
the researcher for these information treatments are included in the subtext of survey
instructions in Appendix C. The fifth treatment group completed the survey question
(#7) relating to various potential human uses of the water in Crater Lake prior to
viewing the slide portion of the survey. The purpose of switching the order of the
attitude and preference portions of the survey was to investigate the informational

Table 3.2. Information Treatments
52
priming effect of participants considering specific human uses of the lake water which
would cause a lowering of the lake level.
Therefore, groups 2, 3, and 4 knew that they were rating their visual
preferences for alternative lake levels, while the first group knew only that they were
rating their visual preferences for different slides of Crater Lake. From comments
during the pretest as well as comments from on-site studyparticipants, it became clear
that many in the first treatment group probably realized after a few slide pairs were
shown that they were rating different lake levels, but this was never explicitly stated
by the interviewer.
Scales of Measurement
Measurement of park visitor perceptions and attitudes was accomplished by the
construction of different response scales for each part of the on-site survey. These
Group Information Treatment1 No information2 Verbal information3 Natural variation information (slide text)
4 Human influence information (slide text)
5 Potential human uses information (priming effect)

53
scales are similar to preference and attitudinal scales used in other social research, but
were tailored specifically for this study. Comparative scales such as the one used in
this study are a common format for measuring scenic beauty (Arthur et al., 1977;
Brown and Daniel, 1986; Brown and Daniel, 1990).
Vining and Stevens (1986) note that the central purpose of response scales is to
provide an observable indicator or response from which a scale of measurement may
be derived. In measuring scenic quality, direct scales of measurement are not
attainable because the property to be measured has no immediately definable physical
scale. The concept of beauty does not automatically suggest a physical measure. As a
result, response frameworks aim at creating an indirect measure which allows the
construct to be quantified.
For the slide portion of the study, a method of paired comparisons (Torgerson,
1958) was utilized to compare changing conditions of the same visual scene. The first
task for each participant upon presentation of the paired views was to detect whether
or not the two views were different. Then scenic preference for the views was
measured on a 5-point categorical scale: strongly prefer the left, prefer the left, no
preference, prefer the right or strongly prefer the right.

54
Data Analysis
The results from the paired slide comparisons will be analyzed in three
different ways.
Mean Response to Slide Pairs. The first method used to analyze participants'
responses to the slides looks at the mean response to the 18 slide pairs used in the
visual portion of the study. The data were recoded so that all higher lake levels
corresponded to those on the left screen for the respondent.' If the respondent stated
that he or she preferred or strongly preferred the higher lake level, this response
would be coded as -1 or -2, respectively. If the participant preferred or strongly
preferred the lower lake level, this response would be coded as + 1 or + 2, respectively.
If the participant stated that he or she preferred neither, the response was coded as a
zero. The null hypothesis was that there was no preference for higher or lower lake
levels (mean response = 0), and a t-test is used to assess whether mean responses were
significantly different from zero.
Times an Individual Slide is Preferred. The second way to analyze the results
of the slide preference ratings is to calculate the mean number of times that any given
1 Recall that the lower and higher lake levels were randomly assigned to the left and rightscreens during the interview process. An example of the recoding would be for the lower lakelevel that was presented on the right screen with the response of preferring the right to berecoded to show the lower lake level on the left and the respondent preferring the left.

55
slide was preferred to all the other comparator slides. Within each view, a participant
compared each lake level with three other lake levels (e.g., average level vs. -25 feet,
average level vs. -75 feet, average level vs. -125 feet). If the average level (the original
lake level) was preferred to the other three levels by all of the respondents, then the
mean number of times that level one was preferred would be equal to three. At the
other extreme, if level one was never preferred to the other lake levels, the mean
number of times that level one was preferred would be equal to zero. The null
hypothesis would follow that the means between all four levels would be equal. At
this point there was a concern that observations for each slide pair would not be
independent of each other. A consulting statistician suggested that participants'
responses to the slides could also be summarized across all 18 pairs to allow for a
simultaneous discussion of all explanatory variables.
The Agreement Statistic. Summary statistics were created for both the
difference and preference components of the visual portion of the study. These
statistics were created from the participant's observed responses to each of the slide
pairs. These summaries are a function of each participant's responses to the two parts
from each slide pair: first, whether participants could detect a difference between the
slide pairs, and second, whether participants had a preference for views depicting lake
levels closer to normal, or average levels. This procedure reduces these multiple

56
responses to a summary response for differences noticed (the Dscore) and view
preference (the Pscore).
Differences Noticed and Preferences for Lake Levels. A table of observed
differences and preferences was constructed from each participant's responses to slide
pairs. These tables aliow for quantifying how much a visitor's perception and
preference departed from an expected, or ideal, result. Green and Swets (1966)
outlined the use of representing an "ideal" or optimal performance in the detection of
visual or aural change in their work developing Signal Detection Theory. This ideal
refers to the best possible performance in detecting signals under specified conditions.
In this study, Dscores and Pscores provide insight into how the individual participants
compared to an "ideal" performance, for example, one in which a participant is able to
detect differences whenever they occur, and when a participant always prefers the slide
showing a higher level in each slide pair presented.
Calculation of the two agreement statistics follows similar processes. However,
as will be noted during the results section of this dissertation, a direct understanding
of the calculation of the Pscore proved to be more complex than that of the Dscore,
where defining an "ideal" response for the Dscore was calculated as either seeing a
difference or not. The scaled nature of individual preferences for slide views (on a 5-
point left to right preference scale) made the definition of an ideal response

57
problematic. Because of the interpretive difficulty with the Pscore, researchers
determined not to include it in the main analysis of the study. Instead, an exploratory
analysis and discussion has been included in Appendix G. The following section
outlines how the expected and observed responses are treated for responses to the
difference question.
Calculation of the Dscore
The disparities between different lake levels correspond to the following
groups in Table 3.3.
Table 3.3. Scoring System for Correctly Perceived Differences.
The following 2x3 table (Table 3.4) represents an "ideal" participant who
correctly perceived differences whenever they existed in the slide pair presentation. In
other words, the table represents an expected score for the participant who was able to
Score on tableChange in magnitude
Number ofdifferences possible
0 For a 1 level change between levels 1 and 2, 2and 3,3 and4
9
1 For a 2 level change between levels 1 and 3 or2 and 4
6
2 For a 3 level change between levels 1 and 4 3

58
correctly detect all differences in each of the slide pair comparisons. In this manner, a
response that relatively quantifies the participant's departure from the expected score,
or "ideal," can be defined.
Table 3.4. Expected Counts Table.
Is there a
difference? Yes
No
From each of the participant's responses, a separate observed response table
was constructed based on their responses. The following tables represent two
examples of observed counts for two participants. The first (Table 3.5) represents a
score greatly departed from the expected score, while the second (Table 3.6) represents
an example of a score closer to the expected score. Similar to the formula for standard
deviation, computations for the departure from expected difference statistic (denoted as
DE3 following each table) are calculated as follows:
DE = (observed # in cell - expected # in cell)2over all 6 cells
Change in Levelo 1 2
9 6 3
0 0 0

Table 3.5. Observed Counts Table. (Far from expected).
The above observed counts table for the participant who had difficulty
detecting differences when they existed in the slide pairs indicates that this
participant's agreement score would be equal to 154, calculated as:
DE3 = (9 - 1)2 + (6 3)2 + (3 - 1)2 + (0 - 8)2 + (0 3)2 + (0 - 2)2
= 154
Table 3.6. Observed Counts Table. (Close to expected)
Is there a
difference? Yes
No
= 33
The above observed counts table for the participant who was more accurate at
detecting differences when they existed in the slide pairs indicates that this
participant's agreement score would be equal to 33, calculated as:
DE3 = (9 - 6)2 + (6 5)2 + (3 - 2)2 + (0 3)2 + (0 - 1)2 + (0 - 1)2
59
Change in Level0 1 2
6 5 2
3 1 1
Is there a 0
Change in Level1 2
difference? Yes 1 3 1
No 8 3 2

60
In order to assist in the understanding of these auxiliary measures, we will
define a relative measure of DE. The greatest departure from the expected occurs if a
subject sees no difference in any of the slide pairs. This is a "worst case" scenario, and
the largest possible DE score would be achieved in this case. This response to the 18
slide pairs would result in the score corresponding to Table 3.7.
Table 3.7. Worst Case Counts Table. (Furthest from expected)
Is there a
difference? Yes
No
DE2 = (9 - 0)2 + (6 - 0)2 + (3 - 0)2 + (0 9)2 + (0 - 6)2 + (0 3)2
= 252
The relative departure from expected follows by dividing the DE score by this
maximum departure value:
RDE = DE / 252
From the example above, the score will be RDE = 252/252 1, similarly, for
the "ideal" participant the relative departure from expected will be
RDE = 0 / 252 for a score of 0.
In order to make the scale more intuitive, where 1 indicates a perfect response
Change in Level0 1 2
0 0 0
9 6 3

61
and 0 indicates a worst score, the following calculation is given a positive numerical
orientation such that 0 would represent the worst score and 1 would represent the
ideal score. Therefore, for the agreement score (Dscoreij):
Dscore) = 1 - RDE
Therefore, Dscore is the response of interest, the agreement statistic, which indicates
the participant's ability to see differences in the lake levels.
A between-subjects analysis of variance utilizing a nested (or hierarchical)
factorial design (Kuehl, 1994) will be conducted to understand the character of
participants' Dscores and Pscores. Whether there are informational treatment effects
and session effects will also be investigated. Interactions which might affect
participants' abilities to detect differences in the paired slides, as well as their
preferences for slide views, will also be examined. The design in this study is nested in
that the individual sessions conducted with visitors occurred within the individual
sample dates and had no relationship with sessions on other treatment dates.
Individual participants are nested in similar fashion in that visitors in the study
participated within an individual session.
62
Focused Interview Study
Study Participants. Participants in the 1997 phase of the study were visitors to
Crater Lake National Park during the fall season. A pre-test of the group interview
was conducted using a small number of residents of Corvallis, Oregon in the summer
of 1997. The onsite sample for this part of the study was comprised of 4 group
interviews with a total of 34 visitors participating. The sample of interviews followed
guidelines suggested by Krueger (1998) who stated that conducting 3 or 4 group
interviews to determine if additional groups or information are needed to explore the
research questions.
Volunteers for the group interview portion of the study were invited to
participate in the study in the same manner as in the previous year's study; an
invitation was made to visitors at the conclusion of the 18-minute interpretive video
and through a general announcement in the Visitor Center lobby. In addition, the
researcher explained that the interview would last for approximately 30 minutes. A
participation incentive was offered to visitors in the form of a small photographic
viewbook of Crater Lake. Interviewees were assured that their participation was
completely voluntary, confidential and anonymous.
An interview guide was developed for gathering qualitative information from
participants regarding their impression of the slide instrument used in the scenic

63
portion of the study, as well as their scenic preferences for Crater Lake vistas. As part
of the group interviews, visitors' attitudes toward natural and human influences in the
park were explored in an interactive fashion. The interview guide has been included
in Appendix E. This type of qualitative survey provides descriptive information
which is used to inform the quantitative parts of the study and provide
phenomenological insights.
Procedures. Once visitors agreed to participate in the interview, the slide
portion of the study was shown in the same manner as in phase one, but a more open-
ended response framework was utilized. The data collection form from this portion
of the study has been included in Appendix F. First, participants were asked to
indicate whether or not the paired views looked the same. If they saw a difference,
visitors were asked to write about the difference seen in the slide pairs as well as to
indicate if they preferred one view over the other. In this way, another indication of
what people were viewing in the slide pairs can be gained, and more information is
provided regarding the study instrument.

Chapter 4. RESULTS
Study Sample
Because the primary data collection for this study occurred at the park Visitor
Center, there was some concern that the nature of the sample could be different from
one representing park visitors to Crater Lake in general. Recall that two random
samples of visitors were taken, one from the Visitor Center and one from Rim Village.
The purpose of the Rim Village survey was to gather socio-economic and visitation
data from individuals at that commonly visited area to investigate whether the people
participating in the survey at the Visitor Center were representative of all visitors to
Crater Lake National Park. Socio-economic and visitation characteristics were then
compared between the two groups.
Details for visitor and trip characteristics are presented in Table 4.1. Results
indicate that in most respects the two samples were not significantly different from
each other (p < .05). Gender, age, and income were not significantly different, while
level of education was slightly different (p .072). The main difference was that a
higher percentage of Visitor Center respondents had more than high school education.
The two groups were not significantly different in terms of whether this was their
first trip to Crater Lake, nor whether Crater Lake was the primary destination
64

Table 4.1. Participant Characteristics and Trip Information
65
Category Percentage of Respondents
Respondent AgeMean
18-29
30-39
40-49
50-59
60-69
70-79
80
Visitor Center
49.5 years
11.6%
16.2%
24.8%
15.8%
36.3%
9.5%
1.5%
Rim Village
46 years
11.7%
25.5%
48.3%
20.7%
34.4%
4.8%
0.5%
GenderFemaleMale
Visitor Center
54%46%
Rim Village52%
48%
Income LevelMeanLess than $15,000$15,000 to $24,999$25,000 to $29,999$30,000 to $34,999$35,000 to $49,999$50,000 to $74,999$75,000 to $99,999$100,000 or more
Visitor Center
$50,0005.7%7.4%
4.8%8.8%
2 1.7%
25.4%11.7%14.6%
Rim Village
$50,000
6.3%7.8%2.6%6.3%
23.4%26%
16.7%
10.9%
Educational LevelLess than 9th grade9th to 12th grade, no diplomaHigh school graduateSome collegeAssociate degreeBachelor's degreeSome graduate school, no degreeGraduate or professional degree
Visitor Center
1%
3.0%
8.7%
22.3%6.8%
21.5%11.1%
25.5%
Rim Village
0.5%4.3%17.1%20.4%5.7%17.5%
9%25.6%
Have Previously Visited ParkNoYes
Visitor Center
66%
34%
Rim Village60%
40%
Crater Lake as Primary DestinationNoYes
Visitor Center
65%
35%
Rim Village
60%40%
Distance From HomeAverage Miles
Visitor Center
1105
Rim Village
836

66
of their trip. There was a difference between the two groups regarding their distance
of residence from Crater Lake, with Rim Village respondents reporting a mean of 836
miles and Visitor Center respondents 1105 miles. However, both of these represent a
substantial distance from the park, so in practical terms these differences are probably
immaterial. Although statistical results from the sample at the Visitor Center can
only be extrapolated to the Visitor Center population, the closeness of the sample to
the Rim Village sample suggests that all Crater Lake visitors will have socioeconomic
characteristics substantially similar to those who stop at the Visitor Center.
An additional issue involving the study sample is whether the sample of Visitor
Center respondents represents the population of people who stop at the Visitor
Center. Because the characteristics of the overall population are not known, it is not
possible to determine whether the study sample represents the total population.
However, by designing a random sampling strategy, estimates of the population
parameters can be made with a certain statistical degree of confidence.
Response Rates and Reasons for Non-compliance. With surveys, there is also
the issue of nonresponse bias; of those contacted, some park visitors chose not to
participate in the survey. If those nonrespondents are "random," then we wouldn't
expect any bias in the result. But if the nonrespondents are systematically different
than the respondents, the study's results would be biased. Again, without knowing
the population characteristics, it cannot be known whether the sample is biased, but a

67
high response rate can be relied on to minimize the likelihood of nonresponse bias.
The total response rate for the Visitor Center portion of the survey was 83%. Other
studies on-site at national parks and protected areas have obtained similar response
rates of 81%-85% (Hall et al., 1997; Hall and Shelby, 1994; Hall and Shelby, 1996; Lee
and Brown, 1992). Considering the time requirement of the survey (25-30 minutes)
and the average amount of time spent in the park (less than 4 hours as estimated by
Park Service managers), the percentage of visitors agreeing to participate in the study
was high. The response rate for the survey at Rim Village was even greater at 99%.
In order to understand reasons for not participating in the study, a sample of
40 individuals (17% of the total number of non-compliance) who were asked to
participate in the study but declined were interviewed briefly by the researcher.
Results from this sample suggested two primary reasons for not participating in the
survey. The visitors often reported that they had young children with them and
generally felt the children would not be able to sit through the 20 minute survey.
Other non-responding visitors explained they were simply in a hurry to see the lake.
Because no socio-economic or visitation data were collected from these individuals, a
check for non-response bias in the Visitor Center survey was not possible. However,
the relatively small number of non-respondents would tend to minimize any bias that
might be present in the study. Indeed, Borg (1971) noted that if a sample attains at

least an 80% response rate, the potential for nonresponse bias to be sufficiently great
to alter the results is highly unlikely.
Instrumental Consistency
As part of evaluating the effectiveness of the survey instrument, criteria for
consistency were explored through techniques described in the methods chapter. For
this study, there was a concern that individual participants were basing their
judgments on stimuli other than the visual changes in the lake levels as depicted in the
slides. An investigation of how participants used the study's instrument will enhance
the confidence that the measurements obtained reflect visual changes in the slides.
Matched Slide Pairs. Recall that matched pairs were introduced into the visual
experiment in order to understand if participants were basing their responses to slide
pairs on lake levels, as opposed to other perceived differences. Upon exposure to
paired slide images, participants were asked to indicate whether they saw a difference
between the two views. Presumably, if participants saw no differences in these
matched pairs, the consistency of the slide instrument would be high. If participants
saw differences when there were none, then the consistency of the paired images
would be low.
When the matched pairs were analyzed separately from other pairs in the
presentations, 64% of the respondents indicated that there was no difference when they
were shown identical views while 36% indicated that they saw a difference when there
68

69
was, in fact, none. This difference is statistically significant across all information
treatments in the study (p = .003). The range of proportion of responses in which no
difference was perceived across treatments ranges from 57% of participants in
Treatment 5 to 75% in Treatment 3.
Additionally, each of the three views used in the slides (from Rim Village,
Discovery Point, and Merriam Point) was analyzed separately, and results are
inconsistent between views. For example, in View 1 (Rim Village) participants seemed
to correctly identify when no difference is present in the pairs when water levels are
depicted at normal levels and at the -125 foot change. Participants are evenly split for
seeing differences in the slide depicitions of drops of -25 and -75 feet This means that
for these middle levels, half saw a difference when there was none.
In addition to indicating whether they saw a difference between the two slides
in the slide pairs, participants were also asked to indicate if they preferred one slide
view over the other. Participants who indicated that they saw a difference in the
matched slide pairs also provided information relating to their scenic preference of the
views in this manner. There is strong evidence of an interaction between the
information treatment and the slide view (F = 3.64, p = 0.000 1). This indicates that
participants' mean preference depends on the information treatment and the slide
simultaneously. When mean preference scores are analyzed by treatment group and
by individual slide, however, participants consistently rated their preferences near the

70
middle "neutral" category on the 5 point preference scale. This suggests that, although
participants may have wrongly indicated that they saw a difference, the similar nature
of views explains the neutrality of their preference responses. The neutrality of their
preferences implies that while visitors' perception of difference may have been off-
base, their neutral preferences reflect a focus on the lack of visual changes in the slides.
Group Interviews. Another review of the study's instrument validity occurred
during the group interview phase. Open-ended formats were used to elicit
information from participants regarding their visual impressions of the slide pairs.
First, participants were asked to describe in written format what they saw in
the slide views. Although the sample of interviews was small, results from written
responses provide insight into what participants viewed in the slides. Responses were
generally consistent in the qualitative study, with most respondents reporting no
difference when matched-pairs were included in the presentation.
Written descriptions of the differences interview participants detected reveal
that a variety of visual stimuli influence observations in the pairs. Many of the
differences participants attributed to the pairs early in the slide presentation were
view- and color-related. For example, one comment stated a preference for one view
(the one depicting higher water) because of "the deeper color of the water." Another
observed that "the view in the left seems sunnier and the island looks bigger." One
participant wrote, "The left seems grander, with a more sweeping vista."

71
Responses from the open-ended format indicate that most visitors began noting
the differences in water level depictions early in the order of slides, usually by the 3rd
or 4th slide pair. One visitor noticed that "the water level is lower on the right" and
that the view was "prettier with more water." Another remarked, "I prefer the left
view (with Wizard Island) as an island because it looks more 'volcanic' and isolated."
Indeed, by the third slide pair, everyone in the third interview group indicated a
preferences for the higher level slide. For example, the third group (in which the
higher water level was on the left), provided the following reasons for their
preferences in response to the sixth slide pair.
Visitor A. The separation of water and mountain looks better.
Visitor B. The left has more lake showing.
Visitor C. Higher water makes a more attractive picture.
Visitor D. The left has more water.
Visitor E. The left is better, clearer.
Visitor F. The left is a better perspective.
Visitor G. Wizard looks better as an island.
At times, participants' comments suggested that they believed that human-
influence was responsible for the change in views, even when no such suggestions

72
were made by the researcher. For example, several observers attributed the increasing
shore of Wizard Island in the lower lake levels to timber harvest on the island. These
findings are similar to those observed by Magill (1994), who found in one study that
observers believed mountain meadows were clearcuts and subsequently gave the scenes
negative evaluations.
Open-ended questions in the interview following the slide presentation were
also used to explore participants' observations of the slide pairs. Again, participants'
remarks indicate that the detection of the visual changes in the slides was relatively
prompt. Indeed, one participant noted that
There seems to be a difference in the water levels of the lake. Some ofthe slides have lower levels of water, with greater exposed shore, whilethe other slides have greater volumes of water and seem to cover upsome of the underlying parts of the island. It also changed the shape ofthe shoreline of the island with the amount of water.
Other responses during the interview indicated that some participants saw differences
in the slides which were in contrast, but perhaps related, to the depictions of water
levels. For example, this exchange occurred between two participants in the first
interview group.
Visitor A. In some of them, particularly the first one, the water seemsmuch bluer. Yes, that was the one. See the difference?
Visitor B. No, it's just the water level difference there. You can see thatbuilding on the beach [on the island] that shows you how much beachis being exposed when the water drops. There's just less blue.
Visitor A. Makes you wonder if the lake is drying up.

Participants' attributions relating to potential human influence surfaced in the
interviews. One participant commented,
Seems to me on several of them there had been man-made changes tothe shoreline in particular. Especially in the first one you can see thedifference in the shoreline. It looks like it has been logged and then dugoff and then maybe a harbor has been put in there, or some sort of man-made change is taking place.
Mean Responses to Slide Pairs
Recall that participants in the 1996 phase of the study indicated their
preferences on a five-point response set: strongly prefer the left, prefer the left, neutral,
prefer the right, and strongly prefer the right. The null hypothesis was that there was
no preference for higher or lower lake levels (mean response = 0), and t-tests were
used to assess whether mean responses were significantly different from zero.
As discussed in the methodology section, the respondents were randomly
divided into different treatment groups. Figures 4.1 through 4.3 show the mean
responses for each pair of slides in the first treatment group. In all cases the mean
response is negative, meaning that on average, respondents preferred the higher lake
levels. In 14 of the 18 cases the results are significantly different from zero (p < .05).
All of the nonsignificant results are for comparisons of lake levels adjacent to each
other, i.e., average level vs. -25 feet, -25 feet vs. -75 feet, -75 feet vs. -125 feet.
73

1
0.75-
0.5-3
0.25 -
0
-0.25 --J
-0.5-01
I -0.75 -
I
- 0.75-
- 0.5-a;
0.25 -
0
-0.75 -
-1
Figure 4.1 View 1 (Rim Village)No Information on lake levels
LI V. L2 Li v. L3* LI v. L4* L2 v. L3* L2 v. L4* L3 v. L4
Lake Level Comparisons
Figure 4.2 View 2 (Discovery Point)No information on lake levels
Li v. L2* LI V. L3* Li V. L4* L2 V. L3* L2 V. L4* L3 V. L4*
Lake Level Comparisons
Figure 4.3 View 3 (Merriam Point)No Information on lake levels
I
- 0.75
0.5
0.25
0
-0.25-Ja;. -0.5
1
-0.75
Li v. L2* Li v. L3* Li v. L4* L2 v. L3 L2 v. L4* L3 V. L4
Lake Level Comparisons
* denotes statistically significant difference (p < .05)
74

75
Four of the ratings without information were not significantly different from
each other. These were: Level 1 v. Level 2 in View 1, Level 3 v. Level 4 in View 1 and
View 3, and Level 2 v. Level 3 in View 3. In these cases, it cannot be said with 95%
confidence that visitors preferred the higher lake level. However, note that all
comparisons are significantly different in at least one of the views (Level 1 v. Level 2 is
significant for View 2 and 3, Level 2 v. Level 3 is significant for View 1 and View 3,
and Level 2 v. Level 3 is significant from View 2). Therefore, because visitors see the
lake from all of these viewpoints, they would perceive the difference in lake levels
from at least one of the viewpoints and would prefer the higher level.
Figures 4.4 through 4.6 show the mean responses from treatment group 2, in
which participants received verbal information telling them that some of the slides
depicted lowered lake levels in Crater Lake. Consistent with treatment group 1, these
results are also all negative, showing a preference for higher lake levels. In 17 of the 18
cases the results are significantly different from zero (p < .05). The only nonsignificant
result is the comparison of the original lake level with the -25 feet level in View 1. In
all cases, the mean responses for treatment 2 are more negative than those for
treatment 1, although only 5 of those differences are statistically significant (p < .05).
Significantly more negative responses for treatment 2 would indicate that verbal

:1
0.75
0.5
-0.25
-0.5a,I -0.75
-1
0.75a,
0.5
0.1 0.25
0a,
-0.25-Ca,
-0.5
-0.75
Li v. L2* Li v. L3* U v. L4* L2 v. L3* L2 v. L4* L3 v. L4*
Lake Level Comparisons
Figure 4.6 View 3 (Merriam Point)Verbal Information
Figure 4.4 View 1 (Rim Village)Verbal Information
I I I
Li v. L2 LI v. L3* Li v. L4* L2 v. L3 L2 v. L4* L3 v. L4*
Lake Level Comparisons
Figure 4.5 View 2 (Discovery Point)Verbal Information
Ll v. L2* Ll V. L3* Li V. L4* L2 V. L3* L2 V. L4* L3 V. L4*
Lake Level Comparisons
* denotes statistically significant difference (p < .05)
76
0.75-a,-4 0.5-
0.25 -
0
-0.25 -
-0.75 -
-1

77
information about changing lake levels affected respondents' preferences. In most
cases, the information did not have a significant effect.
Figures 4.7 through 4.9 show the mean responses from treatment 3, which had
the slide labels embedded in the images with the lake level depicted, stating that the
drop in lake level was due to natural variation. All mean responses were again
negative, showing a preference for higher lake levels. All 18 of the results are
significantly different from zero (p <.05). Thirteen of the 18 responses from
treatment 3 were more negative than responses from treatment 2, but only 2 of these
differences were statistically significant. Sixteen of the 18 responses were more
negative than those from treatment 1, and 12 of those differences were statistically
significant. This shows that the effect of information printed on the slides (treatment
3) is not much different from verbal information (treatment 2), but it has more of an
effect when compared to no information (treatment 1).
Figures 4.10 through 4.12 depict the mean responses from treatment 4, which
included slide labels that attributed the lower lake levels to human uses of the lake
water. All mean responses were again negative, suggesting a preference for higher lake
levels. All 18 of the mean responses are significantly different from zero (p < .05).
When compared to treatment 3, 17 of the 18 mean responses were more negative, and
14 of those differences were statistically significant. When compared to treatment 2,

30
1
0.75 -
0.5 -
0.25 -
0
-0.25 -
-0.5 -=
-0.75 -
I
0.75
0.5
0.25
0.1'
-0.25-J
-0.5
-0.75
-1
Li v. L2* Li V. L3*
' 0.75
0.5
0.25
0
-0.25-J
-0.5
I -0.75
LI v. L2* Li V. L3*
Li v. L2* Li V. L3*
Figure 4.7 View 1 (Rim Village)"Natural Variation" Slide Text Information
Li v. L4* L2v.L3*
Lake Level Comparisons
Figure 4.8 View 2 (Discovery Point)"Natural Variation' Slide Text Information
Li v. L4* L2 V. L3*
Lake Level Comparisons
Figure 4.9 View 3 (Merriam Point)"Natural Variation" Slide Text Information
Li v. L4* L2 V. L3*
Lake Level Comparisons
* denotes statistically significant difference (p < .05)
L2 v. L4* L3 v. L4*
L2 v. L4* L3 V. L4"
L2v. L4* L3v. L4*
78

79
17 of the 18 mean responses were again more negative, and all of those differences
were significant. When compared to treatment 1, all of the mean responses from
treatment 4 were more negative, and 17 of the 18 were significant. These results
indicate that information which informed respondents that lake levels were changing
due to human uses of Crater Lake water had more effect on respondents' preferences
than other types of information.
Finally, Figures 4.13 through 4.15 show the mean response from treatment 5,
in which participants completed the question regarding potential human uses of
Crater Lake water before going on to the slide portion of the study. All mean
responses were negative, showing a preference for higher lake levels. Seventeen of the
results are significantly different from zero (p < .05). Three of the responses from
treatment 5 were more negative than treatment 4, and two of these differences were
statistically significant. Fifteen of the 18 responses from treatment 5 were more
negative than responses from treatment 3, and 7 of these differences were statistically
significant. Fifteen of the 18 responses from treatment 5 were more negative than
responses from treatment 2, and 12 of these differences were statistically significant.
Finally, seventeen of the 18 responses from treatment 5 were more negative than
responses from treatment group 1, and 15 of these differences were statistically
significant. This suggests that the effect of human influence information is similar

0.25-J
-0.5
a -0.75I-1.25
LI v. L2* Li V. L3* Li V. L4* L2 V. L3* L2 v. L4* L3 V. L4*
Lake Level Comparisons
Figure 4.11 View 2 (Discovery Point)"Human Use of Lake Water' Slide Text
1.25
:. 0.75-J
0.53o 0.25-J
0
-0.25
-0.5
-0.75
-1.25
LI v. L2* Li v. L3* LI v. L4* L2 v. L3* L2 v. L4* L3 v. L4*Lake Level Comparisons
Figure 4.12 View 3 (Merriam Point)"Human Use of Lake Water" Slide Text
1.25
- I
0.75
0.5-33 0.25
0
-1.25
Figure 4.10 View 1 (Rim Village)"Human Use of Lake Water" Slide Text
1.25
1-0.75 -
0.5-0.25
Li v. L2* LI v. L3* LI v. L4* L2 V. L3* L2 v. L4* L3 v. L4*
Lake Level Comparison5
* denotes statistically significant difference (p < .05)
80

- 0.75 -
- 0.5-0.25
0
-025 -
-0.5 -
-0.75 -
Li v. L2* LI V. L3
Li v. L2' LI v. L3*
Li v. L2* Li V. L3*
Figure 4.13 View 1 (Rim Village)Participants primed with potential human uses
Li v. L4* L2 V. L3*
Lake Level Comparisons
Li v. L4* L2 V. L3*
Lake Level Comparisons
Figure 4.15 View 3 (Merriam Point)Participants primed with potential human uses question
Li v. L4* L2 v. L3
Lake Level Comparisons
* denotes statistically significant difference (p < .05)
L2 v. L4* L3 V. L4*
L2 v. L4* L3 V. L4*
L2 v. L4* L3 V. L4*
81
0.75
j 0.5
0.250-J 0
-0.25 -
! -0.5 -
. -0.75 -
I -1-
-1.25
Figure 4.14 View 2 (Discovery Point)
1Participants primed with potential human uses question
0.75 -
- 0.5-
o 0.25 --J0
-0.25 --J-0.5-
I -0.75 -

82
between treatments 4 and 5, while there is a greater difference between human
influence in treatment 4 and natural variation information in treatment 3. Similar to
treatment 4, these results indicate that considering information related to potential
human uses of Crater Lake water had more effect on respondents' preferences than
other types of information, and an even more pronounced effect when compared to
no information being provided.
The Mean Number of Times a View was Preferred
A second way to analyze the results of the slide preference ratings is to
calculate the mean number of times that any given slide was preferred to all the other
comparator slides. Within each view a participant compared each lake level with three
other lake levels (i.e., Average Level vs. -25 feet, Average Level vs. -75 feet, Average
Level vs. -125 feet). If Level one (the average, or normal lake level) was preferred over
the other three levels by all of the respondents, then the mean number of times that
Level one was preferred would be equal to three. At the other extreme, if Level one
was never preferred over the other lake levels, the mean number of times that Level
one was preferred would be equal to zero.
Table 4.2 shows the mean number of times each lake level was preferred within
each treatment group. The results show that the lower lake levels were preferred less
often over their higher lake level comparison slides. In other words, the slides
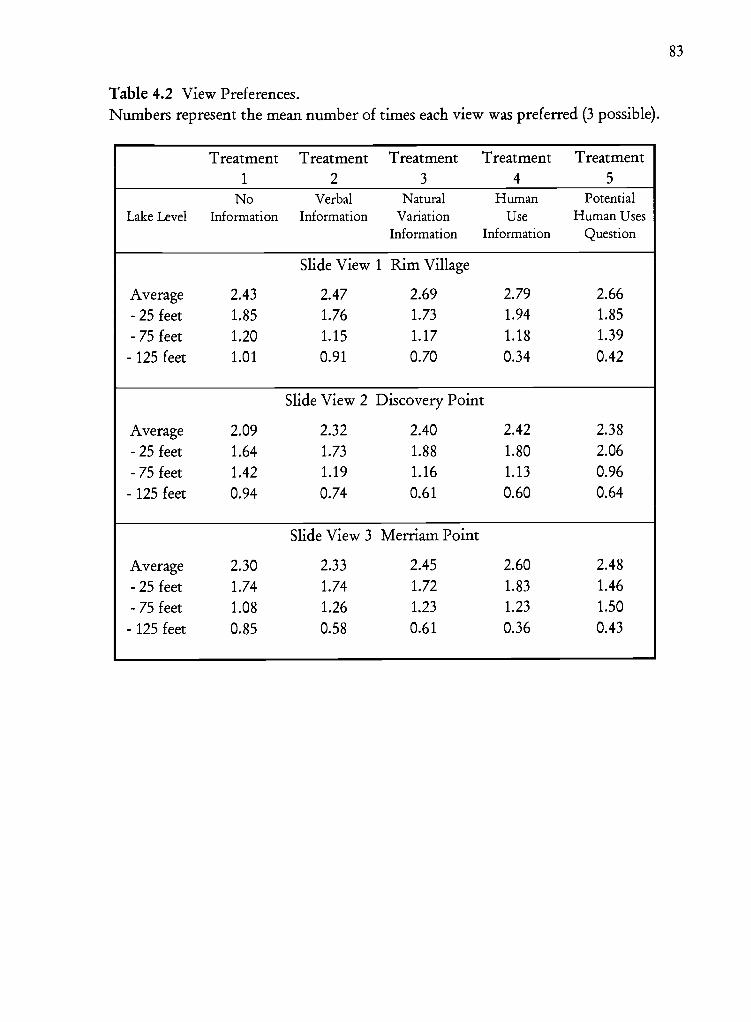
Table 4.2 View Preferences.Numbers represent the mean number of times each view was preferred (3 possible).
83
Treatment1
Treatment2
Treatment Treatment3 4
Treatment5
Lake LevelNo
InformationVerbal
InformationNatural Human
Variation UseInformation Information
PotentialHuman Uses
Question
Slide View 1 Rim Village
Average 2.43 2.47 2.69 2.79 2.66
- 25 feet 1.85 1.76 1.73 1.94 1.85
-75 feet 1.20 1.15 1.17 1.18 1.39
- 125 feet 1.01 0.91 0.70 0.34 0.42
Slide View 2 Discovery Point
Average 2.09 2.32 2.40 2.42 2.38
- 25 feet 1.64 1.73 1.88 1.80 2.06
-75feet 1.42 1.19 1.16 1.13 0.96
- 125 feet 0.94 0.74 0.61 0.60 0.64
Slide View 3 Merriam Point
Average 2.30 2.33 2.45 2.60 2.48
- 25 feet 1.74 1.74 1.72 1.83 1.46
- 75 feet 1.08 1.26 1.23 1.23 1.50
- 125 feet 0.85 0.58 0.61 0.36 0.43

84
depicting levels closer to the existing average lake level were preferred more
frequently. The differences between these four means are all statistically significant
(p<.05).
To find whether the information treatment had an effect on the mean number
of times any lake level was preferred, the means were compared across treatment
groups. Based on the earlier results, it was expected that information on lake levels,
especially the information that changing lake levels were caused by human uses of
lake water (treatments 4 and 5), would cause the highest level (Level 1) to be preferred
more often and the lowest level (Level 4) to be preferred less often. The expectation
for the two intermediate lake levels is indeterminate because sometimes they are
compared to higher lake levels and sometimes to lower lake levels. When being
compared to the higher lake levels, it was expected that the information would lead to
lower means, and when being compared to lower lake levels, that the information
would lead to lead to higher means. The opposite effects would cancel each other out.
For the two cases where the effect of information should be consistent (Level 1
and Level 4), the results show that in all cases except one, the mean number of times a
slide was preferred went up for Level 1 and down for Level 4 as we moved from
treatment 1, to 2, to 3, to 4. The only exception to this increase was the comparison
of treatment 2 with treatment 3 for the slide with View 3, level 4. In this case the
mean number of times this slide was preferred was .58 in treatment 2 and .61 in

85
treatment 3, a difference which is not statistically significant. The effect of treatment
5 did not follow the pattern set by the first four treatments. While Level 1 was
preferred over the other levels, these results suggest that the effect of treatment 5 did
not have as much influence over the mean number of times a slide was preferred as
when human influence information was displayed on the slide image.
Perceived Difference in Crater Lake Levels
In the visual portion of the study, there were two primary goals. The first was
to test whether participants could detect differences in lake level drops in Crater Lake,
and the second was to elicit participants' preferences for lake views. The following
section explores participants' visual perceptions of the differences between slide views
as they relate to the summary statistic created for each participant's responses. These
summary statistics are referred to as the difference score, or Dscore, test statistic.
The Agreement Statistics: Results from the difference score. Recall from
Chapter 3 the summary statistic created from participants' observations of differences
between the slide pairs. Referred to as the difference score, or Dscore, it represents an
individual participant's departure from what would be expected if she or he was able
to detect all differences in the slide pairs correctly. In brief, the Dscore is calculated
DE = (observed # in cell - expected difference # in cell)2over all 6 cells

86
To obtain the participant's relative departure from the expected number of differences
follows as
RDE = DE / 252
and then RDE is converted to the agreement statistic indicating the participant's
ability to see differences in lake levels
Dscoreij = 1 - RDE
For testing whether study participants' abilities to detect differences in the lake
levels in the slide images were influenced by information given to them about the lake
views, the null hypothesis is that information treatments do not affect participants'
perceptions of differences between the slide views depicting lake level drops.
In order to investigate whether a participant's difference score is dependent on
the information they received about the slide views, effects of the 5 information
treatments were explored using the analysis of variance (ANOVA) procedure for
nested factorial designs. Results have been included in Tables 4.3 and 4.4.
From the initial analysis of variance, it was necessary to assess the role of
experimental factors to determine which is responsible for components of the
partitioned variation. In this instance, there was variation due to the individual session
within treatment groups and variation due to participants within the session and
treatment groups. If mean squares are similar in magnitude, this means that it can be
assumed that the variation present is due to the participants and not the sessions.

Table 4.3. Analysis of Variance Table for Difference Scores.
< .05
Table 4.4. Mean Difference Scores for the 5 Treatment Groups.
87
From the initial analysis, it was determined that the error for the variable
sessions within treatment group and the error for participants nested within sessions and
treatments were approximately the same. The variation between sessions within
treatment is .034 and the mean square for participants nested within sessions and
treatments is .033, so the ration is effectively equal to 1. In this way, it is assumed that
the participant to participant variation is the same as the session to session variation.
Therefore, this term was removed from the model and the analysis of the effect the
treatment had on the participants' scores continued. A more precise measurement of
Treatment Dscore L5Mean Std Err LSMean 95% Confidence Interval
1 0.885 0.0108 0.864 0.906
2 0.888 0.0119 0.865 0.911
3 0.891 0.0128 0.866 0.916
4 0.916 0.0122 0.892 0.940
5 0.936 0.0134 0.910 0.962
Source df SS MS F
Treatment Model 4 0.422 0.105 3Q7*
Error 1156 39.749 0.034Total 1160 40.171

88
error was derived and more power was gained in the increased degrees of freedom to
detect a statistical difference in treatment effects since it is assumed that the subjects
are the experimental units. The net effect of such a pooling is that the F-test associated
with testing for the treatment effect gains a larger number of degrees of freedom
associated with the denominator, thus gaining greater accuracy.
There is strong evidence of an informational treatment effect on participants'
abilities to detect differences in the lake levels between the slide images (Table 4.3).
This indicates that the Dscore means of at least two of the five groups in the
informational experiment are not equal. In addition to mean agreement scores and
their standard errors, 95% confidence intervals for the difference scores are indicated
below in Table 4.4. Least squares means for the Dscores are close to 1 for each
treatment, providing evidence that participants were generally able to detect
differences between slides with increasing difference scores suggesting differences in
treatment effects. Mean scores close to 1 indicate that, even without information
(Treatment 1), participants in the experiment show a strong tendency to be able to tell
the difference between slide views, with a strong mean difference score of .885.
Further Exploration of Informational Effects on the Dscore. To investigate
the specific sources of variation between the five treatment groups, contrast
comparisons were made using combinations between information treatments. The
contrast procedure was useful because contrasts may be used to test hypotheses

89
involving more than two means. Table 4.5 contains results from the analysis of
variance for various treatment combinations as they corresponded to the study
hypotheses which follow. A reference for the informational treatments is provided in
the previous chapter in Table 3.3.
Table 4.5. Contrast Table for Treatment Comparisons Relating to the Dscore
Comparison df MS F
< .01
Several null hypotheses can be stated at this point which can be tested to
investigate any differences between the treatment groups.
There is no difference in participants' scenic preferences in treatment group 1 (no
information) when compared to group 2 (verbal information).
There is no difference between participant's scenic preferences in treatment group
2 (verbal information) and groups 3 and 4 (slide text information).
There is no difference between scenic preferences of group 3 (slide text - natural
variation information) and group 4 (slide text - human influence information).
Ti vs. T2 1 0.002 0.05
T2 vs. T3 and T4 1 0.036 1.04
T3 vs. T4 1 0.069 2.01
Ti vs. T3 and T4 1 0.061 1.78
T4 vs. T5 1 0.041 1.32
T5 vs. all others 1 0.266 7.74
Ti vs. T5 1 0.302 8.80**
T2 vs. T5 1 0.241 7.02

90
4. There is no difference between scenic preferences of group 4 (slide text - human
influence information) and group 5 (information priming effect of potential
human uses).
Results from the analysis of variance do not suggest a statistical difference between any
of the comparisons in these hypotheses. As a result, it is not possible to reject any of
these null hypotheses.
An additional null hypothesis states that there is no difference between scenic
evaluations of group 5 (priming effect of potential human uses) and other treatment
groups. There is strong evidence of a treatment effect when treatment group 5 is
compared to other treatment groups combined. (F = 7.74, p .006). In terms of the
simple comparison between treatment groups 5 and 1, evidence also suggests a
difference (F = 8.80, p = .003). A comparison between treatment groups 5 and 2 also
shows evidence of a significant difference. (F = 7.02, p = .008). These statistically
significant differences suggest a strong treatment effect is present when participants in
the study consider potential human utilization of Crater Lake prior to viewing the
slides in the visual portion of the experiment. This treatment effect is in contrast to
the previous analysis section, in which there was no statistical evidence that effects in
treatment 5 influenced the mean number of times a slide was preferred.
As was noted in Chapter 3, a straightforward understanding of the results from
the summary statistic for participants' visual preferences, the Pscore, proved to be

91
more complex than the more direct calculation of the Dscore. The scaled nature of
individual preferences for slide views (on a 5-point left-right preference scale) made the
definition of the ideal preference response problematic. Because of the interpretive
difficulty with the Pscore, it was decided not included the analysis of the Pscore in the
results section of this study. An exploratory analysis and discussion of the Pscore has
instead been included in Appendix G.
Attitudes Toward Use of Crater Lake Water
1996 Participant Attitudes. During the Visitor Center survey, participants
were asked a series of questions regarding alternative uses of Crater Lake water. These
questions involved potential utilization of the lake water for commercial, industrial,
hydropower, domestic, geothermal, agricultural, municipal, park visitors, and
generally stated "human purposes." A series of statements were made regarding the
acceptability of such uses of Crater Lake water and respondents were asked to state
whether they agreed or disagreed. In order not to bias respondents into thinking that
all uses were either acceptable or not acceptable, the statements for each use varied
(Figure 4.16). This was an attempt to avoid response sets as an artifact of similar scale
arranged in the series format of this question. The response frequencies to each
individual scale item have been provided in Appendix A, question 7.
In all cases, over 60% of the respondents disagreed that any of these uses were
appropriate for Crater Lake water. Commercial, industrial, park visitors, and general

I
f
9 25 100
Figure 4.16 Visitor Attitudes Toward Use of Crater Lake WaterVisitors were asked to state whether they thought lowering the lake level
is or is not appropriate for the following activities
Not appropriate for commercial use
Appropriate for industrial use
Not appropriate for hydropower
Appropriate for domestic water supplies
Appropriate for otherma1 resources
Not appropriate for agiiculture
Appropriate for municipal water supplies
Not appropriate for park use
Appropriate for human purposes
50 75Response percentage
Agree Neutral Disagxe Don't Know
92

93
"human purposes" were all opposed by over 75% of respondents. The alternative with
least opposition (63%) was to use Crater Lake water for geothermal purposes, but this
use also had the most "don't know" responses (12%). None of the human uses was
considered acceptable by more than 14% of respondents.
Responses to the neutral point on the acceptability scale provide some insight
into the ambivalence of participants' attitudes toward the types of utilization in the
question. As noted above, geothermal resources had the least opposition of all uses,
but also the highest level of ambivalence. Use of lake water for domestic and
municipal water supplies were comparable in participants' neutral responses, with 9%
each. The least ambivalence was in the categories of industrial and commercial use,
with 3% and 2% indicating neutral feelings, respectively. The rest of the human uses
have a neutral range of 7% (park visitor) to 8% (hydropower).
Group Interview Participant Attitudes. Park visitors who participated as
members of the interview groups also provided information relating to attitudes
toward human use of Crater Lake water. After the slide portion of the interview,
these visitors were asked what their reactions would be if informed that lake levels
were changing because of human use of the lake water.
All verbal responses to such a scenario showed opposition. For example, from
the fourth interview group, comments included, "Unbelievable. I wouldn't want to

94
hear that," as well as "Disturbing," and "I'd be horrified. I'd wonder why, and if use
was being controlled at all."
Interview participants were asked if there were any imaginable situations they
could think of that would be necessary before use of Crater Lake water for human
purposes would be acceptable. Most of the ideas produced by the groups involved
some sort of catastrophic event, such as drought or forest fire. Indeed, all four groups
interviewed indicated some acceptance of the use of lake water for forest fires.
Reasoning which sees fires as unnatural events destructive to park resources was
evident in remarks such as the following.
The forest fires are starting to be catastrophic. They're no longer ableto do controlled bums. Yellowstone was catastrophic; it burned all theway through the park and there was no way to stop it. There was toomuch fuel to bum so if it's a catastrophic fire then somehow we need tobe able to put it Out and for me it would be okay to take water fromCrater Lake, because it's 1900 feet deep so if it lost 4 feet from this itwould be acceptable.
Study participants showed disappointment, but general resignation, when asked what
they thought of changing resource conditions because of natural variation. "A shame,
but what are you going to do about it?" asked one participant, displaying an attitude
common toward natural events such as earthquakes or volcanic activity affecting lake
levels. Another participant commented, "Well, there's nothing you can do about a

95
natural change. A human change there is." Participants' understanding of forest fires
as natural events was an area not covered by the scope of the group interview.
After some discussion, the researcher asked the groups what their decision
would be if they were appointed as members of a committee which needed to decide
about this matter by the year 2000. The groups consistently came to general
agreement that extracting water for human purposes was inappropriate, even in most
drought conditions. One discussion involving conditions of drought and the needs of
increasing population illustrates participants' feelings about other sources being
utilized before considering use of Crater Lake water:
Visitor A: No, I wouldn't agree that we could use it [the lake] fordrinking water. We could find alternative groundwater sourceselsewhere. And the unique thing about this lake is that it's notreplenishable. If you deplete it, it's just going to go down because thereplenishment is in an equilibrium now and some might come back, butit wouldn't continually come back. It's not like Lake Shasta where youhave drainage from all the mountains around it that keep it filled.
Visitor B: I think that's what man-made lakes are for. Because those arereplenishable.
Visitor C: If people know that the area is growing and you know whatthe water needs are, those things can be projected and then people needto conserve. If they aren't willing to conserve and aren't willing tolearn how to do with less, which people have done forever, if they livesomeplace where there isn't a lot of water--for example, taking theentire contents of the Colorado River and pumping it into Los Angeles--those people that water their lawns and go on like that. The thing isthat if you know these things are going to be needed, then you have tostop your wasteful practices and start making do with what you havebecause this is something that has been here for thousands of years that

was made by nature which cannot ever be replaced once it's been sulliedby man.
Visitor B: Besides, I think this is more than a local resource. This is anational treasure and it really should be off limits.
Visitor C: Conservation is a thing that hasn't been properly explored orused. There has been research done in some places where waste water isable to be recycled as well, as a conservation measure, and conservationhas limits as well. But it's another thing where people's attitudes haveto be changed. I think people think more about conserving water nowthan they did earlier.
Other comments made by interview participants suggested that they had paid
attention to interpretive displays at various points in the park. In several instances
throughout the group interviews, the influence of interpretive information was
apparent from comments made by participants. Indeed, the knowledge that
participants had regarding water inputs into Crater Lake as well as its historic stability
influenced discussion, and in turn seemed to influence group opinion. For example, in
a discussion of whether or not inputs to the lake would balance with any removal of
water for human purposes, a visitor in one group reported, "The information in one
of the signs at the Rim says that snowfall and rain are the only inputs into the lake."
Several references were made to the interpretive displays in the Visitor Center, and
along the walk at Rim Village. In two instances, participants had generally accurate
knowledge of the height of Wizard Island. For example, when asked if they had any
96

idea how high the island was above the lake, a respondent in the first group said, "It
said out there on the interpretive display 600 something."
Modeling Perception of Differences
The final stage of the analysis investigated potential associations that visitor
demographic and attitudinal measures might have on the study participants' ability to
detect differences in the slide views. Demographic characteristics included age,
income, education, the size of the community in which participants grew up, as well
as the size of their current community. Characteristics of participants' visit to Crater
Lake included if the park was their final destination, whether they had seen the lake
before, taken a boat ride previously, if they had attended a Park Service interpretive
presentation, and if they planned on either taking a boat ride or attending an
interpretive session. Also included in the initial models were participants' attitudes
toward the various potential uses of Crater Lake, including commercial, industrial,
hydropower, domestic, geothermal, agricultural, municipal, park visitor, and general
human purposes.
Table 4.6 contains the results from the regression analysis with Dscore as the
dependent variable. There was no evidence of an association between the Dscore and
most of the demographic and trip variables described above. Additionally, there was
no association between any of the participants' attitudes toward use of the lake water
and their Dscore. However, evidence suggested a relationship between participants'
97

*p < .05 'p < .0001
98
Dscore (their ability to detect differences between the views) and their age, income,
and attendance at an interpretive presentation.
After accounting for differences due to information treatments and visitors'
final destination, there is evidence of an association between participants' Dscore and
their age, income, and if they had attended an interpretive session (Table 4.6). As a
participant's age increases, their score of agreement (whether they saw a difference)
decreases by 0.00 18 units. As a participant's income increases, their Dscore increases
by 0.0153. With increasing age, a decline in visual ability seems understandable. The
increase in ability to detect differences with an increase in income may also be related
Table 4.6. Final model from the Dscore.
Note: The variable representing final destination is not significant, but is used in thisanalysis to control for the difference in a participant's purpose at Crater Lake.
Variable df SS MS F pModel 8 1.274 0.106 3.06 0.0003
Error 956 19.284 0.035
Corrected Total 969 20.558
Variable df Parameter SS MS F
EstimatesTreatment 4 0.28 0.094 2.71*
Destinationt 1 -0.0002 0.086 0.014 0.41
Age 1 -0.0018 0.538 0.538 15.51**
Income 1 0.0153 0.506 0.506 14.58**
Interpretive Presentation 1 0.0209 0.152 0.152 439*

99
to the fact that older participants (who are more likely to be retired) likely have more
limited incomes. Finally, if a participant attended an interpretive session, their
Dscore increased by 0.0209. The effect of interpretive information corroborates with
suggestions from the group interviews that information gained from interpretive
sources has an effect on a visitor's ability to detect differences in the lake level
depictions. For example, these visitors knew that there is limited variation in lake
levels or that the water in the lake is a balance of rain and snowfall with evaporation.
Finally, 95% confidence intervals can be calculated to show the effect of a one
unit increase in each of the statistically significant explanatory variables. For example,
to describe the range of effect of a one unit increase in participants' Dscore, the
following calculation produces this range for a 95% confidence interval.
95% CI = estimate ± (1.96) (SE(estimate))
= -0.0018 ± 1.96 (0.0005)
= -0.00278, -0.00082
The interval of (-0.00082, -0.00278) represents a 95% confidence interval for age on the
Dscore. In other words, for an increase of one year in age there is little corresponding
change in the Dscore, from -0.00082 to -0.00278 units (95% CI).
Using the same approach for income, the interval of (0.0075, 0.023 1) represents
a 95% confidence interval for income on the Dscore. An increase in a one level change

100
of participants' total household income (see Appendix A, question 6 of the
demographic questions in the onsite survey) would have a slight corresponding change
in the Dscore from 0.0075 to 0.023 1 units. The effect of a one unit change in whether
or not participants attended an interpretive session is contained in the 95% confidence
interval from 0.0008 12 to 0.041188 units.
The best fit model for predicting participants' ability to detect differences
including the variables from above is represented by the equation
p{DscoreITreatment, Destination} = La + L age+ L2 income + L3 interp + c
and subsequently,
.L{DscoreI Treatment, Destination} =0.857 - .00l8age + 0.Ol53income + 0.O209inteip + s
It should be noted that the scale used to measure attitudes relating to potential
uses of the lake water has a range of five, with ordered responses making this an
ordinal variable (categorical with order), so it is within reason to treat these variables
as continuous explanatory variables. This is advantageous in that the effect can be
measured with more precision in the case of this study. Indeed, Borgatta and
Bohrnsted (Borgatta and Bohrnstedt, 1981) argue that such social variables are
continuous at the latent level and thus, when other assumptions are met, do not pose
serious problems for the social sciences. Prior to undertaking the analysis, the data set
was checked for normality through the use of boxplots.

Chapter 5. DISCUSSION
Overall Implications
This study addressed three main areas. The first was related to the effect that
changing lake levels have on visitors' scenic perceptions. Research questions focused
on lake levels explored whether visitors to Crater Lake National Park would perceive
a difference in the level of Crater Lake if it was lowered, and if views depicting the
present lake level would be preferable to those showing reductions of - 25, - 75 and
- 125 feet. The second area investigated whether visitors would find human uses of
Crater Lake water acceptable. If visitors had strong perceptions, preferences, and
attitudes regarding lake levels, then future changes in lake levels would likely affect the
quality of visitors' aesthetic experiences. The third area explored the influence of
information as it related to the role of natural variation and human influence on scenic
perception. Information relating to lowered lake levels was included during the visual
portions of the study in both verbal and textual formats. Perceptions of natural
variation and human influence as part of scenic evaluations were also explored in the
group interviews.
While this study's findings cannot be generalized beyond visitors to Crater
Lake National Park, they indicate that visitors are sensitive to changes in lake levels,
101

102
even when no information is present identifying change. These findings are consistent
with other studies exploring landscape change and human influence. Theoretical
implications of this study support the idea that landscape perception is a transactional,
or interactive process involving salient landscape features as well as visual-perceptual
responses. For park managers, the findings of this study indicate that attitudes and
perceptions of members of the public are sensitive to changes in the landscape, even
when visitors are not informed of the visual changes taking place. Evidence indicates
that the implication of natural change has a negative effect on viewer evaluations.
There is also evidence that, when informed that visual changes are due to human
influence, visitors' scenic evaluations are negatively influenced to a greater degree.
Visual Perception and Preference
Perception of Differences in Lake Levels. Overall, participants in this study
were able to detect differences when they were shown slide views of varying lake
levels. This was true when visitors had no information about the slides they were
viewing, and was more pronounced when visitors were told that the views depicted
alternative lake levels. Results from matched pairs in the slide sessions, however,
suggested that individual perceptions of differences are generally, but not always,
consistent. There was evidence that age, income category, and attendance at an
interpretive session had an effect on their ability to detect differences, but the impact

103
of these variables was slight. The findings of this study which related to the age and
income levels of participants were consistent with previous work by Buhyoff (1983),
in that human factors relating to scenic preference to some extent included these socio-
economic groupings (age, income) as well as involvement (interpretive session
attendance).
Findings which suggest a decline in participants' ability to detect changes with
increasing age indicate that collecting observer responses to scenery solely from
photographs may not be as reliable in the case of older individuals' perceptual abilities.
These findings extend concerns raised by Stewart (1984) regarding the physical-
dimensional aspects of photographs when they are used to represent real-life settings.
Even when clarity, color, contrast, and viewpoint are carefully controlled by
computer, participants in visual experiments can respond differently based on visual
ability.
Similar to Egan (1995), these findings support the importance of using multiple
methods in the study of scenic quality. Where one of the methods used in this study
left some question regarding the focus of visual evaluation (in this case, the difference
portion of the slide presentation), the other methods (attitudinal measures, group
interviews) augmented the researchers' ability to draw conclusions about scenic
preference beyond the difference measure. The complexity of attitudes and

104
preferences as they relate to scenery support the use of a broad range of research
methods for eliciting sociocultural differences in landscape aesthetics (Hampe, 1988;
Tips and Savasdisara, 1986).
Preferences for Lake Levels. Results from the slide portion of the study suggest
that visitors are generally consistent in their preferences for views of Crater Lake that
reflect water levels unchanged from the present. This consistency was evident from
preference ratings in the matched pair part of the slide session. Responses to the
matched pairs were more likely to be rated in the neutral category, indicating that
visitors were seeing similar images and had fewer strong preferences than in response
to other slide pairs.
There was evidence that Crater Lake as the primary destination of participants'
trips affected visitor preferences for lake views. The reason for this difference is
difficult to pinpoint from the data provided from this study. These results suggest
that further inquiry in the area of environmental and recreation involvement
(McIntyre, 1989; Moore and Graefe, 1994) is a worthwhile direction for future
exploration of scenic values in national parks. For example, are highly involved
visitors (defined as those who indicated that the park was their main destination)
different from other visitors (defined as those for whom Crater Lake was a less
important trip)?

105
Effect of Information
As noted previously, information relating to both natural and human influence
affected visitor preferences for lake views, with a more pronounced negative effect on
scenic quality when human use of Crater Lake water was indicated while visitors
observed pictures of the lake. This effect was consistent with study results concerning
visitors' attitudes toward a number of alternative human uses of Crater Lake discussed
in the results section. In addition to statistical evidence for the affect of interpretive
information on participants' ability to see differences in views, results from group
interviews also indicates that visitors pay attention to interpretive facts at various sites
around Crater Lake, and that they are able to recall them at a later time. The
indication that visitors pay attention to resource-specific information provided
through interpretive means suggests that visitors are inclined to utilize such
information in the formation of impressions of the natural state of the park.
The findings of this study are consistent with the conclusions of Hodgson and
Thayer (1980), which indicated that implied human influence on a natural setting
reduced the scenic quality of that setting. Hodgson noted that when a landscape
photograph implied human influence on the setting (such as calling a lake a reservoir),
the setting is judged to be less beautiful. Informational findings from this study are
more pronounced than those indicated by Anderson (1981), who noted that for scenes

of high scenic quality, a label implying human influence had only a slightly
detrimental effect. However, Anderson investigated land use designations, so there
may be contextual problems comparing this study to those findings.
Acceptability of Potential Human Uses of Crater Lake Water
Philosopher S.C. Pepper's proposition that context and meaning of an object
can intensify the emotional appreciation of that object is confirmed by this study's
findings as they relate to the on-site nature of the sample from Crater Lake visitors.
That is, the fact that people participating in the study did so on-site at a national park
could explain the general opposition of participants to potential human influence of
Crater Lake. People who make the effort to visit National Parks may be more
preservation-oriented than people who do not visit parks (Bromley, 1980; Rollins and
Chambers, 1990; Schreyer and Roggenbuck, 1981). The role of Park Service sites as
repositories of nationally symbolic landscapes is well-documented in the literature
(Clay, 1985; Schreyer and Roggenbuck, 1981; Sellars, 1997) and could account for the
crystallization of visitor attitudes toward potential human influence on resources in
national parks. Results from both the attitudinal survey as well as the group interview
attest to visitors' strong negative feelings toward potential human influence. This
supports Pepper's assertion regarding the setting and context of this study: a national
park of scenic and natural importance.
106

107
Study Limitations
The findings of this study are restricted to visitors at Crater Lake National
Park. Investigation of visitor perceptions of changing resource conditions at other
National Park sites would expand the knowledge base regarding people's preferences
for natural scenery and ecological integrity. While a volume of research relating to air
quality has been conducted in relation to its effect on the visitor experience, other
issues such as water quality will undoubtedly arise as other water rights adjudication
procedures commence near other National Park Service sites (Taylor et al., 1995).
From interviews following the slide sessions, there is limited but consistent
evidence that a small number of participants in this study focused their attention on
visual elements other than the lake levels. This was apparent in results from the
matched-pair slides discussed above. This might explain some of the experimental
error in the quantitative analysis of participants' ability to detect differences in the
slides, as well as unexplained error involved with preference data for views. However,
there is general indication of acceptable instrument validity based on the fact that the
majority of participants correctly identified no differences in the matched pairs, and
that their preferences for these pairs was more neutral than for other pairs. Findings
from the group interviews, which indicated that scenic judgments were based on lake

108
levels after the first few slides were viewed, also support this study's instrumental
validity.
A theoretical issue deserving continued attention concerns the dynamic
between visitor attitudes and scenic preference. Visitor preferences for higher lake
levels and visitor attitudes opposed to human use of Crater Lake water are shown to
be predictable, and a direct relationship between the two is implied from the results of
this study. Continuing to develop methodologies which would allow investigations
of correlations between these the variables of attitude and preference would be
particularly useful in an instance where the interplay of potential visual landscape
alteration and public preferences could be mitigated by intervening attitudes toward
natural resources.
Future Research
Park Service Policy. A recently published internal analysis of the National
Park Service's approach to management has been highly critical of the agency's
emphasis on recreation and scenic "facade" management (Sellars, 1997). A Park Service
historian, Sellars is highly critical of the agency's leadership, but predicts a shift away
from the present tourism and development-oriented leadership culture toward one of
environmental preservation. Sellars notes that the agency imperative to leave parks
unimpaired for future generations is increasingly understood as more than preserving

109
the scenic facade of nature, and is turning toward a concern for the ecological base that
supports highly-valued scenery. However, Gobster (1996) observed that the more
recent emphasis on biodiversity as a nonutilitarian benefit of natural resource
management may also conflict with traditional aesthetic goals of managing agencies.
In this regard, increased acceptance of major disturbances in forest ecosystems (such as
large scale fires) can be at odds with previous visual quality management plans.
The National Park Service will continue to struggle with the duality of its
mandate to preserve the natural state of the parks while at the same time ensuring
their public enjoyment (Manning, 1998). Results from this study suggest that park
visitors prefer scenery which reflects the visual integrity of Crater Lake as it presently
exists. While other findings indicate that visitors are more accepting of change when
it occurs because of natural events, they still are apt to evaluate views resulting from
such changes as less acceptable. These findings confirm observations made by Wood
(1989), who indicated that the idea of "natural" often is defined by a setting which is
park-like, tidy, and static. However, this would counter Leopold's idea of a land
aesthetic as being more than what appears on the surface of the landscape, involving
the integrity of the biotic community (Leopold, 1991).
The shifting management emphasis in the Park Service which Sellars predicts,
as well as issues raised by this study, suggest numerous other possibilities for future

110
research. Exploration of park visitors' attitudes and perceptions as they relate to the
open-ended directives in the National Park Service mission is one prospect. This is
particularly the case when decisions are being made which affect the preservation of
highly scenic and ecologically sensitive sites such as Crater Lake. Questions relating
to how visitors understand the National Park Service's mission should be explored,
particularly because if there is uncertainty regarding the consistency of park managers'
versus park visitors' idea of what is "natural" in national parks (Manning, 1998). For
example, what does the phrase "to promote and regulate the use of.. .national parks"
imply for park users? What does it mean to visitors that the Park Service must
"conserve the scenery- and the natural and historical objects therein?" An investigation
into the interplay of attitudes and perceptions as they relate to trade-offs between
biodiversity and scenery would provide resource managers' valuable information as
the directives of ecosystem and biodiversity management become integrated with
National Park Service planning.
Use of Computer Visualization Techniques. The use of photographic images
as representations of Crater Lake scenery proved to be an acceptable method for
gathering park visitors' impressions of changes in lake levels, with some limitations.
The cautionary tone expressed by Hull and Stewart (1992) relating to the ecological
validity of photographs should be kept in mind while considering this study's results.

111
Participants' mixed abilities regarding their perceptions of differences (as reflected in
the matched slide pairs in the study) warrant consideration. Comments provided by
visitors in the interviews suggest that visitors can at times perceive differences when
there are none present. Because this study utilized several measures of scenic
perception, however, the influence of "visual error" is probably limited. Again, results
from interviews indicated that participants generally were able to detect differences
correctly by the third slide pair in the interview sessions. It is the researcher's
assertion that relevant dimensional aspects of study views (including clarity, color,
viewpoint) as outlined by Sheppard (1989) support the face validity of the slides.
Because of this study's visual control over changes in the slide images,
researchers' ability to make inferences regarding park visitors' preferences was
increased (Orland et al., 1994). Continued refinement of computer generated imagery,
and the methodologies which utilize such images in the study of natural resource
perception, an area where continued research will prove valuable. While this study
used state-of-the-art computer digitized images, in order to present them as part of a
visual experiment it was necessary to convert them to slide projection technology
which is decades-old. As projection technologies catch up with production, the
control of visual stimuli will become increasingly refined. Further research and
simplified use of computer-aided photo images will make computer-aided visual

112
research an even more available tool for natural resource managers to utilize in their
pursuit of information from the viewing public.
Use of Qualitative Interviews. A previous study by Schroeder (1988) suggests
that an effective record of what people see in landscapes can be garnered from their
verbal responses. There is increasing support for utilizing group interviews as a tool
for gathering natural resource-related information from the public (Buchanan, 1992;
Desvousges and Frey, 1989; Kingsley et al., 1988; Morgan, 1997; Steckler et al., 1992).
Insights gained from the qualitative interviews in this study show promise
regarding the increased utilization of interactive interviews in scenic preference
research. The richness of information yielded by group interviews in suggests that
this methodology is a worthwhile vehicle for exploring the complexity of park
visitor's perceptions of naturalness, as well as their attitudes toward management
alternatives. Indeed, in his analysis of biodiversity and scenic aesthetics, Gobster
(1996) asserts that more realistic and enriched analysis of potential visual changes
could be found in open-ended questions and group discussions along with standard,
scaled attitudinal analyses. In addition to understanding the perceptual and attitudinal
processes of visitors, park managers should continue to explore visitors' beliefs about
the balance of the Park Service's dual mission, particularly when biodiversity goals
affect public enjoyment of scenery.

113
While a particular strength of this study rests in the predictive nature of the
quantitative survey, the exploration of reasoning used by Crater Lake visitors
provided valuable additional information which would not have been available had
the study ceased after the first season in 1996. For example, the role that interpretive
information plays in park visitor perception of resource condition was illustrated on a
phenomenological level from the group interview results. During the course of the
interviews it became apparent that visitors had garnered information from previous
exposure to interpretive displays at the Visitor Center. A number of participants
utilized their knowledge from interpretive data (relating to lake inputs) in reasoning
about human uses of Crater Lake. In this instance the cognitive component of
information processing appears to have mediated the responses of visitors to the visual
stimuli in the slides. These findings suggest that the use of the positivist approaches
represented by strictly quantitative analysis of scenic quality issues may limit
researchers' ability to understand the dynamic nature of park visitors' perceptions.
Through the interactive approach of group interviews, future research could
also explore how interpretive information relating to park resources becomes visitor
knowledge, and how this knowledge informs visitors' understanding of the dynamic
processes associated with park ecosystems. Implications from this study show that
information regarding external influences on park scenery can affect what visitors seen

in a park setting. These findings underline the power that information plays in the
hands of Park Service managers and interpreters as they work to inform visitors'
perceptions.
Theoretical Implications
One theoretical issue discussed in the literature review of this dissertation
questioned whether scenic beauty is an objective property inherent in the physical
landscape or a subjective phenomenon rising from individual perception. Results
from this study support a theoretical consideration which connects the two. While
visitors' attitudes toward change of the visual scene at Crater Lake could have been
measured without a visual, physical landscape referent in photographs, the inclusion
of photographic representations facilitates the connection between visual standards of
scenic beauty with attitudinal measures. Indeed, results from this study support the
theoretical proposals of Zube et al. (1982) which focused on the interaction of visitor
perceptions with physical changes. The outcomes from this study generated both
descriptive and predictive equations relating to the outcomes of the human-landscape
relationship at Crater Lake.
114

115
Implications for Park Management
The 1993 FEMAT report documented how ill-equipped land management
agencies are in dealing with a variety of social issues, including cultural, recreation and
scenic resources. User-based assessments in the evaluation of the scenic consequences
of landscape change are particularly important when they concern areas of visual and
ecological sensitivity, such as in national parks or wilderness areas (Vining and
Stevens, 1986; Zube, 1992), but they could also serve in the broader function of
landscape planning for less sensitive areas. Objective and subjective assessment of the
public's perceptions of changes in scenery can be highly informative for considering
management alternatives. However, a caveat relating to the cultural orientation of
scenic values is necessary as it relates to the setting and subjects of this study. The
findings of this study reflect the beliefs and assumptions of visitors to a national park
in the western United States. While other studies have explored aesthetics as a cultural
artifact (Clay, 1985; Hampe, 1988; Hull, 1989; Leikola, 1986; Zube, 1981), that was not
the goal of this study. To generalize these findings as they relate to resource changes
in countries other than the United States would be inappropriate.
Informed landscape management which integrates both physical and social
elements is not only a policy directive in numerous protective environmental laws, it
is particularly important in a time when such decisions are highly politicized and legal

116
challenges to agencies are commonplace (Allen and Gould, 1986). Visual scenic
analysis, when combined with investigation of public preference, can be a particularly
useful tool for the evaluation of management and legal questions. In turn, managers
may minimize negative public responses with a better understanding of how changes
in natural scenes will be perceived by the public they serve. For example, the
sensitivity of the public toward water scenes is well documented in the literature
(Cherem, 1973; Herzog, 1985; Kaplan, 1977; Litton, 1974; Pitt, 1989; Walker and
Havens, 1973). Results at Crater Lake confirm the importance that managers
remaining vigilant and informed when considering changes in valued landscapes,
especially when their decisions have direct impacts on water scenes.
People's perceptions and interactions with natural landscapes involve complex
processes. As noted by Vining and Stevens (1986), the interpretation of observer
responses to scenery must acknowledge processes such as preference, judgment, and
the observer's individual frame of reference. The results of this study agree with
Vining and Stevens, who developed a conceptual landscape preference model based on
the interaction of physical landscape characteristics, real or implied presence of
management, and the attitudes, expectations, and perceptions of individual observers.
In sum, when changes in scenery become evident, they can affect people's scenic
evaluations whether those changes are natural or human-caused. This is particularly

117
the case when visitors are provided with such information while they view scenic
vistas. Surveys and interview data provided by this study indicate that people value a
park landscape less when informed that its current state has changed. Indeed, these
results show that beauty is both an objective quality inherent in the landscape (shown
by responses to slide manipulations) as well as a subjective impression on the part of
the viewer (shown in surveys and responses to potential human influence).

REFERENCES
Abbelo, R. P., and Bernaldez, F. G. (1986). Landscape preference and personality.Landscape and Urban Planning, 13, 19-28.
Allen, G. M., and Gould, E. M., Jr. (1986). Complexity, wickedness, and publicforests. Journal of Forestry, 84(4), 20-23.
Allen, S. D. (1988). Montana Bioeconomics Study: Results of the angler preferencestudy (Report). Helena, MT: Montana Department of Fish, Wildlife, andParks.
Amadeo, D., Pitt, D. G., and Zube, E. H. (1989). Landscape feature classification as adeterminant of perceived scenic value. Landscape journal, 8(1), 36-50.
Anderson, L. M. (1981). Land use designations affect perception of scenic beauty inforest landscapes. Forest Science, 27(2), 392-400.
Appleton, J. (1975). Landscape evaluation: the theoretical vacuum. Trans. Inst. Br.Georgia, 66, 120-123.
Arthur, L. M., Daniel, T. C., and Boster, R. S. (1977). Scenic assessment: An overview.Landscape Planning, 4, 109-129.
Bishop, I. D., and Hull, R. B. (1989). Integrating technologies for visual resourcemanagement. Journal of Environmental Management, 32, 295-331.
Bishop, I. D., and Leahy, P. A. (1989). Assessing the visual impact of developmentproposals: The validity of computer simulations. Landscape Journal, 8, 92-100.
Blumenthal, A. L. (1977). The Process of Cognition. Englewood Cliffs, NJ: Prentice-Hall, Inc.
Bonnicksen, T. M., and Stone, E. C. (1985). Restoring naturalness to National Parks.Environmental Management, 9(6), 479-486.
118

Borg, W. J., and Gall, M. D. (1971). Educational Research: An Introduction. NewYork: David McKay.
Borgatta, E., and Bohrnstedt, G. (1981). Level of measurement: Once over it again. InE. Borgatta and G. Bohrnstedt (Eds.), Social measurement: Current issues.Beverly Hills, CA: Sage.
Bourassa, S. C. (1990). A paradigm for landscape aesthetics. Environment andBehavior, 22(6), 787-812.
Bromley, P. (1980). The role of the public in landscape decisions: A case study in thePeak District National Park. Landscape Research, 1, 2-6.
Brown, T. C., and Daniel, T. C. (1986). Predicting scenic beauty of timber stands.Forest Science, 32(2), 471-487.
Brown, T. C., and Daniel, T. C. (1990). Scaling of ratings: Concepts and methods(Research Paper RlvI-293). Ft. Collins, CO: USDA Forest Service.
Brown, T. C., Richards, M. T., Daniel, T. C., and King, D. A. (1983). Scenic beautyand recreation value: Assessing the relationship. In J. Vining (Ed.), SocialScience and Natural Resource Recreation Management (pp. 281-299). Boulder:Westview.
Brunson, M., and Shelby, B. (1992). Assessing recreational and scenic quality. journalof Forestry, 90(7), 37-4 1.
Buchanan, D. R. (1992). An uneasy alliance: Combining qualitative and quantitativeresearch methods. Health Education Quarterly, 19(1), 117-135.
Buhyoff, G. J., Wellman, D. J., Koch, N. E., Gauthier, L., and Hultman, S. G. (1983).Landscape preference metrics: An international comparison. Journal ofEnvironmental Management, 16, 181-190.
Buhyoff, G. J., and Weliman, J. D. (1979). Seasonality bias in landscape preferenceresearch. Leisure Sciences, 2(2), 181-191.
119

120
Burdge, R. J., McAvoy, L., Absher, J., and Gramann, J. H. (1983). Altering the visualquality of a recreation resource and activity displacement. In R. D. Rowe andL. C. Chesnut (Eds.), Managing Air Quality and Scenic Resources at NationalParks and Wilderness Areas (pp. 314). Boulder, CO: Westview.
Call, C. A., Barker, J. A., and McKell, C. M. (1981). Visitor impact assessment ofscenic view areas at Bryce Canyon National Park. Journal of Soil and WaterConservation, 36, 50-53.
Callicot, J. B. (1992). The Land Aesthetic. Renewable Resources Journal, Winter, 12-17.
Calvin, J. S., Dearinger, J. A., and Curtin, M. E. (1972). An attempt at assessingpreferences for rural landscapes. Environment and Behavior, 4(4), 447-470.
Carls, E. G. (1974). Effects of people and man-induced conditions on preferences foroutdoor recreation landscapes. Journal of Leisure Research, 6, 113-124.
Cherem, G. J. (Ed.). (1973). Looking Through the Eye of the Public, or Public Imagesas Social Indications of Aesthetic Opportunity. Logan, Utah: Utah StateUniversity Institute Water Resources.
Clay, J. W. (1985). Parks and people. Cultural Survival Quarterly, 9, 2-4.
Cook, J., W.L. (1972). An evaluation of the aesthetic quality of forest trees. Journal ofLeisure Research, 4(4), 293-302.
Craik, K. H. (1983). A role theoretic analysis of scenic quality judgments. In R. D.Rowe and L. G. Chesnut (Eds.), Managing Air Quality and scenic resources atnational parks and wilderness areas (pp. 314). Boulder, CO: Westview.
Cranson, K. R. (1982). Crater Lake: Gem of the Cascades. (2nd ed.). Lansing,Michigan: KRC Press.
Cubbage, F. W., O'Laughlin, J., and Bullock, C. 5. (1993). Forest Resource Policy.New York: John Wiley.

Daniel, T. C., and Boster, R. 5. (1976). Measuring landscape esthetics: The scenicbeauty estimation method (Research paper RM-167): USDA Forest Service.
Daniel, T. C., Brown, T. C., King, D. A., Richards, M. T., and Stewart, W. T. (1989).Perceived scenic beauty and the contingent valuation of forest campgrounds.Forest Science, 35(1), 76-90.
Daniel, T. C., and Orland, B. (1992). Visual simulations for recreation choicemodeling: USDA Forest Service.
Daniel, T. C., and Vining, J. M. (1983). Methodological issues in the assessment oflandscape quality. In I. Altman and J. F. Wohlwill (Eds.), Behavior and theNatural Environment (pp. 39-84): Plenum Publishing Co.
Daniel, T. C., Wheeler, L., Boster, R. S., and Best, P. (1973). Quantitative evaluationof landscapes: an application of signal detection analysis to forest managementalternatives. Man-Environment Systems, 3, 330-344.
Dearden, P. (1985). Philosophy, theory, and method in landscape evaluation. TheCanadian Geographer, 29(3), 263-273.
Desvousges, W. H., and Frey, J. H. (1989). Integrating focus groups and surveys:Examples from environmental risk studies. Journal of Official Statistics, 5, 349-363.
Egan, A. F., Jones, S. B., Luloff, A. E., and Finley, J. C. (1995). The value of usingmultiple methods: An illustration using survey, focus group, and delphitechniques. Society and Natural Resources, 8, 457-465.
Fazio, R. H., and Zanna, M. P. (1981). Direct experience and attitude-behaviorconsistency. In L. Berkowitz (Ed.), Advances in experimental socialpsychology (Vol. 14, pp. 161-202). New York: Academic.
Fechner, G. (1860/1966). Elements of Psychophysics. New York: Holt, Rinehart, andWinston.
121
Forest Ecosystem Management Assessment Team. (FEMAT). (1993). Forest ecosystemmanagement: an ecological, economic, and social assessment. Portland, Oregon:

122
U.S. Department of Agriculture, U.S. Department of the Interior, NationalOceanic and Atmospheric Administration, Environmental Protection Agency.
G11iano, S. J., and Loeffler, G. M. (1995). Scenery assessment: Scenic beauty at theecoregion scale (Background Report). Walla Walla, Washington: USDA ForestService. Social Assessment Team: Interior Columbia Basin EcosystemManagement Project.
Gilpin, W. (1792). Three essays: On picturesque beauty; on picturesque travel; and onlandscape painting. London: R. Blamire.
Gobster, P. H. (1996). Forest aesthetics, biodiversity, and the perceivedappropriateness of ecosystem management practices. In: Brunson, M.W., L.E.Krueger, C.B. Tyler, S.A. Schroeder, tech. eds. Defining Social Acceptabilityin Ecosystem Management: A Workshop Proceedings. Kelso, Washington.PNW-GTR-369. U.S. Department of Agriculture, Forest Service, PacificNorthwest Research Station: 77-97.
Green, D. M., and Swetts, J. A. (1966). Signal detection theory and psychophysics.New York, NY: John Wiley.
Greene, T. C., Breeding, M., and Grant, J. (1982). The effects of instructional set andslide composition on ratings of air quality. Canton, NY: St. LawrenceUniversity.
Greider, T., and Garkovich, L. (1994). Landscapes: The social construction of natureand the environment. Rural Sociology, 59, 1-24.
Hall, T. E., Dedrick, J., and Shelby, B. (1997). Recreation in the Mohawk Valley(Administrative Report). Eugene, Oregon: Bureau of Land Management.
Hall, T. E., and Shelby, B. (1994). Eagle Cap Wilderness: Recreation use and impacts(Administrative Report). Corvallis, Oregon: Oregon State University.
Hall, T. E., and Shelby, B. (1996). McKenzie River Boater Study (AdministrativeReport). Eugene, Oregon: USDA Forest Service USD1 Bureau of LandManagement.

123
Hampe, G. D. (1988). The influence of sociocultural factors upon scenic preferences(Scientific monograph Series No. 18). Washington, D.C.: USD1 National ParkService.
Hendee, J. C., Stankey, G. H., and Lucas, R. C. (1990). Wilderness Management.Boulder, CO: Wilderness Leadership Foundation.
Herzog, T. R. (1985). A cognitive analysis of preferences for waterscapes. Journal ofEnvironmental Psychology, 5, 225-24 1.
Hodgson, R. W., and Thayer, J., R.L. (1980). Implied human influence reduceslandscape beauty. Landscape Planning, 7(2), 171-179.
Hull, R.B., Buhyoff, G., and Daniel, T. (1984). Measurement of scenic beauty: Thelaw of comparative judgment and scenic beauty estimation procedures. ForestScience, 30(4), 1084-1096.
Hull, R. B. (1988). Forest visual quality management and research. US GovernmentPrinting Office, 637-092, 485-498.
Hull, R. B., Buhyoff, G. J., and Cordell, H. K. (1987). Psychophysical models: Anexample with scenic beauty perceptions of roadside pine forests. Landscapejournal, 6(2), 113-122.
Hull, R. B., and Revell, G. R. (1989). Cross-cultural comparison of landscape scenicbeauty evaluations: A case study in Bali. Journal of Environmental Psychology,9, 177-191.
Hull, R. B., and Stewart, W. P. (1992). The validity of photo-based scenic beautyjudgments. Journal of Environmental Psychology, 12(2), 101-114.
Hussey, C. (1927). The Picturesque: Studies in a point of view. London: G.P.Putnam's Sons.
Ittelson, W. H. (1973). Environment perception and contemporary perceptual theory.In W. H. Ittelson (Ed.), Environment and Cognition (pp. 3-19). New York:Seminar Press.

Leopold, A. (1949). A Sand County Almanac: Oxford Press.
124
Johnson, F. R., and Haspel, A. E. (1983). Economic valuation of potential scenicdegradation at Bryce Canyon National Park. In R. D. Rowe and L. G. Chesnut(Eds.), Managing Air Quality and Scenic Resources at National Parks andWilderness Areas (pp. 314). Boulder, GO: Westview.
Kaplan, R. (1977). Down by the riverside: Informational factors in waterscapepreference (General Technical Report NC-28): USDA Forest Service.
Kingsley, N. P., Brock, S. M., and deBald, P. S. (1988). Focus group interviewing ofretired West Virginia nonindustrial private forest landowners. NorthernJournal of Applied Forestry, 88(5), 198-200.
Kreimer, A. (1977). Environmental preferences: A critical analysis of some researchmethodologies. Journal of Leisure Research, 9(2), 88-97.
Krueger, R. A. (1988). Focus groups: A practical guide for applied research. NewburyPark, GA: Sage.
Krueger, R. A. (1998). Analyzing and Reporting Focus Group Results. (Vol. 6).Thousand Oaks, GA: Sage Publications.
Kuehl, R. 0. (1994). Statistical Principles of Research Design and Analysis. Belmont,CA: Duxbury Press, Wadsworth Publishing.
Lee, M., and Brown, P. (1992). Great Basin Visitor Surveys: Comparison of 1988 and1990 Results (Technical Report NPS/PNROSU/NRTR-93/07). Seattle, WA:USD1 Pacific Northwest Region.
Leff, H. L., Gordon, L. R., and Ferguson, J. g. (1974). An Approach to EnvironmentalPsychology. Cambridge, MA: MIT Press.
Leikola, M. (1986,). Metsa suomalaisten elamassa (The forest as a Finnish culturalentity). Paper presented at the Multidisciplinary seminar, Finland.

125
Leopold, A. (1991). Land Pathology. In S. L. Flader and J. B. Callicott (Eds.), TheRiver of the Mother of God and Other Essays by Aldo Leopold (pp. p. 216).Madison: University of Wisconsin Press.
Leopold, A. S. (1953). The Round River. New York: Oxford University Press.
Lien, J. N., and Buhyoff, G. J. (1986). Extension of visual quality models for urbanforests. Journal of Environmental Management, 22, 245-254.
Litton, R. B. and Tetlow, J. (1974). Water and Landscape: An aesthetic overview of therole of water in the landscape. Port Washington, NY: Water InformationCenter, Inc.
MacFarland, K. K., Malm, W., and Molenar, J. (1983). An examination ofmethodologies for assessing the value of visibility. In R. D. Rowe and L. G.Chesnut (Eds.), Managing Air Quality and scenic resources at national parksand wilderness areas (pp. 314). Boulder, CO: Westview.
Magill, A. W. (1990). Assessing public concern for landscape quality: a potential modelto identify visual thresholds (Research Paper PSW-203): USDA Forest Service,
Pacific Southwest Research Station.
Magill, A. W. (1992). Managed and natural landscapes: What do people like?(Technical Report PNW-213): USDA Forest Service.
Magill, A. W. (1994). What people see in managed and natural landscapes. Journal ofForestry, 92(9), 12-16.
Malm, W., Kelley, K., Molenar, J., and Daniel, T. C. (1981). Human perception of airquality: uniform haze. Atmospheric Environment, 15(10\11), 1875-1890.
Manning, R. B. (1998). "To provide for the enjoyment": Recreation management inthe national parks. The George Wright Forum, 15(1), 6-20.
Manning, R. E., and Lime, D. W. (1995, April 10-12, 1994). Indicators and standards ofthe quality of the visitor experience at a heavily-used national park. Paperpresented at the Proceedings of the 1994 Northeastern Recreation ResearchSymposium, Saratoga Springs, NY.

Manning, R. B., Lime, D. W., Freimund, W. A., and Pitt, D. G. (1996). Crowdingnorms at frontcountry settings: A visual approach to setting standards ofquality. Leisure Sciences, 18, 39-59.
Marsh, J. (1985). Postcard landscapes: An exploration in method. The CanadianGeographer, 29(3), 263-273.
McIntyre, N. (1989). The personal meaning of participation: Enduring involvement.Journal of Leisure Research, 21(2), 167-179.
McKechnie, G. E. (1977). Simulation techniques in environmental psychology. In D.Stokols (Ed.), Perspectives on Environmental Behavior: Theory, Research andApplications (pp. 169-189). New York: Plenum.
Meining, D. W. (1976). The beholding eye: ten versions of the same scene. LandscapeArchitecture, (1), 47-54.
Mitchell, M. Y., Force, J. E., Carrol, M. S., and McLaughlin, W. J. (1993). Forestplaces of the heart: Incorporating special spaces into public management.Journal of ForestnL (April), 32-37.
Moore, R. L., and Graefe, A. R. (1994). Attachments to recreation settings: The case ofrail-trail users. Leisure Sciences, 16, 17-3 1.
Morgan, D. L. (1997). Focus groups as qualitative research. (2nd ed.). (Vol. 16).Thousand Oaks, CA: Sage Publications.
Nash, R. (1968). Wilderness and the American Mind. New Haven: Yale UniversityPress.
Nassauer, J. I. (1983). Framing the landscape in photographic simulation. Journal ofEnvironmental management, 17, 1-16.
Orland, B. (1988). Video-imaging: A powerful tool for visualization and analysis.Landscape Architecture, 78(4), 78-88.
126

127
Orland, B. (1993). Synthetic landscapes: A review of video-imaging applications inenvironmental perception research, planning, and designs. In D. Stokols and R.Marans (Eds.), Environmental Simulation: Research and Policy Issues . NewYork.
Orland, B. (1994). Visualization techniques for incorporation in forest planninggeographic information systems. Landscape and Urban Planning, 30, 83-97.
Orland, B., Daniel, T. C., and Haider, W. (1994). Calibrated images: Landscapevisualizations to meet rigorous experimental design specifications (ConferenceProceedings: Decision Support 2001). Toronto, Canada: Society forPhotogrammetry and Remote Sensing.
Orland, B., Daniel, T. C., and Thom, A. (1996). A calibrated image set forinvestigating the visual effects of forest harvest practices. University of IllinoisChampaign-Urbana: Image Systems Laboratory, Department of LandscapeArchitecture.
Outdoor Recreation Resources Review Commission. (ORRRC). (1962). NationalRecreation Survey (pp. 394). University of California: Wildland ResearchCenter.
Owens, P. E. (1988). Natural landscapes, gathering places, and prospect refuges:Characteristics of outdoor places valued by teens. Children's EnvironmentsQuarterly, 5(3), 17-24.
Pepper, S. C. (1937). Aesthetic quality: A contextualistic theory of beauty. New York:Charles Scribner's Sons.
Pettit, E. (1936). On the Color of Crater Lake water. Conference Proceedings:National Academy of Science, 22:139-146.
Pitt, D. G. (1989). The attractiveness of use of aquatic environments as outdoorrecreation places. In I. Altman and E. Zube (Eds.), Public Places and Spaces (pp.217-254). New York: Plenum.
Proshansky, H. M., Fabian, A. K., and Kaminoff, R. (1983). Place-identity: Physicalworld socialization of the self. Journal of Environmental Psychology, 3, 57-83.

Purcell, A. T., Lamb, R. J., Peron, E. M., and Falchero, S. (1994). Preference ofpreferences for landscape? Journal of Environmental Psychology, 14(3), 195-209.
Redmond, K. (1993). Climate Variability at Crater Lake National Park. In G. L.Larson, C. D. Mclntire, and R. W. Jacobs (Eds.), Crater Lake LimnologicalStudies Final Report (pp. 39-59). Corvallis, OR: Cooperative Park StudiesUnit, Oregon State University.
Relph, E.C. (1976). Place and Placelessness. London: Pion.
Rollins, R., and Chambers, D. (1990). Camper Satisfaction with Canadian Park ServiceCampgrounds. In e. J. Vining (Ed.), Social Science and Natural ResourceRecreation Management . Boulder, CO: Westview.
Rolloff, D. B., Johnson, R. J., and Shelby, B. (1996). 1995 Oregon Caves Visitor Study(Administrative Report PNW). Corvallis, OR: Oregon State University.
Rowe, R. D., and Chesnut, L. G. (1983). Managing air quality and scenic resources atnational parks and wilderness areas. Boulder, CO: Westview.
Schafer, E. L. (1967,). Forest Aesthetics: A focal point in multiple use managementand research. Paper presented at the International 14 IUFRO Congress,Munich.
Schreyer, R., and Roggenbuck, J. W. (1981). Visitor images in national parks: Theinfluence of social definitions of places on perceptions and behavior, Somerecent products of river recreation research. St. Paul, MN: USDA ForestService.
Schroeder, H. W. (1984). Environmental perception rating scales: A case for simplemethods of analysis. Environment and Behavior, 16(5), 573-598.
Schroeder, H. W. (1988). The significance of landscapes (pp. 5). Urbana-Champaign,IL: Second Symposium Society Science Research Management.
Schultze, W. D., and al, e. (1983). Economic benefits of preserving visibility innational park lands. Natural Resource Journal, 23, 149-173.
128

129
Sellars, R. W. (1997). Preserving Nature in the National Parks. New Haven, CT: YaleUniversity Press.
Shelby, B., and Harris, R. (1985). Comparing methods for determining visitorevaluations of ecological impacts: Site visits, photographs and writtendescriptions. Journal of Leisure Research, 1(1-19).
Shelby, B., and Wolf, D. W. (1981). Social Impacts of Design Alternatives at CraterLake National Park (Cooperative Park Studies Unit Report 8 1-2). Corvallis,Oregon: Oregon State University.
Sheppard, S. R. (1989). Visual simulation: A user's guide for architects, engineers, andplanners. (1st ed.). New York: Van Nostrand Reinhold.
Shindler, B., List, P., and Steel, B. S. (1993). Managing federal forests: Public attitudesin Oregon and nationwide. Journal of Forestry, 9 1(7), 36-42.
Shuttleworth. (1980). The use of photographs as an environmental presentationmedium in landscape studies. Journal of Environmental Management, 11, 61-76.
Snow, D. (1997). A Fierce Devotion. Northern Lights, 11(3), 12-15.
Stankey, G. H., Cole, D. N., Lucas, C., Peterson, M. E., and Frissell, S. S. (1985). TheLimits of Acceptable Change (LAC) system for wilderness planning. (GeneralTechnical Report 176). Ogden, UT: USDA Forest Service, IntermountainForest and Range Experiment Station.
Steckler, A., and al., e. (1992). Toward integrating qualitative and quantitativemethods: An introduction. Health Education Quarterly, 19, 1-8.
Stegner, W. E. (1989). A Sense of Place [Audio Tape]. Niwot, CO: The Audio Press.
Steinitz, C. (1990). Toward a sustainable landscape with high visual preference andhigh ecological integrity: The loop road in Acadia National Park. Landscapeand Urban Planning, 19, 213-250.

130
Stewart, T. R., Middleton, P., Downton, M., and Ely, D. (1984). Judgments ofphotographs vs. field observations in studies of perception and judgment of thevisual environment. Journal of Environmental Psychology, 4, 283-302.
Taylor, J. G., Sexton, N. R., and Czarnowski, K. J. (1995). Visitor employedphotography at Rocky Mountain National Park: A valuation technique. ParkScience, 15(1), 10-13.
Taylor, J. G., Zube, E. H., and Sell, J. L. (1987). Landscape assessment and perceptionresearch methods. In R. B. Bechtel, R. W. Marans, and W. Michelson (Eds.),Methods in Environmental and Behavior Research (pp. 361-393). New York,NY: Van Nostrand Reinhold.
Thurstone, L. L. (1927). The law of comparative judgment. Psychological Review, 34,273-286.
Tips, W. E. J., and Savasdisara, T. (1986). Landscape preference evaluation andsociocultural background: A comparison among Asian countries. Journal ofEnvironmental Management, 22, 113-124.
Torgerson, W. 5. (1958). Theory and Method of Scaling. New York: John Wiley.
Tuan, Y. (1976). Geopiety: A theme in man's attachment to nature and place. InLowenthal (Ed.), Geographies of the mind (pp. 1-39).
U.S. Department of Agriculture, F. S. (1996). Landscape Aesthetics: A handbook forscenery management. Washington DC: USDA Forest Service.
Ulrich, R. S. (1983). Aesthetic and affective responses to natural environments. In I.Altman and J. F. Wohwill (Eds.), Behavior and the Natural Environment (Vol.6, pp. 85-125). New York: Plenum.
Ulrich, R. 5. (1986). Human responses to vegetation and landscapes. Landscape andUrban Planning, 13, 29-44.
Vining, J., and Orland, B. (1989). The video advantage: A comparison of twoenvironmental representation techniques. Journal of EnvironmentalManagement, 29, 275-283.

131
Vining, J., and Stevens, J. J. (1986). The assessment of landscape quality: Majormethodological considerations. In R. C. Smardon, J. F. Palmer, and J. P.Felleman (Eds.), Foundations for Visual Project Analysis (pp. 167-186). NewYork: John Wiley and Sons.
Walker, L. and Havens, L. (1973). An evaluation of aesthetic values as related to thewater resources of the Columbia: USFS Forest Service Pacific NorthwestRegion.
Warfield, R. G., Juillerat, L., and Smith, L. (1996). Crater Lake: The Story Behind theScenery. Las Vegas: KC Publications.
Wohlwill, J. F. (1976). Environmental aesthetics: the environment as a source of affect.In I. Altman and J. F. Wohlwill (Eds.), Human Behavior and the Environment(Vol. 1,). New York: Plenum.
Wood, D. (1989). Unnatural Illusions: Some words about visual resource management.Landscape Journal, 192-205.
Zube, E. H. (1974). Cross-disciplinary and intermode agreement on the descriptionand evaluation of landscape resources. Environment and Behavior, 6(1), 69-89.
Zube, E. H. (1986). Landscape values: History, concepts, and applications. In R. C.Smardon, J. P. Palmer, and J. P. Felleman (Eds.), Foundations for VisualProject Analysis . New York: John Wiley.
Zube, E. H. (1992). Perception of landscape and land use. In I. Altman and J. F.Wohiwill (Eds.), Human Behavior and Environment . New York: Plenum.
Zube, E. H., and Pitt, D. G. (1981). Cross-cultural perceptions of scenic and heritagelandscapes. Landscape Planning, 8, 69-87.
Zube, E. H., Pitt, D. G., and Anderson, T. W. (1975). Perception and prediction ofscenic resource values in the Northeast. In E. H. Zube, R. 0. Brush, and J. G.Fabos (Eds.), Landscape Assessment: Values, Perceptions and Resources (pp.151-167). Stroudsburg, PA: Dowden, Hutchinson, and Ross, Inc.

132
Zube, E. H., Simcox, D. E., and Law, C. S. (1987). Perceptual landscape simulations:History and prospect. Landscape journal, 6(1), 62-80.
Zube, E. H., Snell, J. L., and al, e. (1982). Landscape perception: Research, application,theory. Landscape Planning, 9, 1-33.

APPENDICES
133

Appendix A:VISITOR CENTER SCENIC PREFERENCE SURVEY
N = 960
134

Oregon State UniversityCRATER LAKE NATIONAL PARK
SCENIC SURVEYPART ONE
For each set of slides, please tell us two things:
If you see a difference between the views shown (check lone box).Which view you prefer personally by marking / in the corresponding box.
7.
First Second
NO YES
Which do you prefer?
135
SlideSet Is there a Strongly Strongly
difference to prefer the Prefer the No Prefer the prefer the
you? left left Preference right right

PART TWOHave you been to Crater Lake National Park before this visit? (check lone)
66% No34% Yes
'-*if yes, please indicate how many times you've been to CraterLake before this visit51.1% Once before18.7% 2 times20.3% 3-5 times4.8% 6-10 times5.1% 10 or more times What year was your first visit? 19_
The following frequencies are the breakdown of the 34% who reported visiting Crater Lakepreviously.
1922-1929 1930-1939 1940-1949 1950-1959 1960-1969 1970-1979 1980-1989 1990-1996
1.8% 2.2% 6.5% 9.8% 27.7% 17.3% 16.1% 18.6%
Have you ever been up to the rim to see Crater Lake itself?57% Yes43% No
Have you taken the boat tour on Crater Lake? (check lone)11.3% Yes88.7% No
Do you plan to take the boat tour on Crater Lake? (check lone)22.7% Yes49.7% No27.6% Unsure
Have you attended an interpretive presentation (other than the video) atCrater Lake? (check lone)
22.4% Yes77.6% No
Do you plan to attend such an interpretive presentation on your visit toCrater Lake? (check lone)
40.5% Yes24.5% No35% Unsure
136

7. The lake level of Crater Lake fluctuates naturally. It is also possible thathuman activities in and surrounding the park could affect Crater Lake waterlevels.
Please state whether you think lowering the lake level is or is not appropriatefor each of the following activities.
Circle the number that reflects your level of disagreement or agreement witheach statement. If you haven't thought about it much, circle Don't Know (DK).
Statement
It is appropriate to lower the lake levelin Crater Lake for humanpurposes
It is not appropriate to lower the lakelevel in Crater Lake for Park visitoruse
It is appropriate to lower the lake levelin Crater Lake to increase municipalwater supplies
It is not appropriate to lower the lakelevel in Crater Lake for agriculturaluse
it is appropriate to lower the lake levelin Crater Lake to make use ofgeothermal resources
It is appropriate to lower the lake levelin Crater Lake to increase domesticwater supplies
It is not appropriate to lower the lakelevel in Crater Lake to develophydropower resources
It is appropriate to lower the lake levelin Crater Lake for industrialuse
It is not appropriate to lower theinvited lake level in Crater Lake forcommercial use
Level of Disagreement or Agreement
137
StronglyDisagree Disagree Neutral Agree
StronglyAgree
DonKnow
51% 26.9% 7.6% 6.1% 1.4% 7.1%
3.7% 7.3% 6.5% 29.7% 46.9% 5.9%
45.8% 26.3% 8.8% 9.5% 1.7% 7.8%
4.9% 8.8% 8.3% 26.9% 44.5% 6.6%
37 9oi 24 7°' 12.8% 10.4% 2.2% 12%
29.9% 9.2% 9.7% 4.1% 6.6%
5.6% 6.5% 8% 22.6% 49.8% 7.6%
67.6% 19.3% 2.7% 2.4% 4.2% 3.8%
8.2% 3.9% 2.3% 20.6% 61.7% 3.3%

While answering the following questions, please remember that yourresponses are confidential.
How far do you live* from Crater Lake National Park?Range: 10 -3000 milesAverage: 1105 miles
*foreign visitors were not included in this measureIs Crater Lake the primary destination of your trip? (check lone)
35% Yes65% No
What is your gender? (check lone)54% Female46% Male
What is your age? years.Average: 49.5 yearsRange: 18 -89 years
What is the highest level of education you have completed?(check lone)1% Less than 9th grade3% 9th to 12th grade, no diploma8.8% High school graduate (or equivalent)22.3% Some college6.8% Associate degree21.5% Bachelor's degree11.1% Some graduate school, no degree25.5% Completed graduate or professional degree
138
6. Into what group does your total household income fall? (before taxes)(check lone)
5.7% Less than $15,0007.4% $15,000 to $24,9994.8% $25,000 to $29,9998.8% $30,000 to $34,99921.7% $35,000 to $49,99925.4% $50,000 to $74,99911.7% $75,000 to $99,99914.6% $100,000 or more

7. In what size of community did you grow up? (check lone)13.2% farm or rural area4.4% semi-rural12.6% small town (under 5,000 people)24.5% small city (5,000-50,000 people).9% suburb of large city17.8% city (more than 50,000 but less than I million)12.6% large city (over I million people)
8. What size7.3%
5.9%
8.7%
25.6%
20.7%
22.5%
9.3%
of community do you live in presently? (check lone)farm or rural areasemi-ruralsmall town (under 5,000 people)small city (5,000-50,000 people)suburb of large citycity (more than 50,000 but less than I million)large city (over I million people)
9. At the end of the summer, we will be continuing this study with a brief mailsurvey. Please provide us with your address in the spaces provided. Youraddress will only be used for this important mail follow-up.
89% of the survey participants complied with this request for theiraddresses
95.9% of participants reported addresses in the United States4.1% reported living outside the U.S.
Your nameStreetCity State__ Zip Code
.+lf not in the U.S., what is your home country?
ADDITIONAL COMMENTS:
THANK YOUFOR YOUR TIME WITH OUR SURVEYT
Dr. Rebecca JohnsonDavid Rolloff
Forest Resources DepartmentOREGON STATE UNIVERSITY
139

Appendix B: RIM VILLAGE SAMPLE SURVEYN = 210
140

OREGON STATE UNIVERSITY
CRATER LAKE NATIONAL PARK VISITOR SURVEY
Your responses are confidential and only for use in this visitor study.
Have you visited Crater Lake National Park before this visit?40% Yes 60% No
Have you been to the Visitor Center (at Park Headquarters) or do you plan ongoing as part of your visit?
65.8% Yes 13.8% No 20.4% Unsure
How far do you live* from Crater Lake National Park?Range: 60 - 3000 milesAverage: 836 miles
*foreign visitors were not included in this measure
Is Crater Lake the primary destination of your trip? (check tone)39.6% Yes 60.4% No
What is your gender? (check tone)52% Female 48% Male
What is your age? yearsAverage: 46 yearsRange: 18 -82 years
What is the highest level of education you have completed? (check tone)0.5% Less than 9th grade4.3% 9th to 12th grade, no diploma
17.1% High school graduate (or equivalent)20.4% Some college
5.7% Associate degree17.5% Bachelor's degree9% Some graduate school, no degree
25.6% Completed graduate or professional degree
141

Into what group does your total household income fall? (before taxes)Mode: $50,000 to $74,999
Please provide the following information about where you live.91.8% of participants reported addresses in the United States8.2% reported living outside the U.S.
City State__ Zip Code
'lf not in the U.S., what is your home country?
THANK YOU FOR YOUR TIME WITH OUR SURVEY!Dr. Rebecca Johnson David Rolloff
OREGON STATE UNIVERSITY
142
6.3% Less than $15,000 23.4% $35,000 to $49,9997.8% $15,000 to $24,999 26% $50,000 to $74,9992.6% $25,000 to $29,999 16.7% $75,000 to $99,9996.3% $30,000 to $34,999 10.9% $100,000 or more

Appendix C: VISITOR SURVEY INSTRUCTIONS
143

The following is the text used by the research assistant during the scenicpreference survey conducted at the Visitor Center. Bold type indicates whatwas read to visitors.
Introduction:
Good morning/afternoon. My name is David Rolloff and I'm a grad studentat Oregon State University. OSU and the National Park Service areworking together this summer to gather information from Crater Lakevisitors like yourselves. Information gained from visitors is important tothe future management of the park resource, and we appreciate yourtaking time with this survey. The survey consists of two parts and takes atotal of about 15-20 minutes.
It's important to us that you know all information you provide in thesurvey is strictly confidential, all your answers are voluntary, and will onlybe used for the purposes of this study. There are a few other importantthings to remember when completing our survey:
First, there are no right or wrong answers. This is not a test. I just wantyour opinions, regardless of what anyone else thinks.
Second, please answer all of the questions. If you want to make anycomments, do so in the margins or on the last page of the survey. Yourcomments are important to me and I do pay attention to them.
Okay, lets begin with Part One--the slides.
All of the slides you're going to be shown are of Crater Lake. I want tofind out what aspects of scenic beauty people prefer the most when theycome to see Crater Lake. **
Treatment 2: Some of these slides are depictions of varying changes in the levels ofthe lake Some of the changes reflect larger drops in the level of Crater Lake thanothers.Treatment 3: Some of these slides are depictions of what the lake might look likewith natural variations in the level of Crater Lake. Some of the changes reflectlarger drops in the lake level than others.Treatment 4: Some of these slides are depictions of what the lake might look like ifhumans used the water in Crater Lake. Some of the changes reflect larger drops inthe lake levels than others.
144

145
For each pair of slides, I need you to do two things: First tell me if yousee a difference between the two views. Then continue by telling me ifyou prefer one view over the other--whether you strongly prefer the left,prefer the left, have no preference, prefer the right, or strongly prefer theright. When deciding which slide you prefer, please be sure to payattention to the view depicted in the slide, not the quality of the slideitself.
There are 24 pairs of slides in this survey, and each set will be shown forPreferences 20 seconds. So that you don't have to worry about keepingtrack of which slide, I will announce the number of each one when theychange.
When slides are finished:That's it for the slides. Now I have one follow-up question, which is at thetop of page 2. For those of you who did not have a preference for the lastset, check the last item in Part Two just above the beginning of "Section3."
For those of you who did have a preference, I'd like to know how strongyour preference is. For example, these views may occur in differentseasons. Crater Lake National Park may also charge different fees indifferent seasons. If it cost you dollars per person in addition to thepark entrance fee to experience your preferred view than to experiencethe other one, would you be willing to pay this amount? After you haveindicated yes or no, briefly explain your reason for that response.
Conclusion:
Then continue with the rest of the questions on the survey. Rememberthe information you give is completely confidential. When you're finished,hand your survey and clipboard to me. On your way out, remember totake a book home with you.
Thanks again for your time and I hope you enjoy your visit to Crater Lake.

Appendix D: SLIDE IMAGES
146

Figure D. 1. View 1 Level 1. Rim Village, average level.
Figure D.2. View 1 Level 2. Rim Village, -25 feet.

Figure D.3. View 1 Level 3. Rim Village, -75 feet.
Figure D.4. View 1 Level 4. Rim Village, -125 feet.

Figure D.5. View 2 Level 1. Discovery Point, average level.
Figure D.6. View 2 Level 2. Discovery Point, -25 feet,
149

I 50
Figure D7. View 2 Level 3. Discovery Point, -75 feet.
Figure D.8. View 2 Level 4. Discovery Point, -125 feet.

Ir
Figure D.9. View 3 Level 1. Merriam Point, average level.
Figure D. 10. View 3 Level 2. Merriam Point, -25 feet.

Figure D. 11. View 3 Level 3. Merriam Point, -75 feet..
Figure D.12. View 3 Level 4. Merriam Point, -125 feet.

153
Figure D.13. Information Treatments 3 and 4. Example of labelfor average lake level.
Figure D. 14. Information Treatment 3. Example of naturalvariation label.

154

APPENDIX E: GROUP INTERVIEW INSTRUCTIONS
155

GROUP INTERVIEW GUIDE
Text in bold indicates what is read to visitors participating in the study.Questions asked of participants are denoted by bullets, and are in boldface, also.
STUDY INTRODUCTION: A brief explanation of the research project.
Good morning/afternoon. My name is David Rolloff and I'm a gradstudent in Forest Resources at Oregon State University. I'm working on aresearch project this season to gather information from Crater Lake visitorslike yourselves. Information gained from park visitors is part of the workI'm doing for my doctoral dissertation, which concerns scenic resources inCrater Lake National Park. I appreciate your taking time with this surveyand your help with my research. This group interview consists of two partsand takes a total of about 20-30 minutes.
It's important that you know all information you provide in the survey isstrictly anonymous, confidential, and that all your comments are voluntary.The information gained in this study will be used for my research, and forpark managers.
Please remember that there are no right or wrong answers to what we'retalking about. This is not a test, it is a discussion, so anything you feel likesaying is valuable! I just want your opinions, regardless of what anyone elsethinks. Let me know what comes to mind while we're talking and don'thesitate to ask questions.
This study will consist of two parts: First, I'm going to show you someslides of Crater Lake, and we'll visit about your impressions of the views inthe slides. Second, I'm going to ask you questions relating to the use ofresources here in Crater Lake National Park.
PARTICIPANT INTRODUCTIONS:Each visitor will introduce themselves individually & tell a bit about themselves:
What is your first name?Where are you from?Have you been to Crater Lake before?What are some of the main reasons you came to Crater Lake
National Park?
156

III. SCENIC PERCEPTION: The Slide Portion
Now I'm going to show you some slide views of Crater Lake. I want to findout what aspects of scenic beauty people prefer the most when they come tosee the lake. For each pair of slides, I would like you to write down threethings about what you're seeing.
Point to flip chart with the three questions:First, do the views look the same? If you think they're different, what isthe difference? And last, indicate if you prefer one view over the other.
There are 20 pairs of slides in this survey, and each set will be shown for 20seconds.
When slides are finished:That's it for the slides. Now I have some questions about what you saw.
Explore the following areas allowing for any responses to surface in the group beforeproceeding to the next questions:
Tell me about what you saw in the slides.Could you tell any differences between the two views? If so, what
did you see?What lake level do you think I was trying to show you in these
slides?I used slides from three viewpoints. Did you prefer one of the three
viewpoints shown in the slides more than another?If so, why?
Do you think my directions could have guided you in any waytoward looking at a specific part of the slide views?
Were there any other elements which may have influenced yourimpressions of the slides--e.g. slide quality, seating position in the room,perceived differences in slide color?
Once responses have subsided:The only thing that varied in the views you were shown was the level of thelake. I created these different levels on a computer--the lake level varies around4 feet a year, not as much as in these images. Don't feel bad if you think yousaw other differences! People "see" many different things in these images, andthat's partly what these group sessions are for--to discover more of what peoplesee in these views of the lake.
157

158
Some of the images you were shown depicted a "normal" lake while others werecomputer manipulated to depict drops of 25, 75, and 125 feet.
Did you notice those changes?Would you have estimated, based on these numbers, that this was
the magnitude of the change in feet?Now that you know about what was happening in the slides, do you
have any comments about the views? Have your impressions changedwith this knowledge?
What do you think might cause such a drop in the levels of the lake?If you were told that the reason the lake level was dropping in these
levels was because of "natural variation" what would your reactions be?Now if you were told that the reason the lake level was dropping
was because of human use of the lake water, what would your reactionsbe?
Key Question: Let's say that you need to make a decision of whether or not itwould be appropriate to lower the lake levels starting in 1998. What would yourdecision be?
Probe for reasons why, why not appropriate.
IV. POTENTIAL HUMAN USES OF CRATER LAKE WATER.Exploration of natural and human-caused situations which could contribute to alowering of the lake level in Crater Lake. Note differences in reasoning betweennatural variation and human variation.
The lake level of Crater Lake fluctuates naturally. Theoretically, it is alsopossible that human activities in and surrounding the park could affect CraterLake water levels. Do you think lowering the level of Crater Lake for humanpurposes would be appropriate? Why or why not?
Presently, the water in the lake is only used to view as a scenic resource, but whatother uses could be made of the water? List those that people think of oneraserboard.

There could also be more specific uses of the water and I'd like to hear whatyou think about the appropriateness of using Crater Lake water for thesepurposes:
Record visitor reaction to the following:
If you are opposed to these uses, is there ever a time you would find such a useappropriate?
If you support any of these uses, is there ever a time you would find such a useinappropriate?
Key Question: If you found out that Crater Lake water was used for purposessuch as those above, how do you think this information would affect how youviewed the lake?
VI. CONCLUSION:
That's it for my questions. Thank you participating in my study. Before you go,I would like to explain that there currently are no plans to lower the lake level inCrater Lake for human purposes. Future policy and legal issues regarding thestatus of the water resource in Crater Lake have raised questions about whatpeople value most about the scenery here in the park. As part of my graduateresearch, I'm studying park visitors' values to gain an understanding about howvisitors feel about potential futures of the lake.
Do you have any remaining questions or comments?
Again, thanks for your time and I hope you have a good visit here at Crater Lake.
159
1. Park visitor use 5. Domestic water supplies2. Municipal water supplies 6. Hydropower resource3. Agricultural use development4. Geothermal resource 7. Industrial use
development 8. Commercial use

APPENDIX F: GROUP INTERVIEW SURVEY FORM
160

Oregon State UniversityCRATER LAKE NATIONAL PARK
SCENIC SURVEY
161

APPENDIX G: RESULTS FROM THE PSCORE ANALYSIS
162

163
Participants Preferences for Crater Lake Levels
In the visual portion of the study, one objective beyond investigatin whether
or not participants could detect a difference between the two slides in each slide pair
was to elicit participants' preferences for lake views. This appendix explores
participants' preferences for views of Crater Lake in terms of their ratings on the
preference score, or Pscore, test statistic.
The Agreement Statistics: Results from the preference score. While the first
part of each paired slide comparison asked visitors if they saw a difference, the second
part asked participants to indicate whether they had a preference for the right or left
slide. Exploring participants' preferences for lake views was the focus of the next
experimental hypothesis.
Calculation of the summary agreement score for preference, or Pscore involved
the same procedure as for the Dscore. Similar to the Dscore, it was necessary to define
an expected score for an ideal participant who consistently preferred the higher lake
levels (or closer to normal) as opposed to preferences for views depicting lowered lake
levels. Because there were only 2 views presented at once, the expected preference
score consisted of either 1 or 2, reflecting participants' preference for one view over
the other.

The Pscore was calculated in the following manner:
DE = (observed # in cell - expected preference # in cell)2over all cells
To obtain the participant's relative departure from expected preferences follows as
RDE = DE/284
and then the RDE is converted to the agreement statistic indicating the participant's
preferences for lake levels
Pscore, = 1 - RDE
In order to investigate whether a participant's preference score is dependent on
the information they received about the slide views, effects of the 5 information
treatments were explored using analysis of variance (ANOVA) for nested factorial
designs for the hypothesis. Results have been included in Tables G. 1 and G.2.
From the analysis of variance, it was determined that a nesting effect resulted
from the fact that the variation between individuals within a session was different
than variation between sessions within a treatment. Therefore, in testing the above
hypothesis, it was necessary to specify the error term associated with session within
treatment in the model to avoid potential false positives associated with using the
mean squares from the error line of the analysis of variance table below.
164

Table G.1. Analysis of Variance Table for Preference Scores.
< .0001
Results of the analysis of variance suggest evidence of a treatment effect on
participants' preferences for slide views (F = 13.16, p = .0001). Similar to differences
between treatment groups for the difference statistic, this implies that the means of at
least two of the five groups in the informational treatments are not equal for the
preference part of the experiment. Mean agreement scores for the Pscore, their
standard errors, as well as the 95% confidence intervals have been included in Table
G.2. Least squares means for the Pscores close to 1 for each treatment imply that
participants tended to prefer the slide views with higher water levels. Once again,
even the Pscores associated with the no information treatment group (Treatment 1)
tended to score in agreement with what would be expected if participants always
preferred the higher levels of water.
Table G.2. Mean Preference Scores for the 5 Treatment Groups.
165
Treatment Pscore LSMean Std Err LSMean 95% Confidence Interval
1 0.818 0.0059 0.806 0.830
2 0.845 0.0065 0.832 0.858
3 0.864 0.0080 0.848 0.880
4 0.884 0.0087 0.867 0.910
5 0.864 0.0072 0.850 0.878
Source df SS MS F
Treatment 30 0.46 0.114 13.16*
Session(treatment) 4 0.78 0.026 2.99*
Error 1135 9.88 0.009Total 1169 11.19

166
Further Exploration of Information Effects on the Pscore. Specific sources of
variation between the five treatment groups were explored using combinations
between the different treatment groups. Table G.3 contains results from the analysis
of variance for group comparisons as they corresponded to treatment groups. Recall
that the a reference table for the treatment groups was provided in Table 3.3.
When participants' preferences for slide views are the focus of analysis,
statistically significant differences are more prevalent between treatment groups. In
the analysis of the difference scores, the explanation for the mean differences between
group was primarily found in the effect of treatment group 5 when compared to other
treatments.
Table G.3. Contrast Table for Treatment Comparisons Relating to the Pscore
< .05 **p < .01 *** < .0001
Comparison df MS F pTi vs. T2 1 0.082 9.45' .002
Ti vs. T3 1 0.187 2i.44** .0001
Ti vs. T4 1 0.351 40.20*** .0001Ti vs. T5 1 0.213 24.5O' .0001
T2 vs. T3 and T4 1 0.096 ii.04 .0009
T3 vs. T4 1 0.027 3.10 .079
Ti vs. T3 and T4 1 0.396 455Q* .0001
T4 vs. T5 1 0.029 3.36 .067T5 vs. all others 1 0.016 1.89 .169
T2 vs. T5 1 0.033 3.81* .05
Ti vs. all others 1 0.379 4354* .0001

167
In the analysis of the preference scores, the no information treatment
(group 1) seems to be the most influential treatment in the ANOVA. When
Treatment 1 is contrasted with 2, there is highly suggestive evidence of a difference (F
= 9.45, p = .002). Additional comparisons of 1 with Treatment 3 (F = 21.44, p =
.0001), Treatment 4 (F = 40.20, p = .0001) and Treatment 5 (F = 24.50, p = .0001) all
show significant differences. When Treatment 1 is contrasted with 3 and 4 together,
there is further evidence of a significant difference (F = 45.5, p = .0001). As well,
when treatment 1 is compared with all others there is more evidence of a treatment
effect (F = 43.54, p = .000 1).
Other contrasts between treatment groups showed evidence of significant
differences. When the verbal information treatment (group 2) was contrasted with
slide text information treatments (groups 3 and 4), there was evidence of a difference
in group means (F = 11.04, p = .0009). There was also evidence of a difference
between group 2 and group 5 (F = 3.81, p = .05).
Modeling Participants' Visual Preferences. Table G.4 contains the results from
the ANOVA on the Pscore. There is evidence of an informational treatment effect (F
= 9.53, p = 0.0001) but there is also evidence of an effect for treatment nested within
session (F = 8.27, p = 0.0001). Additionally, there was a statistically significant
indication of an association between the participant's Pscore with their trip

Table GA. Final Model on the Pscore.
168
< .05 < .001 < .0001
characteristics and a number of attitudes toward use of the lake water. There was no
indication of an association between the Pscore and any of the demographic variables.
Regarding the significant effect of the nested variables of session and treatment,
the significance of the difference in variation between the treatment and the variation
between sessions implies that the relative contribution among individual sessions does
not vary consistently for each treatment in the study. An explanation for this
inconsistency is difficult to pinpoint, given that the same researcher presented the
study in the same location using a script for presentation. The technical presentation
of the slides (set-up of projectors) or even the seating arrangements of participants may
be possible explanations. Nonetheless, the factorial design of this model makes it
possible to idenfity several sources of variability in this study.
Variable df SS MS F pModel 17 0.908 0.533 5.60 .0001
Error 541 5.161 0.009Corrected Total 558 6.069
Variable df SS MS F pTreatment 3 0.273 0.910 9.53 .0001
Session(treatment) 4 0.3 16 0.079 8.27 .0001
Destination 6 0.124 0.021 2.17 .0449
Human Use 1 0.104 0.104 10.86 .0010
Agricultural Use 1 0.039 0.039 4.13 .0427Industrial Use 1 0.046 0.046 4.79 .0291

169
After accounting for differences due to information exposure, the nested
nature of the variable session (treatment) , and visitors' final destination, there is an
association between participants' Pscore and whether or not Crater Lake was the
destination of participants' trip (F = 2.17, p = .05). Evidence also suggests an
association between their attitudes toward potential uses of Crater Lake water. The
relationship between participants' preference for higher lake levels and their attitudes
toward lowering lake levels for human use is statistically significant (F = 10.86, p
= 0.001). Similarly, there is also evidence of an association between the Pscore and
participants' attitudes toward agricultural use (F = 4.13, p = 0.04) and industrial use
of Crater Lake water (F = 4.79, p = 0.03).