Embed Size (px)
Citation preview

AmRest Holdings SE Capital Group
Report for the 1st half of 2017
September 14th, 2017
I- 1
AmRest Holdings SE Report for the 1st half of 2017
PART I
Management Board's Report
Contents:
1. Selected Financial and Operating Results – Summary I-2
2. Company Business Overview I-5
3. Management and Supervisory Board members as at 30.06.2017 I-7
4. Information relevant for the evaluation of human resources, financial situation and financial results
of the Company I-8
5. Planned investment activities and assessment of their feasibility I-19
6. External and internal factors which are significant to the Company's development in 2017 I-20
7. Basic risks and threats to which the Company is exposed I-21
8. Management representations I-25

I- 2
1. Selected Financial and Operating Results 30.06.2017 – Summary
CHART 1 THE AMREST SALES VALUE IN THE FIRST HALVES OF THE YEARS 2015-2017
(PLN ‘000)
CHART 2 EBITDA IN THE FIRST HALF OF THE YEARS 2015-2017 (PLN ‘000)
0
500 000
1 000 000
1 500 000
2 000 000
2 500 000
H1 2015 H1 2016 H1 2017
1 559 675
1 835 276
2 390 542 Increase in sales +53%
0
50 000
100 000
150 000
200 000
250 000
300 000
H1 2015 H1 2016 H1 2017
197 987
243 165
266 013
Increase of EBITDA 34%

I- 3
CHART 3 NUMBER OF RESTAURANTS AT THE END OF THE FIRST HALVES OF THE YEARS
2015-2017
CHART 4 NUMBER OF AMREST RESTAURANTS BROKEN DOWN BY BRANDS, AS AT THE END OF THE
FIRST HALF OF 2017*
0
200
400
600
800
1000
1200
1400
H1 2015 H1 2016 H1 2017
851
1 082
1 355Increase of 504 stores
* Including restaurants operated by franchisees of La Tagliatella and Pizza Hut brands.
KFC 547
Pizza Hut 224
Starbucks 277
Burger King 45
La Tagliatella 219
Blue Frog 39 KABB 4
* Including restaurants operated by franchisees of La Tagliatella and Pizza Hut brand

I- 4
CHART 5 NUMBER OF AMREST RESTAURANTS BROKEN DOWN BY COUNTRIES, AS AT THE END OF
THE FIRST HALF OF 2017*
Spain 253
France 132
Germany 156
Portugal 1
China 43
Poland 399
Czech Republic
118
Hungary 69
Russia 128
Slovakia 3
Romania 30
Bulgaria 11Serbia 6
Croatia 7
* Including restaurants operated by franchisees of La Tagliatella and Pizza Hut brand
I- 5
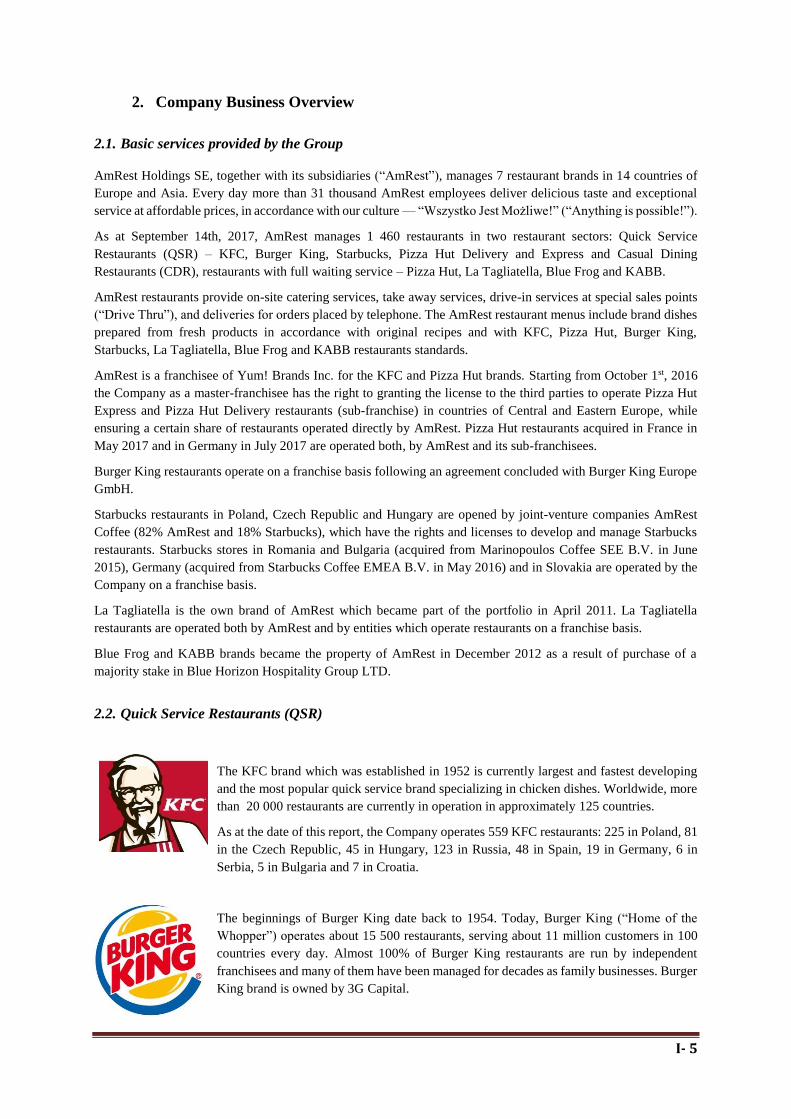
2. Company Business Overview
2.1. Basic services provided by the Group
AmRest Holdings SE, together with its subsidiaries (“AmRest”), manages 7 restaurant brands in 14 countries of
Europe and Asia. Every day more than 31 thousand AmRest employees deliver delicious taste and exceptional
service at affordable prices, in accordance with our culture — “Wszystko Jest Możliwe!” (“Anything is possible!”).
As at September 14th, 2017, AmRest manages 1 460 restaurants in two restaurant sectors: Quick Service
Restaurants (QSR) – KFC, Burger King, Starbucks, Pizza Hut Delivery and Express and Casual Dining
Restaurants (CDR), restaurants with full waiting service – Pizza Hut, La Tagliatella, Blue Frog and KABB.
AmRest restaurants provide on-site catering services, take away services, drive-in services at special sales points
(“Drive Thru”), and deliveries for orders placed by telephone. The AmRest restaurant menus include brand dishes
prepared from fresh products in accordance with original recipes and with KFC, Pizza Hut, Burger King,
Starbucks, La Tagliatella, Blue Frog and KABB restaurants standards.
AmRest is a franchisee of Yum! Brands Inc. for the KFC and Pizza Hut brands. Starting from October 1st, 2016
the Company as a master-franchisee has the right to granting the license to the third parties to operate Pizza Hut
Express and Pizza Hut Delivery restaurants (sub-franchise) in countries of Central and Eastern Europe, while
ensuring a certain share of restaurants operated directly by AmRest. Pizza Hut restaurants acquired in France in
May 2017 and in Germany in July 2017 are operated both, by AmRest and its sub-franchisees.
Burger King restaurants operate on a franchise basis following an agreement concluded with Burger King Europe
GmbH.
Starbucks restaurants in Poland, Czech Republic and Hungary are opened by joint-venture companies AmRest
Coffee (82% AmRest and 18% Starbucks), which have the rights and licenses to develop and manage Starbucks
restaurants. Starbucks stores in Romania and Bulgaria (acquired from Marinopoulos Coffee SEE B.V. in June
2015), Germany (acquired from Starbucks Coffee EMEA B.V. in May 2016) and in Slovakia are operated by the
Company on a franchise basis.
La Tagliatella is the own brand of AmRest which became part of the portfolio in April 2011. La Tagliatella
restaurants are operated both by AmRest and by entities which operate restaurants on a franchise basis.
Blue Frog and KABB brands became the property of AmRest in December 2012 as a result of purchase of a
majority stake in Blue Horizon Hospitality Group LTD.
2.2. Quick Service Restaurants (QSR)
The KFC brand which was established in 1952 is currently largest and fastest developing
and the most popular quick service brand specializing in chicken dishes. Worldwide, more
than 20 000 restaurants are currently in operation in approximately 125 countries.
As at the date of this report, the Company operates 559 KFC restaurants: 225 in Poland, 81
in the Czech Republic, 45 in Hungary, 123 in Russia, 48 in Spain, 19 in Germany, 6 in
Serbia, 5 in Bulgaria and 7 in Croatia.
The beginnings of Burger King date back to 1954. Today, Burger King (“Home of the
Whopper”) operates about 15 500 restaurants, serving about 11 million customers in 100
countries every day. Almost 100% of Burger King restaurants are run by independent
franchisees and many of them have been managed for decades as family businesses. Burger
King brand is owned by 3G Capital.

I- 6
As of the day of this report, AmRest operates the total of 47 Burger King restaurants – 37
in Poland, 9 in the Czech Republic and 1 in Bulgaria.
Starbucks is the world leader in the coffee sector with about 26 000 stores in 75 countries.
It offers a broad selection of coffees from different parts of the world, as well as teas, soft
drinks and a wide range of fresh snacks and desserts. The store designs and their
atmosphere refer to the coffee heritage and reflect the culture of the neighbourhood.
As at the day of publication of this report, AmRest Coffee operates 282 stores (57 in Poland,
30 in the Czech Republic, 17 in Hungary, 31 in Romania, 6 in Bulgaria, 138 in Germany and 3 in Slovakia).
2.3. Restaurants in the Casual Dining Restaurants (CDR) segment
La Tagliatella arose from the experience of more than two decades of
specialization in the traditional cuisine of the regions of El Piemonte, La Liguria
and La Reggio Emilia. Over the past year the brand has entertained more than
9 million customers, who delighted in the most authentic flavours of Italian cuisine.
Currently, AmRest operates 222 La Tagliatella restaurants — 211 in Spain, 9 in France and 2 in Germany.
Pizza Hut is one of the largest casual dining restaurant chains in Europe. Inspired by the
Mediterranean cuisine, it promotes the idea of having a good time while enjoying a meal
together with family and friends. It is also the biggest brand in the Polish casual dining
segment in terms of sales and the number of transactions. Pizza Hut’s strong position results
from consistently implemented “Pizza and much more!” strategy which assumes extending
the brand’s offer by adding new categories such as pastas, salads, desserts and starters while
retaining the position of a leader and “pizza expert”.
As at the day of publication of this report, Pizza Hut operates 304 restaurants – 93 in Poland, 9 in Russia and 7 in
Hungary, 124 in France and 71 in Germany.
Inclusion of the Blue Horizon Hospitality Group to AmRest structure in 2012 enriched
the CDR segment brand portfolio with two new positions operating in the Chinese
market.
Blue Frog Bar & Grill — restaurants serving grilled dishes from the American
cuisine in a nice atmosphere.
KABB Bistro Bar — premium segment restaurant, serving “western cuisine”
dishes and a wide selection of wines and drinks.
As at the day of publication of this report AmRest operates 40 Blue Frog and 4 KABB restaurants.

I- 7
3. Management and Supervisory Board members as at 30.06.2017
Management Board:
Drew O’Malley (June 30th, 2017 was the last day on the position of the Management Board member)
Jacek Trybuchowski (reappointment effective from June 30th, 2017)
Mark Chandler
Oksana Staniszewska
Olgierd Danielewicz
Wojciech Mroczyński
As at the day of publication of this report, the composition of the Management Board is as follows:
Jacek Trybuchowski
Mark Chandler
Oksana Staniszewska
Olgierd Danielewicz
Wojciech Mroczyński
Supervisory Board:
Henry Joseph McGovern
José Parés Gutiérrez – Chairman
Luis Miguel Álvarez Pérez
Carlos Fernández González
Steven Kent Winegar Clark
Pablo Castilla Reparaz
Mustafa Ogretici
As at the day of publication of this report, the above list reflects the current composition of the Supervisory Board.

I- 8
4. Information relevant for the evaluation of human resources, financial situation
and financial results of the Company
4.1. Significant staff changes
In the period since the publication of last report (the report for the first quarter of 2017 published on May 18th,
2017) below changes occurred as regards to the composition of the Management Board:
On May 17th, 2017 the Management Board of AmRest informed that on May 16th, 2017 the Supervisory Board
of the Company adopted a resolutions on reappointing Mr. Jacek Trybuchowski to hold the position of AmRest’s
Management Board Member. The resolution came into force on June 30th, 2017. Mr. Jacek Trybuchowski had
previously acted as member of AmRest’s Management Board till February 1st, 2017.
Mr. Trybuchowski graduated from University of Szczecin, with master degree in Management and Marketing.
Additionally, he studied at West Pomeranian Business School in Szczecin, achieving Bachelor’s degree in
International Trade.
He started his career at AmRest in 1993, as a student. During past 24 years Mr. Trybuchowski held numerous
positions at the Company, ranging from Assistant Manager and General Manager of Pizza Hut, Area Coach of
Pizza Hut and KFC, through Supply Director, Align Manager, P&A Manger, Pizza Hut Brand President to Country
Manager for Hungary, New Markets Director, Mergers & Acquisition Director, Russia Division President and -
currently - Chief Operations Officer. In 2004-2015 he was involved in Russian market. Mr. Trybuchowski actively
acts as a Board Member of AmRest Sp. z o.o. He is also a Member of the Board of Directors of Blue Horizon
Group (AmRest China).
Between 2003 and 2005 he worked for Yum!, primarily in Europe and then became Operational Director of
Rostik/KFC in Russia.
Mr. Trybuchowski informed that he was not conducting other activities which are competitive in relation to the
issuer, and was not engaged in a competitive company or partnership, as a partner in a civil-law or general
partnership or as a member of a governing body of an incorporated company or any other competitive legal person.
Mr. Trybuchowski is not listed in the Insolvent Debtor Register kept in accordance of the Law on National Court
Register.
On May 19th, 2017 the Management Board of AmRest informed that it received on the same day from Mr. Drew
O’Malley the resignation from the function of the member of AmRest Management Board, effective June 30th,
2017. The resignation was due to personal reasons. Mr. O’Malley served as the Company's Chief Operating
Officer.

I- 9
4.2. Financial position of the Company
TABLE 1 KEY FINANCIAL DATA OF AMREST (FIRST HALVES OF 2015–2017)
PLN ’000, unless stated otherwise Jun 30th, 2017 Jun 30th, 2016 Jun 30th, 2015
Sales revenue 2 390 541 1 835 276 1 559 675
Operating profit before depreciation and amortization (EBITDA) 266 013 243 165 197 987
Operating margin before depreciation and amortization (EBITDA margin) 11.1% 13.2% 12.7%
Adjusted operating profit before depreciation and amortization (adjusted
EBITDA)* 283 182 253 286 216 048
Adjusted operating margin before depreciation and amortization (adjusted
EBITDA margin)* 11.8% 13.8% 13.9%
Operating profit (EBIT) 102 107 109 941 88 926
Operating margin (EBIT margin) 4.3% 6.0% 5.7%
Net profit (attributable to AmRest shareholders) 53 615 76 019 52 977
Net margin 2.2% 4.1% 3.4%
Equity 1 263 850 1 260 846 1 038 090
Return on equity (ROE) 4.2% 6.0% 5.1%
Total assets 3 532 034 3 238 383 2 706 231
Return on assets (ROA) 1.5% 2.3% 2.0%
* Amounts net of one-off costs of new openings (start-up), costs of mergers and acquisitions (all material expenses connected
with successful acquisition covering professional services (legal, financial, other) directly connected with transaction.) ,
corrections in indirect taxes and the effect of SOP exercise method modification (difference in accounting cost of employee
benefits accounted under cash settled versus equity settled option plan).
Definitions:
Operating margin before amortization and depreciation – operating profit before amortization and depreciation
(EBITDA) to sales;
Operating margin – operating profit to sales;
Net margin – net profit attributable to AmRest shareholders to sales;
Return on equity (ROE) — net profit to equity;
Return on assets (ROA) — net profit to total assets;
I- 10
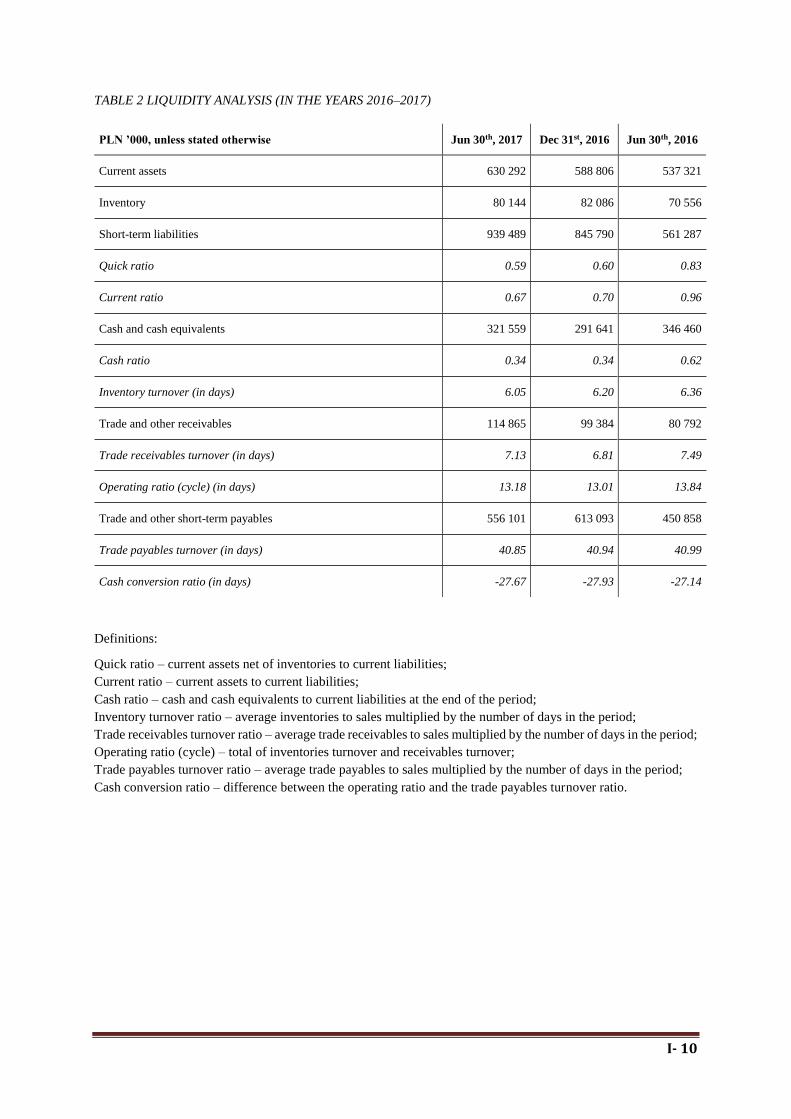
TABLE 2 LIQUIDITY ANALYSIS (IN THE YEARS 2016–2017)
PLN ’000, unless stated otherwise Jun 30th, 2017 Dec 31st, 2016 Jun 30th, 2016
Current assets 630 292 588 806 537 321
Inventory 80 144 82 086 70 556
Short-term liabilities 939 489 845 790 561 287
Quick ratio 0.59 0.60 0.83
Current ratio 0.67 0.70 0.96
Cash and cash equivalents 321 559 291 641 346 460
Cash ratio 0.34 0.34 0.62
Inventory turnover (in days) 6.05 6.20 6.36
Trade and other receivables 114 865 99 384 80 792
Trade receivables turnover (in days) 7.13 6.81 7.49
Operating ratio (cycle) (in days) 13.18 13.01 13.84
Trade and other short-term payables 556 101 613 093 450 858
Trade payables turnover (in days) 40.85 40.94 40.99
Cash conversion ratio (in days) -27.67 -27.93 -27.14
Definitions:
Quick ratio – current assets net of inventories to current liabilities;
Current ratio – current assets to current liabilities;
Cash ratio – cash and cash equivalents to current liabilities at the end of the period;
Inventory turnover ratio – average inventories to sales multiplied by the number of days in the period;
Trade receivables turnover ratio – average trade receivables to sales multiplied by the number of days in the period;
Operating ratio (cycle) – total of inventories turnover and receivables turnover;
Trade payables turnover ratio – average trade payables to sales multiplied by the number of days in the period;
Cash conversion ratio – difference between the operating ratio and the trade payables turnover ratio.

I- 11
TABLE 3 GEARING ANALYSIS (IN THE YEARS 2015–2016)
PLN ’000, unless stated otherwise Jun 30th, 2017 Dec 31st, 2016 Jun 30th, 2016
Non-current assets 2 901 742 2 868 950 2 701 062
Liabilities 2 268 184 2 081 146 1 977 537
Long-term liabilities 1 328 695 1 235 356 1 416 250
Debt 1 516 173 1 262 288 1 346 187
Share of inventories in current assets (%) 12.7% 13.9% 13.1%
Share of trade receivables in current assets (%) 18.2% 16.9% 15.0%
Share of cash and cash equivalents in current assets (%) 51.0% 49.5% 64.5%
Equity to non-current assets ratio 0.44 0.48 0.47
Gearing ratio 0.64 0.60 0.61
Long-term liabilities to equity ratio 1.05 0.90 1.12
Liabilities to equity ratio 1.79 1.51 1.57
Debt/equity 1.20 0.92 1.07
Definitions:
Share of inventories, trade receivables, cash and cash equivalents in current assets – ratio of, respectively,
inventories, trade receivables and cash and cash equivalents to current assets;
Equity to non-current assets ratio – equity to non-current assets;
Gearing – liabilities and provisions as at the end of a given period to the balance sheet total;
Long-term liabilities to equity – long-term liabilities as at the end of a given period to the value of equity;
Liabilities to equity – liabilities and provisions as at the end of a given period to the value of equity;
Debt – total long-term and short-term loans and borrowings.
SALES
Revenue of AmRest Group amounted to PLN 2 391m in H1 2017, representing a 30.3% growth over the year. Q2
2017 sales reached PLN 1 243m, which was 27.2% higher compared to Q2 2016. Dynamic growth of revenue was
mainly driven by continued solid LFL trends across the Company, accelerated pace of new openings (150 locations
opened in the last 12 months) as well as growing M&A activity of the Group (acquisition of Starbucks chain in
Germany in May 2016, 15 German KFC restaurants bought in March 2017 and Pizza Hut Delivery business
acquired in France in May 2017).
Consolidated sales of the Group, adjusted by mentioned acquisitions, amounted to PLN 2 091m in H1 2017 and
were 17.2% higher than year ago.
Revenue of Central Europe (CE) division increased by 15.6% and reached PLN 1 202m in H1 2017. Strong LFL
trends in each of the markets supported by increased new stores development activity (95 restaurants opened within

I- 12
last 12 months) drove such dynamic growth. Exceptionally strong sales growth in H1 2017 was noted in Hungary
and “Other CE” segment – 38.3% and 29.3% respectively.
Positive LFL trends along with growing portfolio of restaurants (12 new locations within last year) stood behind
16% sales growth in Russia in H1 2017 (in RUB). Positive FX impact allowed to report even stronger dynamics
in PLN. H1 2017 revenue in Russia amounted to PLN 288m, which was 40.4% higher than year ago.
Spanish business maintained stable LFL trends in H1 2017 and continued development activity. As a result, H1
2017 sales in Spain increased by 8.6%. In the meantime, total revenue of Western Europe division increased by
61.7% to PLN 741m, driven by additional sales from acquisitions in Germany and France.
In China, declining LFL trends reversed and comparable restaurants reported increase in revenue in H1 2017.
Additionally, 12 new Blue Frog locations were opened during the last 12 months, contributing to 20.3% growth
of sales in the region (PLN 133m in H1 2017).
Unallocated segment comprised of revenue of SCM group realized from the non-related entities. In H1 2017 sales
of this segment reached PLN 27m and were 24.1% higher than year ago.
PROFITABILITY
EBITDA profit in H1 2017 reached PLN 266m, growing by 9.4% against last year. In Q2 2017 growth rate equaled
17.1%, leading to EBITDA of PLN 149m for a quarter. EBITDA margin in H1 2017 stood at 11.1% and was 2.1pp
lower than year ago.
AmRest’s results in H1 2017 were primarily driven by further profitability improvement in most of the core
markets of Group’s operations and consolidation of businesses acquired in Western Europe. Current performance
of restaurants in France and Germany is weaker than mature brands in AmRest portfolio. Ongoing integration
efforts are expected to improve margins of acquired brands in the future.
Consolidated EBITDA of AmRest, adjusted by the impact of M&As in Germany and France, grew in H1 2017 by
17.9%, while EBITDA margin improved by 0.1pp to 13.7%.
In the first half of 2017, positive trends were observed in cost of sales. Improved effectiveness came from
continued attractive food cost, tailored promo campaigns in particular brands and cost saving initiatives in supply
chain management. In the meantime, payroll cost increased over the year, as a result of pressure on labor cost in
CE and Russia and addition of Western European businesses.
Net profit attributable to AmRest shareholders amounted to PLN 54m in H1 2017 (PLN 22m lower than in H1
2016). Net margin declined from 4.1% to 2.2%.
EBITDA profit in CE grew by 10.9% and reached PLN 170m in H1 2017, while margin declined by 0.6pp to
14.1%. Margins in all regions except for Poland strengthened in H1 2017. Key factors behind margins
enhancement were strong LFL sales, favorable trends in food costs and maintained discipline in restaurants’
expenses. Relatively higher payroll costs stood behind deterioration of margins in Poland, yet the impact softened
in Q2 2017. In the first half of the year Company continued successful roll out of light restaurant formats such as
KFC Kiosk, Pizza Hut Express and Pizza Hut Delivery, creating the room for further margin enhancement in the
future.
Profitability of Russian division improved in H1 2017, driven mainly by strong LFL sales and multiple cost saving
initiatives on a restaurant level. After a soft start of the year, EBITDA margin came back to a double-digit territory,
reaching 12.5% in Q2 2017. Similar to most of CE countries, the pressure on labor cost in Russia was offset by
increased efficiency in other cost categories.
Strong results were reported by Spanish division, where profitability improved in H1 2017. EBITDA margin
increased by 1.2pp over the year and reached 20.7%. In Q2 2017 improvement was even stronger, with EBITDA
margin growing by 1.9pp to 21.1%. Outstanding performance in Spain is a result of stable LFL trends, continued
network expansion, relatively lower cost of food and labor and realized savings in rents. Total profitability of
Western Europe division was negatively impacted by consolidation of M&A projects in France and Germany.

I- 13
Weaker margins in acquired businesses together with temporary integration costs diluted EBITDA margin of the
division (9.7% in H1 2017).
In the meantime, breakthrough results were achieved in China. After a very strong start of the year positive trends
continued, leading to an 8.4pp margin improvement in Q2 2017. EBITDA margin in H1 2017 reached 13.1% and
was 7.9pp higher than year ago. Selective approach to development process, realized economies of scale and
implementation of operating best practices from CE brought expected results of improved profitability of Chinese
business.
DEBT RATIOS
The liquidity ratios of the Group are at levels ensuring smooth operating activities and their relatively low level is
related to the specifics of restaurant industry. Cash surpluses generated on a current basis allows for the Group to
serve efficiently existing debt and financing of the planned capital expenditure.
Share capital decreased by PLN 133m compared to the balance of the end of 2016 and amounted to PLN 1 264m
at the end of H1 2017. The change in share capital resulted mainly from the minority interest buyout in Blue
Horizon Hospitality Group PTE Ltd and cumulative translation adjustments. The net debt to EBITDA ratio
amounted to 2.07 as at the end of H1 2017, as a net effect of growing profitability and increased debt financing
allowing for accelerated organic growth and M&A activities.

I- 14
TABLE 4 REVENUES AND MARGINS GENERATED IN THE PARTICULAR MARKETS IN THE SECOND
QUARTERS OF 2016 AND 2017*
PLN '000 Q2 2017 Q2 2016
Share Margin Share Margin
Sales 1 243 141 977 055
Poland 371 090 29.9% 337 931 34.6% Czech Republic 136 764 11.0% 117 392 12.0% Hungary 69 869 5.6% 50 215 5.1% Other CE 39 065 3.1% 30 688 3.1%
Total CE 616 788 49.6% 536 226 54.9%
Russia 149 632 12.0% 115 948 11.9% Spain 215 553 17.3% 195 646 20.0% Germany 163 315 13.1% 52 990 5.4% Other Western Europe 11 013 0.9% 5 101 0.5%
Western Europe 389 881 31.4% 253 737 26.0%
China 72 745 5.9% 59 196 6.1% Unallocated 14 095 1.1% 11 948 1.2% EBITDA 148 942 12.0% 127 157 13.0%
Poland 45 643 12.3% 44 470 13.2%
Czech Republic 26 552 19.4% 22 833 19.5%
Hungary 12 301 17.6% 7 325 14.6%
Other CE 7 658 19.6% 5 051 16.5%
Total CE 92 154 14.9% 79 679 14.9%
Russia 18 732 12.5% 14 600 12.6%
Spain 45 384 21.1% 37 487 19.2%
Germany -5 305 - -396 -
Other Western Europe -2 172 - -959 -
Western Europe 37 907 9.7% 36 132 14.2%
China 12 136 16.7% 4 933 8.3%
Unallocated -11 987 - -8 187 -
Adjusted EBITDA** 162 101 13.0% 139 690 14.3%
Poland 47 812 12.9% 45 641 13.5%
Czech Republic 27 323 20.0% 23 081 19.7%
Hungary 12 687 18.2% 7 535 15.0%
Other CE 8 128 20.8% 5 372 17.5%
Total CE 95 950 15.6% 81 629 15.2%
Russia 19 808 13.2% 16 077 13.9%
Spain 46 753 21.7% 38 652 19.8%
Germany -5 304 - 1 772 3.3%
Other Western Europe -2 105 - -958 -
Western Europe 39 344 10.1% 39 466 15.6%
China 12 997 17.9% 6 108 10.3%
Unallocated -5 998 - -3 590 -
EBIT 62 044 5.0% 54 788 5.7%
Poland 19 214 5.2% 19 156 5.7%
Czech Republic 20 397 14.9% 16 342 13.9%
Hungary 7 338 10.5% 3 826 7.6%
Other CE 5 764 14.8% 2 010 6.5%
Total CE 52 713 8.5% 41 334 7.7%
Russia 5 908 3.9% 4 516 3.9%
Spain 32 097 14.9% 22 346 11.4%
Germany -15 099 - -2 976 -
Other Western Europe -5 299 - -1 528 -
Western Europe 11 699 3.0% 17 842 7.0%
China 4 030 5.5% -797 -
Unallocated -12 306 - -8 107 -
* data not audited
** EBITDA adjusted by costs of new openings (start-up), costs of mergers and acquisitions (all material costs relating to
professional services, connected with finalized merger or acquisition and directly related to the transaction), corrections in
indirect taxes and the effect of SOP exercise method modification (difference in accounting cost of employee benefits accounted
under cash settled versus equity settled option plan).

I- 15
TABLE 5 REVENUES AND MARGINS GENERATED IN THE PARTICULAR MARKETS IN THE FIRST HALVES
OF 2016 AND 2017
PLN '000 H1 2017 H1 2016
Share Margin Share Margin
Sales 2 390 541 1 835 276
Poland 730 498 30.6% 658 149 35.9% Czech Republic 261 936 11.0% 226 638 12.3% Hungary 134 252 5.6% 97 087 5.3% Other CE 75 444 3.2% 58 359 3.2%
Total CE 1 202 130 50.3% 1 040 233 56.7%
Russia 287 982 12.0% 205 058 11.2% Spain 426 439 17.8% 392 640 21.4% Germany 298 916 12.5% 55 501 3.0% Other Western Europe 15 677 0.7% 10 064 0.5%
Western Europe 741 032 31.0% 458 205 25.0%
China 132 778 5.6% 110 333 6.0% Unallocated 26 619 1.1% 21 447 1.2% EBITDA 266 013 11.1% 243 165 13.2%
Poland 82 655 11.3% 86 407 13.1%
Czech Republic 49 748 19.0% 42 583 18.8%
Hungary 23 699 17.7% 15 066 15.5%
Other CE 13 853 18.4% 9 221 15.8%
Total CE 169 955 14.1% 153 277 14.7%
Russia 29 408 10.2% 22 606 11.0%
Spain 88 257 20.7% 76 530 19.5%
Germany -18 902 - -1 167 -
Other Western Europe -3 511 - -1 250 -
Western Europe 65 844 8.9% 74 113 16.2%
China 15 684 11.8% 4 398 4.0%
Unallocated -14 878 - -11 229 -
Adjusted EBITDA* 283 182 11.8% 253 286 13.8%
Poland 85 759 11.7% 82 880 12.6%
Czech Republic 50 792 19.4% 43 205 19.1%
Hungary 24 406 18.2% 15 418 15.9%
Other CE 14 592 19.3% 9 541 16.3%
Total CE 175 549 14.6% 151 044 14.5%
Russia 31 290 10.9% 25 043 12.2%
Spain 90 120 21.1% 78 345 20.0%
Germany -18 862 - 1 001 1.8%
Other Western Europe -3 437 - -1 250 -
Western Europe 67 821 9.2% 78 096 17.0%
China 17 411 13.1% 5 735 5.2%
Unallocated -8 889 - -6 632 -
EBIT 102 107 4.3% 109 941 5.7%
Poland 32 066 4.4% 37 765 5.7%
Czech Republic 35 450 13.5% 28 637 12.6%
Hungary 13 746 10.2% 8 127 8.4%
Other CE 8 007 10.6% 3 085 5.3%
Total CE 89 269 7.4% 77 614 7.5%
Russia 7 556 2.6% 6 788 3.3%
Spain 61 434 14.4% 49 004 12.5%
Germany -36 292 - -3 960 -
Other Western Europe -7 166 - -2 335 -
Western Europe 17 976 2.4% 42 709 9.3%
China 2 609 2.0% -5 814 -
Unallocated -15 303 - -11 356 -
* EBITDA adjusted by costs of new openings (start-up), costs of mergers and acquisitions (all material costs relating to
professional services, connected with finalized merger or acquisition and directly related to the transaction), corrections in
indirect taxes and the effect of SOP exercise method modification (difference in accounting cost of employee benefits accounted
under cash settled versus equity settled option plan).
I- 16
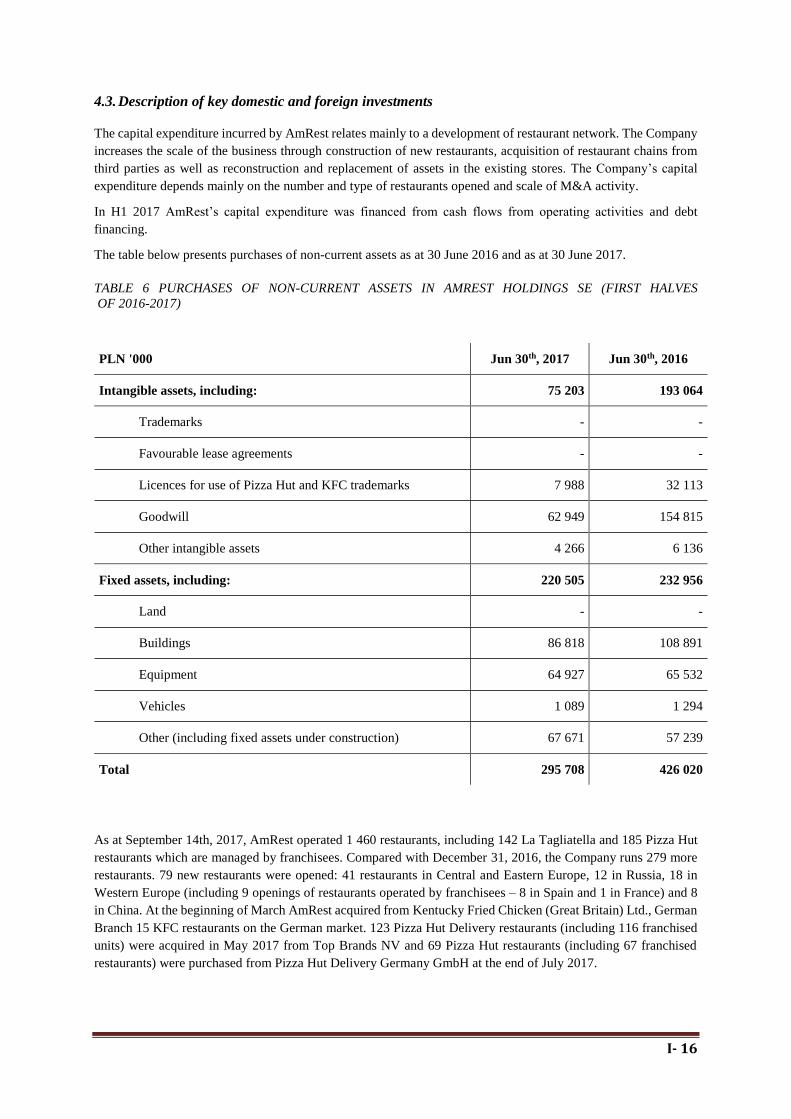
4.3. Description of key domestic and foreign investments
The capital expenditure incurred by AmRest relates mainly to a development of restaurant network. The Company
increases the scale of the business through construction of new restaurants, acquisition of restaurant chains from
third parties as well as reconstruction and replacement of assets in the existing stores. The Company’s capital
expenditure depends mainly on the number and type of restaurants opened and scale of M&A activity.
In H1 2017 AmRest’s capital expenditure was financed from cash flows from operating activities and debt
financing.
The table below presents purchases of non-current assets as at 30 June 2016 and as at 30 June 2017.
TABLE 6 PURCHASES OF NON-CURRENT ASSETS IN AMREST HOLDINGS SE (FIRST HALVES
OF 2016-2017)
PLN '000 Jun 30th, 2017 Jun 30th, 2016
Intangible assets, including: 75 203 193 064
Trademarks - -
Favourable lease agreements - -
Licences for use of Pizza Hut and KFC trademarks 7 988 32 113
Goodwill 62 949 154 815
Other intangible assets 4 266 6 136
Fixed assets, including: 220 505 232 956
Land - -
Buildings 86 818 108 891
Equipment 64 927 65 532
Vehicles 1 089 1 294
Other (including fixed assets under construction) 67 671 57 239
Total 295 708 426 020
As at September 14th, 2017, AmRest operated 1 460 restaurants, including 142 La Tagliatella and 185 Pizza Hut
restaurants which are managed by franchisees. Compared with December 31, 2016, the Company runs 279 more
restaurants. 79 new restaurants were opened: 41 restaurants in Central and Eastern Europe, 12 in Russia, 18 in
Western Europe (including 9 openings of restaurants operated by franchisees – 8 in Spain and 1 in France) and 8
in China. At the beginning of March AmRest acquired from Kentucky Fried Chicken (Great Britain) Ltd., German
Branch 15 KFC restaurants on the German market. 123 Pizza Hut Delivery restaurants (including 116 franchised
units) were acquired in May 2017 from Top Brands NV and 69 Pizza Hut restaurants (including 67 franchised
restaurants) were purchased from Pizza Hut Delivery Germany GmbH at the end of July 2017.

I- 17
TABLE 7 NUMBER OF AMREST RESTAURANTS (AS AT THE DATE OF PUBLICATION OF THE REPORT)
Countries Brands 31-12-2014 31-12-2015 31.12.2016 14.09.2017
Poland TOTAL 320 346 389 412
KFC 191 206 222 225
BK 32 33 36 37
SBX 38 40 52 57
PH 59 67 79 93
Czech TOTAL 94 102 114 121
KFC 68 71 78 81
BK 7 7 8 9
SBX 19 24 28 30
PH 0 0 0 1
Hungary TOTAL 42 49 66 69
KFC 30 35 45 45
SBX 10 12 16 17
PH 2 2 5 7
Russia TOTAL 101 109 123 132
KFC 92 101 115 123
PH 9 8 8 9
Bulgaria TOTAL 6 11 11 12
KFC 5 5 5 5
BK 1 1 1 1
SBX 0 5 5 6
Serbia TOTAL 5 5 5 6
KFC 5 5 5 6
Croatia TOTAL 5 5 6 7
KFC 5 5 6 7
Romania TOTAL 0 19 28 31
SBX 0 19 28 31
Slovakia TOTAL 0 0 3 3
SBX 0 0 3 3
Spain TOTAL 190 216 245 259
TAG equity 57 65 73 74
TAG franchised 101 115 129 137
KFC 32 36 43 48
France TOTAL 8 10 10 133
TAG equity 4 4 5 4
TAG franchised 4 6 5 5
PH equity 0 0 0 7
PH franchised 0 0 0 117
Germany TOTAL 3 2 145 230
SBX 0 0 143 138
TAG equity 3 2 2 2
KFC 0 0 0 19
PH equity 0 0 0 3
PH franchised 0 0 0 68
Portugal TOTAL 0 0 0 1
TAG equity 0 0 0 1
China TOTAL 22 29 36 44
Blue Frog 17 25 32 40
KABB 3 4 4 4
Stubb’s 0 0 0 0
TAG equity 2 0 0 0
USA TOTAL 4 1 0 0
Applebee's 3 0 0 0
TAG equity 1 1 0 0
TAG franchised 0 0 0 0
TOTAL AmRest 800 904 1181 1460

I- 18
TABLE 8 NEW AMREST RESTAURANTS
AmRest equity
restaurants
AmRest franchisee
restaurants Total
31.12.2016 1 047 134 1 181
New Openings 70* 9 79
Acquisitions 30 185 215
Closings 14 1* 15
14.09.2017 1 133 327 1 460
* Data include the conversion of 1 Pizza Hut franchised location into equity restaurant

I- 19
5. Planned investment activities and assessment of their feasibility
AmRest’s strategy is to leverage its unique “Wszystko Jest Możliwe” culture, international capability and superior
brand portfolio to grow scalable (min. USD 50 million annual sales) and highly profitable (min. 20% IRR)
restaurants globally.
The Group intends to continue its strategic directions of development. Currently, the main focus of AmRest is on
further expansion of the business in regions of continental Europe. Existing potential in the markets where AmRest
is present allows to accelerate the pace of organic expansion. Recent successful roll-out of lighter restaurant
formats (i.e. KFC Kiosk, Pizza Hut Express, Pizza Hut Delivery) increased availability of new locations and
widened the white space for new openings. Improving effectiveness of newly opened restaurants also encourages
to increase the growth pace.
Potential acquisitions of European restaurant chains remain the second pillar of AmRest’s growth. Roll up of
brands already existing in Group’s portfolio is expected to play an important role in potential M&A activities.
AmRest’s Management believes that in a long-term perspective expanding portfolio with exceptional proprietary
brands shall also strengthen the value of the Company.
Similar to previous years, improvement of ROIC and building the long-term growth platform will define the main
criteria of shaping the structure of new launches and acquisitions. AmRest’s investment program will be financed
both from the own sources and through debt financing.

I- 20
6. External and internal factors which are significant to the Company’s
development in 2017
The Management Board of AmRest believes that the following factors will have a significant effect on the
Company’s future development and results:
6.1. External factors
The external factors include:
competitiveness – in terms of prices, quality of service, location and quality of food,
demographic changes,
consumer habits and trends as to the number of people using the restaurants,
number and location of the competitors’ restaurants,
changes in the law and regulations which have a direct effect on the functioning of the restaurants and the
employees employed therein,
change in real estate rental costs and related costs,
changes in the prices of ingredients used to prepare meals and changes in the prices of packaging
materials,
changes in the general economic condition in Poland, the Czech Republic, Hungary, Bulgaria, Russia,
Serbia, Croatia, Romania, Slovakia, Spain, France, Germany and China.
changes in consumer trust, the amount of disposable income and individual spending patterns,
changes in legal and tax determinants,
adverse changes on the financial markets.
6.2. Internal factors
The internal factors include:
gaining and training the human resources necessary for the development of the existing and new
restaurant networks,
obtaining attractive locations,
effective launching of new brands and products,
building an integrated information system.

I- 21
7. Basic risks and threats to which the Company is exposed
The Management Board of AmRest is responsible for the risk management system and the internal control system
as well as for reviewing these systems for operating efficiency. These systems help identify and manage risks
which may prevent the execution of the long-term objectives of AmRest. However, having these systems in place
does not ensure complete elimination of the risk of fraud and violation of the law. The Management Board of
AmRest performed a review, an analysis and a ranking of risks to which the Company is exposed. The main current
risks and threats have been summarized in this section. AmRest reviews and improves its risk management and
internal control systems on an on-going basis.
a) Factors remaining outside the Company’s control
This risk is related to the effect of factors remaining outside the Company's control on AmRest's development
strategy which is based on opening new restaurants. Such factors include: opportunities for finding and securing
available and appropriate locations for restaurants, the ability to obtain the permits required by relevant bodies,
the possibility of delays in opening new restaurants.
b) Dependency on the franchisor
AmRest manages KFC, Pizza Hut, Burger King and Starbucks (in Romania, Bulgaria, Germany and Slovakia) as
a franchisee, and therefore a number of factors and decisions related to the business activities conducted by
AmRest depend on the limitations or specifications imposed by the franchisors or on their consent.
The duration of the franchising agreements related to the KFC, Pizza Hut and Burger King brands is 10 years.
AmRest has the option of extending this period for the next 10 years provided that it meets the conditions specified
in the franchising agreements and other requirements, including the payment of the related continuation fee.
Despite meeting the above-mentioned terms, there is no guarantee that after the expiry of these periods a given
franchising agreement will be prolonged to the next period. In the case of KFC and Pizza Hut restaurants, the first
period commenced in 2000, in the case of Burger King, the first period commenced in 2007 with the opening of
the first restaurant of this brand.
Franchise agreements for Starbucks stores in Romania are valid till 2023, in Bulgaria until 2027 and in Germany
until 2031.
c) Dependency on joint venture partners
AmRest opens Starbucks restaurants through joint venture Companies in Poland, the Czech Republic and Hungary,
based on a partnership as part of joint venture agreements. Therefore, some decisions as part of the joint business
activities will be dependent on the partners’ consent.
The joint venture agreements with Starbucks were concluded for a period of 15 years with a possibility of their
extension for the next 5 years upon meeting the specified conditions. Should AmRest fail to comply with the
obligation to open and run the minimum specified number of cafés, Starbucks Coffee International, Inc. shall have
the right to increase its share in the joint venture companies by acquiring shares from AmRest Sp. z o.o.
at a price agreed between the parties based on the valuation of the joint venture companies.
d) No exclusive rights
The franchising agreements concerning the running of KFC, Pizza Hut and Burger King restaurants do not contain
provisions on granting AmRest any exclusive rights on a given territory, protection or any other rights on the
territory, in the area or on the market surrounding AmRest restaurants. However, in practice, due to the scale of
AmRest’s operations (including a well-developed distribution network), the possibility that a competitive operator
I- 22
(to the brands currently operated by the Company) should appear who would be able to effectively compete with
the AmRest Group restaurants is relatively limited.
In the case of Starbucks restaurants, the joint venture companies are the only entities authorized to develop and
run Starbucks cafés in Poland, the Czech Republic and Hungary, without exclusive rights to some institutional
locations. The exclusive rights apply also to restaurants operated in Romania, Bulgaria, Germany and Slovakia.
e) Rental agreements and continuation options
Almost all AmRest restaurants operate in rented facilities. The majority of the rental contracts are long-term and
they are usually concluded for at least 10 years from the date of commencing the rental (assuming that all
continuation options are exercised, on specified terms, and not including contracts which are subject to periodic
renewal, unless they are terminated, and contracts concluded for an indefinite period). A number of rental contracts
grant AmRest the right to prolong the contract provided that the Company complies with the terms of rental.
Regardless of whether the terms are complied with or not, there is no guarantee that AmRest will be able to prolong
a rental contract on terms satisfactory from the point of view of business practice. If this is not possible a potential
loss of important restaurant locations may have an unfavourable effect on AmRest’s operating results and its
business activities.
Moreover, in certain circumstances AmRest may make a decision to close a given restaurant and terminating the
relevant rental contract on cost effective terms may prove impossible. This situation may also have an adverse
effect on the business activities and operating results of the Company. Closing any of the restaurants is subject to
approval by the franchisor and it is not certain that such approval will be obtained.
In the case of Russian and Chinese restaurants acquired by AmRest accordingly in July 2007 and December 2012,
the average term of the rental contracts is relatively shorter compared with AmRest restaurants in the remaining
countries. This results from the specific nature of the Russian market.
f) Risk related to the consumption of food products
Consumer preferences may change in connection with doubts arising as to the healthful properties of chicken
which is the main ingredient in KFC menu, or as a result of unfavourable information being circulated by the mass
media concerning the quality of the products, diseases caused by them and damages to health as a result of eating
in AmRest restaurants and restaurants of other franchisees of KFC, Pizza Hut, Burger King, Starbucks,
La Tagliatella, Blue Frog and KABB, and as a result of revealing unfavourable data prepared by the government
or a given market sector concerning the products served in AmRest restaurants and restaurants of other franchisees
of KFC, Pizza Hut, Burger King, Starbucks, La Tagliatella, Blue Frog and KABB, health-related issues and issues
related to the functioning patterns of one or more restaurants run both by AmRest and the competition. The above-
mentioned risk is limited by using the highest quality ingredients in AmRest restaurants, which come from reliable
and reputable suppliers, compliance with strict quality control and hygiene standards and the use of top modern
equipment and processes which ensure the absolute safety of the meals.
g) Risk related to keeping key personnel in the Company
The Issuer's success depends to some extent on the individual effort of selected employees and key members of
management. The methods of remunerating and managing human resources developed by the Issuer help ensure a
low rotation of the key personnel. Additionally, the career planning system supports preparing successors ready to
execute tasks in key positions. The Issuer believes it will be able to replace its key personnel. Regardless of that,
their loss may have a short-term adverse effect on the business activities and operating results of the Issuer.
h) Risk related to labour costs of restaurant employees and employing and keeping professional staff
Running catering activities on such a large scale as the Issuer does requires employing a large number of
professionals. Excessive outflow of employees and too frequent changes in managerial positions may pose

I- 23
a significant risk to the stability and quality of the business activities. Due to the fact that salaries in Poland, the
Czech Republic and Hungary (including in the catering sector) are still decidedly lower than in other European
Union countries, there is a risk of outflow of qualified staff and thus a risk of the Company being able to ensure
the appropriate staff necessary for providing the highest quality catering services. In order to avoid the risk of
losing qualified staff it may be necessary to gradually increase the salary rates, which may have an adverse effect
on the financial standing of the Issuer. Additional risk in employment area may be caused by fluctuations in
unemployment rate.
i) Risk related to limited access to foodstuffs and the variability of their cost
The Issuer’s situation is also affected by the need to ensure frequent deliveries of fresh agricultural products and
foodstuffs and anticipating and responding to changes in supplies costs. The Company cannot rule out the risk
related to delivery deficits or interruptions caused by factors such as unfavourable weather conditions, changes in
legal regulations or withdrawing some foodstuffs from trading. Also the increased demand for certain products
accompanied by limited supply may lead to difficulties in obtaining them by the Company or to price increases
for those products. Both the deficits and product price increases may have an adverse effect on the Group‘s results,
operations and financial standing. In order to mitigate this risk (among others) AmRest
Sp. z o.o. concluded a contract with SCM Sp. z o.o. for the provisions of services comprising intermediation and
negotiating terms of delivery to restaurants, including negotiating terms of distribution agreements.
j) Risk related to developing new brands
AmRest has operated La Tagliatella, Blue Frog and KABB brands for a relatively short time. As these are new
concepts for AmRest, there is a risk related to demand for the products offered and their acceptance by customers.
k) Risk related to opening restaurants in new countries
Opening or taking over restaurants operating in a new geographical and political area involves the risk of varying
consumer preferences, a risk of insufficient knowledge of the market, the risk of legal restrictions arising from
local regulations and the political risk of these countries.
l) Currency risk
The results of AmRest are exposed to currency risk related to transactions and translations into currencies other
than the currency in which business transactions are measured in the individual Capital Group companies. The
Company adjusts its currency portfolio of debt to the geographical structure of its profile of activities. Additionally,
AmRest uses forward contracts to secure transaction risks on a short term basis.
m) Risk related to the current geopolitical situation in the Ukraine and Russia
Russia is one of the largest markets for AmRest. The recent geopolitical and economic turmoil witnessed in the
region, in particular the developments in Ukraine, have had and may continue to have a negative impact on the
Russian economy, including weakening of the Russian Ruble, higher interest rates, reduced liquidity and consumer
confidence. These events, including current and future international sanctions against Russian companies and
individuals and the related uncertainty and volatility of the supply chain, may have a significant impact on the
Group’s operations and financial position, the effect of which is difficult to predict. The future economic and
regulatory situation may differ from management’s expectations however it is being monitored in order to adjusts
strategic intentions and operational decisions, which will minimize business risks.

I- 24
n) Risk of increased financial costs
The Issuer and its subsidiaries are exposed to the significant adverse impact of interest rate fluctuations in
connection with obtaining financing which bears floating interest rates and investing in assets bearing floating and
fixed interest rates. The interest rates of bank loans and borrowings and issued bonds is based on floating reference
rates which are updated over periods shorter than one year. Interest on financial assets with fixed interest rates is
fixed over the entire period to maturity of these instruments. Additionally, the Issuer and its subsidiaries may, as
part of the interest rate hedging strategy, enter into derivative and other financial contracts the valuation of which
is significantly affected by the level of reference rates.
o) Liquidity risk
The Company is exposed to the risk of lack of financing at the moment of maturity of bank loans and bonds.
As at June 30th, 2017, the Company had enough short-term assets, including cash and promised credit limits, to
fulfil is liabilities due in the next 12 months.
p) Risk of economic slowdowns
Economic slowdown in the countries where AmRest runs its restaurants may affect the level of consumption
expenditure on these markets, which in turn may affect the results of the AmRest restaurants operating on these
markets.
q) Risk related to seasonality of sales
The seasonality of sales and inventories of AmRest is not significant, which is typical for the restaurant industry.
On the European market restaurants record lower sales in the first half of the year, mainly due to the lower number
of sale days in February and the relatively less frequent visits to restaurants.
r) Risk of computer system breakdowns and temporary breaks in serving customers in network restaurants
A potential partial or complete loss of data in connection with computer system breakdowns or damage or loss of
key tangible fixed assets of the Company might result in temporary interruptions in serving customers in
restaurants, which might have an adverse effect on the Group's financial results. In order to minimize this risk, the
Issuer has implemented appropriate procedures in order to ensure the stability and reliability of IT systems.

I- 25
8. Management representations
8.1. Correctness and fairness of the presented financial statements
To the best knowledge of the Management Board of AmRest Holdings SE, the abridged consolidated semi-annual
financial statements and the comparative figures presented in the abridged consolidated semi-annual financial
statements of the AmRest Group have been prepared in accordance with the binding accounting policies and they
give a true, fair and clear view of the financial position of the AmRest Group and its results. The semi-annual
Directors’ Report included in this document provides a true image of the development and achievements and the
situation of the AmRest Group, including a description of the key risks and threats.
8.2. Selection of the registered audit company
The entity authorized to audit the financial statements, BDO Sp. z o.o., which carried out the annual audit of the
abridged consolidated semi-annual financial statements of the AmRest Group has been selected in compliance
with the provisions of the law. Both the entity and auditors conducting the audit met the requirements necessary
to enable them to issue an unbiased and independent audit opinion, in accordance with the relevant laws. The
agreement with BDO Sp. z o.o. was concluded on July 4th, 2017 and will be in force until December 31st, 2019.

I- 26
Wrocław, September 14th, 2017
………………………………
Mark Chandler
AmRest Holdings SE
Management Board Member
………………………………
Wojciech Mroczyński
AmRest Holdings SE
Management Board Member
………………………………
Jacek Trybuchowski
AmRest Holdings SE
Management Board Member
………………………………
Oksana Staniszewska
AmRest Holdings SE
Management Board Member
………………………………
Olgierd Danielewicz
AmRest Holdings SE
Management Board Member

II- 1
AmRest Holdings SE Report for the 1st half of 2017
PART II
Supplement to Directors' Report
Contents:
1. The position of the Management Board of AmRest Holdings SE concerning the realization of previously
published prognoses concerning the results for the year II-2
2. Shareholders holding at least 5% of the general number of votes at the General Shareholders' Meeting of
AmRest Holdings SE as at the date of the report II-2
3. Description of changes in the shareholding II-2
4. Information about remuneration and share option held by members of the Company's management and
supervisory bodies for the period of 6 months, ending June 30th, 2017 II-7
5. Information on significant proceedings related to AmRest Holdings SE or other group companies II-8
6. Composition of the Group II-8
7. Loans and borrowings in the Group II-9
8. Information on granted guarantees or sureties for credits or loans II-9
9. Information on issues, redemption and repayment of debt securities II-9
10. Information about transactions concluded by the Company with related parties on non-market
conditions II-10
11. Information about events having a significant impact on the operation and financial results of the
Group II-10
12. Information on dividends paid II-13
13. Results of the AmRest Group for Q2 2017 II-14
PART III
Selected financial data III-I

II- 2
1. The position of the Management Board of AmRest Holdings SE concerning the
realization of previously published prognoses concerning the results for the year
The Company did not publish any forecasts of its results.
2. Shareholders holding at least 5% of the general number of votes at the General
Shareholders’ Meeting of AmRest Holdings SE as at June 30, 2017 and as at the
date of the report
According to the information held by the Company, as at June 30th, 2017, the following shareholders provided
information on holding directly or indirectly (through subsidiaries) at least 5% of the number of votes at the
General Shareholders’ Meeting of AmRest:
SHAREHOLDERS HOLDING MORE THAN 5% OF VOTES AT THE GSM OF AMREST
Shareholders Number of shares Share in capital
%
Number of votes
at AGM % shares at AGM
FCapital Dutch B.V.* 13 121 152 61,85% 13 121 152 61,85%
Nationale-Nederlanden OFE** 2 034 893 9,59% 2 034 893 9,59%
Free float 6 057 848 28,56% 6 057 848 28,56%
* FCapital Dutch B. V. is the dominant entity of FCapital Lux (previously Cullinan S.à.r.l.) (holding 6 394 362 AmRest shares)
and the subsidiary of Finaccess Capital, S.A. de C.V. Grupo Finacces SAPI de CV is the directly dominant entity of Finaccess
Capital, S.A. de C.V. and a subsidiary of Grupo Far-Luca, S.A. de C.V. The directly dominant person of Grupo Far-Luca, S.A.
de C.V., Mr. Carlos Fernández González, is the Supervisory Board member of AmRest.
** The previous name: ING OFE
As at the date of submitting this semi-annual report, September 14th, 2017, above table reflects the current
shareholding structure.
3. Description of changes in the shareholding
3.1. Changes in the shareholding with respect to the shareholders holding over 5% of votes at the
General Meeting of Shareholders
Since the publication of the previous periodical report (May 18th, 2017) there were no changes in the shareholding
structure of AmRest other than those described below:
On August 11th, 2017 the Management Board of AmRest informed that it received on the same day a notification
from Gosha Holding S.à.r.l., a company organized under the laws of the Grand Duchy of the Luxembourg, with
its registered office in Luxembourg, L-1528, 8A Boulevard de la Foire, registered with the Luxembourg Trade and
Companies Register (Registre de Commerce et des Sociétés) under number B202224 (hereinafter referred as the
“Gosha”), that as a result of a block transaction executed at the Warsaw Stock Exchange on August 9th, 2017
Gosha disposed 200,000 shares in AmRest representing app. 0.94% of the total number of shares of the Company,
which entitle to exercise 200,000 votes at the Company’s General Meeting of Shareholders, constituting app.
0.94% of total number of votes at the Company’s General Meeting of Shareholders (the “Transaction”) and, as a
result, decreased its share in the total amount of votes at the Company’s General Meeting of Shareholders to less
than 5%.
Prior to the Transaction Gosha held 1,242,056 shares of the Company representing app. 5.85% of the total number
of shares of the Company, which entitled to exercise 1,242,056 votes at the Company’s General Meeting of
Shareholders, constituting app. 5.85% of total number of votes at the Company’s General Meeting of Shareholders.

II- 3
After execution of the Transaction Gosha held 1,042,056 shares of the Company representing app. 4.91% of the
total number of shares of the Company, which entitled to exercise 1,042,056 votes at the Company’s General
Meeting of Shareholders, constituting app. 4.91% of total number of votes at the Company’s General Meeting of
Shareholders.
Additionally, Gosha informed that it did not hold, acquire or disposed any instruments referred to in Article 69b.1
of the Act of 29 July 2005 on Public Offering and the Conditions Governing the Introduction of Financial
Instruments to Organized Trading and on Public Companies (“POA”), and that there are no persons or entities
referred to in Article 87 section 1 point 3 c) of the POA.
3.2. Changes in the number of shares held by members of AmRest Management and Supervisory
Boards
During the period since the publication of the previous periodical report (May 18th, 2017) following changes
occurred with respect to AmRest shares and stock options held by the members of the Management and
Supervisory Boards of AmRest:
According to the best knowledge of AmRest, following members of Management Board owned in this reporting
period the Issuer's shares: Mr. Wojciech Mroczyński, Mr. Drew O’Malley, Mrs. Oksana Staniszewska, Mr. Olgierd
Danielewicz, Mr. Mark Chandler and Mr. Jacek Trybuchowski.
As at May 18th, 2017 Mr. Wojciech Mroczyński held 1 355 shares of the Company with a total nominal value of
EUR 13.55. On June 30th, 2017 (and simultaneously on the date of publication of this report) he holds the same
amount of the Company’s shares.
As at May 18th, 2017 Mr. Drew O’Malley held 3 000 shares of the Company with a total nominal value of
EUR 30.00. On June 30th, 2017 (being the last day on the position of the Management Board member) he held
918 shares of the Company with a total nominal value of EUR 9.18.
As at May 18th, 2017 Mr. Olgierd Danielewicz held 25 847 shares of the Company with a total nominal value of
EUR 258.47. On June 30th, 2017 (and simultaneously on the date of publication of this report) he holds 25 047
shares of the Company with a total nominal value of EUR 250.47.
As at May 18th, 2017 Mr. Mark Chandler held 1 379 shares of the Company with a total nominal value of EUR
13.79. On June 30th, 2017 (and simultaneously on the date of publication of this report) he holds the same amount
of the Company’s shares.
As at June 30th, 2017, i.e. the day of re-appointment as a member of the Management Board (and simultaneously
on the date of publication of this report) Mr. Jacek Trybuchowski held 44 954 shares of the Company with a total
nominal value of EUR 449.54.
Pursuant to the information available to the Company, the only Supervisory Board member, who own directly the
Issuer's shares is Mr. Henry McGovern .
As at May 18th, 2017 Mr. Henry McGovern held directly 7 234 shares of the Company with a total nominal value
of EUR 72.34. As a dominant person of Gosha Holdings S.a.r.l. he held indirectly 1 242 056 AmRest shares with
a total nominal value of EUR 12 420.56. On June 30th, 2017 he held same amount of the Company’s shares. As
at the date of publication of this report Mr. McGovern holds directly 7 234 shares of the Company with a total
nominal value of EUR 72.34 and indirectly (through Gosha Holdings S.a.r.l.) 1 042 056 AmRest shares with a
total nominal value of EUR 10 420.56.
As at May 18th, 2017 Mr. Steven Kent Winegar didn’t hold directly any shares of the Company. On June 30th,
2017 (and simultaneously on the date of publication of this report) Mr. Steven Kent Winegar also held the
Company’s shares only through closely associated entity - Gosha Holdings S.a.r.l.

II- 4
3.3. Transactions on AmRest shares executed by persons having access to confidential information
since issuing last financial report (May 18th, 2017)
On May 31st, 2017 the Management Board of AmRest informed that it received on the same day a notice from
Mr. Jerzy Tymofiejew - a person discharging managerial responsibilities, about a purchase of 450 AmRest shares
at the average price of PLN 207.76 executed on May 29th, 2017. The transaction was executed outside the
regulated marked as a result of exercising AmRest management option plan.
The transactions were executed at the Warsaw Stock Exchange.
On June 12th, 2017 the Management Board of AmRest informed that it received on the same day a notice from
Mr. Drew O’Malley - a member of the Company’s Management Board, about a sale of 2 082 AmRest shares at
the average price of PLN 360.24 per share executed on June 9th, 2017. The transaction was executed at the Warsaw
Stock Exchange.
On June 22nd, 2017 the Management Board of AmRest informed that it received on the same day a notice from
Mr. Olgierd Danielewicz - a member of the Company’s Management Board, about a sale of 800 AmRest shares
at the average price of PLN 360.01 per share executed on June 20th, 2017. The transaction was executed at the
Warsaw Stock Exchange..
3.4. Transactions on AmRest shares concluded for the purpose of executing the management option
plan
The commencement of the purchase of treasury shares occurred on the basis of Resolution No. 7 of the General
Meeting of the Company of May 19th, 2015 concerning the authorization for the Management Board to acquire
treasury shares in the Company and the establishment of reserve capital.
TRANSACTIONS ON AMREST TREASURY SHARES CONCLUDED WITHIN PERFORMANCE OF THE
MANAGEMENT OPTIONS PROGRAMS
Conclusion
date
Settlement
date
Purchase
/disposal
Number of
acquired/
disposed
shares
Average
acquisition/
disposal
price of
shares
Nominal
value of
shares
[EUR]
% of the
share
capital of
the
Company
Number
of votes
at AGM
Total
number
of shares
Total
number
of votes
at AGM
% of the total
number of
votes
in the
Company
22.05.2017 24.05.2017 P 3 100 332.46 0.01 0.0146% 3 100 42 032 42 032 0.1981%
23.05.2017 25.05.2017 P 2 900 336.33 0.01 0.0137% 2 900 44 932 44 932 0.2118%
24.05.2017 24.05.2017 D 85 0.00 0.01 0.0004% 85 44 847 44 847 0.2114%
24.05.2017 26.05.2017 P 1 364 337.78 0.01 0.0064% 1 364 46 211 46 211 0.2178%
25.05.2017 29.05.2017 P 683 338.21 0.01 0.0032% 683 46 894 46 894 0.2211%
26.05.2017 26.05.2017 D
1 212 0.00 0.01
0.0097% 2 052 44 842 44 842 0.2114%
240 70.00 0.01
200 81.00 0.01
140 81.82 0.01
260 223.50 0.01
26.05.2017 30.05.2017 P 2 608 339.98 0.01 0.0123% 2 608 47 450 47 450 0.2237%
29.05.2017 29.05.2017 D
1 335 0.00 0.01
0.0106% 2 245 45 205 45 205 0.2131%
100 70.00 0.01
100 81.00 0.01
150 81.82 0.01
80 130.90 0.01
480 223.50 0.01
29.05.2017 31.05.2017 P 1 472 340.00 0.01 0.0069% 1 472 46 677 46 677 0.2200%

II- 5
Conclusion
date
Settlement
date
Purchase
/disposal
Number of
acquired/
disposed
shares
Average
acquisition/
disposal
price of
shares
Nominal
value of
shares
[EUR]
% of the
share
capital of
the
Company
Number
of votes
at AGM
Total
number
of shares
Total
number
of votes
at AGM
% of the total
number of
votes
in the
Company
30.05.2017 30.05.2017 D 837 0.00 0.01 0.0039% 837 45 840 45 840 0.2161%
30.05.2017 01.06.2017 P 2 377 340.60 0.01 0.0112% 2 377 48 217 48 217 0.2273%
31.05.2017 31.05.2017 D 270 0.00 0.01 0.0013% 270 47 947 47 947 0.2260%
31.05.2017 02.06.2017 P 3 200 345.25 0.01 0.0151% 3 200 51 147 51 147 0.2411%
01.06.2017 01.06.2017 D 574 0.00 0.01
0.0037% 794 50 353 50 353 0.2374% 220 223.50 0.01
01.06.2017 05.06.2017 P 150 339.70 0.01 0.0007% 150 50 503 50 503 0.2381%
05.06.2017 05.06.2017 D
809 0.00 0.01
0.0054% 1 149 49 354 49 354 0.2326% 120 70.00 0.01
100 81.00 0.01
120 81.82 0.01
06.06.2017 06.06.2017 D
501 0.00 0.01
0.0065% 1 371 47 983 47 983 0.2262%
180 70.00 0.01
210 81.00 0.01
220 81.82 0.01
260 223.50 0.01
06.06.2017 08.06.2017 P 3 400 364.16 0.01 0.0160% 3 400 51 383 51 383 0.2422%
07.06.2017 09.06.2017 P 2 000 366.44 0.01 0.0094% 2 000 53 383 53 383 0.2516%
08.06.2017 08.06.2017 D 1 078 0.00 0.01 0.0051% 1 078 52 305 52 305 0.2466%
12.06.2017 12.06.2017 D
463 0.00 0.01
0.0041% 863 51 442 51 442 0.2425%
20 70.00 0.01
100 81.00 0.01
120 81.82 0.01
160 223.50 0.01
13.06.2017 13.06.2017 D 705 0.00 0.01 0.0033% 705 50 737 50 737 0.2392%
13.06.2017 16.06.2017 P 2 374 356.50 0.01 0.0112% 2 374 53 111 53 111 0.2504%
14.06.2017 14.06.2017 D 292 0.00 0.01
0.0016% 342 52 769 52 769 0.2487% 50 81.00 0.01
14.06.2017 19.06.2017 P 2 000 355.00 0.01 0.0094% 2 000 54 769 54 769 0.2582%
16.06.2017 20.06.2017 P 1 076 355.18 0.01 0.0051% 1 076 55 845 55 845 0.2632%
19.06.2017 19.06.2017 D
2 890 0.00 0.01
0.0183% 3 890 51 955 51 955 0.2449%
200 70.00 0.01
200 81.00 0.01
200 81.82 0.01
400 223.50 0.01
20.06.2017 20.06.2017 D
725 0.00 0.01
0.0049% 1 047 50 908 50 908 0.2400% 80 81.00 0.01
82 81.82 0.01
160 223.50 0.01
20.06.2017 22.06.2017 P 1 027 359.89 0.01 0.0048% 1 027 51 935 51 935 0.2448%
21.06.2017 21.06.2017 D
676 0.00 0.01
0.0046% 977 50 958 50 958 0.2402% 141 70.00 0.01
80 81.00 0.01
80 81.82 0.01
21.06.2017 23.06.2017 P 2 000 362.76 0.01 0.0094% 2 000 52 958 52 958 0.2496%
22.06.2017 26.06.2017 P 555 364.92 0.01 0.0026% 555 53 513 53 513 0.2523%

II- 6
Conclusion
date
Settlement
date
Purchase
/disposal
Number of
acquired/
disposed
shares
Average
acquisition/
disposal
price of
shares
Nominal
value of
shares
[EUR]
% of the
share
capital of
the
Company
Number
of votes
at AGM
Total
number
of shares
Total
number
of votes
at AGM
% of the total
number of
votes
in the
Company
23.06.2017 23.06.2017 D 1 015 0.00 0.01 0.0048% 1 015 52 498 52 498 0.2475%
23.06.2017 27.06.2017 P 1 002 363.95 0.01 0.0047% 1 002 53 500 53 500 0.2522%
26.06.2017 26.06.2017 D 562 0.00 0.01 0.0026% 562 52 938 52 938 0.2495%
28.06.2017 30.06.2017 P 2 040 348.99 0.01 0.0096% 2 040 54 978 54 978 0.2592%
29.06.2017 03.07.2017 P 995 348.52 0.01 0.0047% 995 55 973 55 973 0.2639%
30.06.2017 04.07.2017 P 1 000 354.28 0.01 0.0047% 1 000 56 973 56 973 0.2686%
03.07.2017 03.07.2017 D 209 0.00 0.01 0.0010% 209 56 764 56 764 0.2676%
03.07.2017 05.07.2017 P 1 800 354.61 0.01 0.0085% 1 800 58 564 58 564 0.2761%
04.07.2017 06.07.2017 P 35 342.05 0.01 0.0002% 35 58 599 58 599 0.2762%
05.07.2017 05.07.2017 D
40 81.00 0.01
0.0009% 192 58 407 58 407 0.2753% 72 81.82 0.01
80 223.50 0.01
05.07.2017 07.07.2017 P 1 800 342.94 0.01 0.0085% 1 800 60 207 60 207 0.2838%
06.07.2017 10.07.2017 P 1 600 343.25 0.01 0.0075% 1 600 61 807 61 807 0.2914%
07.07.2017 11.07.2017 P 2 200 351.71 0.01 0.0104% 2 200 64 007 64 007 0.3017%
12.07.2017 14.07.2017 P 289 355.89 0.01 0.0014% 289 64 296 64 296 0.3031%
17.07.2017 17.07.2017 D 53 0.00 0.01 0.0002% 53 64 243 64 243 0.3028%
17.07.2017 19.07.2017 P 1 611 366.04 0.01 0.0076% 1 611 65 854 65 854 0.3104%
18.07.2017 20.07.2017 P 1 329 370.15 0.01 0.0063% 1 329 67 183 67 183 0.3167%
19.07.2017 21.07.2017 P 1 981 370.90 0.01 0.0093% 1 981 69 164 69 164 0.3260%
21.07.2017 25.07.2017 P 2 000 363.97 0.01 0.0094% 2 000 71 164 71 164 0.3355%
24.07.2017 24.07.2017 D 159 0.00 0.01 0.0007% 159 71 005 71 005 0.3347%
24.07.2017 26.07.2017 P 2 400 371.41 0.01 0.0113% 2 400 73 405 73 405 0.3460%
25.07.2017 25.07.2017 D 100 223.50 0.01 0.0005% 100 73 305 73 305 0.3456%
25.07.2017 27.07.2017 P 867 370.22 0.01 0.0041% 867 74 172 74 172 0.3496%
26.07.2017 28.07.2017 P 318 373.50 0.01 0.0015% 318 74 490 74 490 0.3511%
27.07.2017 31.07.2017 P 2 364 373.94 0.01 0.0111% 2 364 76 854 76 854 0.3623%
02.08.2017 04.08.2017 P 2 400 369.19 0.01 0.0113% 2 400 79 254 79 254 0.3736%
03.08.2017 03.08.2017 D 76 0.00 0.01 0.0004% 76 79 178 79 178 0.3732%
03.08.2017 07.08.2017 P 2 400 370.81 0.01 0.0113% 2 400 81 578 81 578 0.3845%
04.08.2017 08.08.2017 P 1 500 369.98 0.01 0.0071% 1 500 83 078 83 078 0.3916%
06.08.2017 08.08.2017 P 1 550 370.88 0.01 0.0073% 1 550 84 628 84 628 0.3989%
08.08.2017 10.08.2017 P 1 600 367.53 0.01 0.0075% 1 600 86 228 86 228 0.4065%
23.08.2017 25.08.2017 P 1 088 376.39 0.01 0.0051% 1 088 87 316 87 316 0.4116%
24.08.2017 28.08.2017 P 218 380.00 0.01 0.0010% 218 87 534 87 534 0.4126%
25.08.2017 29.08.2017 P 1 625 379.99 0.01 0.0077% 1 625 89 159 89 159 0.4203%
31.08.2017 04.09.2017 P 2 000 357.71 0.01 0.0094% 2 000 91 159 91 159 0.4297%
01.09.2017 05.09.2017 P 2 313 369.81 0.01 0.0109% 2 313 93 472 93 472 0.4406%
04.09.2017 06.09.2017 P 2 248 364.95 0.01 0.0106% 2 248 95 720 95 720 0.4512%
05.09.2017 07.09.2017 P 2 200 365.74 0.01 0.0104% 2 200 97 920 97 920 0.4616%
08.09.2017 12.09.2017 P 2 059 355.75 0.01 0.0097% 2 059 99 979 99 979 0.4713%
11.09.2017 13.09.2017 P 1 841 349.49 0.01 0.0087% 1 841 101 820 101 820 0.4800%
In the period between issuing last financial report (May 18th, 2017) and the day of publication of this report
AmRest purchased a total of 82 959 own shares for a total price of approximately PLN 29 663 357. During the
same period, the Company disposed a total of 20 071 own shares to entitled participants of the stock options plans.

II- 7
3.5. Other information on shareholding
The Management Board of AmRest does not know of any holders of securities which give special rights
of control over the Company.
4. Information about remuneration and share option held by members of the
Company's management and supervisory bodies for the period of 6 months,
ending June 30th, 2017.
REMUNERATION OF THE PARENT COMPANY’S MANAGEMENT BOARD FOR THE PERIOD OF
6 MONTHS ENDED JUNE 30TH, 2017
The period in the
office during 6
months ended June
30th, 2017
Salaries and
wages
Annual
bonus,
industry
awards
Income from
subsidiaries and
associates
Benefits,
income
from other titles
Total income
during 6 months
ended June 30th,
2017
Members of the Management Board as at June 30th, 2017.
Wojciech Mroczyński 1.01 - 30.06.17 528 134 132 033 660 167 8 212 668 379
Mark Chandler 1.01 - 30.06.17 710 355 177 589 887 944 0 887 944
Drew O'Malley 1.01 - 30.06.17 606 000 151 500 757 500 13 312 770 812
Jacek Trybuchowski 1.01 - 01.02.17
and 30.06.2017 84 934 21 233 106 167 0 106 167
Oksana Staniszewska 1.01 - 30.06.17 368 750 92 188 460 938 0 460 938
Olgierd Danielewicz 1.01 - 30.06.17 366 667 91 667 458 333 0 458 333
Total 2 664 839 666 210 3 331 049 21 524 3 352 573
REMUNERATION OF THE PARENT COMPANY’S SUPERVISORY BOARD FOR THE PERIOD OF
6 MONTHS ENDED JUNE 30TH, 2017
The period in
the office during
6 months ended
June 30th, 2017
Remuneration for
the time of holding
the function in the
Supervisory Board
Income
from
other
contracts
Other
benefits
Total income
during 6 months
ended June 30th,
2017
Commentary
Henry McGovern 1.01 - 30.06.17 158 494 1 297 820 - 1 456 314
José Parés Gutiérrez 1.01 - 30.06.17 158 494 - - 158 494
Luis Miguel Álvarez Pérez 1.01 - 30.06.17
158 494 - - 158 494
Steven Kent Winegar
Clark 1.01 - 30.06.17 - -
180 003
180 003 Voluntary waived the compensation
Carlos Fernandez
Gonzalez 1.01 - 30.06.17 158 494 - - 158 494
Pablo Castilla Repáraz 1.01 - 30.06.17 211 325 - - 211 325
Mustafa Ogretici 1.01 - 30.06.17 211 325 - - 211 325
1 056 625 1 297 820 180 003 2 534 448

II- 8
INFORMATION ON THE EMPLOYEE OPTION PROGRAM REGARDING THE MANAGEMENT DURING
6 MONTHS ENDED JUNE 30TH, 2017
The period in
the office
during 6
months ended
June 30th, 2017
Function
*
Number of
share
options as
at
December
31st, 2016
Number of
share options
granted in
the first half
of 2017
Number of share
options used in
the first half of
2017
Number
of share
options as
at June
30th, 2017
Number
of vested
options
The fair value
of all options as
at the moment
of their
granting (PLN
‘000)
Henry McGovern 1.01 - 30.06.17 S 216 666 75 000 10 000 281 666 206 666 10 315
Wojciech
Mroczyński 1.01 - 30.06.17 M 36 667 50 000 36 667 50 000 - 2 772
Mark Chandler 1.01 - 30.06.17 M 40 000 - - 40 000 40 000 943
Drew O'Malley 1.01 - 30.06.17 M 46 667 - 46 667 - - -
Jacek Trybuchowski 1.01 - 1.02.17 i
30.06.17 M - - - - - -
Oksana
Staniszewska 1.01 - 30.06.17 M 10 420 50 000 2 020 58 400 1 700 3 515
Olgierd Danielewicz 1.01 - 30.06.17 M 8 000 50 000 - 58 000 - 3 603
* (M) member of management body, (S) member of the supervisory body
5. Information on significant proceedings related to AmRest Holdings SE or other
group companies
As at the date of release of this quarterly report no court arbitration or administrative proceedings which single or
aggregate value exceeds 10% of the of the Company’s equity were pending against the Company.
6. Composition of the Group
The current composition of the AmRest Group is presented in Note 1a of the Consolidated condensed interim
financial statements for the first half of 2017.
On February 21st, 2017 registered address of AmRest DE Sp. z o.o.& Co. KG was changed. New registered
address of company is Berlin (10117), Friedrichstrasse 191.
On February 24th, 2017 AmRest Holdings SE finalized the acquisition of minority shareholders shares owned in
Blue Horizon Hospitality Group PTE Ltd. Currently AmRest Holdings SE is sole member of Blue Horizon
Hospitality Group PTE Ltd.
On March 1st, 2017 new company LTP La Tagliatella Portugal Lda was registered within AmRest Group.
Shareholders of this company are AmRest Tag S.L.U. (74%) and AmRestavia S.L.U. (26%).
On March 6th, 2017 registered address of AmRest Adria d.o.o was changed. New registered address of company
is Croatia, Trstenicka 2 Street, (10 000) Zagreb.
On March 21st, 2017 new entity in the AmRest Holdings SE was registered – AmRest AT GmbH with registered
office in Wien, Austria.
On May 16th , 2017 AmRest Holdings SE finalized the acquisition of AmRest Topco SAS with registered office
in Paris, France.
On June 6th , 2017 registered address of AmRest Coffee SK s.r.o. was changed. New registered address of
company is Slovakia, Pajštúnska Street (851 02) Bratislava.
On June 16th , 2017 as a result of increase of share capital of AmRest OOO, AmRest sp. z o.o. holds 99.83% in
AmRest OOO.

II- 9
On July 28th, 2017 new entity in AmRest Holdings SE group was registered – AmRest Opco SAS with registered
in Paris, France.
AmRest Holdings SE has its seat in Wroclaw, Poland. Currently, the restaurants run by the Group are located in
Poland, the Czech Republic, Hungary, Russia, Romania, Serbia, Bulgaria, Croatia, Slovakia, Spain, France,
Germany, Portugal and China.
7. Loans and borrowings in the Group
Below table presents a summary of all the loans granted to related entities.
THE LOANS GRANTED TO RELATED ENTITIES
Lender Borrower Loan
currency
Capital value of loans
granted as of
30/06/2017
[PLN ‘000]
Total value of loans
granted as of
30/06/2017
[PLN ‘000]*
AmRest Kft OOO AmRest RUB 45 760 33 023
AmRest Capital ZRT AmRest DE EUR 35 925 36 383
AmRest Capital ZRT AmRest Coffee
Deutschland EUR 7 185 7 306
AmRest Capital ZRT Spanish companies EUR 527 375 535 272
AmRest Capital ZRT AmRest Kaffee Sp. z
o.o. EUR 150 041 153 058
AmRest Capital ZRT OOO AmRest EUR 72 654 74 959
AmRest Finance ZRT AmRest Sp. z o.o. PLN 19 966 23 511
SCM Sp. z o.o. Activita Sp. z o.o. PLN 95 100
AmRest Holdings SE
Blue Horizon
Hospitality Group PTE
Ltd.
USD 18 958 19 529
AmRest Holdings SE AmRest Coffee
Deutschland EUR 27 683 27 648
AmRest Holdings SE AmRest TopCo France
SAS EUR 3 786 3 819
AmRest Holdings SE AmRest Sp. z o.o. PLN 140 000 140 000
AmRest Holdings SE AmRest Sp. z o.o. EUR 23 641 23 935
AmRest Holdings SE AmRest Acquisition
Subsidiary Inc. EUR 141 142
AmRest Coffee SK s.r.o. AmRest AT GmbH EUR 634 635
Loans granted within Spanish companies EUR 89 200 102 636
* Including interest accrued by 30/06/2017, converted using the NBP rate as of 30/06/2017
8. Information on granted guarantees or sureties for credits or loans
During the period covered by this report, the Company its subsidiaries did not issue the guarantees or sureties in
respect of credits or loans value of which represents 10% or more of the Company’s equity.
9. Information on issues, redemption and repayment of debt securities
On June 27th, 2017 the Management Board of AmRest informed that the Company signed on June 26th, 2017 an
agreement concerning the issue of Schuldscheindarlehen („SSD”) debt instrument under German law for the total

II- 10
value of EUR 75 million. The expected date of incurring the liabilities was July 3rd, 2017. SSD issue was to be
aimed at diversification of AmRest’s debt financing sources. The proceeds will be used for the development of the
Company and refinancing of its debt.
On July 4th, 2017 the Management Board of AmRest informed that on July 3rd, 2017, as a result of the issue of
SSD debt instrument, the Company incurred liabilities for the total value of EUR 75 million (approximately PLN
318 million).
The SSD interest is fixed on the following tranches: EUR 45.5m - repayment due on July 1st, 2022 and EUR 20m
- repayment due on July 3rd, 2024. EUR 9.5m tranche was issued with variable interest rate and repayment date
of July 3rd, 2024.
The role of the Lead Arranger and Paying Agent was entrusted to Erste Group Bank AG with CaixaBank S.A. and
Bank Zachodni WBK S.A. acting as Co-lead Arrangers.
10. Information about transactions concluded by the Company with related parties
on non-market conditions.
During the period covered by this report, the Company or its subsidiaries did not conclude with related parties any
transaction on non-market conditions.
11. Information about events having a significant impact on the operations and
financial results of the Group
On May 30th, 2017 the Management Board of AmRest informed in regards to the RB 53/2017 dated March 27th,
2017, about signing on May 30th, 2017 the Amendment to Binding Head of Terms (“HoT”) determining the key
terms and conditions on, and subject to which, Yum Restaurants International Holding, Ltd (“YRIHL”) and Pizza
Hut Delivery Germany GmbH (“PH Delivery”) would be willing to proceed with a potential transaction with
AmRest, whereby the Company would become Pizza Hut master franchisee for Germany and acquire two Pizza
Hut delivery stores.
The Amendment extended the term of HoT, and simultaneously the period during which the agreements required
for the acquisition of the equity business from PH Delivery and the Master Franchise Agreement with YRIHL
were to be executed to July 31th, 2017. If the parties failed to execute the Agreements by that day, the HoT would
terminate immediately.
Remaining provisions of the HoT have not been changed.
On July 31st, 2017 the Management Board of AmRest announced signing and closing (“Completion”) on July
31st, 2017 of an Asset Purchase Agreement (“APA”) between AmRest DE Sp. z o.o. & Co. KG (subsidiary of
AmRest, “Buyer”) and Pizza Hut Delivery. As a result of the Completion the Buyer acquired two Pizza Hut
delivery restaurants in Dusseldorf. The purchase price amounted to EUR 1 (approx. PLN 4).
Additionally, AmRest and AmRest Kft. (subsidiary of AmRest) signed on July 31st, 2017 the Master Franchise
Agreement (“MFA”) with YRIHL. The MFA came into force on August 1st, 2017. According to the MFA AmRest
became the master-franchisee for 67 Pizza Hut Dine in, Express and Delivery restaurants operated by multiple
sub-franchisees in the German market. The Company, as the exclusive master-franchisee, gained the right to
granting the license to the third parties to operate Pizza Hut Dine in, Express and Delivery restaurants (sub-
franchise) in Germany, while ensuring a certain share of restaurants operated directly by the Company.
The MFA was granted for initial period of 10 years with an option of further prolongations upon the fulfillment of
certain terms and conditions.
In 2016 the network generated the system sales of approx. EUR 55m (PLN 239m) and consolidated revenues of
ca. EUR 4m (approx. PLN 17.4m).
II- 11
In order to facilitate the growth of scale of Pizza Hut business, YRIHL introduced an incentive mechanism
reducing certain fees incurred by AmRest under the MFA ("Reduced Fees"), provided that the Company meets
certain development obligations specified in the MFA.
Upon entry into force of the MFA AmRest is required to open and operate Pizza Hut Dine in, Express and Delivery
restaurants in accordance with the development schedule setting the minimum number of openings in the
subsequent years of the MFA’s term. If AmRest fails to meet the development obligations, YRIHL will have the
right to increase the Reduced Fees and change the terms or terminate the MFA. The Company's intention is to
open more than 150 Pizza Hut restaurants in the German market within 5 years.
On June 6th, 2017 the Management Board of AmRest informed about signing on June 5th, 2017 an Agreement
granting an option to enter into a Share Purchase Agreement (the “Option”) between OOO AmRest (AmRest
Russia), being 100% subsidiary of AmRest, and Svetlana Mikhailovna Popova aimed at acquisition by AmRest
Russia of 21 KFC restaurants operating in the Russian market (“KFC Business”).
The purchase price will be determined as at the day of the transaction closing.
Estimated revenues of the KFC Business in the year 2016 amounted to RUB 1 376 million (ca. PLN 98 million).
The parties of the Option intend to sign the Share Purchase Agreement and, consequently, close the transaction
within next couple of months. The Completion will be contingent upon some additional conditions, including
obtaining antitrust approvals, concluding additional agreements ensuring restaurants proper functioning after
Completion, and lack of the material adverse change (“MAC”).
In the opinion of the Management Board the transaction is a great opportunity to strengthen AmRest presence in
Russia, where the Company currently operates 120 KFC restaurants.
On June 9th, 2017 the Management Board of AmRest informed that on June 8th, 2017, in connection with new
regulations introducing mandatory rotation of statutory auditors in public-interest entities (provisions of the Act
of 11 May 2017 on statutory auditors, audit firms and public supervision (Journal of Laws 2017, Item 1089) and
Regulation (EU) No 537/2014 of the European Parliament and of the Council of 16 April 2014 on specific
requirements regarding statutory audit of public-interest entities and repealing Commission Decision
2005/909/EC), the Supervisory Board of AmRest appointed a resolution granting consent for:
1) termination by the Company’s Management Board - by the mutual agreement of the parties - of the agreement
with PricewaterhouseCoopers Sp. z o.o. with its seat in Warsaw, Al. Armii Ludowej 14, listed on the list of
registered auditors under no. 144 (“PWC”), i.e., the entity that under the agreement dated 18 June 2015 concluded
by the Company and PWC (“Agreement”) was entitled to examine the financial statements of the Company for
the years 2015 – 2017 (statutory auditor);
2) termination of PWC’s appointment as the statutory auditor examining the stand-alone and consolidated financial
statements of the Company for 2017 (along with the report and opinion) and issuing the report on review of the
stand-alone and consolidated financial statements of the Company for the period from 1 January to 30 June 2017.
In connection with the adoption of the above-mentioned resolution and based on the recommendation of the Audit
Committee, the Supervisory Board passed also a resolution selecting and appointing BDO Sp. z o.o. with its seat
in Warsaw, at Postępu 12, listed on the list of registered auditors under no. 3355, to conduct audit of the stand-
alone and consolidated financial statements of the Company for the years 2017 - 2019.
On June 14th, 2017 the Management Board of AmRest informed about termination by the mutual agreement of
the parties on the same day of the Agreement under which PricewaterhouseCoopers Sp. z o.o. with its seat in
Warsaw, Al. Armii Ludowej 14, listed on the list of registered auditors under no. 144 (“PWC”) was entitled to
examine the financial statements of the Company for the years 2015 – 2017.
The Agreement was terminated with effect from May 31st, 2017.

II- 12
On July 12th, 2017 the Management Board of AmRest informed with reference to the regulatory announcement
RB 43/2017 dated March 15th, 2017 about signing on July 12th, 2017 of the Framework Agreement between
AmRest (“Buyer A”) and KFC France SAS (“KFC France”, “Seller”). Under the terms of the Framework
Agreement (i) Buyer A was to acquire 42 equity restaurants run by KFC France in the French market, and (ii)
Seller and the Company were to sign a Development Agreement and Standard KFC International Franchise
Agreement for each restaurant.
Estimated purchase price is expected at ca. EUR 39.9 million (ca. PLN 169 million). Final purchase price will be
determined as at the day of the transaction closing.
Estimated revenues of the restaurants in the twelve months period ended on April 30th, 2017 amounted to EUR
99 million (ca. PLN 420 million).
It is the intention of the parties of the Framework Agreement that the closing of the transaction, including transfer
of ownership of KFC business and payment of the purchase price, shall occur till end of the year 2017 (the
“Completion”). The Completion is contingent upon some additional conditions, such as concluding additional
agreements ensuring restaurants proper functioning after Completion, and lack of the material adverse change
(“MAC”).
According to the Development Agreement to be signed before the Completion, AmRest intends to open about 150
KFC restaurants in the French market by end of 2023.
On July 28th, 2017 the Management Board of AmRest informed about a transfer proposal of the Company's
registered office from Poland to Spain. The Transfer will not impact the current Company's listing on the Warsaw
Stock Exchange S.A. The Company's share capital will not change either. However, the Company's Statute will
be changed, and the rights and obligations of shareholders will be governed by Spanish law.
Pursuant to Article 8(10) of the SE Regulation, the Transfer shall take effect on the date on which the Company is
registered by the relevant Commercial Registry ("Registro Mercantil") in Spain as a Spanish-registered Societas
Europaea, which registration is currently anticipated to take place at the beginning of February of 2018.
The appropriate documents such as the Transfer proposal, proposed New Statute and Management Board report
justifying the transfer were attached to the regulatory announcement RB 190/2017 dated July 28th, 2017.
On August 31st, 2017, with reference to the regulatory announcement RB 64/2017 dated April 1st, 2017, the
Management Board of AmRest announced signing on August 31st, 2017 the Shareholders Agreement (the “SHA”)
with Delivery Hero GmbH, based in Berlin, Germany (“Delivery Hero”), being execution of the Investment
Agreement (the “IA”) concluded by the Company, Delivery Hero and Restaurant Partner Polska Sp. z o.o., based
in Łódź, Poland („RPP”) on March 31st, 2017.
As a result, AmRest took over the newly issued shares in RPP – the operator of PizzaPortal.pl platform in Poland,
and became its majority shareholder, holding 51% of total number of RPP shares. The outstanding 49% of shares
remained in the possession of Delivery Hero.
The acquisition price for the 51% of shares in the RPP was agreed at PLN 10 million. In addition, the parties of
SHA committed to make investment in the RPP in the amount of PLN 14 million (PLN 7 million each) in the first
quarter of 2018.
All the conditions necessary for the completion of the transaction that were agreed by the parties of the Investment
Agreement have been fulfilled.
According to the IA, in the coming months AmRest will also start the partnership with Delivery Hero’s subsidiaries
in Czech Republic and Hungary - DameJidlo.cz and NetPincér.hu. Both platforms are the market leaders in online
food ordering industry.
PizzaPortal.pl, DameJidlo.cz and NetPincér.hu platforms are expected to significantly enhance the operation of
food delivery segment within AmRest.
II- 13
The Management Board of AmRest believes that the partnership with Delivery Hero will make the offer of
Company’s operated brands more accessible to new customers and substantially increase AmRest’s market share
in delivery segment. In the long term, this should have a positive impact on creating value for the Company’s
shareholders.
12. Information on dividends paid
During the period covered by the report, the Group paid a dividend to minority shareholder SCM s.r.o. in the
amount of PLN 100k.

II- 14
13. Results of the AmRest Group for Q2 20171
The consolidated semi-annual profit and loss account should be analysed only in connection with notes and
explanations, which constitute an integral part of the Consolidated condensed interim financial statements for the
first half of 2017.
THE CONSOLIDATED INCOME STATEMENT FOR THE 3 MONTHS ENDED JUNE 30TH, 2017 AND FOR
THE 3 MONTHS ENDED JUNE 30TH, 2016
In PLN ‘000 3 months ended 3 months ended
on June 30th, 2017 on June 30th, 2016
Revenue from restaurant operations 1 167 546 913 440
Revenue from franchising activities and other 75 595 63 615
Total revenue 1 243 141 977 055
Direct costs of restaurant operations:
Food product costs (336 192) (275 700)
Salaries and wages and related employee benefits (284 679) (207 271)
Costs of licence (franchise) fees (58 929) (45 522)
Rental costs and other operating expenses (359 207) (278 421)
Total costs of franchising activities and other (47 668) (41 687)
General and administrative expenses (99 521) (70 370)
Gain/(loss) on sale of non-financial non-current assets and
assets held for sale - -
Revaluation of assets (6 265) (7 502)
Other operating income (1 192 461) (922 267)
Total operating costs and expenses 11 364
4 206
Profit on operating activities 62 044
54 788
EBITDA 148 942 127 157
Financial expenses (16 899) (11 399)
Financial income 750 618
Share in profit (loss) of associates 46 -
Profit before income tax 45 941 44 007
Corporate income tax (11 722) (7 364)
Net profit on continued operations 34 219
36 643
Profit on discontinued operations - -
Net profit 34 219 36 643
1 The data has not been audited

II- 15
3 months ended on
June 30th, 2017 CEE
Western
Europe Russia China Not allocated Total
Revenues 616 788 389 881 149 632 72 745 14 095 1 243 141
Revenue from sales –
external customers 616 788 389 881 149 632 72 745 14 095 1 243 141
Operating profit, the segment
result 52 713 11 699 5 908 4 030 (12 306) 62 044
Financial income - - - - 750 750
Financial expenses - - - - (16 899) (16 899)
Share in profits of affiliated
entities - - - - 46 46
Corporate income tax - - - - (11 722) (11 722)
Total net profit/(loss) - - - - 34 219 34 219
The segment’s assets 1 193 360 1 717 214 339 762 204 765 76 933 3 532 034
Total assets 1 193 360 1 717 214 339 762 204 765 76 933 3 532 034
including goodwill 34 286 589 327 87 954 85 269 911 797 747
Deferred tax assets 28 621 2 462 - - 9 838 40 921
Liabilities of the segment 283 081 263 483 27 545 39 233 1 654 842 2 268 184
Depreciation of tangible
fixed assets 37 110 19 925 8 747 4 513 258 70 553
Depreciation of intangible
fixed assets 5 212 4 014 482 311 61 10 080
Capital expenditure 54 400 38 553 19 045 7 506 496 120 000
Asset write-down (3 215) 2 520 3 595 3 282 - 6 182
Write-down of trade
receivables 334 (417) - - - (83)
Inventories revaluation
write-down - 10 - - - 10
Other assets revaluation
write-down - 156 - - - 156

II- 16
3 months ended on
June 30th, 2016 CEE
Western
Europe Russia China Not allocated Total
Revenues 536 226 253 737 115 948 59 196 11 948 977 055
Revenue from sales –
external customers 536 226 253 737 115 948 59 196 11 948 977 055
Operating profit, the segment
result 41 334 17 842 4 516 (797) (8 107) 54 788
Financial income - - - - 618 618
Financial expenses - - - - (11 399) (11 399)
Share in profits of affiliated
entities - - - - - -
Corporate income tax - - - - (7 364) (7 364)
Total net profit/(loss) - - - - 36 643 36 643
The segment’s assets 1 155 144 1 622 630 349 756 208 186 121 152 3 456 868
Investments in affiliated
entities - - - - 888 888
Total assets 1 155 144 1 622 630 349 756 208 186 122 040 3 457 756
including goodwill 35 639 550 964 95 848 94 146 911 777 508
Deferred tax assets 32 343 2 090 - - 10 401 44 834
Liabilities of the segment 326 449 259 924 33 782 39 984 1 421 007 2 081 146
Depreciation of tangible
fixed assets 32 764 12 865 6 922 4 274 240 57 065
Depreciation of intangible
fixed assets 4 406 2 660 367 297 72 7 802
Capital expenditure 69 447 112 457 15 571 9 124 3 855 210 454
Asset write-down 1 151 2 729 2 795 1 159 - 7 834
Write-down of trade
receivables (296) - - - (392) (688)
Inventories revaluation
write-down - 36 - - - 36
Other assets revaluation
write-down 320 - - - - 320

III- 1
Part III Selected financial data
Selected financial data including the basic positions of the Consolidated condensed interim financial
statements for the first half of 2017, as at June 30th, 2017 and six months ended on that day.
in PLN '000
6 months 2017 in
PLN '000
6 months 2016
in PLN '000
6 months 2017
in EUR '000
6 months 2016
in EUR '000
Revenue from sales 2 390 541 1 835 276 559 793 420 323
Operating profit 102 107 109 941 23 910 25 179
Gross profit 74 457 89 404 17 436 20 476
Net profit 55 541 75 162 13 006 17 214
Net profit/(loss) attributable to non-
controlling interests 1 926 (857) 451 (196)
Net profit attributable to equity holders of
the parent company 53 615 76 019 12 555 17 410
Net cash flows from operating activities 158 467 164 025 37 108 37 566
Net cash flows from investing activities (323 808) (316 147) (75 826) (72 405)
Net cash flows from financing 184 168 188 901 43 127 43 263
Total net cash flows 18 827 36 779 4 409 8 423
Total assets 3 532 034 3 238 383 835 688 731 755
Total liabilities and provisions for liabilities 2 268 184 1 977 537 536 658 446 851
Long-term liabilities 1 328 695 1 416 250 314 372 320 020
Short-term liabilities 939 489 561 287 222 284 126 830
Equity attributable to equity holders of the
parent company 1 229 872 1 190 581 290 991 269 027
Non-controlling interests 33 978 70 265 8 039 15 877
Total equity 1 263 850 1 260 846 299 030 284 905
Share capital 714 714 169 161
Weighted average number of ordinary
shares (in pcs.) 21 213 893 21 213 893 21 213 893 21 213 893
Weighted average number of ordinary
shares used for calculation of diluted
earnings per share 21 213 893 21 213 893 21 213 893 21 213 893
Basic earnings per one ordinary share (in
PLN/EUR) 2.53 4 0.59 1
Diluted earnings per one ordinary share (in
PLN/EUR) 2.53 4 0.59 1
Declared or paid dividend per one share - - - -