Embed Size (px)
Citation preview

GENERATION OF AMPLITUDE MODULATION
Aim:
Generate different types of amplitude waveforms for various
modulation index.
Plot the graphs of all sequences thus generated.
SOFTWARE USED:
MULTISIM version 10.1
CIRCUIT DIAGRAM

DESCRIPTION OF THE IC
The AD633 is a functionally complete, four-quadrant, analog multiplier. It includes high impedance, differential X and Y inputs and a high
impedance summing input (Z). The low impedance output voltage is a
nominal 10 V full scale provided by a buried Zener. The AD633 is the first product to offer these features in modestly priced 8-lead plastic DIP
and SOIC packages. The AD633 is laser calibrated to a guaranteed total
accuracy of2% of full scale. Nonlinearity for the Y-input is typically less
than 0.1% and noise referred to the output is typically less than100 V
rms in a 10 Hz to 10 kHz bandwidth. A 1 MHz bandwidth,20 V/s slew
rate, and the ability to drive capacitive loads make the AD633 useful in a wide variety of applications where simplicity and cost are key concerns.
PROCEDURE:
1. The above circuit is implemented using the tools of
MULTISIM software.
2. The function generator corresponding to the carrier
and the message signal are connected at the right
positions.
3. The CRO is connected at the output of the circuit.
4. The modulation indices for various types of
modulation say, under modulation, 100% modulation
and Over modulation using the measuring prompt.
% of modulation index
max min
max min
100E E
mE E

Find the values for m at (50%) and (90%)
Design for m=
i. 0.5,0.9
ii. 0.4,0.8
iii. 0.3,0.7
iv. 0.2,0.6
CASE -1: When m=
max min
max min
100E E
mE E
CASE-2: When m=
max min
max min
100E E
mE E

Output Waveforms
when Am<1(under modulation)

when Am=1(100% modulation)
when Am>1(over
modulation)

RESULT:
The modulation indices, maximum and minimum values of the
modulated wave are calculated and the respective graph is
obtained.


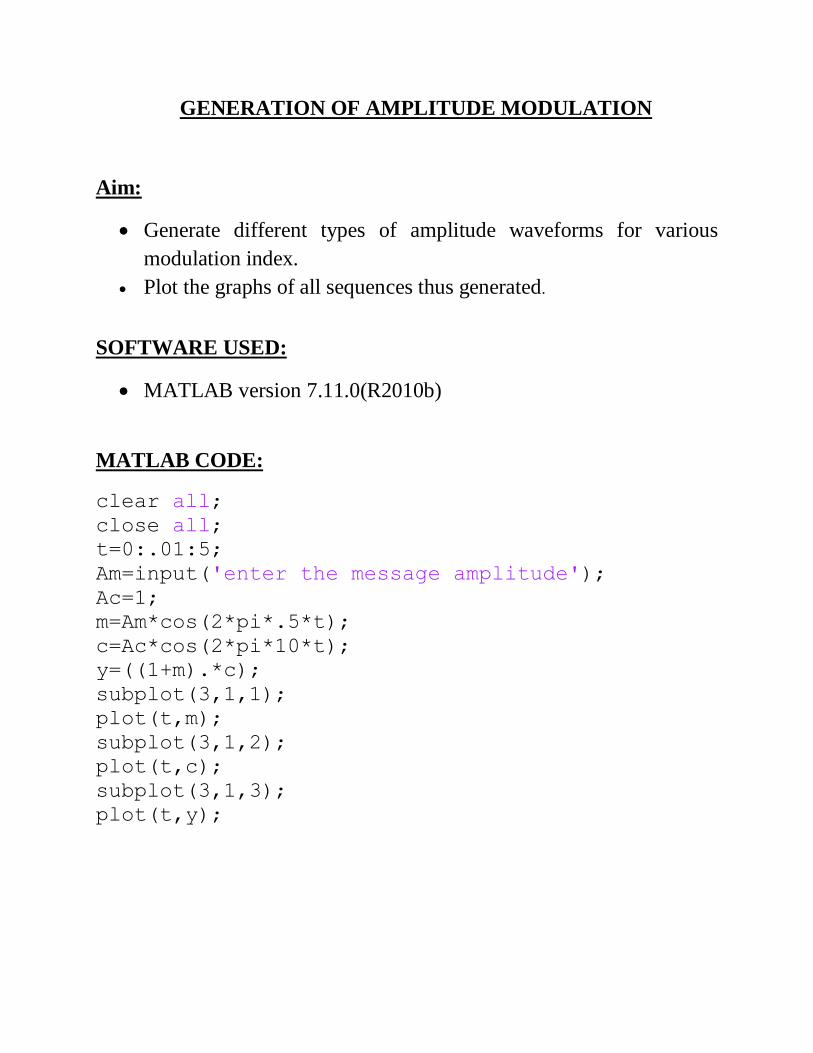
GENERATION OF AMPLITUDE MODULATION
Aim:
Generate different types of amplitude waveforms for various
modulation index.
Plot the graphs of all sequences thus generated.
SOFTWARE USED:
MATLAB version 7.11.0(R2010b)
MATLAB CODE:
clear all;
close all;
t=0:.01:5;
Am=input('enter the message amplitude');
Ac=1;
m=Am*cos(2*pi*.5*t);
c=Ac*cos(2*pi*10*t);
y=((1+m).*c);
subplot(3,1,1);
plot(t,m);
subplot(3,1,2);
plot(t,c);
subplot(3,1,3);
plot(t,y);

THEORY:
When represented in time domain:
Let the modulating wave be m(t).
m(t)=Amcos(2*pi*fm*t)
Let the high frequency wave or the carrier wave be c(t)
C(t)=Ac*cos(2*pi*fc*t)
If the modulating signal is represented as s(t), then
S(t)=Ac{1+Ka*m(t)}cos(2*pi*fc*t).
Where Ka=amplitude sensitivity.
PROCEDURE:
1. The code for the amplitude modulation is generated.
2. The generated code is executed in the MATLAB software.
3. The corresponding graphs for the various types of modulation
techniques are plotted.

Find the values for m at (50%) and (90%)
Design for m=
i. 0.5,0.9
ii. 0.4,0.8
iii. 0.3,0.7
iv. 0.2,0.6
CASE -1: When m=
max min
max min
100E E
mE E
CASE-2: When m=
max min
max min
100E E
mE E

Output Waveforms
when Am<1(under modulation)
when Am=1(100% modulation)

when Am>1(over modulation)
RESULT:
The graphs for various types of modulation say under modulation,
100% modulation and Over modulation are plotted.