Embed Size (px)
Citation preview

Amplitude Distribution of Calcium Sparks in Confocal Images: Theory andStudies with an Automatic Detection Method
Heping Cheng,* Long-Sheng Song,* Natalia Shirokova,# Adom Gonzalez,# Edward G. Lakatta,*Eduardo Rıos,# and Michael D. Stern**Laboratory of Cardiovascular Science, Gerontology Research Center, National Institute on Aging, National Institutes of Health,Baltimore, Maryland 21224; and #Department of Molecular Biophysics and Physiology, Rush University, Chicago, Illinois 60612 USA
ABSTRACT Determination of the calcium spark amplitude distribution is of critical importance for understanding the natureof elementary calcium release events in striated muscle. In the present study we show, on general theoretical grounds, thatcalcium sparks, as observed in confocal line scan images, should have a nonmodal, monotonic decreasing amplitudedistribution, regardless of whether the underlying events are stereotyped. To test this prediction we developed, implemented,and verified an automated computer algorithm for objective detection and measurement of calcium sparks in raw image data.When the sensitivity and reliability of the algorithm were set appropriately, we observed highly left-skewed or monotonicdecreasing amplitude distributions in skeletal muscle cells and cardiomyocytes, confirming the theoretical predictions. Thepreviously reported modal or Gaussian distributions of sparks detected by eye must therefore be the result of subjectivedetection bias against small amplitude events. In addition, we discuss possible situations when a modal distribution might beobserved.
INTRODUCTION
Excitation-contraction coupling in striated muscle takesplace by the release of stored calcium from the sarcoplasmicreticulum in response to depolarization of the sarcolemma,via calcium release channels, commonly referred to as ry-anodine receptors. In cardiac muscle it is clear that thisrelease is triggered by calcium-induced calcium release(CICR) (Fabiato, 1985), while in skeletal muscle it is be-lieved that an allosteric signal is transmitted to the releasechannels from sarcolemmal voltage sensors (reviewed byRıos and Pizarro, 1991; Schneider, 1994), possibly aug-mented by CICR (Jacquemond et al., 1991; Klein et al.,1996; Shirokova and Rı´os, 1997; Stern et al., 1997; see Rı´osand Stern, 1997 for a recent review). Several years ago,localized discrete calcium release events, termed “calciumsparks,” were discovered using the fluorescent calciumprobe fluo-3 with laser scanning confocal microscopy (M.Minsky, U.S. Patent #3013467, Microscopy Apparatus,1957; see Inoue´, 1995 for review), first in cardiac myocytes(Cheng et al., 1993; Lipp and Niggli, 1994; Cannell et al.,1994, 1995; Lo´pez-Lopez et al., 1994, 1995; see Cheng etal., 1993b for review) and later in frog skeletal muscle(Tsugorka et al., 1995; Klein et al., 1996). Generally, sparkshave been interpreted as stereotyped events, whose mor-
phology (spatial extent, duration, and amplitude) has beenused to infer release flux and the number of release channelsinvolved locally in release (Cheng et al., 1993; Cannell etal., 1994; Tsugorka et al., 1995; Klein et al., 1996; Go´mezet al., 1996; Shirokova and Rı´os, 1997; Blatter et al., 1997).In particular, the existence of single or multiple modes inspark amplitude histograms has been given special signifi-cance (Tsugorka et al., 1995; Klein et al., 1996; Luky-anenko et al., 1996; Shirokova and Rı´os, 1997; Xiao et al.,1997; Satoh et al., 1997). However, amplitude distributionsdetermined from confocal line scan images are distorted bya powerful sampling bias because sparks originate at vari-able distances from the scan line (Pratusevich and Balke,1996; Shirokova and Rı´os, 1997; Smith et al., 1998).
In this paper we first demonstrate on general grounds thatthe distribution of spark amplitude in line scan images mustbe monotonic (that is, without a mode). This generalizes theconclusion reached by Pratusevich and Balke (1996) and bySmith et al. (1998) in a more restricted case. Reportedmodes in amplitude histograms (Tsugorka et al., 1995;Klein et al., 1996; Lukyanenko et al., 1996; Shirokova andRıos, 1997; Xiao et al., 1997; Satoh et al., 1997) musttherefore have been caused by subjective detection biasagainst small amplitude events. Accordingly, we developedan automated algorithm to detect and measure sparks in linescan images without human intervention. We demonstratethe use of this algorithm in either skeletal or cardiac muscle,and confirm that the distribution of apparent amplitude (i.e.,observed peak fluorescence intensity) is, in fact, nonmodal.We characterize the detection efficiency and reliability (i.e.,true and false positive rates) of the algorithm on simulatedline scan images. The confocal sampling theory describedhere may also have general applications in light and electronmicroscopic morphological metrics.
Received for publication 27 May 1998 and in final form 10 November1998.
Address reprint requests to Heping Cheng, Ph.D., Laboratory of Cardio-vascular Science, Gerontology Research Center, NIA, National Institutesof Health, 5600 Nathan Shock Drive, Baltimore, MD 21224. Tel.: 410-558-8634; Fax: 410-558-8150; E-mail: [email protected].
Natalia Shirokova’s permanent address is The A. A. Bogomoletz Instituteof Physiology, Bogomoletz St. 4, Kiev, Ukraine.
© 1999 by the Biophysical Society
0006-3495/99/02/606/12 $2.00
606 Biophysical Journal Volume 76 February 1999 606–617

EXPERIMENTAL METHODS
Imaging calcium sparks in skeletal muscle
The methods used in experiments with skeletal muscle have been describedin detail (Shirokova and Rı´os, 1997). Briefly, segments of m. semitendi-nosus muscle fibers (fromRana pipiens, which were anesthetized in a 15%ethanol solution, then killed by pithing) were voltage-clamped in a two-Vaseline gap chamber on an inverted microscope (Axiovert 100, Zeiss,Germany) with a 403, 1.2 N.A. water immersion objective (c-Apochro-mat, Zeiss). A confocal microscope attachment (MRC 1000, Bio-Rad, MA)was used to scan the fluorescence of fluo-3 (Molecular Probes, Eugene,OR) (introduced by diffusion from the cut ends) along a line parallel to thefiber axis. Images representing the scanned intensity of fluorescence,F(x,t), as a function of position (x) along the scanned line and time (t), wereformed by collections of 768 intensities taken at 0.139-mm distances andrepeated every 2 ms. Shown are fluorescence intensity,F(x, t), or fluores-cence normalized to the initial intensityF0(x), obtained by averagingF0(x, t) before the depolarizing pulse.
The skeletal muscle solutions in the cut ends were “internal” (in mM):125 cesium glutamate, 10 Cs-HEPES, 5.5 Mg Cl2, 1.0 EGTA (nominal[Ca21] set to 100 nM), 0.1 fluo-3, 5 creatine-phosphate, 5 ATP, and 5glucose, pH 7.0. Separated from the cut ends by double Vaseline gaps, the“external” solutions were (in mM): 131.5 TEA-methane-sulfonate, 10TEA-HEPES, 10 calcium methanesulfonate, TTX (1024 g/l), pH 7.0, 17°C.
Cardiac calcium sparks
Ventricular cardiac myocytes were isolated from adult Sprague-Dawleyrats (2–3 months old, weight 225–300 g) using standard enzymatic tech-niques, as described previously (Spurgeon et al., 1990). After the enzy-matic treatment single cells were shaken loose from the heart and stored inHEPES buffer solution containing (in mM) 137 NaCl; 5.4 KCl; 1.2 MgCl2;1 NaH2PO4; 1 CaCl2; 20 glucose, and 20 HEPES (pH 7.4). Aliquots ofcells were loaded with fluo-3 by a 10-min incubation in 10 mM fluo-3 AMand then kept in the dark for up to 2 h until use.
Myocytes were imaged with a Zeiss LSM-410 inverted confocal mi-croscope (Carl Zeiss, Inc., Germany). All image data were taken in the linescan mode, with the scan line usually oriented along the long axis of themyocyte, avoiding cell nuclei. Each image consisted of 512 line scansobtained at 2.09-ms intervals, each comprising 512 pixels spaced at 0.156mm intervals. The microscope objective was a Zeiss Plan-Neofluar 403 oilimmersion N.A.5 1.3, and the confocal pinhole was set at the settingprescribed by the manufacturer to obtain spatial resolutions of 0.4mm inthe horizontal plane and 0.9mm in the axial direction. Image processing,data analysis, and presentation were done using the IDL software (Re-search Systems, Boulder, CO). Experiments were carried out at roomtemperature (20–22°C).
RESULTS
Theory of the amplitude histogram
Fig. 1 (modified from Shirokova and Rı´os, 1997) plots theimage of a spark, that is, the calculated intensity in imagespace of a centered spark, as a function of position in theyzplane (orthogonal to the scanning line). The image wascalculated by convolution of a Gaussian of half-width 0.7mm (crudely representing the distribution of Ca21:dye com-plex in a spark) and a confocal response function (Art andGoodman, 1993)
C~v, w! 5 SFsin~w/4!
~w/4! G2Fsin~wb/4!
~wb/4! G2FJ1~v!
v G2FJ1~vb!
vb G2
(1)
whereS is a scaling constant,J1 is the first-order Besselfunction, b is the ratio of excitation and detection wave-lengths,w andv arez andy coordinates in optical units (Artand Goodman, 1993), adjusted so that the half-widths ofC[w(z),v(y)] matched a measured point spread function(Pratusevich and Balke, 1996). Note that this function,which is a product of response functions in thexy plane andalong thezaxis, is only an approximation to the pointspreadfunction of the objective, but it is used here only for illus-trative purposes. Considered in object space, this functionalso represents the measured amplitude of a spark occurringat position (y, z) off the scanned line. Sparks are approxi-mately equally likely to originate at any point in a Z disk(because there is no information on the location of T tu-bules) (Shacklock et al., 1995; Cheng et al., 1996a; Tsug-orka et al., 1995; Klein et al., 1996). Thus, the cumulativeamplitude distribution (frequency of measured sparks ofamplitude,I) will be proportional to the area outside anelliptic region or resel where the intensity is.I (see Fig. 1).The amplitude probability density (observed as the ampli-tude histogram of detected events) is proportional to thearea bounded by two resels, where the amplitude increasesby dAmplitude. Fig. 2 shows the amplitude histogram gen-erated by the spark in Fig. 1.
Using numerical simulation and under specific assump-tions on spark formation mechanism, previous studies (Pra-tusevich and Balke, 1996; Smith et al., 1998; Izu et al.,1998) have shown that the histogram of spark amplitudeswould have no mode even if the underlying events arestereotypical. To find the general form of the amplitude
FIGURE 1 Line scan image of a spark. Theoretical image intensityprofile of a spark originating at the scanned point, as a function ofdisplacements relative to the center of calcium release in directionsy andz, perpendicular to the scanned line. As explained in the text, the graph canalso be interpreted as a plot of the amplitude reported for stereotypedsparks occurring at positionsy andz relative to the scanned line. The areaof the projected annulus measures the probability density of spark ampli-tude, if sparks are distributed randomly in the (yz) plane perpendicular tothe scan line. Modified from Shirokova and Rı´os, 1997.
Cheng et al. Ca21 Spark Amplitude Distribution 607

histogram, assume the intensity of a spark is given by afunction I(x, y, z). Because the scanning is along thex axis,only the dependence ony and z needs to be taken intoaccount. For simplicity we assume the dependency is thesame for bothy andz. That is, we describe the intensity asa function I(r), where r is the distance from the sparkcenter. Then, by the same argument given in Fig. 1, thenumber of sparks in an interval [I, I 1 dI] of detectionamplitudes will be proportional tordr (the area of the ringof radiusr). The probability density function is thereforegiven by
p~I! 5 2Ar~I!dr
dI(2)
wherer(I) is the inverse function ofI(r) [existent becauseI(r) is monotonic] andA is a proportionality constant.
A mode in the amplitude distribution will exist if thedensity is increasing or
d
dISrdr
dID , 0 (3)
which transforms to
dI
dr. r
d2I
dr2 (4)
This is a condition on the decay of the image with distance.It states that the second derivative of the decay has to belarge and negative, while the first, which is always negative,should not be too large. This says, roughly, that the sparkintensity must have a region of downward (convex) curva-ture (see Discussion and Appendix I). Spark fluorescence isproduced by diffusing chemical species originating from apresumed small source; the diffusion equation shows that
diffusion will tend to dissipate such curvature except in theregion of the source. Therefore, we do not expect sparkfluorescence profiles, which are roughly Gaussian in shape,to satisfy Eq. 4. Convolution with the microscopepointspread function (PSF), which is also similar to aGaussian, will not change this situation. We therefore con-clude that,if sparks originate at random positions in theplane perpendicular to the scan line, the observed ampli-tude histogram will be monotonically decreasing, without amode.
The above theoretical analysis on the global property ofspark amplitude distribution assumed stereotyped sparks.Generally, if there is an arbitrary distribution for the under-lying calcium release events,g(y), it would be “convolved”with the nonmodal amplitude distributions characteristic ofstereotyped sparks, which would not create a mode. Thisconclusion can be mathematically proven. Lettingf(x, y) bethe observed amplitude distribution for a stereotypical sparkcorresponding to a release intensityy, the necessary andsufficient condition forf(x, y) to be a monotonic decreasingfunction is that its partial derivative
fx~x, y! , 0 @x, y . 0 (5)
Let F(x) denote the compound spark amplitude distribution,which reflects the variations in intrinsic release events in-tertwined by the variations due to confocal sampling. ThenF(x) is given by
F~x! 5 E0
ymax
g~y! f ~x, y!dy (6)
Hence, its derivativeF9(x) is
F9~x! 5 E0
ymax
g~y!fx~x, y!dy (7)
Sincefx(x, y) , 0 andg(y) . 0 for y [ [0, ymax], we have
F9~x! , 0 (8)
Equation 8 indicates thatF(x) a monotonic decreasing func-tion, regardless of the exact shape ofg(y). A mode canappear because of the failure of the detector (human ormachine) to detect sparks of small amplitude. In this case,the histogram should be left-skewed, and the location of themode is determined by the threshold of detectability, ratherthan by the intrinsic properties of spark calcium releaseevents (see Fig. 7).
Automated spark detection algorithm
An automated spark detection algorithm was coded in theimage-processing language IDL (Research Systems, Boul-der, CO) (see Appendix II for a listing of the computerprogram). The strategy of the detection algorithm (Fig. 3) isto search for connected regions that are above the noise
FIGURE 2 Predicted amplitude histogram in a line scan. The histogramwas generated using the dependence of reported amplitude on position,shown in Fig. 2, and the assumption that sparks are generated at randomlocations in a Z disk. See text for details.
608 Biophysical Journal Volume 76 February 1999

level. Tentative spark regions are located as outliers relativeto the overall standard deviation of the fluorescence. Theseareas are then excised from the image, and the statistics ofthe remaining regions (presumed to have noise only) arecomputed again. Final spark regions are then selected bytheir excessive deviation from the noise distribution. Toavoid the multiple counting of single sparks that have mul-tiple peaks (because of noise), sparks are defined as con-nected areas that exceed a weak threshold condition, whilecontaining some points that exceed a strong threshold.These spark areas are also used to depict spark morphology.
Fig. 3 shows the four stages in the detection algorithm.Input: The algorithm is fully automated; the only parameterrequested from the user is a constant (Cri or Cri1) deter-mining the “threshold” for event detection.Normalizationof image:The spatial distribution of baseline fluorescencefor normalization is first estimated by averaging all scanlines (irrespective of local or global spark activity) and thencorrected by masking out potential spark regions. In theversion for voltage-clamp experiments, the user may selecta time interval where the baseline will be computed, so thatportions with high global [Ca21] can be avoided.Eventdetection:A spark is located by a pixel in which normalizedfluorescence is greater than the criterion. The criterion is
usuallym 1 Cri s, wherem ands refer to the mean valueand standard deviation, respectively. Two binary images atlevels ofm 1 2s andm 1 Cri s are generated. Sparks areidentified as islets in them 1 Cri s image and the spatio-temporal extent of each is determined by the dimensions ofthe corresponding islet in the2s image. A second criterion,m 1 Cri1, is used in voltage-clamp cases, and is explainedbelow. InMeasurement, lists of sparks, spatial and temporallocations, and amplitude are produced. Other measures ofextent (FWHM, full width at half-maximum; FDHM, fullduration at half-maximum; rise time) are also computed.Smoothing filter steps are omitted in this diagram. Fig. 4shows the images that are generated at intermediate steps inthis algorithm.
To assess the performance of the algorithm and optimizeparameters for its use, we synthesized test images thatconsisted of an average of 35 sparks from actual experi-ments with cardiomyocytes, variably scaled, added toGaussian noise whose mean and standard deviation matchedthose of actual line scan images. These test images werethen passed through the detection algorithm to determinethe number and apparent amplitude of the embedded sparkssuccessfully detected by the algorithm, and the number offalse detections in blank images containing only noise.Examples of true and false detections at different thresholdlevels are shown in Fig. 5.
The sensitivity of the algorithm (percent of sparks de-tected) and the rate of false positives are shown in Fig. 6 asa function of the amplitude of the spark for several values ofthe threshold criterion. In general, sensitivity decreased andspecificity (100% minus percent of detections that are false)increased with increasing threshold, as expected. For adirect comparison, we also tested the sensitivity and reli-ability of eye detection. The result suggests that detection by“well-trained” eyes has a sensitivity comparable to thecomputer detection atCri 5 3.8, but with higher reliability(Fig. 6). Because detectability increases with amplitude, theuse of a more stringent criterion produces greater under-counting at low amplitudes, creating an apparent mode inthe detected amplitude histogram whose position movesrightward (to higher amplitudes) as the detection criterionbecomes more stringent (Fig. 7). However, because of thepresence of noise, some low amplitude sparks may bedetected while others of higher amplitude are missed. Fur-thermore, because of the interaction of noise with the com-plicated nonlinearity of the algorithm, the estimated ampli-tude of sparks differs from the true amplitude (i.e., theamplitude estimation is biased), by an amount that dependsinversely on the amplitude (Fig. 8), so that the amplitude ofsmall sparks is over-reported.
It is noteworthy that at a given signal-to-noise (m/s)level, the rate of false detection (type I error) dependslargely on theCri. However,m/s is an important determi-nant for the magnitude of erroneous rejection (type II error).Using the amplitude-scaled averaged sparks as the testobjects (of a stereotyped shape but variable intensities), this
FIGURE 3 Flow chart of the spark detection and measurement algo-rithm. The stages of detection are described in the text. Intermediateimages generated at each stage are shown in Fig. 4.
Cheng et al. Ca21 Spark Amplitude Distribution 609

analysis shows thatCri 5 3.5 is close to ideal atm/s 5 3.0,in the sense of providing high sensitivity and reliability atthe same time.
Modified algorithm for use under voltage clampin skeletal muscle
Under voltage clamp conditions, particularly in skeletalmuscle, the nature of the raw image data is altered in twoways. First, during the active clamp step, there may be asmooth elevation of background fluorescence (Fig. 9), be-cause of abundant out-of-line release events, or to continu-ous release or release in unresolvable small events (Shi-rokova and Rı´os, 1997). Second, there is a time intervalbefore the start of the active clamp during which this time-varying background is known to be absent. Additionally, theresting fluorescence has notable periodic variations, coinci-dent with sarcomeric repeats. For these conditions, thealgorithm was modified (Fig. 10). The resting fluorescenceF0(x) was determined as a time average of the image fluo-rescenceF0(x, t) during the rest period before the pulse, andused for normalization. Sparks were then tentatively locatedand excised from the image, after which a time- and space-varying average fluorescence during the active period wascomputed. The final selection of sparks was made by acriterion of excess intensity over this varying background,usually by an absolute amount (in units ofDF/F0), rather
than relative to the standard deviation of the background.The human participation was again limited to setting athreshold.
The use of an absolute threshold criterion was warrantedbecauses changed with release intensity and global [Ca21],which increased during a depolarizing pulse. It changedwith release intensity presumably because of out-of-focussparks and nonspark release. It changed with [Ca21] be-cause fluorescence increases with [Ca21], and “back-ground” noise should largely follow Poissonian photonemission,s2 5 N, whereN refers to number of photons perpixel. Under these conditions, particularly when the sparkfrequency is high, use of a relative criterion,Cri s, impliedwidely different criteria for sparks at different voltages andeven during a single pulse. It should be noted that thecomputations before the final selection, which are integralcomponents of the algorithm, are essentially the same in thetwo versions of the spark detector. Both versions performedequally well when the spark frequency was,40 per imageand s did not change by more than twofold in a singleimage (data not shown).
The amplitude distribution of detected sparkshas no mode
An amplitude histogram of 127 sparks obtained from thesame skeletal muscle fiber held at265 mV (Fig. 11 A)
FIGURE 4 Intermediate outputs of the algorithm. (A) Normalized line scan confocal image of spontaneous calcium sparks. (B) Binary images for regionsabove (1, red) or below (0, black) m 1 2s. (C) Binary image at level ofm 1 Cri s (Cri 5 3.8). Detected spark events are marked by boxes in (B). (D)Detected events and fluorescence image.
610 Biophysical Journal Volume 76 February 1999

showed no evidence of a mode, consistent with the theoret-ical prediction above. In a larger set of image data obtainedin cardiac myocytes (n 5 38 cells), although a mode wasobserved, its position moved rightward as the detectioncriterion was made more stringent, and importantly, themode was always located near the 50% detection amplitude.As shown in Figs. 6 and 7, atCri 5 4.8, 4.2, 3.8, and 3.5,the 50% detectionDF/F0 level was 0.43, 0.39, 0.34, and0.31 (Fig. 6), respectively, while the mode occurs at 0.45,0.40, 0.35, 0.30 (Fig. 7), respectively. Moreover, atCri 53.5, the amplitude histogram of 2010 detected events washighly leftward skewed, and was monotonically decreasingexcept at the very left end, where the detectability is ex-tremely small (Figs. 6 and 7). Thus, the observed histogramsare perfectly consistent with the idea that the ideal observedamplitude distribution (i.e., in noise-free conditions) wouldbe nonmodal. As shown theoretically above, this distribu-
tion cannot be taken as evidence that the underlying calciumrelease events are heterogeneous; such a monotonic ampli-tude distribution would be expected even if the underlyingevents were perfectly stereotyped. However, we found thatthere was a low positive correlation among spark amplitude,duration, and width (Fig. 11,B and C, consistent withprevious data on cardiac sparks (Song et al., 1997). Thisstrongly suggests that there is a real variation in the char-acteristics of sparks, rather than just a difference in theirposition relative to the scan line, because width should benegatively correlated with amplitude if both were deter-mined by a single random variable (distance from scan line).Given that there is an intrinsic variation in underlyingrelease events, weak sparks can be produced not only byoff-center sampling, where the spatiotemporal spreading isexpected to be more diffusive, but also by small releaseevents, where the spreading might be expected to be more
FIGURE 5 Assessment of algorithm performance. (A) Average of 35 sparks used as test object (“standard spark”). (B) Test images formed adding thestandard spark at variably scaled intensity to background Gaussian noise with meanm 5 30 and standard deviations 5 10. (C) Location and relativeintensity of sparks shown in (B). Labels 1 to 10 refer to sparks ofDF/F0 5 0.6, 0.5, 0.4, 0.38, 0.3, 0.28, 0.25, 0.15, 0.2, and 0.1. (D–G) Sparks detectedat Cri 5 3.5 (D), 3.8 (E), 4.2 (F), and 4.8 (G). There are 9, 6, 5, and 4 events detected inD–G, respectively. The arrow in (D) indicates a false detection.Because of the presence of noise, detected sparks (e.g., #6 inF, #7 in G), may be dimmer than the ones that went undetected (e.g., #5 inF, #4 in G).
Cheng et al. Ca21 Spark Amplitude Distribution 611

confined in space and time. For this reason, the linearcorrelation analysis may not be used to infer quantitativerelations among spark parameters.
DISCUSSION
Calcium sparks provide a unique window on the localprocesses of excitation-contraction (EC) coupling. It iswidely expected that they will help distinguish betweendifferent theories of the EC coupling process, and that theirproperties will help determine how EC coupling is derangedin pathophysiologic states such as myocardial hypertrophy,heart failure, and malignant hyperthermia. To fulfill thispromise, it will be necessary to resolve such deceptivelysimple questions as how many release channels are involvedin the production of sparks, whether the time course and/or
amplitude of sparks is stereotyped, and how the spark re-lease flux depends on physiologic variables such as SRcalcium load. Unfortunately, the optimum method for de-tecting sparks, confocal fluorescence microscopy in linescan mode (Cheng et al., 1993), inherently produces acomplicated distortion of the amplitude of sparks because ofthe deviation of their centers from the confocal scan line(Cheng et al., 1993; Pratusevich and Balke, 1996; Shi-rokova and Rı´os, 1997; Smith et al. 1998; this study). Wehave shown theoretically and confirmed experimentally thatsparks, as observed through line scans, have a monotoni-cally decreasing amplitude distribution, regardless ofwhether the underlying events are stereotyped or not. Thus,to infer the nature of calcium sparks, it is important to take
FIGURE 6 Sensitivity and reliability. (A) “Sensitivity” or “detectability”(percent of sparks detected) versus spark amplitude at different criteria.The average results of eye detection by two coauthors (H.C. and L.S.) areshown by the crossed circles. The abscissa is plotted in bothDF/F0 ands/m(normalized noise level) units. Data were derived from the synthetic testimages (see text). (B) Reliability test. Rate of false detections were esti-mated from 120 blank images of 5123 512 pixels, with noise regeneratedfor every image. False detection events per image were shown forCri 53.5 (top) or 3.8 (bottom). There are totals of one and none false events atCri of 4.2 and 4.8, respectively (not shown). As the threshold is increased,reliability increases and sensitivity decreases. No false positives weredetected by eye in the reliability test.
FIGURE 7 Amplitude distribution of cardiac calcium sparks. 2010,1204, 847, or 632 spontaneous events were detected from 38 cells atCri 53.5, 3.8, 4.2, or 4.8. Reducing the criterion underscores the monotonicallydecaying character of the distribution. (False events were expected to be206 or 10% atCri 5 3.5, 43 or 3% atCri 5 3.8, 1 or 0.3% atCri 5 4.2,and 0% atCri 5 4.8).
FIGURE 8 Noise and measurement of spark amplitude. Observed versustrue spark amplitude.Dashed straight line:measured spark amplitude inthe absence of noise, which is 16% smaller than the true peak because ofsmoothing steps in our algorithm. Spark amplitude is increased by noise, inparticular for faint sparks. Note also the nonlinear relationship betweendetected and true spark amplitude at low amplitudes. Data were derivedfrom the synthetic test images (see text).
612 Biophysical Journal Volume 76 February 1999
into account confocal sampling theory in the context ofspecific statistical models of the spark generation process.This makes it all the more important that the method ofdetection be objective, and be capable of automated use tocount large numbers of sparks (to yield robust statistics).We have developed, tested, and implemented such an algo-rithm here. We found that our algorithm can be operated soas to detect 50% of the sparks of size of 0.31DF/F0 unit,which is approximately one unit of the scaled standarddeviation of the background noise (s/m 5 0.33) (Fig. 6).When applied to cardiac myocytes, it produced only 10%false positive detection, i.e., 90% specificity (Fig. 7). Byusing this algorithm, we find nearly twice as many sparks asare counted by eye (data not shown; Song et al., 1997).
Since false positives are biased toward small amplitudes(see Fig. 6B), it might be argued that the increased numberof small events detected by the automatic detector is theresult of false positives. However, our results suggest thatthis is unlikely the case. As shown in Fig. 7, atCri 5 3.8,there are 411 events detected atDF/F0 interval [0.25, 0.35].Assuming that 73% (Fig. 6B) of the estimated false posi-tives (150 of 206 events, see Fig. 7 legend) is in thisDF/F0
range, there should be 261 true spark events after correctionfor false detection, higher than the (uncorrected) modes atCri 5 3.8 (199), 4.2 (106), or 4.8 (78). If we further take thedetectability (;0.5 at DF/F0 5 0.3) into account, thereshould have been 520 sparks in thisDF/F0 range; that is, thenumber of observed events (411) onlyunderestimatesthenumber of true sparks. Thus, based on the demonstratedreliability of the method, we can be reasonably confidentthat these additional sparks, missed by human observers, arereal. The inclusion of these events, which are mostly ofsmall amplitude, reveals the nonmodal amplitude distribu-tion predicted by theory. This shows that counting by hu-
man observers is not only inefficient, but introduces over-whelming bias into the distribution of spark properties. Inparticular, the abscissa of modes found in human-countedamplitude histograms turns out to be of very little value. Themost reliable information is instead in the amplitude of thelarge sparks in an image, which may be interpreted as beingboth large (as object sparks) and in-focus. The significanceof this detected amplitude depends on whether the objectsparks are narrowly distributed, in which case the detectedamplitude is representative of true modal amplitude, orwidely distributed, in which case the large detected ampli-tudes can only be interpreted as outliers.
It should be pointed out that there are hypothetical andspecial experimental situations when a modal amplitudedistribution for stereotypical spark events could be ob-served. 1) We show in Appendix I that it is possible tospecify any amplitude histogram, including one with modes,and then construct a (hypothetical) spark intensity profilethat would give rise to the specified amplitude histogram.However, the intensity profiles (or PSF) required to producehistograms with modes are not realistic (Fig. 12). 2) Theo-retically, artifactual multimodal amplitude distributioncould be obtained if the release sites formed a regularlattice, as shown by Pratusevich and Balke (1996) in theirnumerical simulation. But this is also unlikely to occurinside the cells. Nevertheless, there are special experimentalconditions conducive to a modal distribution of a stereotyp-ical event. 3) LetA(r) be the relationship between thedetected amplitude of a spark (A) and the distance fromwhere it originates to the scanned region (r). In a nutshell,the reason why there are no modes in aline scanimage isthat the volume of space at a given distance increases withthe square power of the distance to the scanned line; thus thefrequency of sparks increases very rapidly as their detected
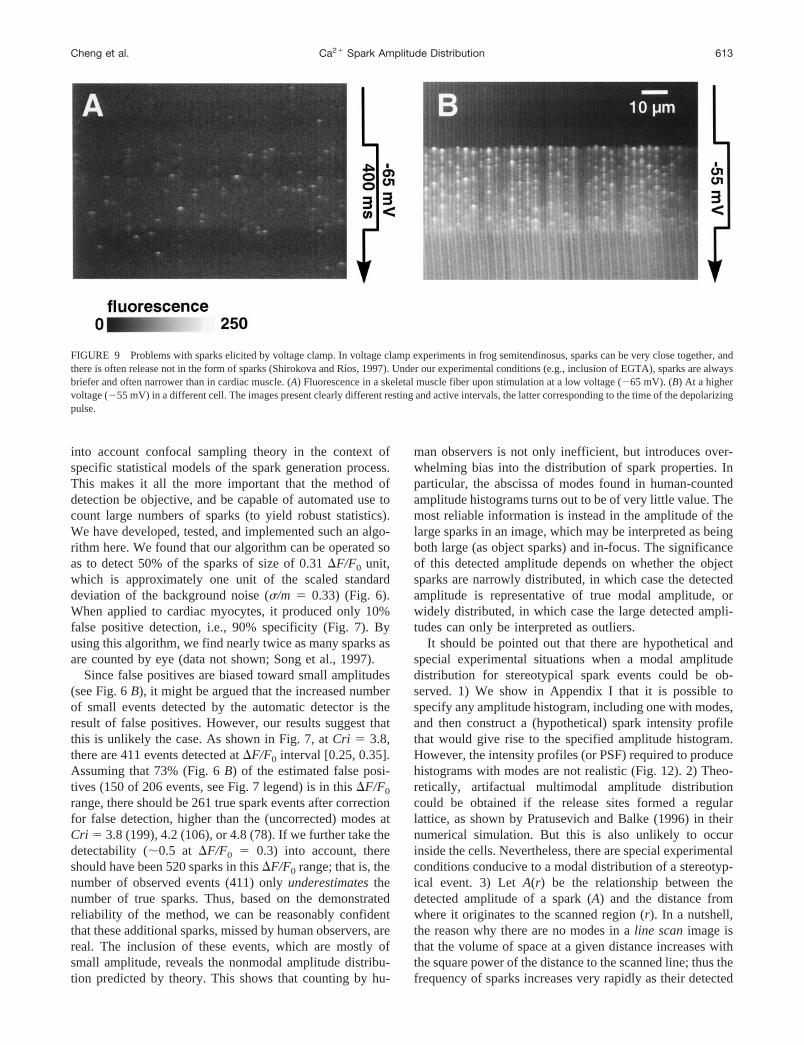
FIGURE 9 Problems with sparks elicited by voltage clamp. In voltage clamp experiments in frog semitendinosus, sparks can be very close together, andthere is often release not in the form of sparks (Shirokova and Rı´os, 1997). Under our experimental conditions (e.g., inclusion of EGTA), sparks are alwaysbriefer and often narrower than in cardiac muscle. (A) Fluorescence in a skeletal muscle fiber upon stimulation at a low voltage (265 mV). (B) At a highervoltage (255 mV) in a different cell. The images present clearly different resting and active intervals, the latter corresponding to the time of the depolarizingpulse.
Cheng et al. Ca21 Spark Amplitude Distribution 613
size decreases. In atime-resolved xy scanimage instead, thevolumes of space increases linearly with distance to thefocal plane. Thus it can be demonstrated, for perfectlystereotyped sparks, that the detected amplitude distributionin an xy scan would have a mode provided that thez axisPSF had an inflection point. 4) Finally, a modal distributioncan be observed if the assumption of random sampling isviolated and if spark amplitude is truly modal, e.g., smallsample statistics in conjunction with punctuated distributionof spark origin, or statistics for sparks originating from thesame, repetitively active sites (Cheng et al., 1993; Xiao etal., 1997; Parker and Wier, 1997; Klein et al., 1998).
Finally, it may be instructive to highlight some importantfeatures of our algorithm (Fig. 3 and Appendix II). Takingboth spatial and temporal properties of calcium sparks into
account, detection involves the following array-orientedcomputations: masking, spatiotemporal filtering, and con-nectivity in thex-t images. The spatial and temporal filters,with extents based upon the FWHM and FDHM character-istics of calcium sparks, were used at various stages of dataprocessing, to reject local extremes, to yield local average,and to reject single pixels or small islets in the rawCri sbinary masks. Thus, the decision rules involve a sequence ofcomputations rather than a simple threshold method. Theuse of the relative criterion (m 1 Cri s) appears to beconvenient when the event density is low, and the global[Ca21] does not increase, as it ensures that higher absolutethresholds are used for noisy images, so the number of falsepositives per image (type I error) remains the same. Itproved, however, inconvenient in situations whens is non-
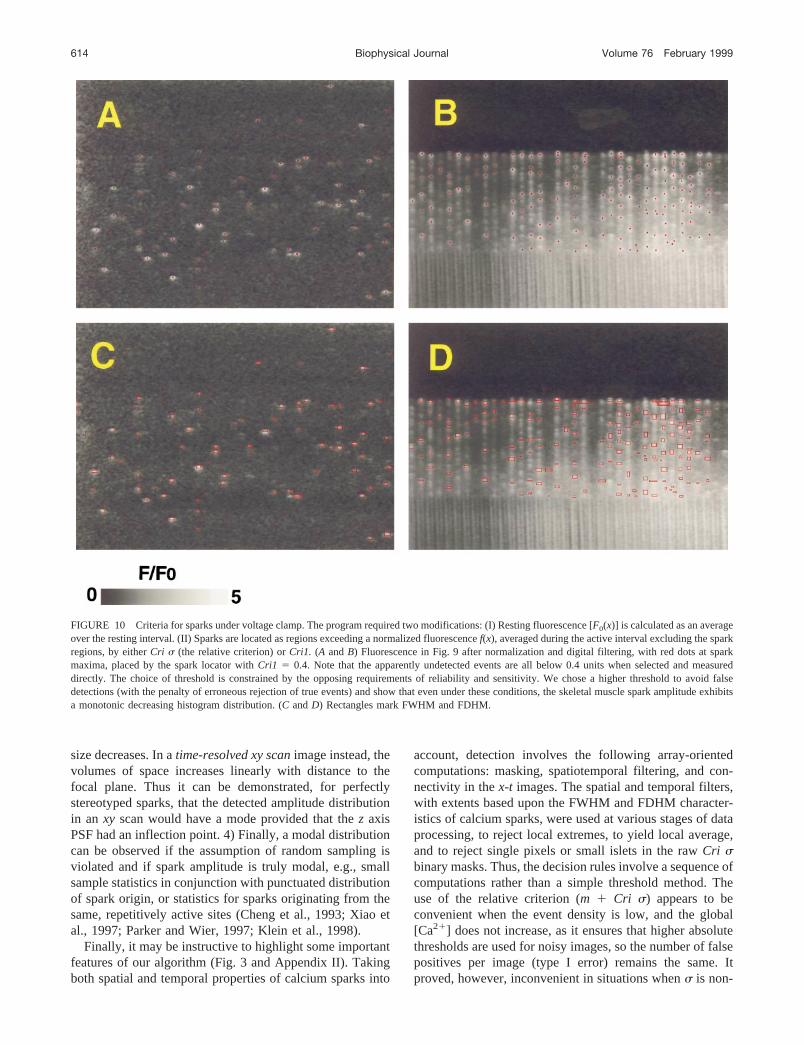
FIGURE 10 Criteria for sparks under voltage clamp. The program required two modifications: (I) Resting fluorescence [F0(x)] is calculated as an averageover the resting interval. (II) Sparks are located as regions exceeding a normalized fluorescencef(x), averaged during the active interval excluding the sparkregions, by eitherCri s (the relative criterion) orCri1. (A andB) Fluorescence in Fig. 9 after normalization and digital filtering, with red dots at sparkmaxima, placed by the spark locator withCri1 5 0.4. Note that the apparently undetected events are all below 0.4 units when selected and measureddirectly. The choice of threshold is constrained by the opposing requirements of reliability and sensitivity. We chose a higher threshold to avoid falsedetections (with the penalty of erroneous rejection of true events) and show that even under these conditions, the skeletal muscle spark amplitude exhibitsa monotonic decreasing histogram distribution. (C andD) Rectangles mark FWHM and FDHM.
614 Biophysical Journal Volume 76 February 1999
stationary because of local variations in release intensityand background [Ca21]. In those cases we opted for anabsolute criterion, as the relative one would result in widevariations of threshold within the same image and unaccept-able increases in the number of undetected events (type IIerror). With its inherently array-oriented design, our algo-rithm is also readily applicable to calcium spark data ob-tained by the time-resolvedxy scan technique (e.g., Tanakaet al., 1997). However, a more advanced algorithm could bedeveloped, explicitly making use of other spatial and tem-poral properties of the spark. Certainly, human observers,make use of such cues—“you know one when you see one.”It should be relatively easy to use, for example, their “fun-nel” appearance in line scan images. In developing suchimprovements it is possible, however, to introduce newsources of bias, particularly since the release process andreaction-diffusion interactions that produce the spark areincompletely understood at present (see Smith et al., 1998;Izu et al., 1998).
APPENDIX I
Construction of a spark fluorescence profile thatgenerates a specified amplitude histogram
Taking the reciprocal of Eq. 2 gives a differential equation for the sparkintensity profileI(r):
dI
dr5 2
Ar
p~I!(9)
This equation can be formally integrated to give the (implicit) solution:
EI
Imax
p~i! di 5r2
R2 (10)
whereA and the constant of integration have absorbed into the valuesImax,the peak intensity of the spark (atr 5 0), andR, the spark radius (at whichI 5 0). Given any proposed amplitude histogramp(i), the integral can beperformed and Eq. 10 solved forI as a function ofr, giving the sparkprofile which would generate that histogram. One case of particular interestis the Gaussian spark profile, which gives rise to the monotonic distributionp(I) 5 1/I for I , Imax. This may be verified most easily using Eq. 2.Adding a (normally distributed) peaked component to this distributiongives rise, via Eq. 10, to a “spark” profile with a hump on its descendinglimb (Fig. 12). In general, a mode in the amplitude histogram correspondsto a shoulder in the spark intensity profile. Clearly, such intensity profileswill not be produced by a diffusion process whose source is small com-pared to the diameter of the PSF of a properly aligned microscope.
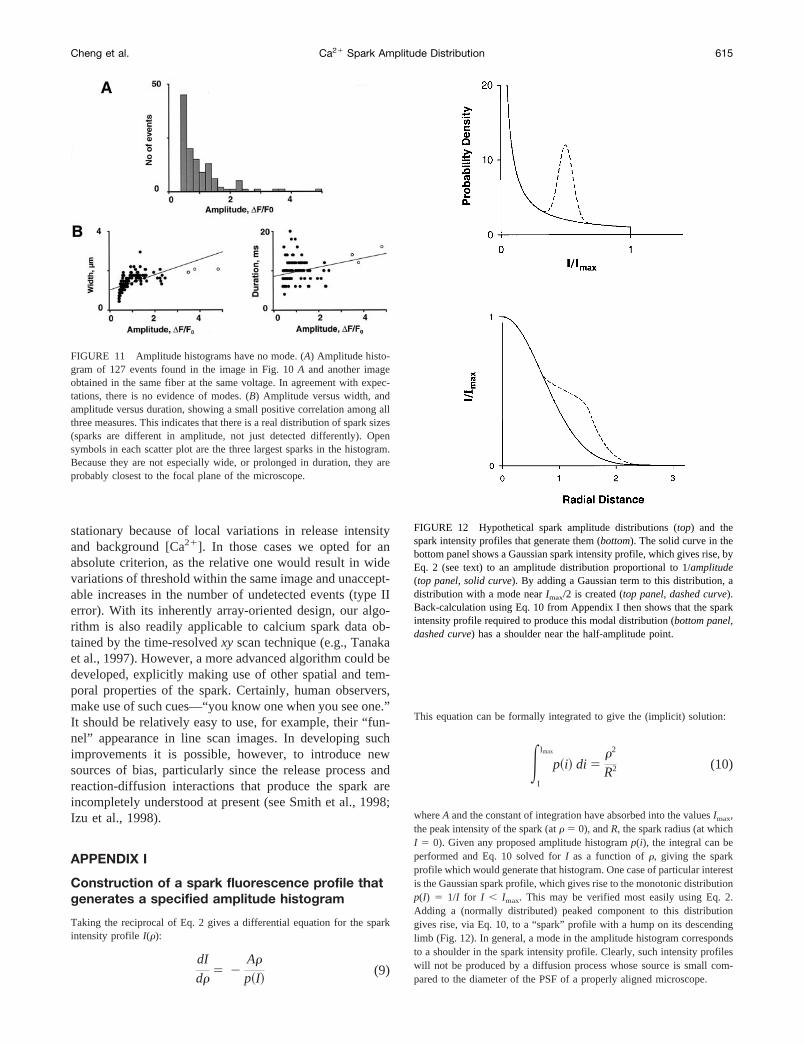
FIGURE 11 Amplitude histograms have no mode. (A) Amplitude histo-gram of 127 events found in the image in Fig. 10A and another imageobtained in the same fiber at the same voltage. In agreement with expec-tations, there is no evidence of modes. (B) Amplitude versus width, andamplitude versus duration, showing a small positive correlation among allthree measures. This indicates that there is a real distribution of spark sizes(sparks are different in amplitude, not just detected differently). Opensymbols in each scatter plot are the three largest sparks in the histogram.Because they are not especially wide, or prolonged in duration, they areprobably closest to the focal plane of the microscope.
FIGURE 12 Hypothetical spark amplitude distributions (top) and thespark intensity profiles that generate them (bottom). The solid curve in thebottom panel shows a Gaussian spark intensity profile, which gives rise, byEq. 2 (see text) to an amplitude distribution proportional to 1/amplitude(top panel, solid curve). By adding a Gaussian term to this distribution, adistribution with a mode nearImax/2 is created (top panel, dashed curve).Back-calculation using Eq. 10 from Appendix I then shows that the sparkintensity profile required to produce this modal distribution (bottom panel,dashed curve) has a shoulder near the half-amplitude point.
Cheng et al. Ca21 Spark Amplitude Distribution 615
The authors thank Harold Spurgeon and Bruce Ziman for technical supportand Amelia Morani for critical reading of this manuscript.
This work was supported by National Institutes of Health (NIH) intramuralresearch programs (to H.C., E.G.L., and M.D.S.); by grants from the NIHand the Muscular Dystrophy Association (to E.R.); and an NIH grant (toN.S.). A.G. was the recipient of a Senior Fellowship from the AmericanHeart Association of metropolitan Chicago.
REFERENCES
Art, J. J., and M. B. Goodman. 1993.In Cell Biological Applications ofConfocal Microscopy. B. Matsumoto, editor. Academic Press, Inc., NewYork. 47–77.
Blatter, L. A., J. Huser, and E. Rı´os. 1997. Sarcoplasmic reticulum Ca21
release flux underlying Ca21 sparks in cardiac muscle.Proc. Natl. Acad.Sci. U.S.A.94:4176–4181.
Cannell, M. B., H. Cheng, and W. J. Lederer. 1994. Spatial nonuniformitiesin [Ca21]i during excitation-contraction coupling in cardiac myocytes.Biophys. J.67:1942–1956.
Cannell, M. B., H. Cheng, and W. J. Lederer. 1995. The control of calciumrelease in heart muscle.Science. 268:1045–1049.
Cheng, H., W. J. Lederer, and M. B. Cannell. 1993. Calcium sparks:elementary events underlying excitation-contraction coupling in heartmuscle.Science. 262:740–744.
Cheng, H., M. R. Lederer, W. J. Lederer, and M. B. Cannell. 1996a.Calcium sparks and [Ca21]i waves in cardiac myocytes.Am. J. Physiol.270:C148–C159.
Cheng, H., M. R. Lederer, R.-P. Xiao, A. M. Go´mez, Y.-Y. Zhou, B.Ziman, H. Spurgeon, E. G. Lakatta, and W. J. Lederer. 1996b. Excita-tion-contraction coupling in heart: new insights from Ca21 sparks.CellCalcium.20:129–140.
Fabiato, A. 1985. Simulated calcium current can both cause calciumloading in and trigger calcium release from the sarcoplasmic reticulumof a skinned canine cardiac Purkinje cell.J. Gen. Physiol.85:291–320.
Gomez, A. M., H. Cheng, W. J. Lederer, and D. M. Bers. 1996. Ca21
diffusion and sarcoplasmic reticulum transport both contribute to[Ca21] i decline during Ca21 sparks in rat ventricular myocytes.J. Physiol. (Lond). 496:575–581.
Inoue, S. 1995. Foundations of confocal scanned imaging in light micros-copy. In Handbook of Biological Confocal Microscopy. J. B. Pawley,editor. Plenum Press, New York. 1–17.
Izu, L. T., W. G. Wier, and C. W. Balke. 1998. Theoretical analysis of theCa21 spark amplitude distribution.Biophys. J.75:1144–1162.
Jacquemond, V., L. Csernoch, M. G. Klein, and M. F. Schneider. 1991.Voltage-gated and calcium-gated calcium release during depolarizationof skeletal muscle fibers.Biophys. J.60:867–873.
Klein, M. G., H. Cheng, L. F. Santana, Y. H. Jiang, W. J. Lederer, andM. F. Schneider. 1996. Two mechanisms of quantized calcium release inskeletal muscle.Nature. 379:455–458.
Klein, M. G., A. Lacampagne, and M. F. Schneider. 1998. A repetitivegating mode of Ca21 sparks in skeletal muscle fibers.Biophys. J.74:269a. (Abstr.).
Lipp, P., and E. Niggli. 1994. Modulation of Ca21 release in culturedneonatal rat cardiac myocytes. Insight from subcellular release patternsrevealed by confocal microscopy.Circ. Res.74:979–990.
Lopez-Lopez, J. R., P. S. Shacklock, C. W. Balke, and W. G. Wier. 1994.Local, stochastic release of Ca21 in voltage-clamped rat heart cells:visualization with confocal microscopy.J. Physiol. (Lond). 480:21–29.
Lopez-Lopez, J. R., P. S. Shacklock, C. W. Balke, and W. G. Wier. 1995.Local calcium transients triggered by single L-type calcium channelcurrents in cardiac cells.Science. 268:1042–1045.
Lukyanenko, V., I. Gyo¨rke, and S. Gyo¨rke. 1996. Regulation of calciumrelease by calcium inside the sarcoplasmic reticulum in ventricularmyocytes.Pflugers Arch.432:1047–1054.
Parker, I., and W. G. Wier. 1997. Variability in frequency and character-istics of Ca21 sparks at different release sites in rat ventricular myocytes.J. Physiol. (Lond). 505:337–344.
616 Biophysical Journal Volume 76 February 1999

Pratusevich, V. R., and C. W. Balke. 1996. Factors shaping the confocalimage of the calcium spark in cardiac muscle cells.Biophys. J.71:2942–2957.
Rıos, E., and G. Pizarro. 1991. Voltage sensor of excitation-contractioncoupling in skeletal muscle.Physiol. Rev.71:849–908.
Rıos, E., and M. D. Stern. 1997. Calcium in close quarters: microdomainfeedback in excitation-contraction coupling and other cell biologicalphenomena.Annu. Rev. Biophys. Biomol. Struct.26:47–82.
Satoh, H., L. A. Blatter, and D. M. Bers. 1997. Effects of [Ca21]i, SR Ca21
load, and rest on Ca21 spark frequency in ventricular myocytes.Am. J. Physiol272:H657–H668.
Schneider, M. F. 1994. Control of calcium release in functioning skeletalmuscle fibers.Annu. Rev. Physiol.56:463–484.
Shacklock, P. S., W. G. Wier, and C. W. Balke. 1995. Local Ca21
transients (Ca21-sparks) originate at transverse tubules in rat heart cells.J. Physiol. (Lond). 487:601–608.
Shirokova, N., and E. Rı´os. 1997. Small event Ca21 release: a probableprecursor of Ca21 sparks in frog skeletal muscle.J. Physiol. (Lond).502:3–11.
Smith, G. D., J. E. Keizer, M. D. Stern, W. J. Lederer, and H. Cheng. 1998.A simple numerical model of calcium spark formation and detection incardiac myocytes.Biophys. J.In press.
Song, L.-S., M. D. Stern, E. G. Lakatta, and H. Cheng. 1997. Partialdepletion of sarcoplasmic reticulum calcium does not prevent calciumsparks in rat ventricular myocytes.J. Physiol. (Lond). 505:665–675.
Spurgeon, H. A., M. D. Stern, G. Baartz, S. Raffaeli, R. G. Hansford, A.Talo, E. G. Lakatta, and M. C. Capogrossi. 1990. Simultaneous mea-surement of Ca21, contraction, and potential in cardiac myocytes.Am. J. Physiol.258:H574–586.
Stern, M. D., G. Pizarro, and E. Rı´os. 1997. Local control model ofexcitation-contraction coupling in skeletal muscle.J. Gen. Physiol.110:415–440.
Tanaka, H., K. Nishimaru, T. Sekine, T. Kawanishi, R. Nakamura, K.Yamagaki, and K. Shigenobu. 1997. Two-dimensional millisecond anal-ysis of intracellular Ca21 sparks in cardiac myocytes by rapid scanningconfocal microscopy: increase in amplitude by isoproterenol.Biochem.Biophys. Res. Commun.233:413–418.
Tsugorka, A., E. Rı´os, and L. A. Blatter. 1995. Imaging elementary eventsof calcium release in skeletal muscle cells.Science. 269:1723–1726.
Xiao, R. P., H. H. Valdivia, K. Bogdanov, C. Valdivia, E. G. Lakatta, andH. Cheng. 1997. The immunophilin FK506-binding protein modulatesCa21 release channel closure in rat heart.J. Physiol. (Lond). 500:343–354.
Cheng et al. Ca21 Spark Amplitude Distribution 617

![Environmental Atomic Force and Confocal Raman Microscopies … · 2018-11-09 · Confocal Raman microscope [Witec GmbH; ] Confocal Raman microscopy: high resolution chemical mapping](https://img.dokumen.tips/doc/110x75/5fab2f45b37f971ef54300ff/environmental-atomic-force-and-confocal-raman-microscopies-2018-11-09-confocal.jpg)