Embed Size (px)
Citation preview

Type of Distribution to Consolidate: Orig & Dest Non-MODS/Non-BPI Office
Facility Name & Type:Street Address:
City: BemidjiState: MN
5D Facility ZIP Code: 56601District: Northland
Area: WesternFinance Number: 260770
Current 3D ZIP Code(s):Miles to Gaining Facility: 129
EXFC office: YesPlant Manager:
Senior Plant Manager:District Manager:
Facility Type after AMP: Post Office
Facility Name & Type:Street Address:
City:State: ND
5D Facility ZIP Code: 58102District: Dakotas
Area: WesternFinance Number: 373056
Current 3D ZIP Code(s):EXFC office: Yes
Plant Manager:Senior Plant Manager:
District Manager:
Start of Study: 9/18/2014
Date Range of Data: Jul-01-2013 : Jun-30-2014Processing Days per Year: 310
Bargaining Unit Hours per Year: 1,774EAS Hours per Year: 1,837
November 18, 2013
4/9/2015 15:46
Area Vice President:Vice President, Network Operations:
Area AMP Coordinator:HQ AMP Coordinator:
rev 09/12/2014Daniel Mahnke
566
Marty ChavezDarrell Stoke
Drew AlipertoDavid E. Williams
Anthony C. Williams
Fargo ND P&DC657 2nd Ave North
Paul Rowe
4. Other Information
John Holden
Fargo
565, 580-581, 584
2. Gaining Facility Information
Steve Murray
401 Irvine Ave NW
Brett Boysen
Date & Time this workbook was last saved:
3. Background Information
Date of HQ memo, DAR Factors/Cost of Borrowing/ New Facility Start-up Costs Update
----- AMP Data Entry Page -----
Bemidji MN CSMPC
1. Losing Facility Information
Package Page 1 AMP Data Entry Page

Losing Facility Name and Type:Street Address:
City, State:
Current 3D ZIP Code(s):
Type of Distribution to Consolidate:
Gaining Facility Name and Type:Current 3D ZIP Code(s):
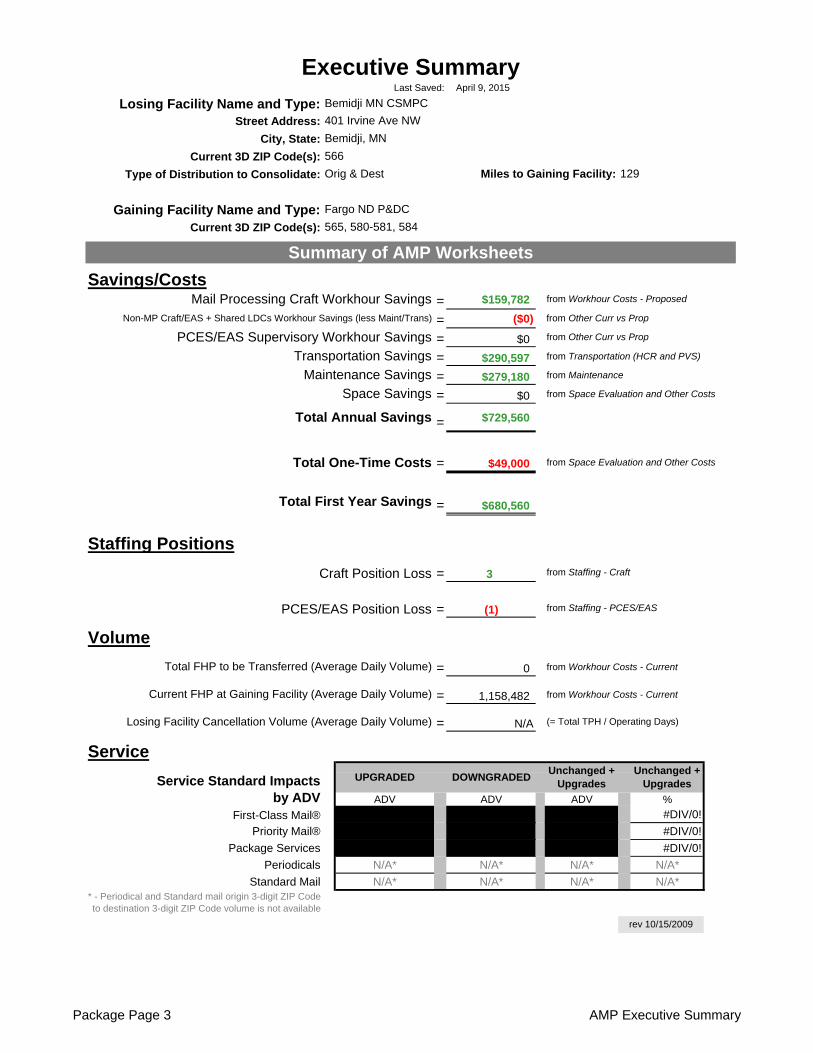
= $159,782
= ($0)
= $0
= $290,597 from Transportation (HCR and PVS)
= $279,180 from Maintenance
= $0 from Space Evaluation and Other Costs
= $729,560
= $49,000 from Space Evaluation and Other Costs
= $680,560
= 3 from Staffing - Craft
= (1) from Staffing - PCES/EAS
= 0 from Workhour Costs - Current
= 1,158,482 from Workhour Costs - Current
= N/A
ADV ADV ADV %
First-Class Mail® #DIV/0!
Priority Mail® #DIV/0!
Package Services #DIV/0!
Periodicals N/A* N/A* N/A* N/A*
Standard Mail N/A* N/A* N/A* N/A** - Periodical and Standard mail origin 3-digit ZIP Code to destination 3-digit ZIP Code volume is not available
Service
rev 10/15/2009
Total FHP to be Transferred (Average Daily Volume)
Current FHP at Gaining Facility (Average Daily Volume)
Losing Facility Cancellation Volume (Average Daily Volume) (= Total TPH / Operating Days)
Service Standard Impacts by ADV
UPGRADED DOWNGRADEDUnchanged +
Upgrades
Volume
Space Savings
Total Annual Savings
Total One-Time Costs
Total First Year Savings
Non-MP Craft/EAS + Shared LDCs Workhour Savings (less Maint/Trans) from Other Curr vs Prop
Staffing Positions
Craft Position Loss
PCES/EAS Position Loss
Fargo ND P&DC
565, 580-581, 584
Summary of AMP Worksheets
Unchanged + Upgrades
Executive SummaryLast Saved: April 9, 2015
Bemidji MN CSMPC
401 Irvine Ave NW
PCES/EAS Supervisory Workhour Savings from Other Curr vs Prop
Transportation Savings
Maintenance Savings
Savings/CostsMail Processing Craft Workhour Savings from Workhour Costs - Proposed
Bemidji, MN
566
Orig & Dest Miles to Gaining Facility: 129
Package Page 3 AMP Executive Summary
Losing Facility Name and Type:Current 3D ZIP Code(s):
Type of Distribution to Consolidate:
Gaining Facility Name and Type:Current 3D ZIP Code(s):
rev 06/10/2009
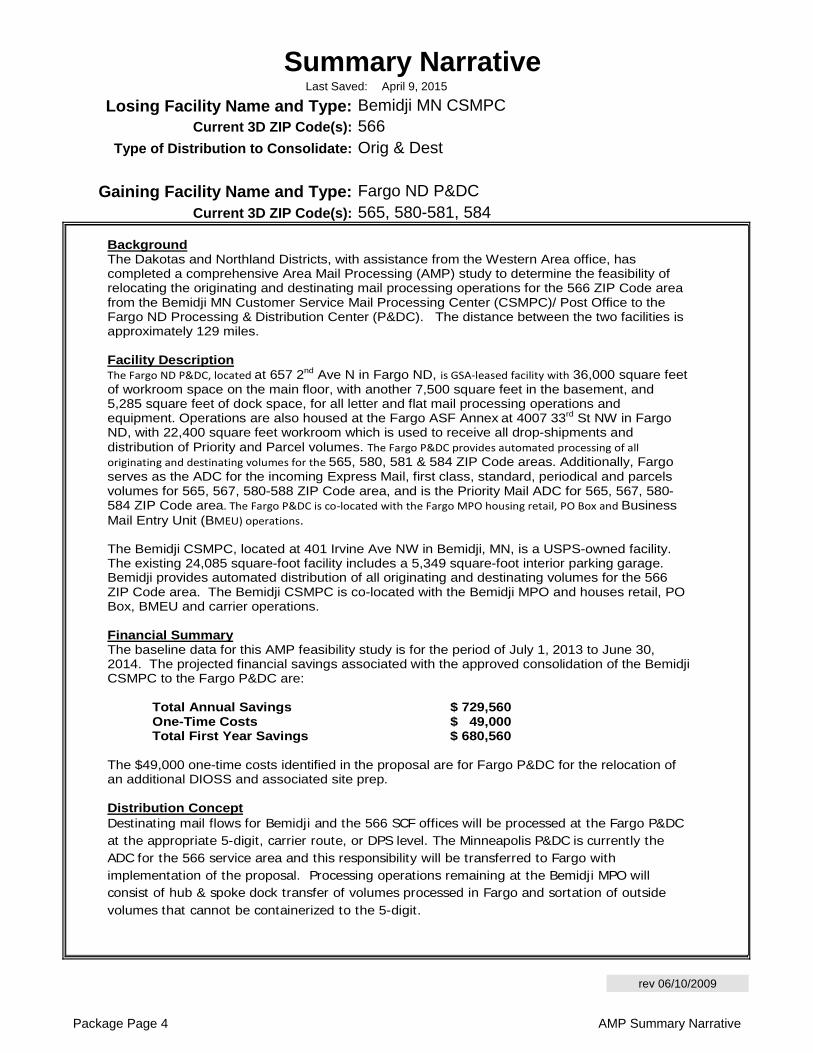
Summary NarrativeLast Saved:
Bemidji MN CSMPC
Fargo ND P&DC
566
April 9, 2015
565, 580-581, 584
Orig & Dest
Background The Dakotas and Northland Districts, with assistance from the Western Area office, has completed a comprehensive Area Mail Processing (AMP) study to determine the feasibility of relocating the originating and destinating mail processing operations for the 566 ZIP Code area from the Bemidji MN Customer Service Mail Processing Center (CSMPC)/ Post Office to the Fargo ND Processing & Distribution Center (P&DC). The distance between the two facilities is approximately 129 miles. Facility Description The Fargo ND P&DC, located at 657 2nd Ave N in Fargo ND, is GSA‐leased facility with 36,000 square feet of workroom space on the main floor, with another 7,500 square feet in the basement, and 5,285 square feet of dock space, for all letter and flat mail processing operations and equipment. Operations are also housed at the Fargo ASF Annex at 4007 33rd St NW in Fargo ND, with 22,400 square feet workroom which is used to receive all drop-shipments and distribution of Priority and Parcel volumes. The Fargo P&DC provides automated processing of all
originating and destinating volumes for the 565, 580, 581 & 584 ZIP Code areas. Additionally, Fargo serves as the ADC for the incoming Express Mail, first class, standard, periodical and parcels volumes for 565, 567, 580-588 ZIP Code area, and is the Priority Mail ADC for 565, 567, 580-584 ZIP Code area. The Fargo P&DC is co‐located with the Fargo MPO housing retail, PO Box and Business Mail Entry Unit (BMEU) operations.
The Bemidji CSMPC, located at 401 Irvine Ave NW in Bemidji, MN, is a USPS-owned facility. The existing 24,085 square-foot facility includes a 5,349 square-foot interior parking garage. Bemidji provides automated distribution of all originating and destinating volumes for the 566 ZIP Code area. The Bemidji CSMPC is co-located with the Bemidji MPO and houses retail, PO Box, BMEU and carrier operations. Financial Summary The baseline data for this AMP feasibility study is for the period of July 1, 2013 to June 30, 2014. The projected financial savings associated with the approved consolidation of the Bemidji CSMPC to the Fargo P&DC are:
Total Annual Savings $ 729,560 One-Time Costs $ 49,000 Total First Year Savings $ 680,560
The $49,000 one-time costs identified in the proposal are for Fargo P&DC for the relocation of an additional DIOSS and associated site prep. Distribution Concept Destinating mail flows for Bemidji and the 566 SCF offices will be processed at the Fargo P&DC at the appropriate 5-digit, carrier route, or DPS level. The Minneapolis P&DC is currently the ADC for the 566 service area and this responsibility will be transferred to Fargo with implementation of the proposal. Processing operations remaining at the Bemidji MPO will consist of hub & spoke dock transfer of volumes processed in Fargo and sortation of outside volumes that cannot be containerized to the 5-digit.
Package Page 4 AMP Summary Narrative

rev 06/10/2009
Summary Narrative (continued)
Summary Narrative Page 2
Customer Service Specific service standard changes associated with this Area Mail Processing consolidation arecontingent upon the resolution of both (a) the rulemaking in which current market dominantproduct service standards in 39 CFR Part 121 are being evaluated, and (b) all remaining AMPconsolidation proposals that are part of the same network rationalization initiative. A completefile reflecting any new service standards will be published at www.usps.com once all of the related AMP decisions that provide the foundation for new service standards are made. Priority and Express Mail service standards will be based upon the capability of the network. CollectionBox pickup times will not change.
The Bemidji CSMPC will be retained as the Bemidji MN Main Post Office. There will be no change to the current retail (window) operations or hours and availability times for Bemidji box customers will remain as current. Caller service and mail acceptance times, locations and hours will remain as current. Local Collection box pick up times will not change and a local postmark will continue to be available at retail service locations. The resources necessary to perform the Hub & Spoke functions assigned to the Bemidji MPO are provided for in the residual function four clerk positions. If the existing facility should be impacted in the future by other USPS initiatives, the remaining operations at the facility proposed in this study would be relocated to alternate quarters (new or existing) to provide the needed hub and spoke operation as well as retail, PO Box, BMEU and carrier services currently provided. The most remote Post Office currently served by the Bemidji PO is International Falls MN 56649. In order to meet the Fargo Operating Plan CET, the final collection times in the 566 area for 31 local collection boxes Monday-Friday would be changed from 5-85 minutes and from 5-130 minutes on Saturdays. Additionally, Monday-Friday 26 remotely located Post Offices would pull collections for final dispatch, 3 offices on Saturday, prior to their window close time. Employee and Staffing Impacts Pursuant to this approved study, it is anticipated that a total of nine (9) bargaining unit positions will be impacted from the Bemidji complement – six (6) clerk positions and three (3) maintenance positions. Fargo craft complement will increase by six (6) – four (4) clerk and two (2) mail handlers positions to support the volume transfer. There will be a no change in EAS position at Bemidji with AMP implementation. The AMP proposal identifies an increase of one (1) EAS position at Fargo with the filling of a vacant authorized Supervisor, Distribution Operations, in current Plant Staffing matrix.
Current On-Rolls
Proposed Diff Current On-Rolls
Proposed Diff
Craft 1 49 40 (9) 191 197 6 (3)Management 3 3 - 19 20 1 1
1 Craft = FTR+PTR+PTF+Casuals
Bemidji MN Fargo ND P&DC
Management and Craft Staffing Impacts
Net Diff
Package Page 5 AMP Summary Narrative

rev 06/10/2009
Summary Narrative Page 3
Summary Narrative (continued)
SDOs to Craft 1 MDOs+SDOs to Craft 1 SDOs to Craft 1 MDOs+SDOs to Craft 1
(1:25 target) (1:22 target) (1:25 target) (1:22 target)
Bemidji MN 1 : 8 1 : 8 1 : 10 1 : 10
Fargo ND P&DC 1 : 51 1 : 26 1 : 40 1 : 23
Mail Processing Management to Craft Ratio
Management
to Craft 2
Ratios
Current Proposed
2 Craft = F1 + F4 at Losing; F1 only at Gaining
1 Craft = FTR+PTR+PTF+Casuals
As a matter of policy, the Postal Service follows the Worker Adjustment and Retraining Notification Act’s (“WARN”) notification requirements when the number of employees experiencing an employment loss within the meaning of WARN would trigger WARN’s requirements. Some or all of the impacted employees described above may not experience an employment loss within the meaning of WARN due to transfers or reassignments. Transportation The transportation operating between the Fargo P&DC and Bemidji consists exclusively of Highway Contract Routes. It is proposed to utilize the Bemidji facility as the hub & spoke facility for originating and destinating volumes for the 566 ZIP Code area with minimal operations remaining to support the consolidation and dispatch of collection mail, inbound cross dock of mail, and sortation of outside parcels and standard & periodical direct bundles to HCR trip. The AMP feasibility study projects an annual savings of $290,597. All current HCRs based out of the Bemidji will remain with minor service schedule revisions to meet CET at Fargo except for HCR 58229 which will be terminated and replaced with new route 580XX with 2 daily round trips between Fargo and Bemidji. Trips servicing Bemidji on HCRs 566U1 and 553BA will be removed with implementation of the proposal. Equipment Relocation and Maintenance Impacts The AMP feasibility study projects an annual Maintenance savings of $279,180. The maintenance changes are driven by the removal of equipment at Bemidji. Additional equipment at Fargo is required and MPE relocation costs for Fargo are $15,000 for the relocation of a DIOSS. The additional APBS and LCTS shown are associated with the new Fargo ASF Annex DAR and unrelated to the AMP. One-time costs include the relocation of mail processing equipment as well as the facility modification and integration of the equipment to support the letter and flat automation process. Costs at the Fargo P&DC include site prep of $34,000. All site prep and facility related costs were provided by the Western FSO, for use in this study. The total one-time costs are $49,000 for this AMP proposal. SPACE IMPACTS If the AMP feasibility study is approved, the USPS-owned Bemidji MPO will remain as a dock transfer hub for the 566 delivery area and will continue to house retail, PO Boxes, BMEU and delivery operations. Any remaining excess space after reconfiguring to optimize mail flow and supervision will be identified to the WFSO for disposition. It is estimated that 5,371 square feet of space will be made available for other operations as a result of the AMP.
Package Page 6 AMP Summary Narrative
Losing Facility Name and Type:Current 3D ZIP Code(s):
Type of Distribution to Consolidate:
Gaining Facility Name and Type:Current 3D ZIP Code(s):
rev 04/2/2008
April 9, 2015
565, 580-581, 584
Orig & Dest
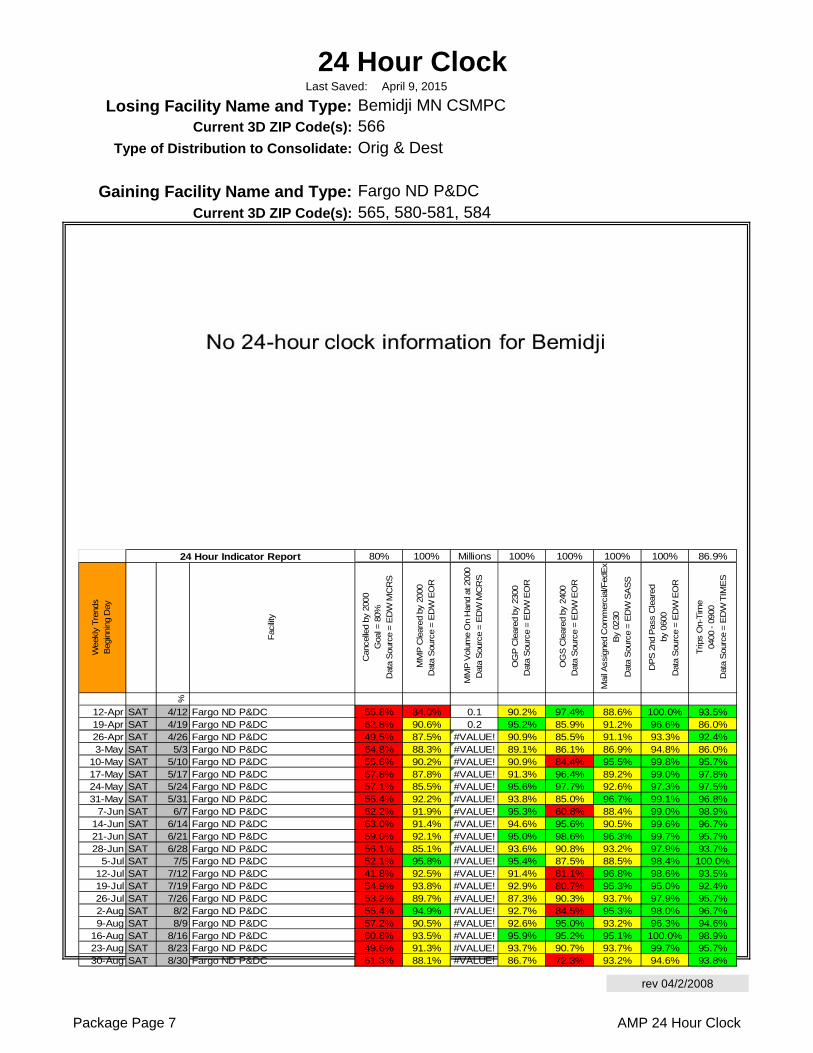
24 Hour ClockLast Saved:
Bemidji MN CSMPC
Fargo ND P&DC
566
80% 100% Millions 100% 100% 100% 100% 86.9%
Wee
kly
Tre
nds
Beg
inni
ng D
ay
Fac
ility
Can
celle
d by
200
0G
oal =
80%
Dat
a S
ourc
e = E
DW
MC
RS
MM
P C
lear
ed b
y 20
00D
ata
Sou
rce
= E
DW
EO
R
MM
P V
olum
e O
n H
and
at 2
000
Dat
a S
ourc
e = E
DW
MC
RS
OG
P C
lear
ed b
y 23
00D
ata
Sou
rce
= E
DW
EO
R
OG
S C
lear
ed b
y 24
00D
ata
Sou
rce
= E
DW
EO
R
Mai
l Ass
igne
d C
omm
erci
al/F
edE
xB
y 02
30D
ata
Sou
rce
= E
DW
SA
SS
DP
S 2
nd P
ass
Cle
ared
by 0
600
Dat
a S
ourc
e = E
DW
EO
R
Trip
s O
n-Tim
e04
00 - 0
900
Dat
a S
ourc
e = E
DW
TIM
ES
%
12-Apr SAT 4/12 Fargo ND P&DC 55.8% 84.0% 0.1 90.2% 97.4% 88.6% 100.0% 93.5%19-Apr SAT 4/19 Fargo ND P&DC 62.8% 90.6% 0.2 95.2% 85.9% 91.2% 96.6% 86.0%26-Apr SAT 4/26 Fargo ND P&DC 49.5% 87.5% #VALUE! 90.9% 85.5% 91.1% 93.3% 92.4%3-May SAT 5/3 Fargo ND P&DC 64.8% 88.3% #VALUE! 89.1% 86.1% 86.9% 94.8% 86.0%
10-May SAT 5/10 Fargo ND P&DC 55.6% 90.2% #VALUE! 90.9% 84.4% 95.5% 99.8% 95.7%17-May SAT 5/17 Fargo ND P&DC 57.8% 87.8% #VALUE! 91.3% 96.4% 89.2% 99.0% 97.8%24-May SAT 5/24 Fargo ND P&DC 57.1% 85.5% #VALUE! 95.6% 97.7% 92.6% 97.3% 97.5%31-May SAT 5/31 Fargo ND P&DC 55.4% 92.2% #VALUE! 93.8% 85.0% 96.7% 99.1% 96.8%
7-Jun SAT 6/7 Fargo ND P&DC 62.2% 91.9% #VALUE! 95.3% 60.8% 88.4% 99.0% 98.9%14-Jun SAT 6/14 Fargo ND P&DC 63.0% 91.4% #VALUE! 94.6% 95.6% 90.5% 99.6% 96.7%21-Jun SAT 6/21 Fargo ND P&DC 59.0% 92.1% #VALUE! 95.0% 98.6% 96.3% 99.7% 95.7%28-Jun SAT 6/28 Fargo ND P&DC 56.1% 85.1% #VALUE! 93.6% 90.8% 93.2% 97.9% 93.7%
5-Jul SAT 7/5 Fargo ND P&DC 52.1% 95.8% #VALUE! 95.4% 87.5% 88.5% 98.4% 100.0%12-Jul SAT 7/12 Fargo ND P&DC 41.8% 92.5% #VALUE! 91.4% 81.1% 96.8% 98.6% 93.5%19-Jul SAT 7/19 Fargo ND P&DC 54.9% 93.8% #VALUE! 92.9% 80.7% 95.3% 95.0% 92.4%26-Jul SAT 7/26 Fargo ND P&DC 53.2% 89.7% #VALUE! 87.3% 90.3% 93.7% 97.9% 95.7%2-Aug SAT 8/2 Fargo ND P&DC 55.4% 94.9% #VALUE! 92.7% 84.5% 95.3% 98.0% 96.7%9-Aug SAT 8/9 Fargo ND P&DC 57.2% 90.5% #VALUE! 92.6% 95.0% 93.2% 96.3% 94.6%
16-Aug SAT 8/16 Fargo ND P&DC 60.8% 93.5% #VALUE! 95.9% 95.2% 95.1% 100.0% 98.9%23-Aug SAT 8/23 Fargo ND P&DC 49.6% 91.3% #VALUE! 93.7% 90.7% 93.7% 99.7% 95.7%30-Aug SAT 8/30 Fargo ND P&DC 51.3% 88.1% #VALUE! 86.7% 72.3% 93.2% 94.6% 93.8%
24 Hour Indicator Report
Package Page 7 AMP 24 Hour Clock

Last Saved:
Losing Facility Name and Type:Current 3D ZIP Code(s):
Miles to Gaining Facility:
Gaining Facility Name and Type:Current 3D ZIP Code(s):
rev 03/20/2008
565, 580-581, 584
MAP
Bemidji MN CSMPC
Fargo ND P&DC
566
April 9, 2015
129
Package Page 8 AMP MAP

Overnight % Change All Others % Change Total % Change All % Change All % Change All % Change All % Change All % Change
UPGRADE 0.0% 0.03% 0.0% 9.4% 0.0% 0.0% 9.7% 0.2%
DOWNGRADE 0.0% 41.6% 41.6% 45.2% 0.0% 0.0% 0.5% 41.3%
TOTAL 0.0% 41.7% 41.7% 54.7% 0.0% 0.0% 10.2% 41.6%
NET UP+NO CHNG 0.0% -41.6% -41.6% -39.6% 0.0% 0.0% 10.2% -41.2%
VOLUME TOTAL
* - Periodical and Standard mail origin 3-digit ZIP Code to destination 3-digit ZIP Code volume is not available
Overnight % Change All Others % Change Total % Change All % Change All % Change All % Change All % Change All % Change
UPGRADE 0 0.0% 2 0.1% 2 0.1% 122 6.6% 394 21.2% 1,195 64.8% 37 2.0% 1,850 19.0%
DOWNGRADE 8 100.0% 193 10.5% 201 10.9% 935 50.7% 391 21.2% 50 2.7% 56 3.0% 1,633 17.7%
TOTAL 8 100.0% 195 10.6% 203 11.0% 1,057 57.4% 785 42.6% 1,245 67.6% 93 5.0% 3,383 36.7%
NET (8) 100.0% (191) -10.4% (199) -10.8% (813) -44.1% 3 0.2% 1,145 62.1% (19) -1.0% 117 1.3%
Service Standard Impacts
PRI ALL CLASSESSTD *FCM PER *
Based on report prepared by Network Integration Support dated:
Last Saved: April 9, 2015
Losing Facility: Bemidji MN CSMPC
565, 580-581, 584Gaining Facility 3D ZIP Code(s):Losing Facility 3D ZIP Code(s):
3/27/2015
566
PSVC
Service Standard Changes - Average Daily Volume (data obtained from ODIS is derived from sampling and may vary from actual volume)
rev 10/16/2009
Selected summary fields are transferred to the Executive Summary
PER STDFCM PRI PSVC ALL CLASSES
Service Standard Changes - Pairs
Package Page 9 AMP Service Standard Impacts

Last Saved: Stakeholder Notification Page 1
AMP Event: Start of Study
rev 07/16/2008
Bemidji MN CSMPC
Stakeholders Notification Losing Facility:
April 9, 2015(WorkBook Tab Notification - 1)
Package Page 10 AMP Stakeholders Notification
Last Saved:
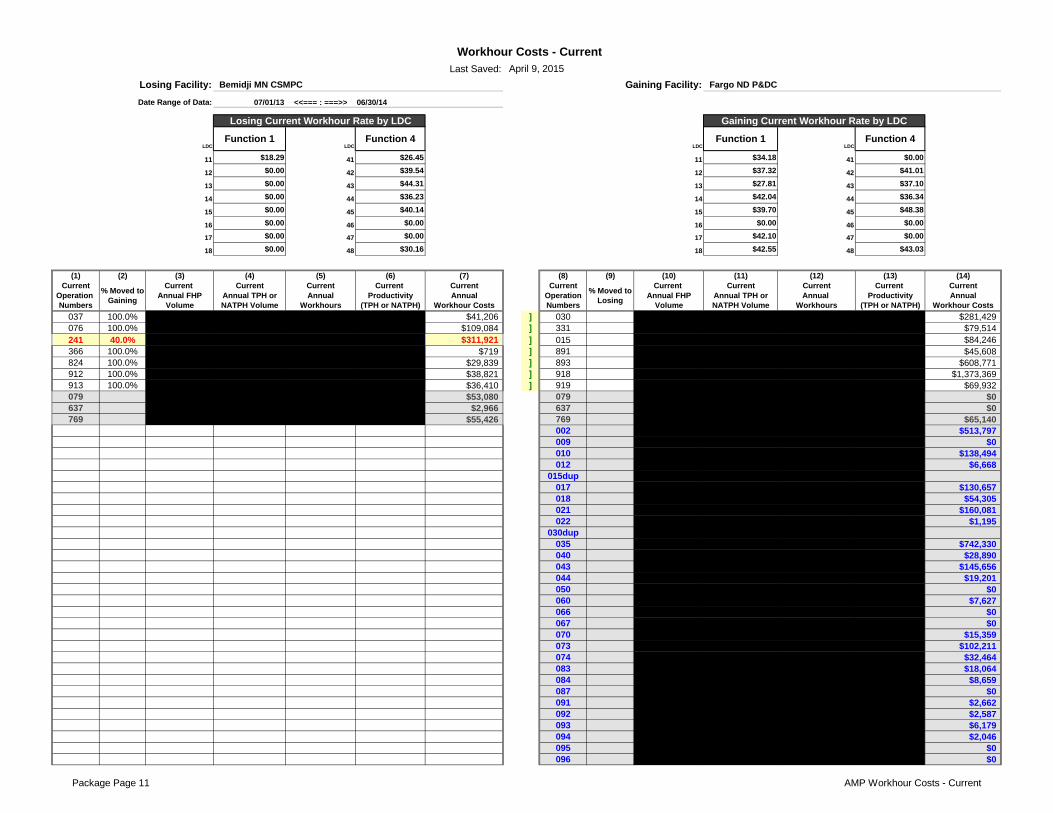
07/01/13 <<=== : ===>> 06/30/14
LDC LDC LDC LDC
11 $18.29 41 $26.45 11 $34.18 41 $0.00
12 $0.00 42 $39.54 12 $37.32 42 $41.01
13 $0.00 43 $44.31 13 $27.81 43 $37.10
14 $0.00 44 $36.23 14 $42.04 44 $36.34
15 $0.00 45 $40.14 15 $39.70 45 $48.38
16 $0.00 46 $0.00 16 $0.00 46 $0.00
17 $0.00 47 $0.00 17 $42.10 47 $0.00
18 $0.00 48 $30.16 18 $42.55 48 $43.03
(1) (2) (3) (4) (5) (6) (7) (8) (9) (10) (11) (12) (13) (14)Current Current Current Current Current Current Current Current Current Current Current Current
Operation Annual FHP Annual TPH or Annual Productivity Annual Operation Annual FHP Annual TPH or Annual Productivity AnnualNumbers Volume NATPH Volume Workhours (TPH or NATPH) Workhour Costs Numbers Volume NATPH Volume Workhours (TPH or NATPH) Workhour Costs
037 100.0% $41,206 \ ] 030 $281,429076 100.0% $109,084 \ ] 331 $79,514241 40.0% $311,921 \ ] 015 $84,246366 100.0% $719 \ ] 891 $45,608824 100.0% $29,839 \ ] 893 $608,771912 100.0% $38,821 \ ] 918 $1,373,369913 100.0% $36,410 \ ] 919 $69,932079 $53,080 \ ] 079 $0637 $2,966 \ ] 637 $0769 $55,426 \ ] 769 $65,140
\ ] 002 $513,797\ ] 009 $0\ ] 010 $138,494\ ] 012 $6,668\ ] 015dup\ ] 017 $130,657\ ] 018 $54,305\ ] 021 $160,081\ ] 022 $1,195\ ] 030dup\ ] 035 $742,330\ ] 040 $28,890\ ] 043 $145,656\ ] 044 $19,201\ ] 050 $0\ ] 060 $7,627\ ] 066 $0\ ] 067 $0\ ] 070 $15,359\ ] 073 $102,211\ ] 074 $32,464\ ] 083 $18,064\ ] 084 $8,659\ ] 087 $0\ ] 091 $2,662\ ] 092 $2,587\ ] 093 $6,179\ ] 094 $2,046\ ] 095 $0\ ] 096 $0
Losing Facility: Gaining Facility:
Date Range of Data:
Function 1
Gaining Current Workhour Rate by LDC
Function 4
April 9, 2015
Workhour Costs - Current
Bemidji MN CSMPC Fargo ND P&DC
% Moved to Losing
% Moved to Gaining
Losing Current Workhour Rate by LDC
Function 4Function 1
Package Page 11 AMP Workhour Costs - Current

(1) (2) (3) (4) (5) (6) (7) (8) (9) (10) (11) (12) (13) (14)Current Current Current Current Current Current Current Current Current Current Current Current
Operation Annual FHP Annual TPH or Annual Productivity Annual Operation Annual FHP Annual TPH or Annual Productivity AnnualNumbers Volume NATPH Volume Workhours (TPH or NATPH) Workhour Costs Numbers Volume NATPH Volume Workhours (TPH or NATPH) Workhour Costs
% Moved to Losing
% Moved to Gaining
\ ] 097 $1,865\ ] 098 $3,849\ ] 099 $1,350\ ] 100 $84,475\ ] 110 $215,959\ ] 112 $253,213\ ] 115 $15,208\ ] 120 $54,746\ ] 122 $139,111\ ] 124 $16,901\ ] 126 $85,040\ ] 128 $175,261\ ] 130 $3,279\ ] 160 $376\ ] 168 $0\ ] 178 $0\ ] 180 $153,685\ ] 185 $84,988\ ] 200 $5,338\ ] 208 $16,280\ ] 210 $211,277\ ] 212 $99,904\ ] 231 $801,724\ ] 241 $4,421\ ] 271 $9,932\ ] 272 $279,070\ ] 320 $539,067\ ] 321 $530,888\ ] 324 $41,223\ ] 331dup\ ] 332 $258\ ] 333 $200,892\ ] 336 $494,339\ ] 337 $60\ ] 468 $0\ ] 481 $52,858\ ] 483 $30,264\ ] 484 $4,247\ ] 487 $301\ ] 488 $0\ ] 489 $1,956\ ] 549 $2,300\ ] 554 $43,453\ ] 585 $262,906\ ] 607 $139,138\ ] 612 $10,817\ ] 618 $385,767\ ] 620 $70,196\ ] 630 $7,547\ ] 639 $20,175\ ] 649 $131,410\ ] 891dup\ ] 892 $444\ ] 893dup\ ] 894 $2,858\ ] 896 $2,530\ ] 897 $33,165\ ] 918dup\ ] 919dup\ ]
Package Page 12 AMP Workhour Costs - Current
(1) (2) (3) (4) (5) (6) (7) (8) (9) (10) (11) (12) (13) (14)Current Current Current Current Current Current Current Current Current Current Current Current
Operation Annual FHP Annual TPH or Annual Productivity Annual Operation Annual FHP Annual TPH or Annual Productivity AnnualNumbers Volume NATPH Volume Workhours (TPH or NATPH) Workhour Costs Numbers Volume NATPH Volume Workhours (TPH or NATPH) Workhour Costs
% Moved to Losing
% Moved to Gaining
\ ]\ ]\ ]\ ]\ ]\ ]\ ]\ ]\ ]\ ]\ ]\ ]\ ]\ ]\ ]\ ]\ ]\ ]\ ]\ ]\ ]\ ]\ ]\ ]\ ]\ ]\ ]\ ]\ ]\ ]\ ]\ ]\ ]\ ]\ ]\ ]\ ]\ ]\ ]\ ]\ ]\ ]\ ]\ ]\ ]\ ]\ ]\ ]\ ]\ ]\ ]\ ]\ ]\ ]\ ]\ ]\ ]\ ]\ ]\ ]
Package Page 13 AMP Workhour Costs - Current

(1) (2) (3) (4) (5) (6) (7) (8) (9) (10) (11) (12) (13) (14)Current Current Current Current Current Current Current Current Current Current Current Current
Operation Annual FHP Annual TPH or Annual Productivity Annual Operation Annual FHP Annual TPH or Annual Productivity AnnualNumbers Volume NATPH Volume Workhours (TPH or NATPH) Workhour Costs Numbers Volume NATPH Volume Workhours (TPH or NATPH) Workhour Costs
% Moved to Losing
% Moved to Gaining
\ ]\ ]\ ]\ ]\ ]\ ]\ ]\ ]\ ]\ ]\ ]\ ]\ ]\ ]\ ]\ ]\ ]\ ]\ ]\ ]\ ]\ ]\ ]\ ]\ ]\ ]\ ]\ ]\ ]\ ]\ ]\ ]\ ]\ ]\ ]\ ]\ ]\ ]\ ]\ ]\ ]\ ]\ ]\ ]\ ]\ ]\ ]\ ]\ ]\ ]\ ]\ ]\ ]\ ]\ ]\ ]\ ]\ ]\ ]\ ]
Package Page 14 AMP Workhour Costs - Current

(1) (2) (3) (4) (5) (6) (7) (8) (9) (10) (11) (12) (13) (14)Current Current Current Current Current Current Current Current Current Current Current Current
Operation Annual FHP Annual TPH or Annual Productivity Annual Operation Annual FHP Annual TPH or Annual Productivity AnnualNumbers Volume NATPH Volume Workhours (TPH or NATPH) Workhour Costs Numbers Volume NATPH Volume Workhours (TPH or NATPH) Workhour Costs
% Moved to Losing
% Moved to Gaining
\ ]\ ]\ ]\ ]\ ]\ ]\ ]\ ]\ ]\ ]\ ]\ ]\ ]\ ]\ ]\ ]\ ]\ ]\ ]\ ]\ ]\ ]\ ]\ ]\ ]\ ]\ ]\ ]\ ]\ ]\ ]\ ]\ ]\ ]\ ]\ ]\ ]\ ]\ ]\ ]\ ]\ ]\ ]\ ]\ ]\ ]\ ]\ ]\ ]\ ]\ ]\ ]\ ]\ ]\ ]\ ]\ ]\ ]\ ]\ ]
Package Page 15 AMP Workhour Costs - Current

(1) (2) (3) (4) (5) (6) (7) (8) (9) (10) (11) (12) (13) (14)Current Current Current Current Current Current Current Current Current Current Current Current
Operation Annual FHP Annual TPH or Annual Productivity Annual Operation Annual FHP Annual TPH or Annual Productivity AnnualNumbers Volume NATPH Volume Workhours (TPH or NATPH) Workhour Costs Numbers Volume NATPH Volume Workhours (TPH or NATPH) Workhour Costs
% Moved to Losing
% Moved to Gaining
\ ]\ ]\ ]\ ]\ ]\ ]\ ]\ ]\ ]\ ]\ ]\ ]\ ]\ ]\ ]\ ]\ ]\ ]\ ]\ ]\ ]\ ]\ ]\ ]\ ]\ ]\ ]\ ]\ ]\ ]
Moved to Gain 0 58,316,306 14,431 4,041 $568,000 Impact to Gain 235,727,292 478,880,160 72,192 6,633 $2,542,869Impact to Lose 0 0 0 No Calc $0 Moved to Lose 0 0 0 No Calc $0Total Impact 0 58,316,306 14,431 4,041 $568,000 Total Impact 235,727,292 478,880,160 72,192 6,633 $2,542,869Non-impacted 0 2,023,141 2,803 722 $111,472 Non-impacted 0 0 1,792 No Calc $65,140
Gain Only 123,402,191 443,530,360 196,087 2,262 $7,865,445All 0 60,339,446 17,234 3,501 $679,472 All 359,129,483 922,410,520 270,072 3,415 $10,473,454
Impact to Gain 235,727,292 537,196,466 86,623 6,202 $3,110,869Impact to Lose 0 0 0 No Calc $0Total Impact 235,727,292 537,196,466 86,623 6,202 $3,110,869Non-impacted 0 2,023,141 4,595 440 $176,612
Gain Only 123,402,191 443,530,360 196,087 2,262 $7,865,445All 359,129,483 982,749,966 287,306 3,421 $11,152,926
.
(This number is carried forward to AMP Worksheet Executive Summary )
Combined Current Workhour Annual Workhour Costs :
0 Total FHP to be Transferred (Average Daily Volume) :
(This number is carried forward to the bottom of AMP Worksheet Workhour Costs-Proposed )
$11,152,926
Current FHP at Gaining Facility (Average Daily Volume) : 1,158,482 (This number is carried forward to AMP Worksheet Executive Summary )
rev 06/11/2008
Comb Totals
Totals Totals
Package Page 16 AMP Workhour Costs - Current

Last Saved:
Losing Facility: Gaining Facility:
(1) (2) (3) (4) (5) (6) (7) (8) (9) (10) (11) (12)Proposed Proposed Proposed Proposed Proposed Proposed Proposed Proposed Proposed Proposed Proposed ProposedOperation Annual FHP Annual TPH or Annual Productivity Annual Operation Annual FHP Annual TPH or Annual Productivity AnnualNumbers Volume NATPH Volume Workhours (TPH or NATPH) Workhour Costs Numbers Volume NATPH Volume Workhours (TPH or NATPH) Workhour Costs
037 $0 030 $310,907076 $0 331 $160,716241 $187,153 P 015 $192,414366 $0 891 $112,608824 $0 893 $559,932912 $0 918 $703,824913 $0 919 $664,651079 $53,080 079 $0637 $2,966 637 $0769 $55,426 769 $65,124
0 No Calc 002 $513,7970 No Calc 009 $00 No Calc 010 $138,4940 No Calc 012 $6,6680 No Calc 015dup $00 No Calc 017 $130,6570 No Calc 018 $54,3050 No Calc 021 $160,0810 No Calc 022 $1,1950 No Calc 030dup $00 No Calc 035 $742,3300 No Calc 040 $28,0230 No Calc 043 $141,2860 No Calc 044 $18,6250 No Calc 050 $00 No Calc 060 $7,3980 No Calc 066 $970 No Calc 067 $890 No Calc 070 $14,8980 No Calc 073 $99,1450 No Calc 074 $31,4900 No Calc 083 $18,0640 No Calc 084 $8,6590 No Calc 087 $00 No Calc 091 $2,6620 No Calc 092 $3,4230 No Calc 093 $6,1790 No Calc 094 $2,0460 No Calc 095 $00 No Calc 096 $00 No Calc 097 $1,8650 No Calc 098 $2,0270 No Calc 099 $2,3360 No Calc 100 $81,9400 No Calc 110 $215,9590 No Calc 112 $253,2130 No Calc 115 $15,2080 No Calc 120 $54,7460 No Calc 122 $139,111
Fargo ND P&DC
Workhour Costs - Proposed
Bemidji MN CSMPC
April 9, 2015
Package Page 17 AMP Workhour Costs - Proposed
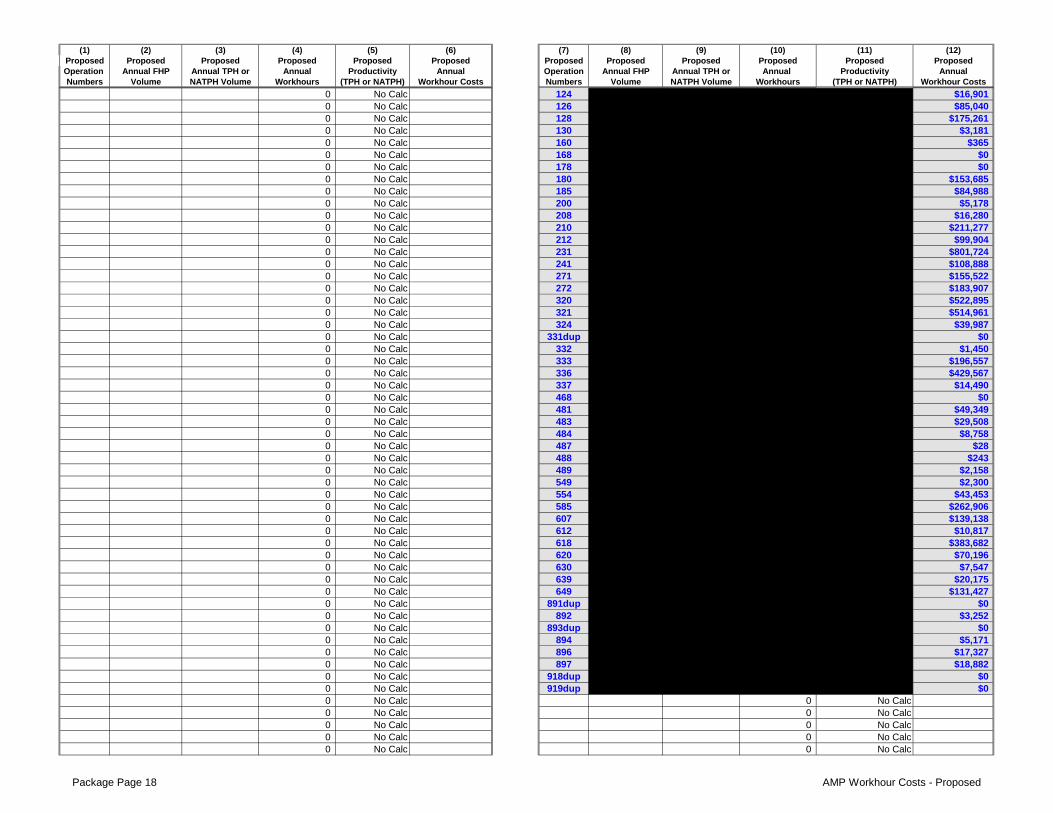
(1) (2) (3) (4) (5) (6) (7) (8) (9) (10) (11) (12)Proposed Proposed Proposed Proposed Proposed Proposed Proposed Proposed Proposed Proposed Proposed ProposedOperation Annual FHP Annual TPH or Annual Productivity Annual Operation Annual FHP Annual TPH or Annual Productivity AnnualNumbers Volume NATPH Volume Workhours (TPH or NATPH) Workhour Costs Numbers Volume NATPH Volume Workhours (TPH or NATPH) Workhour Costs
0 No Calc 124 $16,9010 No Calc 126 $85,0400 No Calc 128 $175,2610 No Calc 130 $3,1810 No Calc 160 $3650 No Calc 168 $00 No Calc 178 $00 No Calc 180 $153,6850 No Calc 185 $84,9880 No Calc 200 $5,1780 No Calc 208 $16,2800 No Calc 210 $211,2770 No Calc 212 $99,9040 No Calc 231 $801,7240 No Calc 241 $108,8880 No Calc 271 $155,5220 No Calc 272 $183,9070 No Calc 320 $522,8950 No Calc 321 $514,9610 No Calc 324 $39,9870 No Calc 331dup $00 No Calc 332 $1,4500 No Calc 333 $196,5570 No Calc 336 $429,5670 No Calc 337 $14,4900 No Calc 468 $00 No Calc 481 $49,3490 No Calc 483 $29,5080 No Calc 484 $8,7580 No Calc 487 $280 No Calc 488 $2430 No Calc 489 $2,1580 No Calc 549 $2,3000 No Calc 554 $43,4530 No Calc 585 $262,9060 No Calc 607 $139,1380 No Calc 612 $10,8170 No Calc 618 $383,6820 No Calc 620 $70,1960 No Calc 630 $7,5470 No Calc 639 $20,1750 No Calc 649 $131,4270 No Calc 891dup $00 No Calc 892 $3,2520 No Calc 893dup $00 No Calc 894 $5,1710 No Calc 896 $17,3270 No Calc 897 $18,8820 No Calc 918dup $00 No Calc 919dup $00 No Calc 0 No Calc0 No Calc 0 No Calc0 No Calc 0 No Calc0 No Calc 0 No Calc0 No Calc 0 No Calc
Package Page 18 AMP Workhour Costs - Proposed
(1) (2) (3) (4) (5) (6) (7) (8) (9) (10) (11) (12)Proposed Proposed Proposed Proposed Proposed Proposed Proposed Proposed Proposed Proposed Proposed ProposedOperation Annual FHP Annual TPH or Annual Productivity Annual Operation Annual FHP Annual TPH or Annual Productivity AnnualNumbers Volume NATPH Volume Workhours (TPH or NATPH) Workhour Costs Numbers Volume NATPH Volume Workhours (TPH or NATPH) Workhour Costs
0 No Calc 0 No Calc0 No Calc 0 No Calc0 No Calc 0 No Calc0 No Calc 0 No Calc0 No Calc 0 No Calc0 No Calc 0 No Calc0 No Calc 0 No Calc0 No Calc 0 No Calc0 No Calc 0 No Calc0 No Calc 0 No Calc0 No Calc 0 No Calc0 No Calc 0 No Calc0 No Calc 0 No Calc0 No Calc 0 No Calc0 No Calc 0 No Calc0 No Calc 0 No Calc0 No Calc 0 No Calc0 No Calc 0 No Calc0 No Calc 0 No Calc0 No Calc 0 No Calc0 No Calc 0 No Calc0 No Calc 0 No Calc0 No Calc 0 No Calc0 No Calc 0 No Calc0 No Calc 0 No Calc0 No Calc 0 No Calc0 No Calc 0 No Calc0 No Calc 0 No Calc0 No Calc 0 No Calc0 No Calc 0 No Calc0 No Calc 0 No Calc0 No Calc 0 No Calc0 No Calc 0 No Calc0 No Calc 0 No Calc0 No Calc 0 No Calc0 No Calc 0 No Calc0 No Calc 0 No Calc0 No Calc 0 No Calc0 No Calc 0 No Calc0 No Calc 0 No Calc0 No Calc 0 No Calc0 No Calc 0 No Calc0 No Calc 0 No Calc0 No Calc 0 No Calc0 No Calc 0 No Calc0 No Calc 0 No Calc0 No Calc 0 No Calc0 No Calc 0 No Calc0 No Calc 0 No Calc0 No Calc 0 No Calc0 No Calc 0 No Calc0 No Calc 0 No Calc0 No Calc 0 No Calc0 No Calc 0 No Calc0 No Calc 0 No Calc
Package Page 19 AMP Workhour Costs - Proposed

(1) (2) (3) (4) (5) (6) (7) (8) (9) (10) (11) (12)Proposed Proposed Proposed Proposed Proposed Proposed Proposed Proposed Proposed Proposed Proposed ProposedOperation Annual FHP Annual TPH or Annual Productivity Annual Operation Annual FHP Annual TPH or Annual Productivity AnnualNumbers Volume NATPH Volume Workhours (TPH or NATPH) Workhour Costs Numbers Volume NATPH Volume Workhours (TPH or NATPH) Workhour Costs
0 No Calc 0 No Calc0 No Calc 0 No Calc0 No Calc 0 No Calc0 No Calc 0 No Calc0 No Calc 0 No Calc0 No Calc 0 No Calc0 No Calc 0 No Calc0 No Calc 0 No Calc0 No Calc 0 No Calc0 No Calc 0 No Calc0 No Calc 0 No Calc0 No Calc 0 No Calc0 No Calc 0 No Calc0 No Calc 0 No Calc0 No Calc 0 No Calc0 No Calc 0 No Calc0 No Calc 0 No Calc0 No Calc 0 No Calc0 No Calc 0 No Calc0 No Calc 0 No Calc0 No Calc 0 No Calc0 No Calc 0 No Calc0 No Calc 0 No Calc0 No Calc 0 No Calc0 No Calc 0 No Calc0 No Calc 0 No Calc0 No Calc 0 No Calc0 No Calc 0 No Calc0 No Calc 0 No Calc0 No Calc 0 No Calc0 No Calc 0 No Calc0 No Calc 0 No Calc0 No Calc 0 No Calc0 No Calc 0 No Calc0 No Calc 0 No Calc0 No Calc 0 No Calc0 No Calc 0 No Calc0 No Calc 0 No Calc0 No Calc 0 No Calc0 No Calc 0 No Calc0 No Calc 0 No Calc0 No Calc 0 No Calc0 No Calc 0 No Calc0 No Calc 0 No Calc0 No Calc 0 No Calc0 No Calc 0 No Calc0 No Calc 0 No Calc0 No Calc 0 No Calc0 No Calc 0 No Calc0 No Calc 0 No Calc0 No Calc 0 No Calc0 No Calc 0 No Calc0 No Calc 0 No Calc0 No Calc 0 No Calc0 No Calc 0 No Calc
Package Page 20 AMP Workhour Costs - Proposed

(1) (2) (3) (4) (5) (6) (7) (8) (9) (10) (11) (12)Proposed Proposed Proposed Proposed Proposed Proposed Proposed Proposed Proposed Proposed Proposed ProposedOperation Annual FHP Annual TPH or Annual Productivity Annual Operation Annual FHP Annual TPH or Annual Productivity AnnualNumbers Volume NATPH Volume Workhours (TPH or NATPH) Workhour Costs Numbers Volume NATPH Volume Workhours (TPH or NATPH) Workhour Costs
0 No Calc 0 No Calc0 No Calc 0 No Calc0 No Calc 0 No Calc0 No Calc 0 No Calc0 No Calc 0 No Calc0 No Calc 0 No Calc0 No Calc 0 No Calc0 No Calc 0 No Calc0 No Calc 0 No Calc0 No Calc 0 No Calc0 No Calc 0 No Calc0 No Calc 0 No Calc0 No Calc 0 No Calc0 No Calc 0 No Calc0 No Calc 0 No Calc0 No Calc 0 No Calc0 No Calc 0 No Calc0 No Calc 0 No Calc0 No Calc 0 No Calc0 No Calc 0 No Calc0 No Calc 0 No Calc0 No Calc 0 No Calc0 No Calc 0 No Calc0 No Calc 0 No Calc0 No Calc 0 No Calc0 No Calc 0 No Calc0 No Calc 0 No Calc0 No Calc 0 No Calc0 No Calc 0 No Calc0 No Calc 0 No Calc0 No Calc 0 No Calc0 No Calc 0 No Calc0 No Calc 0 No Calc0 No Calc 0 No Calc0 No Calc 0 No Calc0 No Calc 0 No Calc0 No Calc 0 No Calc0 No Calc 0 No Calc0 No Calc 0 No Calc0 No Calc 0 No Calc0 No Calc 0 No Calc0 No Calc 0 No Calc0 No Calc 0 No Calc0 No Calc 0 No Calc0 No Calc 0 No Calc0 No Calc 0 No Calc0 No Calc 0 No Calc0 No Calc 0 No Calc0 No Calc 0 No Calc0 No Calc 0 No Calc0 No Calc 0 No Calc0 No Calc 0 No Calc0 No Calc 0 No Calc0 No Calc 0 No Calc0 No Calc 0 No Calc
Package Page 21 AMP Workhour Costs - Proposed

(1) (2) (3) (4) (5) (6) (7) (8) (9) (10) (11) (12)Proposed Proposed Proposed Proposed Proposed Proposed Proposed Proposed Proposed Proposed Proposed ProposedOperation Annual FHP Annual TPH or Annual Productivity Annual Operation Annual FHP Annual TPH or Annual Productivity AnnualNumbers Volume NATPH Volume Workhours (TPH or NATPH) Workhour Costs Numbers Volume NATPH Volume Workhours (TPH or NATPH) Workhour Costs
0 No Calc 0 No Calc0 No Calc 0 No Calc0 No Calc 0 No Calc0 No Calc 0 No Calc0 No Calc 0 No Calc0 No Calc 0 No Calc0 No Calc 0 No Calc0 No Calc 0 No Calc0 No Calc 0 No Calc0 No Calc 0 No Calc0 No Calc 0 No Calc0 No Calc 0 No Calc0 No Calc 0 No Calc0 No Calc 0 No Calc0 No Calc 0 No Calc0 No Calc 0 No Calc0 No Calc 0 No Calc0 No Calc 0 No Calc0 No Calc 0 No Calc0 No Calc 0 No Calc0 No Calc 0 No Calc0 No Calc 0 No Calc0 No Calc 0 No Calc0 No Calc 0 No Calc0 No Calc 0 No Calc0 No Calc 0 No Calc0 No Calc 0 No Calc0 No Calc 0 No Calc0 No Calc 0 No Calc0 No Calc 0 No Calc0 No Calc 0 No Calc0 No Calc 0 No Calc0 No Calc 0 No Calc0 No Calc 0 No Calc0 No Calc 0 No Calc0 No Calc 0 No Calc0 No Calc 0 No Calc0 No Calc 0 No Calc0 No Calc 0 No Calc0 No Calc 0 No Calc0 No Calc 0 No Calc
Moved to Gain 0 3,043,409 4,224 721 $187,153 Impact to Gain 235,727,292 534,153,056 75,981 7,030 $2,705,053Impact to Lose 0 0 0 No Calc $0 Moved to Lose 0 0 0 No Calc $0Total Impact 0 3,043,409 4,224 721 $187,153 Total Impact 235,727,292 534,153,056 75,981 7,030 $2,705,053Non Impacted 0 2,023,141 2,803 722 $111,472 Non Impacted 0 0 1,792 No Calc $65,124
Gain Only 123,402,191 443,530,360 197,942 2,241 $7,924,342All 0 5,066,550 7,027 721 $298,625 All 359,129,483 977,683,416 275,715 3,546 $10,694,519
Package Page 22 AMP Workhour Costs - Proposed
(1) (2) (3) (4) (5) (6) (7) (8) (9) (10) (11) (12)Proposed Proposed Proposed Proposed Proposed Proposed Proposed Proposed Proposed Proposed Proposed ProposedOperation Annual FHP Annual TPH or Annual Productivity Annual Operation Annual FHP Annual TPH or Annual Productivity AnnualNumbers Volume NATPH Volume Workhours (TPH or NATPH) Workhour Costs Numbers Volume NATPH Volume Workhours (TPH or NATPH) Workhour Costs
Op# FHP TPH/NATPH Workhours Productivity Workhour Cost Op# FHP TPH/NATPH Workhours Productivity Workhour Cost1
2
3
4
5
6
7
8
9
10
11
12
13
14
15
16
17
18
19
20
21
22
23
24
25
26
27
28
29
30
Totals 0 0 0 No Calc $0 Totals 0 0 0 No Calc $0
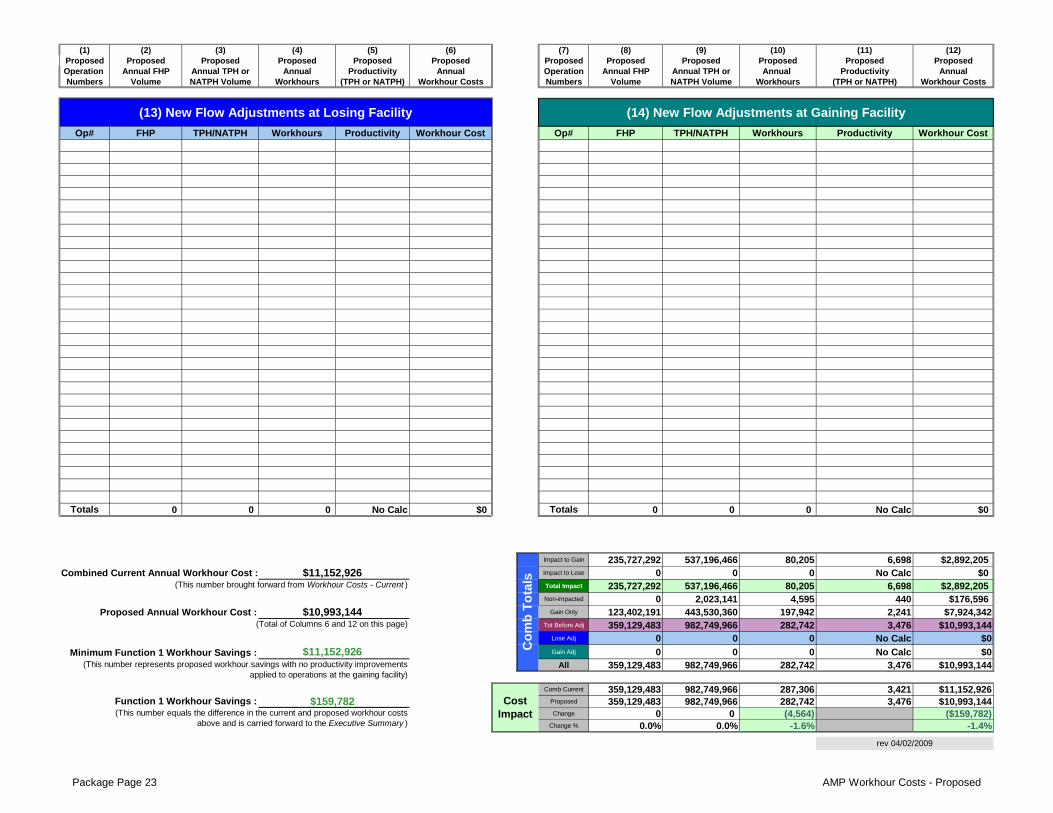
Impact to Gain 235,727,292 537,196,466 80,205 6,698 $2,892,205Combined Current Annual Workhour Cost : Impact to Lose 0 0 0 No Calc $0
Total Impact 235,727,292 537,196,466 80,205 6,698 $2,892,205Non-impacted 0 2,023,141 4,595 440 $176,596
Gain Only 123,402,191 443,530,360 197,942 2,241 $7,924,342Tot Before Adj 359,129,483 982,749,966 282,742 3,476 $10,993,144
Lose Adj 0 0 0 No Calc $0Gain Adj 0 0 0 No Calc $0
All 359,129,483 982,749,966 282,742 3,476 $10,993,144
Comb Current 359,129,483 982,749,966 287,306 3,421 $11,152,926Proposed 359,129,483 982,749,966 282,742 3,476 $10,993,144Change 0 0 (4,564) ($159,782)
Change % 0.0% 0.0% -1.6% -1.4%
rev 04/02/2009
(14) New Flow Adjustments at Gaining Facility(13) New Flow Adjustments at Losing Facility
$11,152,926
Proposed Annual Workhour Cost :(Total of Columns 6 and 12 on this page)
$10,993,144
Cost Impact(This number equals the difference in the current and proposed workhour costs
above and is carried forward to the Executive Summary )
(This number brought forward from Workhour Costs - Current )
Function 1 Workhour Savings : $159,782
Minimum Function 1 Workhour Savings : $11,152,926(This number represents proposed workhour savings with no productivity improvements
applied to operations at the gaining facility)
Co
mb
To
tals
Package Page 23 AMP Workhour Costs - Proposed

Last Saved:
to
745 0.0% 0.0% $191 \ ] 745 $82,341 TGp 745 4 $191 745 $82,341747 0.0% 38.7% $151,053 \ ] 747 $97,321 TGp 747 1,988 $92,595 747 $97,321750 0.0% 100.0% $220,524 \ ] 750 $1,484,363 TGp 750 0 $0 750 $1,484,363753 0.0% 100.0% $198 \ ] 753 $0 TGp 753 0 $0 753 $0001 $92,840 \ ] 001 $0 NI 001 2,112 $92,840 001 $0065 $339,346 \ ] 065 $0 NI 065 11,250 $339,346 065 $0355 $192,072 \ ] 355 $0 NI 355 4,785 $192,072 355 $0421 $1,494,731 \ ] 421 $0 NI 421 41,463 $1,494,731 421 $0713 $684,347 \ ] 713 $0 NI 713 18,750 $684,347 713 $0714 $417,833 \ ] 714 $0 NI 714 6,236 $417,833 714 $0743 $607 \ ] 743 $0 NI 743 17 $607 743 $0
\ ] 228 $96,226 GO 228 $96,226\ ] 515 $0 GO 515 $0\ ] 550 $161,940 GO 550 $161,940\ ] 558 $43,368 GO 558 $43,368\ ] 568 $234,935 GO 568 $234,935\ ] 570 $5,075 GO 570 $5,075\ ] 581 $2,670 GO 581 $2,670\ ] 582 $80,264 GO 582 $80,264\ ] 591 $101,131 GO 591 $101,131\ ] 608 $43 GO 608 $43\ ] 621 $3,588 GO 621 $3,588\ ] 660 $25,077 GO 660 $25,077\ ] 666 $48,212 GO 666 $48,212\ ] 668 $287,655 GO 668 $287,655\ ] 679 $2 GO 679 $2\ ] 731 $189 GO 731 $189\ ] 742 $181,746 GO 742 $181,746\ ] 756 $131,192 GO 756 $131,192\ ] 794 $13,312 GO 794 $13,312\ ]\ ]\ ]\ ]\ ]\ ]\ ]\ ]\ ]\ ]\ ]\ ]\ ]\ ]\ ]\ ]\ ]\ ]\ ]\ ]\ ]\ ]\ ]\ ]\ ]\ ]\ ]\ ]\ ]\ ]
Proposed Annual Workhours
Proposed Annual Workhour Cost ($)
Proposed Annual Workhours
Proposed MODS
Operation Number
Current MODS
Operation Number
Percent Moved to Gaining
(%)
Current Annual Workhours
Reduction Due to EoS (%)
Reduction Due to EoS (%)
Gaining Facility
Current Annual Workhour Cost ($)
Proposed MODS
Operation Number
Losing FacilityLosing Facility
Proposed Annual Workhour Cost ($)
Other Workhour Move Analysis
Bemidji MN CSMPCLosing Facility: Gaining Facility: Fargo ND P&DC Date Range of Data: #REF!07/01/13
April 9, 2015
Proposed Other Craft WorkhoursGaining Facility
Current Other Craft Workhours
Current Annual Workhour Cost ($)
Current MODS
Operation Number
Percent Moved to
Losing (%)
Package Page 24 AMP Other Curr vs Prop

\ ]\ ]\ ]\ ]\ ]\ ]\ ]\ ]\ ]\ ]\ ]\ ]\ ]\ ]\ ]\ ]\ ]\ ]\ ]\ ]\ ]\ ]\ ]\ ]\ ]\ ]\ ]\ ]\ ]\ ]\ ]\ ]\ ]\ ]\ ]\ ]\ ]\ ]\ ]\ ]\ ]\ ]\ ]\ ]\ ]\ ]\ ]\ ]\ ]\ ]\ ]\ ]\ ]\ ]\ ]\ ]\ ]\ ]\ ]\ ]\ ]\ ]\ ]\ ]\ ]\ ]\ ]\ ]\ ]\ ]\ ]\ ]\ ]\ ]
Package Page 25 AMP Other Curr vs Prop

\ ]\ ]\ ]\ ]\ ]\ ]\ ]\ ]\ ]\ ]\ ]\ ]\ ]\ ]\ ]\ ]\ ]
7,458 $371,966 0 $0 Ops-Red 1,992 $92,786 Ops-Red 0 $00 $0 32,208 $1,664,025 Ops-Inc 0 $0 Ops-Inc 32,208 $1,664,025
84,613 $3,221,776 30,189 $1,416,625 Ops-Stay 84,613 $3,221,776 Ops-Stay 30,189 $1,416,62592,071 $3,593,742 62,397 $3,080,650 AllOps 86,605 $3,314,563 AllOps 62,397 $3,080,650
671 $104,593 \ ] 671 $155,208 NI 671 $104,593 671 $155,208705 $174,719 \ ] 705 $4,960 NI 705 $174,719 705 $4,960
\ ] 708 $89,699 GO 708 $89,699\ ] 758 $158,077 GO 758 $158,077\ ] 920 $38,386 GO 920 $38,386\ ] 927 $115,641 GO 927 $115,641\ ] 928 $591,392 GO 928 $591,392\ ] 933 $94,602 GO 933 $94,602\ ] 951 $127,841 GO 951 $127,841\ ]\ ]\ ]\ ]\ ]\ ]\ ]\ ]\ ]\ ]\ ]\ ]\ ]\ ]\ ]\ ]\ ]\ ]\ ]\ ]\ ]\ ]\ ]\ ]\ ]\ ]\ ]\ ]\ ]\ ]\ ]\ ]\ ]\ ]\ ]
Proposed MODS
Operation Number
Proposed Annual Workhours
Proposed All Supervisory WorkhoursGaining FacilityLosing Facility
Totals
Ops-ReducingOps-Increasing
Ops-StayingAll Operations
Totals
Ops-ReducingOps-Increasing
Ops-StayingAll Operations
Current Annual Workhours
Proposed Annual Workhour Cost ($)
Proposed MODS
Operation Number
Proposed Annual Workhours
Proposed Annual Workhour Cost ($)
Current MODS
Operation Number
Losing Facility Gaining Facility
Percent (%) Moved to Losing
(%) Reduction
Due to EoS
Percent (%) Moved to Gaining
(%) Reduction
Due to EoS
Current All Supervisory Workhours
Current MODS
Operation Number
Current Annual Workhours
Current Annual Workhour Cost ($)
Current Annual Workhour Cost ($)
Package Page 26 AMP Other Curr vs Prop

\ ]\ ]\ ]\ ]\ ]\ ]\ ]\ ]\ ]\ ]\ ]\ ]\ ]\ ]\ ]\ ]\ ]\ ]\ ]\ ]\ ]\ ]\ ]\ ]\ ]\ ]\ ]\ ]\ ]\ ]\ ]\ ]\ ]\ ]\ ]\ ]\ ]\ ]\ ]\ ]\ ]\ ]\ ]\ ]\ ]\ ]\ ]\ ]\ ]\ ]\ ]\ ]\ ]\ ]\ ]\ ]\ ]\ ]\ ]\ ]\ ]\ ]\ ]\ ]\ ]\ ]\ ]\ ]\ ]\ ]\ ]\ ]\ ]\ ]
Package Page 27 AMP Other Curr vs Prop
\ ]\ ]\ ]\ ]\ ]\ ]\ ]\ ]\ ]\ ]\ ]\ ]\ ]
0 $0 0 $0 Ops-Red 0 $0 Ops-Red 0 $00 $0 0 $0 Ops-Inc 0 $0 Ops-Inc 0 $0
5,575 $279,312 26,437 $1,375,804 Ops-Stay 5,575 $279,312 Ops-Stay 26,437 $1,375,8045,575 $279,312 26,437 $1,375,804 AllOps 5,575 $279,312 AllOps 26,437 $1,375,804
782 $1,591 \ ] 782 $235 NI 782 $1,591 782 $235783 $37 \ ] 783 $26,292 NI 783 $37 783 $26,292789 $37 \ ] 789 $0 NI 789 $37 789 $0
\ ] 781 $56,833 GO 781 $56,833\ ] 784 $13,721 GO 784 $13,721\ ] 787 $0 GO 787 $0\ ]\ ]\ ]\ ]\ ]\ ]
0 $0 0 $0 Ops-Red 0 $0 Ops-Red 0 $00 $0 0 $0 Ops-Inc 0 $0 Ops-Inc 0 $0
46 $1,666 3,331 $97,082 Ops-Stay 46 $1,666 Ops-Stay 3,331 $97,08246 $1,666 3,331 $97,082 AllOps 46 $1,666 AllOps 3,331 $97,082
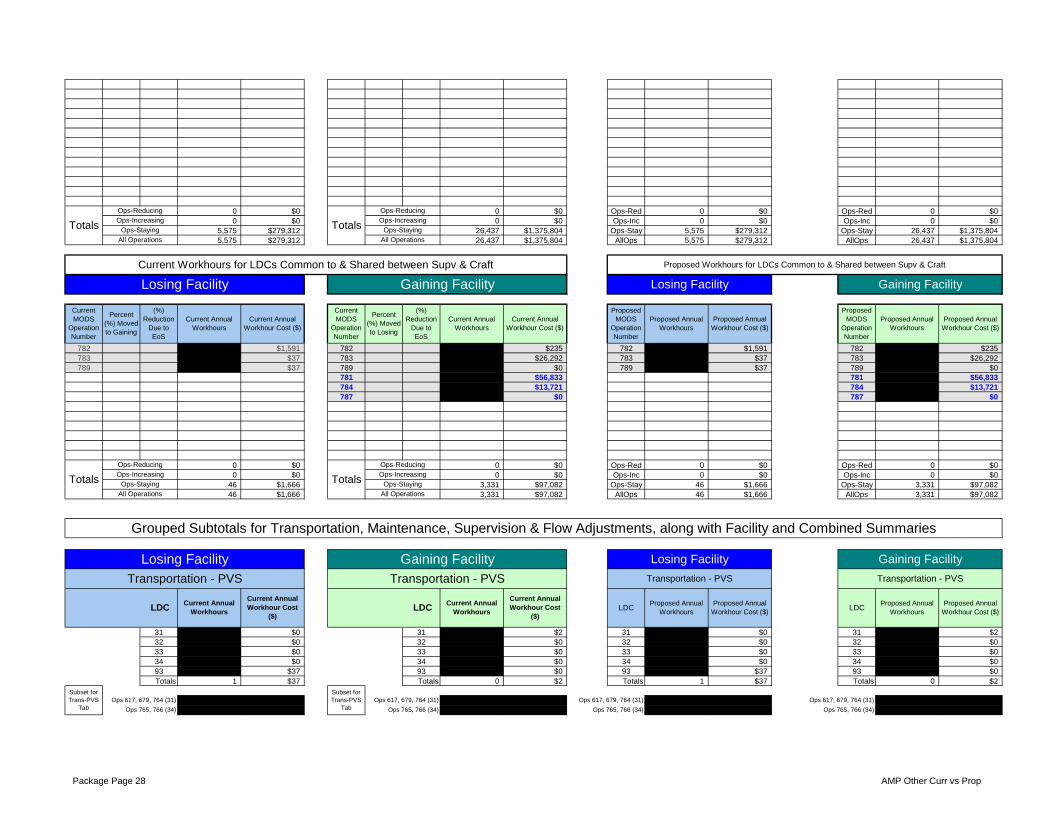
31 $0 31 $2 31 $0 31 $232 $0 32 $0 32 $0 32 $033 $0 33 $0 33 $0 33 $034 $0 34 $0 34 $0 34 $093 $37 93 $0 93 $37 93 $0Totals 1 $37 Totals 0 $2 Totals 1 $37 Totals 0 $2
0 $0 0 $2 0 $0 0 $20 $0 0 $0 0 $0 0 $0
Losing Facility Gaining Facility
Proposed Workhours for LDCs Common to & Shared between Supv & Craft
Gaining Facility
Ops 617, 679, 764 (31)
Ops 765, 766 (34)
Ops 617, 679, 764 (31)
LDCProposed Annual
WorkhoursProposed Annual
WorkhoursProposed Annual
Workhour Cost ($)
Transportation - PVS
Proposed Annual Workhour Cost ($)
Proposed MODS
Operation Number
Proposed Annual Workhours
Proposed Annual Workhour Cost ($)
Losing Facility
Proposed MODS
Operation Number
Proposed Annual Workhours
Ops 765, 766 (34)
Proposed Annual Workhour Cost ($)
Transportation - PVS
LDC
Ops-Reducing
Losing Facility
Ops 617, 679, 764 (31)Subset for Trans-PVS
Tab
Current Annual Workhours
Current Annual Workhour Cost ($)
Transportation - PVS
Totals
Ops-ReducingOps-Increasing
Ops-StayingAll Operations
Percent (%) Moved to Losing
(%) Reduction
Due to EoS
Grouped Subtotals for Transportation, Maintenance, Supervision & Flow Adjustments, along with Facility and Combined Summaries
Ops-IncreasingOps-Staying
All Operations
Ops-IncreasingOps-Staying
Losing Facility Gaining Facility
TotalsOps-Increasing
Ops-StayingAll Operations
(%) Reduction
Due to EoS
Current MODS
Operation Number
Gaining Facility
Current Workhours for LDCs Common to & Shared between Supv & Craft
Totals
Totals
Ops 765, 766 (34)
Current Annual Workhour Cost ($)
LDCCurrent Annual
Workhours
Current Annual Workhour Cost
($)
Current MODS
Operation Number
All Operations
Current Annual Workhours
Subset for Trans-PVS
TabOps 617, 679, 764 (31)
Transportation - PVS
LDCCurrent Annual
Workhours
Current Annual Workhour Cost
($)
Ops 765, 766 (34)
Ops-Reducing
Percent (%) Moved to Gaining
Ops-Reducing
Package Page 28 AMP Other Curr vs Prop
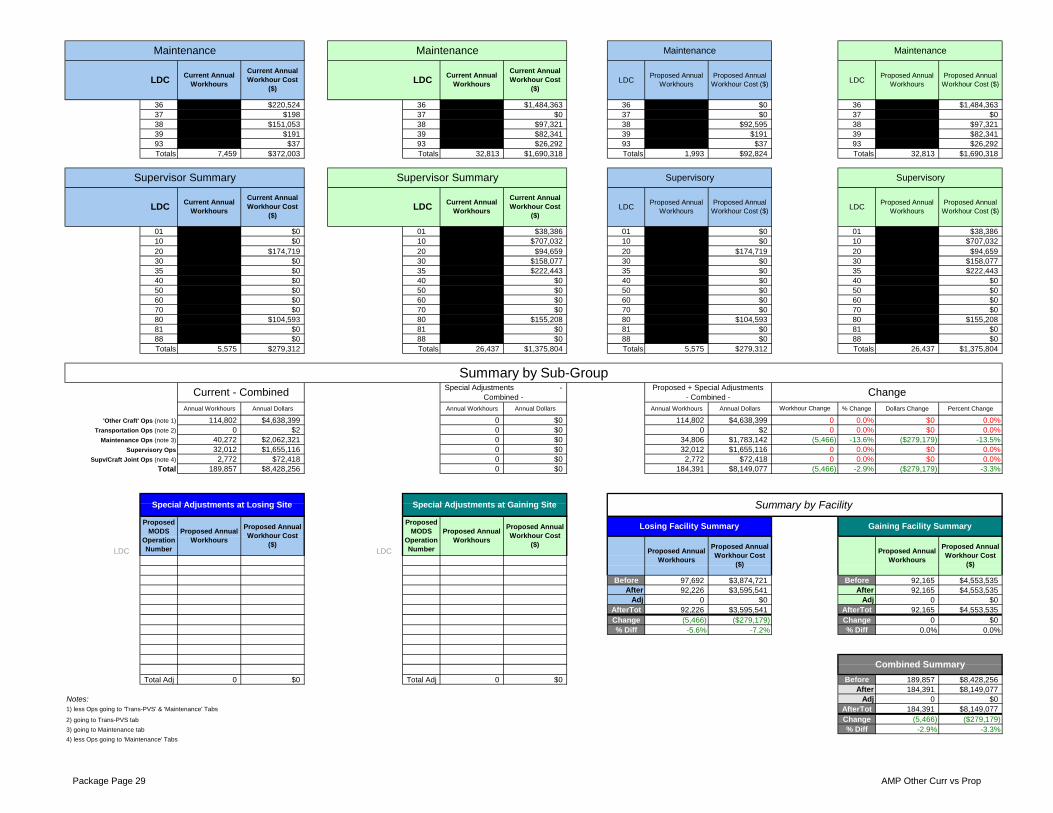
36 $220,524 36 $1,484,363 36 $0 36 $1,484,36337 $198 37 $0 37 $0 37 $038 $151,053 38 $97,321 38 $92,595 38 $97,32139 $191 39 $82,341 39 $191 39 $82,34193 $37 93 $26,292 93 $37 93 $26,292Totals 7,459 $372,003 Totals 32,813 $1,690,318 Totals 1,993 $92,824 Totals 32,813 $1,690,318
01 $0 01 $38,386 01 $0 01 $38,38610 $0 10 $707,032 10 $0 10 $707,03220 $174,719 20 $94,659 20 $174,719 20 $94,65930 $0 30 $158,077 30 $0 30 $158,07735 $0 35 $222,443 35 $0 35 $222,44340 $0 40 $0 40 $0 40 $050 $0 50 $0 50 $0 50 $060 $0 60 $0 60 $0 60 $070 $0 70 $0 70 $0 70 $080 $104,593 80 $155,208 80 $104,593 80 $155,20881 $0 81 $0 81 $0 81 $088 $0 88 $0 88 $0 88 $0Totals 5,575 $279,312 Totals 26,437 $1,375,804 Totals 5,575 $279,312 Totals 26,437 $1,375,804
Annual Workhours Annual Dollars Annual Workhours Annual Dollars Annual Workhours Annual Dollars % Change Dollars Change Percent Change
114,802 $4,638,399 0 $0 114,802 $4,638,399 0.0% $0 0.0%0 $2 0 $0 0 $2 0.0% $0 0.0%
40,272 $2,062,321 0 $0 34,806 $1,783,142 -13.6% ($279,179) -13.5%32,012 $1,655,116 0 $0 32,012 $1,655,116 0.0% $0 0.0%
2,772 $72,418 0 $0 2,772 $72,418 0.0% $0 0.0%189,857 $8,428,256 0 $0 184,391 $8,149,077 -2.9% ($279,179) -3.3%
LDC LDCChk >>> Chk >>>Chk >>> Chk >>>Chk >>> Chk >>> Before 97,692 $3,874,721 Before 92,165 $4,553,535Chk >>> Chk >>> After 92,226 $3,595,541 After 92,165 $4,553,535Chk >>> Chk >>> Adj 0 $0 Adj 0 $0Chk >>> Chk >>> AfterTot 92,226 $3,595,541 AfterTot 92,165 $4,553,535Chk >>> Chk >>> Change (5,466) ($279,179) Change 0 $0Chk >>> Chk >>> % Diff -5.6% -7.2% % Diff 0.0% 0.0%Chk >>> Chk >>>Chk >>> Chk >>>Chk >>> Chk >>>Chk >>> Chk >>>
Total Adj 0 $0 Total Adj 0 $0 Before 189,857 $8,428,256After 184,391 $8,149,077
Adj 0 $0AfterTot 184,391 $8,149,077Change (5,466) ($279,179)% Diff -2.9% -3.3%
Proposed Annual Workhour Cost ($)
Maintenance
Proposed Annual Workhour Cost ($)
Proposed Annual Workhours
Proposed Annual Workhours
Supervisory
LDCProposed Annual
Workhours
Proposed Annual Workhour Cost
($)
Special Adjustments at Gaining Site
Maintenance
Current Annual Workhour Cost
($)
Summary by Sub-Group
LDC
Maintenance
Proposed Annual Workhour Cost ($)
Proposed Annual Workhours
Combined Summary
Proposed Annual Workhours
Proposed Annual Workhour Cost
($)
Proposed Annual Workhour Cost
($)
Proposed Annual Workhours
Special Adjustments - Combined -
Gaining Facility SummaryProposed Annual
Workhours
Losing Facility Summary
Proposed + Special Adjustments - Combined -
Workhour Change
0
Proposed Annual Workhour Cost
($)
Proposed MODS
Operation Number
Supervisory
LDC LDCCurrent Annual
Workhours
Current Annual Workhour Cost
($)
Current Annual Workhours LDC
Maintenance
Proposed Annual Workhour Cost ($)
Summary by FacilitySpecial Adjustments at Losing Site
0Supv/Craft Joint Ops (note 4)
Total (5,466)
Supervisor Summary Supervisor Summary
LDCCurrent Annual
Workhours
Current Annual Workhour Cost
($)LDC
Current Annual Workhours
Current Annual Workhour Cost
($)
0(5,466)
0Maintenance Ops (note 3)
Transportation Ops (note 2)
ChangeCurrent - Combined
LDC
4) less Ops going to 'Maintenance' Tabs
'Other Craft' Ops (note 1)
Notes:1) less Ops going to 'Trans-PVS' & 'Maintenance' Tabs
2) going to Trans-PVS tab
3) going to Maintenance tab
Supervisory Ops
Proposed MODS
Operation Number
Proposed Annual Workhours
Package Page 29 AMP Other Curr vs Prop

Last Saved:
Losing Facility:Data Extraction Date: 09/12/14
(2) (3) (4) (5) (6)
LevelCurrent Auth
StaffingCurrent On-Rolls
Proposed Staffing
Difference
1 EAS-22 1 1 1 0
2 EAS-17 2 2 2 0
3456789
10111213141516171819202122232425262728293031323334353637383940414243
Finance Number:
SUPV CUSTOMER SERVICES
Line
(1)
Position Title
POSTMASTER
Management Positions
Staffing - Management
260770
April 9, 2015
Bemidji MN CSMPC
Package Page 30 AMP Staffing - PCES/EAS
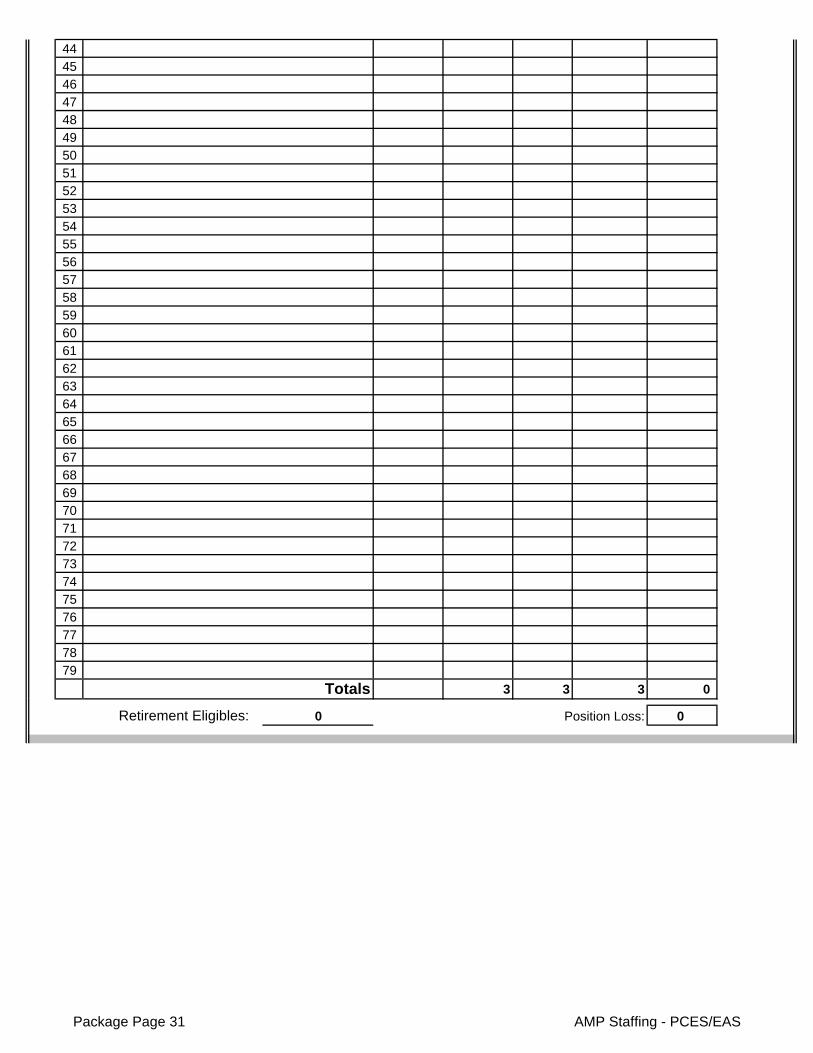
444546474849505152535455565758596061626364656667686970717273747576777879
3 3 3 0
Retirement Eligibles: 0 Position Loss: 0
Totals
Package Page 31 AMP Staffing - PCES/EAS

Gaining Facility:Data Extraction Date: 09/12/14
(13) (14) (15) (16) (17)
LevelCurrent Auth
StaffingCurrent On-Rolls
Proposed Staffing
Difference
1 EAS-25 1 1 1 0
2 EAS-24 1 1 1 0
3 EAS-21 1 1 1 0
4 EAS-21 1 1 1 0
5 EAS-20 1 1 1 0
6 EAS-19 2 2 2 0
7 EAS-19 1 1 1 0
8 EAS-17 3 3 3 0
9 EAS-17 2 2 2 0
10 EAS-17 1 1 1 0
11 EAS-17 4 3 4 1
12 EAS-17 1 1 1 0
13 EAS-12 1 1 1 0
141516171819202122232425262728293031323334353637383940414243444546
SUPV CUSTOMER SERVICES
SUPV DISTRIBUTION OPERATIONS
SUPV MAINTENANCE OPERATIONS
ADMINISTRATIVE ASSISTANT (FLD)
MGR DISTRIBUTION OPERATIONS
MGR MAINTENANCE
NETWORK SPECIALIST
OPERATIONS SUPPORT SPECIALIST
POSTMASTER (F)
MGR IN-PLANT SUPPORT
OPERATIONS INDUSTRIAL ENGINEER (FI
MGR DISTRIBUTION OPERATIONS
PLANT MANAGERLine Position Title
(12)
Management Positions
Finance Number: 373056
Fargo ND P&DC
Package Page 32 AMP Staffing - PCES/EAS

474849505152535455565758596061626364656667686970717273747576777879
20 19 20 1
Retirement Eligibles: 2 Position Loss: (1)
(1)
Total
rev 11/05/2008
Total PCES/EAS Position Loss: (This number carried forward to the Executive Summary )
Package Page 33 AMP Staffing - PCES/EAS

Losing Facility: 260770
(1) (2) (3) (4) (5) (6)
Craft Positions
Function 1 - Clerk 0 0 0Function 4 - Clerk 5 0 11 16 10 (6)Function 1 - Mail Handler 0 0 0Function 4 - Mail Handler 0 0 0
Function 1 & 4 Sub-Total 5 0 11 16 10 (6)Function 3A - Vehicle Service 0 0 0Function 3B - Maintenance 0 0 4 4 1 (3)Functions 67-69 - Lmtd/Rehab/WC 0 0Other Functions 0 1 28 29 29 0
Total 5 1 43 49 40 (9)
Retirement Eligibles: 24
Gaining Facility: 373056
(7) (8) (9) (10) (11) (12)
Craft Positions
Function 1 - Clerk 15 0 88 103 107 4Function 1 - Mail Handler 10 0 40 50 52 2
Function 1 Sub-Total 25 0 128 153 159 6Function 3A - Vehicle Service 0 0 0Function 3B - Maintenance 0 0 20 20 20 0Functions 67-69 - Lmtd/Rehab/WC 0 0Other Functions 0 0 18 18 18 0
Total 25 0 166 191 197 6
Retirement Eligibles: 39
3
(13) Notes:
rev 11/05/2008
Staffing - Craft
Difference
Difference
Last Saved: April 9, 2015
Data Extraction Date: 09/12/14
Non-CareerOn-Rolls
09/12/14
Total Proposed
Total On-Rolls
Non-CareerOn-Rolls
Data Extraction Date:
Bemidji MN CSMPC
Part Time On-Rolls
Full Time On-Rolls
Finance Number:
Fargo ND P&DC Finance Number:
Total Craft Position Loss:
Total Proposed
Part Time On-Rolls
Full Time On-Rolls
Total On-Rolls
(This number carried forward to the Executive Summary )
Package Page 34 AMP Staffing - Craft

Losing Facility: Gaining Facility:
Date Range of Data: :
(1) (2) (3) (4) (5) (6)
Workhour Activity Current Cost Proposed Cost Difference Workhour Activity Current Cost Proposed Cost Difference
LDC 36Mail Processing
Equipment$ 220,524 $ 0 $ (220,524) LDC 36
Mail Processing Equipment
$ 1,484,363 $ 1,484,363 $ 0
LDC 37 Building Equipment $ 198 $ 0 $ (198) LDC 37 Building Equipment $ 0 $ 0 $ 0
LDC 38 Building Services (Custodial Cleaning)
$ 151,053 $ 92,595 $ (58,457) LDC 38 Building Services (Custodial Cleaning)
$ 97,321 $ 97,321 $ 0
LDC 39Maintenance Operations
Support$ 191 $ 191 $ 0 LDC 39
Maintenance Operations Support
$ 82,341 $ 82,341 $ 0
LDC 93Maintenance
Training$ 37 $ 37 $ 0 LDC 93
Maintenance Training
$ 26,292 $ 26,292 $ 0
Workhour Cost Subtotal $ 372,003 $ 92,824 $ (279,179) Workhour Cost Subtotal $ 1,690,318 $ 1,690,318 $ 0
Other Related Maintenance & Facility Costs Current Cost Proposed Cost Difference
Other Related Maintenance & Facility Costs Current Cost Proposed Cost Difference
TotalMaintenance Parts, Supplies &
Facility Utilities$ 68,143 $ 68,143 $ (0) Total
Maintenance Parts, Supplies & Facility Utilities
$ 241,055 $ 241,055 $ (0)
Adjustments (from "Other Curr vs Prop" tab)
$ 0 Adjustments (from "Other Curr vs Prop" tab)
$ 0
Grand Total $ 440,147 $ 160,967 $ (279,180) Grand Total $ 1,931,373 $ 1,931,373 $ (0)
$279,180 (This number carried forward to the Executive Summary )
(7) Notes:
Annual Maintenance Savings:
rev 04/13/2009
MaintenanceLast Saved:
Bemidji MN CSMPC Fargo ND P&DC
April 9, 2015
Jul-01-2013 Jun-30-2014
Package Page 35 AMP Maintenance
Losing Facility: Gaining Facility:Finance Number: Finance Number:
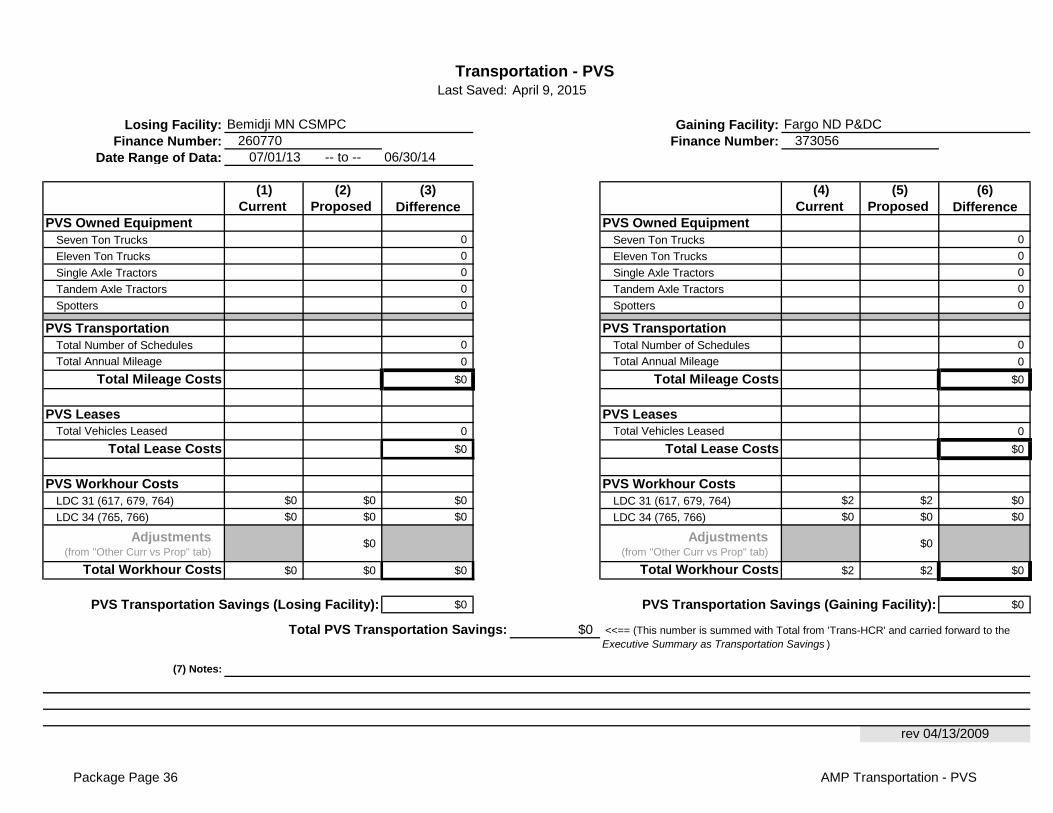
Date Range of Data: 07/01/13 -- to -- 06/30/14
(1) (2) (3) (4) (5) (6)Current Proposed Difference Current Proposed Difference
PVS Owned Equipment PVS Owned EquipmentSeven Ton Trucks 0 Seven Ton Trucks 0
Eleven Ton Trucks 0 Eleven Ton Trucks 0
Single Axle Tractors 0 Single Axle Tractors 0
Tandem Axle Tractors 0 Tandem Axle Tractors 0
Spotters 0 Spotters 0
PVS Transportation PVS TransportationTotal Number of Schedules 0 Total Number of Schedules 0
Total Annual Mileage 0 Total Annual Mileage 0
Total Mileage Costs $0 Total Mileage Costs $0
PVS Leases PVS LeasesTotal Vehicles Leased 0 Total Vehicles Leased 0
Total Lease Costs $0 Total Lease Costs $0
PVS Workhour Costs PVS Workhour CostsLDC 31 (617, 679, 764) $0 $0 $0 LDC 31 (617, 679, 764) $2 $2 $0
LDC 34 (765, 766) $0 $0 $0 LDC 34 (765, 766) $0 $0 $0
Adjustments (from "Other Curr vs Prop" tab)
$0 Adjustments (from "Other Curr vs Prop" tab)
$0
Total Workhour Costs $0 $0 $0 Total Workhour Costs $2 $2 $0
PVS Transportation Savings (Losing Facility): $0 PVS Transportation Savings (Gaining Facility): $0
$0
(7) Notes:
rev 04/13/2009
Transportation - PVS
Bemidji MN CSMPC Fargo ND P&DC
Last Saved: April 9, 2015
Total PVS Transportation Savings:
260770 373056
<<== (This number is summed with Total from 'Trans-HCR' and carried forward to the Executive Summary as Transportation Savings )
Package Page 36 AMP Transportation - PVS
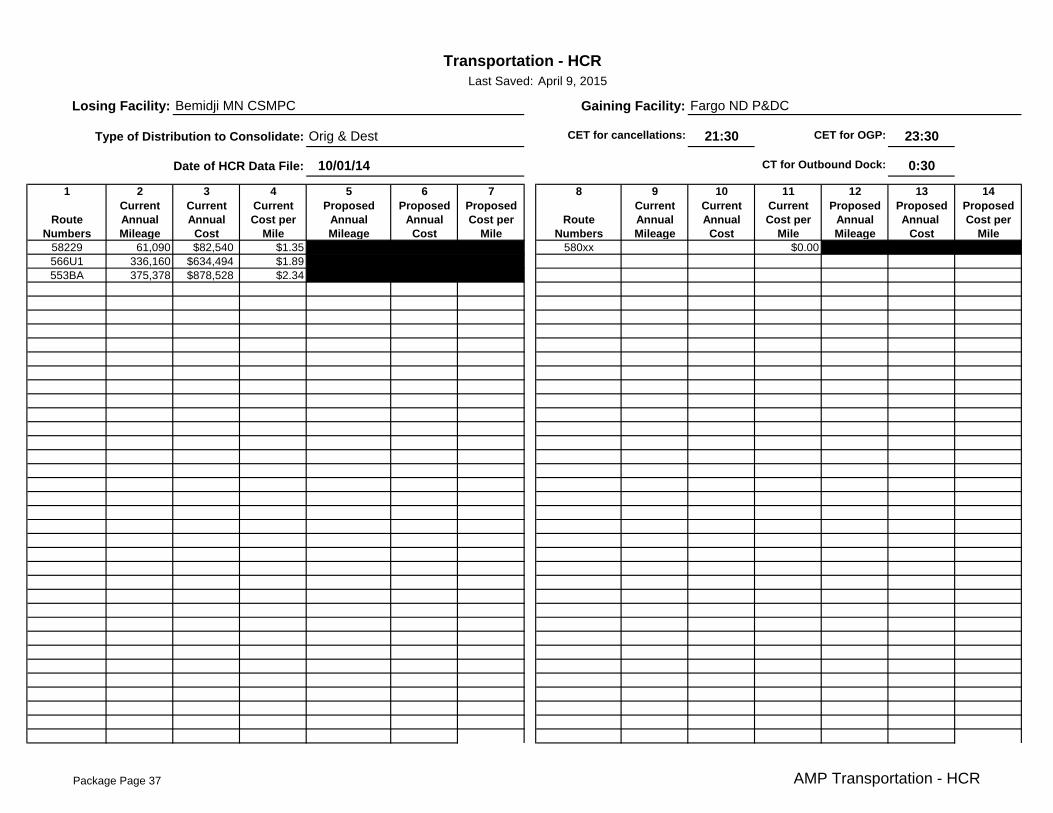
21:30 23:30
0:30
1 2 3 4 5 6 7 8 9 10 11 12 13 14Current Current Current Proposed Proposed Proposed Current Current Current Proposed Proposed Proposed
Route Annual Annual Cost per Annual Annual Cost per Route Annual Annual Cost per Annual Annual Cost perNumbers Mileage Cost Mile Mileage Cost Mile Numbers Mileage Cost Mile Mileage Cost Mile
58229 61,090 $82,540 $1.35 580xx $0.00566U1 336,160 $634,494 $1.89553BA 375,378 $878,528 $2.34
Transportation - HCR Last Saved: April 9, 2015
Losing Facility: Bemidji MN CSMPC Fargo ND P&DC
Orig & Dest
10/01/14
CET for OGP:
CT for Outbound Dock:
Gaining Facility:
Type of Distribution to Consolidate:
Date of HCR Data File:
CET for cancellations:
Package Page 37 AMP Transportation - HCR
1 2 3 4 5 6 7 8 9 10 11 12 13 14Current Current Current Proposed Proposed Proposed Current Current Current Proposed Proposed Proposed
Route Annual Annual Cost per Annual Annual Cost per Route Annual Annual Cost per Annual Annual Cost perNumbers Mileage Cost Mile Mileage Cost Mile Numbers Mileage Cost Mile Mileage Cost Mile
Package Page 38 AMP Transportation - HCR

1 2 3 4 5 6 7 8 9 10 11 12 13 14Current Current Current Proposed Proposed Proposed Current Current Current Proposed Proposed Proposed
Route Annual Annual Cost per Annual Annual Cost per Route Annual Annual Cost per Annual Annual Cost perNumbers Mileage Cost Mile Mileage Cost Mile Numbers Mileage Cost Mile Mileage Cost Mile
$623,813 ($333,216)
Total HCR Transportation Savings:
Other Changes
(+/-)
0 64,779
Moving to Gain (-)
Proposed Trip
Impacts
Current Losing
Proposed ResultTrips from Gaining
Other Changes
(+/-)
Moving to Lose (-)
rev 11/05/2008
Current Gaining
$290,597
64,7790
Proposed Result
HCR Annual Savings (Gaining Facility):
Proposed Trip Impacts
0 0
Trips from Losing
0
<<== (This number is summed with Total from 'Trans-PVS' and carried forward to the Executive Summary as Transportation Savings )
HCR Annual Savings (Losing Facility):
0 0 0
Package Page 39 AMP Transportation - HCR

Orig & Dest
(1) (2)
DMM L011 From:
x X DMM L201 Action Code* Column A - 3-Digit ZIP Code Prefix Group
DMM L601
X X DMM L602
DMM L603 To:
DMM L604 Action Code* Column A - 3-Digit ZIP Code Prefix Group
X DMM L605
DMM L606
DMM L607
X DMM L801
(3)
Action Code*
Action Code*
Action Code*
Action Code*
(4)
Count % Count % Count % Count %
Jul-14 566 96 34 35% 23 24% 0 0% 62 65% 2
Aug-14 566 104 37 36% 20 19% 0 0% 67 64% 1
Jul-14 580 191 59 31% 36 19% 0 0% 132 69% 4
Aug-14 580 177 48 27% 36 20% 0 0% 129 73% 1
(5) Notes:
Closed
Column C - Label to
Column C - Label to
rev 5/14/2009
Drop Shipments for Destination Entry Discounts - FAST Appointment Summary Report
Month Losing/GainingNASS Code
Facility NameTotal
Schd Appts
Gaining Facility FARGO
Unschd Count
Losing Facility BEMIDJI
Losing Facility BEMIDJI
No-Show
DMM L003
DMM L004
*Action Codes: A=add D=delete CF-change from CT=change to
Column B - Label to
Late Arrival Open
DMM Labeling List L201 - Periodicals Origin Split
Column A - Entry ZIP Codes Column B - 3-Digit ZIP Code Destinations Column C - Label to
Gaining Facility FARGO
DMM L009
Distribution Changes
Indicate each DMM labeling list affected by placing an "X" to the left of the list.
Losing Facility:Type of Distribution to Consolidate:
If revisions to DMM L005 or DMM L201 are needed, indicate proposed DMM label change below.
Last Saved: April 9, 2015
Bemidji MN CSMPC
DMM Labeling List L005 - 3-Digit ZIP Code Prefix Groups - SCF Sortation
Column B - Label to
DMM L001
DMM L002
DMM L005
DMM L006
DMM L007
DMM L008
Column B - 3-Digit ZIP Code Destinations
*Action Codes: A=add D=delete CF-change from CT=change to
Important Note: Section 2 & 3 illustrate possible changes to DMM labeling lists. Section 2 relates to consolidation of Destination Operations. Section 3 pertains to Originating Operations. The Area Distribution Network group will submit appropriate requests for DMM changes after AMP approval.
Column A - Entry ZIP Codes Column B - 3-Digit ZIP Code Destinations Column C - Label to
Column A - Entry ZIP Codes
DMM L010
Column A - Entry ZIP Codes Column B - 3-Digit ZIP Code Destinations Column C - Label to
Package Page 40 AMP Distribution Changes
Losing Facility: Gaining Facility:
(1) (2) (3) (4) (5) (6) (7) (8)
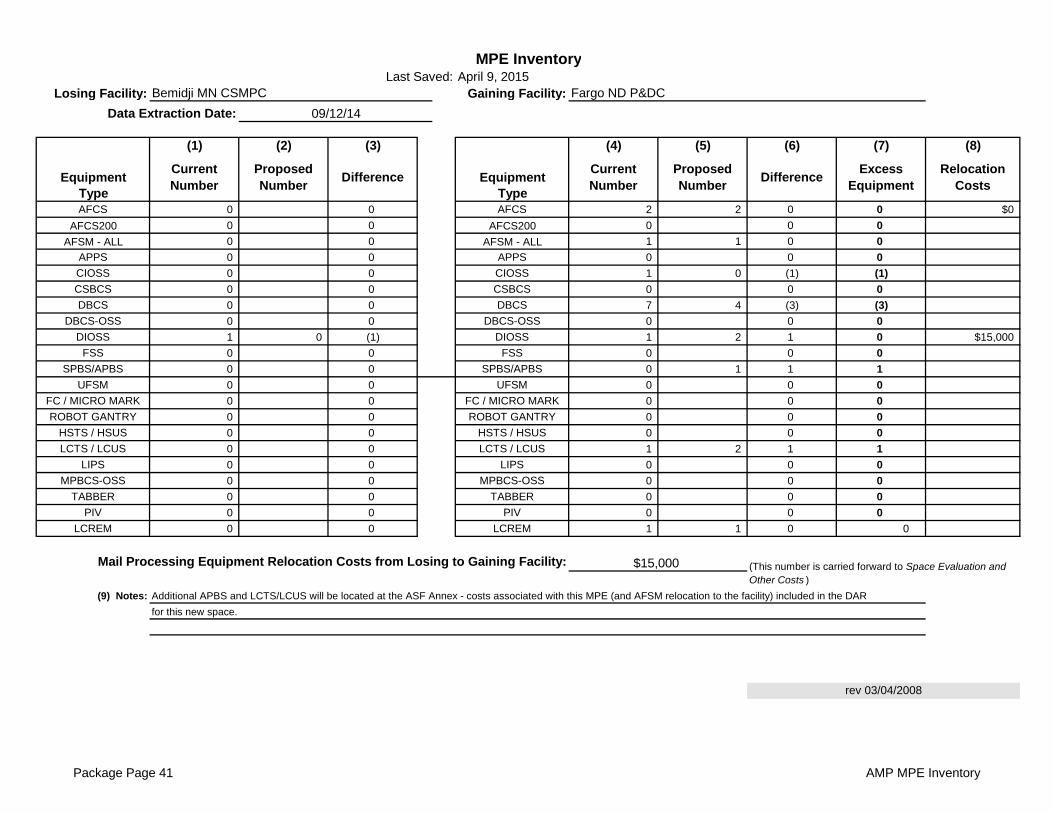
Equipment EquipmentType TypeAFCS 0 0 AFCS 2 2 0 0 $0
AFCS200 0 0 AFCS200 0 0 0
AFSM - ALL 0 0 AFSM - ALL 1 1 0 0
APPS 0 0 APPS 0 0 0
CIOSS 0 0 CIOSS 1 0 (1) (1)
CSBCS 0 0 CSBCS 0 0 0
DBCS 0 0 DBCS 7 4 (3) (3)
DBCS-OSS 0 0 DBCS-OSS 0 0 0
DIOSS 1 0 (1) DIOSS 1 2 1 0 $15,000
FSS 0 0 FSS 0 0 0
SPBS/APBS 0 0 SPBS/APBS 0 1 1 1
UFSM 0 0 UFSM 0 0 0
FC / MICRO MARK 0 0 FC / MICRO MARK 0 0 0
ROBOT GANTRY 0 0 ROBOT GANTRY 0 0 0
HSTS / HSUS 0 0 HSTS / HSUS 0 0 0
LCTS / LCUS 0 0 LCTS / LCUS 1 2 1 1
LIPS 0 0 LIPS 0 0 0
MPBCS-OSS 0 0 MPBCS-OSS 0 0 0
TABBER 0 0 TABBER 0 0 0
PIV 0 0 PIV 0 0 0
LCREM 0 0 LCREM 1 1 0 0
(9) Notes:
MPE Inventory
Additional APBS and LCTS/LCUS will be located at the ASF Annex - costs associated with this MPE (and AFSM relocation to the facility) included in the DAR
Bemidji MN CSMPC Fargo ND P&DC
Current Number
DifferenceRelocation
Costs
Last Saved:
Current Number
Data Extraction Date:
April 9, 2015
09/12/14
rev 03/04/2008
for this new space.
(This number is carried forward to Space Evaluation and Other Costs )
Proposed Number
Proposed Number
Difference
Mail Processing Equipment Relocation Costs from Losing to Gaining Facility: $15,000
Excess Equipment
Package Page 41 AMP MPE Inventory

Last Saved:
09/12/14
3-Digit ZIP Code:
1. Collection Points Mon. - Fri. Sat. Mon. - Fri. Sat. Mon. - Fri. Sat. Sat.
25 47
87 51
6 8
118 106 0 0 0 0 0
2. How many collection boxes are designated for "local delivery"? 0
3. How many "local delivery" boxes will be removed as a result of AMP? 0
4.
Quarter/FY Percent
Q4 2013 27.4%
Q1 2014 36.5%
Q2 2014 30.8%
Q3 2014 3.6%
5. 6.
Start End Start End Start End Start End
Monday 8:30 17:00 8:30 17:00 Monday 8:00 15:00 8:00 15:00
Tuesday 8:30 17:00 8:30 17:00 Tuesday 8:00 15:00 8:00 15:00
Wednesday 8:30 17:00 8:30 17:00 Wednesday 8:00 15:00 8:00 15:00
Thursday 8:30 17:00 8:30 17:00 Thursday 8:00 15:00 8:00 15:00
Friday 8:30 17:00 8:30 17:00 Friday 8:00 15:00 8:00 15:00
Saturday 8:30 12:00 8:30 12:00 Saturday closed closed closed closed
7.
8. Notes:
9.
Line 1
Line 2
Customer Service Issues
Current Proposed
Number picked up after 5 p.m.
Number picked up between 1-5 p.m.
Total Number of Collection Points
Delivery Performance Report
Retail Unit Inside Losing Facility (Window Service Times)
3-Digit ZIP Code:
Current
Losing Facility:
5-Digit ZIP Code:Data Extraction Date:
April 9, 2015
Bemidji MN CSMPC
rev 6/18/2008
56601
Can customers obtain a local postmark in accordance with applicable policies in the Postal Operations Manual ?
Gaining Facility:
What postmark will be printed on collection mail?
Proposed
% Carriers returning after 1700
Date
Number picked up before 1 p.m.
Business (Bulk) Mail Acceptance Hours
Current
Fargo ND P&DC
Yes
0
FARGO ND 581
3-Digit ZIP3-Digit ZIP Code: 566
Mon. - Fri.
Current CurrentCurrent
AMP Customer Service Issues

Last Saved:
1.
2. Lease Information. (If not leased skip to 3 below.)
3.
4. Planned use for acquired space from approved AMP
5. Facility Costs
(This number shown below under One-Time Costs section.
6. Savings Information
(This number carried forward to the Executive Summary )
7. Notes
(This number carried forward to Executive Summary )
07/01/13 :
(3) (6)
$35.35 $35.35
$36.30 $36.30
$217.81 $217.81
$31.19 $31.19
$26.47 $26.47APPS National REC
National REC PARS Redirects National RECPARS Redirects
Remote Encoding Center Cost per 1000
Current Cost per 1,000 Images
Flats
PARS COA
Flats
Letters
PARS COA
(5)
Product
Letters
Gaining Facility:
Current Cost per 1,000 Images
Losing Facility:
(1)
Product
(2)
Enter annual lease cost:
Enter the total interior square footage of the facility:Enter gained square footage expected with the AMP:
Enter lease options/terms:
Current Square Footage
Enter lease expiration date:ownedN/A
Total One-Time Costs: $49,000
(from above)
N/A
24,085
5,371
$34,000
The Bemidji facility will be a dock transfer hub. Remaining excess space will classified as "inactive storage" and be turned over to the FSO for NODE study for determination of best use.
$15,000
Enter any projected one-time facility costs:
$34,000
Space Evaluation and Other Costs
Street Address:City, State ZIP:
Losing Facility:
Space Evaluation
Affected FacilityFacility Name:
April 9, 2015
Bemidji MN CSMPC
Bemidji MN CSMPC401 Irvine Ave SWBemidji MN 56601
Bemidji MN CSMPC Fargo ND P&DC
06/30/14YTD Range of Report:
National REC
APPS National REC
National REC
National REC
National REC
National REC
National REC
Associated REC Associated REC
(4)
$0
Facility Costs:
Mail Processing Equipment Relocation Costs: (from MPE Inventory )
Space Savings ($):
One-Time Costs
Employee Relocation Costs:
Site Prep costs to optimize MPE layout for DBCS platforms
Package Page 43 AMP Space Evaluation and Other Costs


![· ¢ 567|}~ } 56789:; £`¤¥¦§¥ 567| 6¨WfAU FW©NFª] M 567>?N«]NCDrW ¨WfA ZY 6] Su n 567 o¡@ HDZ^567:;6r¥{¬ ®` v]567:;6¯xf°DE{AZY ± / ² 567 ³ ´ 567](https://img.dokumen.tips/doc/110x75/609bcdfd17772368b603b1b8/-567-56789-567-6wfau-fwnf-m-567nncdrw-wfa.jpg)


![Contenido Recuadros€¦ · [565 ] Contenido 18.1 Introducción / 566 18.2 Especies vegetales y animales en el registro arqueológico / 567 18.3 Especies registradas por cronistas](https://img.dokumen.tips/doc/110x75/5ebb1cd0293c262093099807/contenido-recuadros-565-contenido-181-introduccin-566-182-especies-vegetales.jpg)