Embed Size (px)
Citation preview

Type of Distribution to Consolidate: Orig & Dest MODS/BPI Office
Facility Name & Type:Street Address:
City: FayettevilleState: NC
5D Facility ZIP Code: 28301District: Mid-Carolinas
Area: Cap MetroFinance Number: 362681
Current 3D ZIP Code(s):Miles to Gaining Facility: 143
EXFC office: YesPlant Manager:
Senior Plant Manager:District Manager:
Facility Type after AMP: Post Office
Facility Name & Type:Street Address:
City:State: NC
5D Facility ZIP Code: 28228District: Mid-Carolinas
Area: Cap MetroFinance Number: 361393
Current 3D ZIP Code(s):EXFC office: Yes
Plant Manager:Senior Plant Manager:
District Manager:
Start of Study: 9/15/2011Date Range of Data: Jul-01-2010 : Jun-30-2011
Processing Days per Year: 310Bargaining Unit Hours per Year: 1,745
EAS Hours per Year: 1,822
June 16, 2011
2/15/2012 13:31
Area Vice President:Vice President, Network Operations:
Area AMP Coordinator:HQ AMP Coordinator:
rev 10/10/2011
----- AMP Data Entry Page -----
Fayetteville P&DC301 Green St, Suite 200
Thomas K. Daniels
1. Losing Facility Information
Todd Katkow
283, 284
Arthur HelmsAngela H. Curtis
David C FieldsDavid E. Williams
Angela H. Curtis
Charlotte P&DC2901 SCOTT FUTRELL DR
Arthur Helms
4. Other Information
Arthur Helms
Charlotte
280-282, 297
2. Gaining Facility Information
Janet Hester
Date & Time this workbook was last saved:
3. Background Information
Date of HQ memo, DAR Factors/Cost of Borrowing/ New Facility Start-up Costs Update
Package Page 1 AMP Data Entry Page


Losing Facility Name and Type:Street Address:
City, State:
Current 3D ZIP Code(s):
Type of Distribution to Consolidate:
Gaining Facility Name and Type:Current 3D ZIP Code(s):
= $4,112,138
= $550,108
= $2,528,710
= $892,434 from Transportation (HCR and PVS)
= $863,832 from Maintenance
= $0 from Space Evaluation and Other Costs
= $8,947,222
= $465,722 from Space Evaluation and Other Costs
= $8,481,500
= 82 from Staffing - Craft
= 1 from Staffing - PCES/EAS
= 1,683,062 from Workhour Costs - Current
= 4,079,153 from Workhour Costs - Current
=
ADV ADV ADV %
First-Class Mail® 0 0 0 #DIV/0!
Priority Mail® 0 0 0 #DIV/0!
Package Services 0 0 0 #DIV/0!
Periodicals N/A* N/A* N/A* N/A*
Standard Mail N/A* N/A* N/A* N/A*Code to destination 3-digit ZIP Code volume is not
available
Unchanged + Upgrades
Executive SummaryLast Saved: February 15, 2012
Fayetteville P&DC
301 Green St, Suite 200
Fayetteville, NC
283, 284
Orig & Dest Miles to Gaining Facility: 143
Charlotte P&DC
280-282, 297
Summary of AMP Worksheets
Savings/CostsMail Processing Craft Workhour Savings from Workhour Costs - Proposed
Non-MP Craft/EAS + Shared LDCs Workhour Savings (less Maint/Trans) from Other Curr vs Prop
PCES/EAS Supervisory Workhour Savings from Other Curr vs Prop
Transportation Savings
Maintenance Savings
Space Savings
Total Annual Savings
Total One-Time Costs
Total First Year Savings
Staffing Positions
Craft Position Loss
PCES/EAS Position Loss
Volume
Service
rev 10/15/2009
Total FHP to be Transferred (Average Daily Volume)
Current FHP at Gaining Facility (Average Daily Volume)
Losing Facility Cancellation Volume (Average Daily Volume) (= Total TPH / Operating Days)
Service Standard Impacts by ADV
UPGRADED DOWNGRADEDUnchanged +
Upgrades
Package Page 3 AMP Executive Summary

Losing Facility Name and Type:Current 3D ZIP Code(s):
Type of Distribution to Consolidate:
Gaining Facility Name and Type:Current 3D ZIP Code(s):
rev 06/10/2009
February 15, 2012
280-282, 297
Orig & Dest
Summary NarrativeLast Saved:
Fayetteville P&DC
Charlotte P&DC
283, 284
BACKGROUND The Mid-Carolinas Cluster with the assistance of the Capital Metro Area office havecompleted an Area Mail Processing (AMP) feasibility study for the consolidation of originating and destinating mail processing from Fayetteville (Zips 283 and 284) to Charlotte P&DC (ZIPs 280,281,282, and 297). The Fayetteville P&DC is approximately 143 miles from the Charlotte P&DC. This AMP includes the transfer of originatingvolumes for the Kinston ZIP 285 to the Raleigh P&DC The Fayetteville P&DC is a facility with approximately 232,981 square feet of space. The property is owned by the United States Postal Service (USPS). A portion of the facility is currently leased as a federal court house. FINANCIAL SUMMARY The annual baseline data for this AMP feasibility study is taken from the period of July 1, 2010 – June 30, 2011. Financial savings proposed for the consolidation of an average daily volume of 2,563,742 FHP from the Fayetteville P&DC into the Charlotte P&DC are: Total First Year Savings $8,481,500 Total Annual Savings $8,947,222 A one-time cost of $465,722 will be incurred for the relocation of and site prep for mail processing equipment transferred from the Fayetteville P&DC to the Charlotte P&DC. CUSTOMER & SERVICE IMPACTS The Fayetteville P&DC will be retained as the Fayetteville Hub and Fayetteville Post Office (Finance #36-2680). There will be no change to the current retail (window) operations or hours and availability times for the Fayetteville PO (Finance #36-2680). PO Box customers will remain as current. Caller service and mail acceptance times/locations/hours will remain as current (Fayetteville PO). No delivery and collection modifications are anticipated for the 284 AO’s. Local collection box pickup times will remain unchanged and a local postmark will continue to be available at the retail service locations. The resources necessary to perform the BMEU functions assigned to this unit are provided for in the Fayetteville Post Office existing staffing and operations budget, Finance #36-2680; the remaining Hub operations proposed staffing and funding provided for in the study will be transferred to this unit's responsibility with implementation. Specific service standard changes associated with this Area Mail Processing consolidation are contingent upon the resolution of both (a) the rulemaking in which current market dominant product service standards in 39 CFR Part 121 are being evaluated, and (b) all remaining AMP consolidation proposals that are part of the same network rationalization initiative. A complete file reflecting any new service standards will be published at www.usps.com once all of the related AMP decisions that provide the foundation for new service standards are made. Priority and Express Mail service standards will be based upon the capability of the network.
Package Page 4 AMP Summary Narrative


rev 06/10/2009
Summary Narrative Page 3
Summary Narrative (continued)
HCR 283NE –Fayetteville P&DC NC – Southeast Area HASP Eliminate Fayetteville and Downing Rd stops from this contract due to service no longer needed. The Raleigh P&DC service to be maintained. This would be a reduction of
HCR 283L9 –Fayetteville P&DC NC – Asheville P&DF Eliminate this contract due to service no longer needed. This would be a reduction of
HCR 283BA –Fayetteville P&DC NC – Haymount Station NC Eliminate shuttle trips and reduce trips to the various stations. Annual mileage on HCR route would decrease from 170,646 to 64,640. Cost would decrease from
nnually. HCR transportation transports Express, Priority, First Class and Standard Mails between the Fayetteville P&DC and various city stations. HCR 283L8 –Fayetteville P&DC NC – Wilmington NC Eliminate all except one (1) round trip on this contract. Annual mileage on HCR route
HCR transportation transports Express, Priority, First Class and Standard Mails between the Fayetteville P&DC and various Wilmington city stations. HCR 28311 –Fayetteville P&DC NC – Wilmington NC Change the head out point of this contract to Wilmington –Myrtle Grove Station. This contract will cover transportation to the Wilmington City Stations and 284 offices. This would also encompass other highway routes 284L3 and 28469
ld
annually. HCR transportation transports Express, Priority, First Class and Standard Mails between the Fayetteville P&DC and various Wilmington city stations.
INCREASED COST HCR 28011 – Charlotte P&DC NC – Fayetteville P&DC NC Currently the contract calls for six (6) straight trucks. This requirement will need to be altered to ten (10) fifty-three (53) foot tractor – trailers (3000 cube). This may add additional cost to the contract. The number of trips and schedules would also have to be adjusted to accommodate the additional volumes. Fayetteville would need eight (8) AM trips to transport mails to Fayetteville. It will also require eight (8) trips in the evening to bring mails into Fayetteville. The estimated annual miles increas HCR (NEW) – Charlotte P&DC NC – Wilmington NC By using Myrtle Grove Station in Wilmington as a hub, a new contract will be needed to transport mail in and out of Charlotte. This contract will require four (4) fifty-three (53) foot tractor – trailers (3000 cube). The schedule will require four (4) AM trips to transport mails to Wilmington. It will also require four (4) trips in the evening to bring mails back into Charlotte P&DC.
Package Page 6 AMP Summary Narrative


rev 06/10/2009
Summary Narrative (continued)Summary Narrative Page 5
As a matter of policy, the Postal Service follows the Worker Adjustment and Retraining Notification Act’s (“WARN”) notification requirements when the number of employees experiencing an employment loss within the meaning of WARN would trigger WARN’s requirements. Some or all of the impacted employees described above may not experience an employment loss within the meaning of WARN due to transfers or reassignments. EQUIPMENT RELOCATION AND MAINTENANCE IMPACTS The AMP feasibility study projects an annual Maintenance savings of $863,862 Equipment identified for relocation from the Fayetteville P&DC to support operations at the Charlotte P&DC. The relocation costs are expected to be approximately $465,722. SPACE IMPACTS The Downing Road Annex will become available for other operational activities and/or depostalization. Capital Metro Area will work with EFSO to make the Facility available to sale if determined. AADC CHANGE: Charlotte will have to be changed to the AADC for Fayetteville Letter mail. We are currently the AADC for Flats. We will see an increase in volume but will lose the Asheville and Hickory Volumes. We will also have to change the Priority Air to come into Charlotte. It currently comes in thru Raleigh.
Package Page 8 AMP Summary Narrative


Overnight % Change All Others % Change Total % Change All % Change All % Change All % Change All % Change All % Change
UPGRADE
DOWNGRADE
TOTAL
NET UP+NO CHNG
VOLUME TOTAL
* - Periodical and Standard mail origin 3-digit ZIP Code to destination 3-digit ZIP Code volume is not available
Overnight % Change All Others % Change Total % Change All % Change All % Change All % Change All % Change All % Change
UPGRADE
DOWNGRADE
TOTAL
NET
Fayetteville P&DC
283, 284280-282, 297Gaining Facility 3D ZIP Code(s):
Service Standard Changes - PairsFCM PRI
PSVC
Service Standard Changes - Average Daily Volume (data obtained from ODIS is derived from sampling and may vary from actual volume)
PSVC ALL CLASSES
rev 10/16/2009
Losing Facility 3D ZIP Code(s):
mm/dd/yyyy
Selected summary fields are transferred to the Executive Summary
PER STD
January 26, 2012
Losing Facility:
Service Standard Impacts
PRI ALL CLASSESSTD *FCM PER *
Based on report prepared by Network Integration Support dated:
Last Saved:
Package Page 11 AMP Service Standard Impacts

Last Saved: Stakeholder Notification Page 1
AMP Event: Start of Study
rev 07/16/2008
Stakeholders Notification Losing Facility:
January 26, 2012(WorkBook Tab Notification - 1)
Fayetteville P&DC
Package Page 12 AMP Stakeholders Notification
Last Saved:
07/01/10 <<=== ===>> 06/30/11
LDC LDC LDC LDC
11 $42.17 41 $0.00 11 $42.97 41 $0.00
12 $49.35 42 $0.00 12 $46.01 42 $0.00
13 $44.49 43 $35.75 13 $36.85 43 $0.00
14 $43.16 44 $36.93 14 $43.98 44 $0.00
15 $35.79 45 $35.89 15 $45.06 45 $0.00
16 $0.00 46 $0.00 16 $0.00 46 $0.00
17 $40.99 47 $0.00 17 $39.63 47 $0.00
18 $40.84 48 $36.89 18 $42.19 48 $81.62
(1) (2) (3) (4) (5) (6) (7) (8) (9) (10) (11) (12) (13) (14)Current Current Current Current Current Current Current Current Current Current Current Current
Operation Annual FHP Annual TPH or Annual Productivity Annual Operation Annual FHP Annual TPH or Annual Productivity AnnualNumbers Workhour Costs Numbers Volume NATPH Volume Workhours (TPH or NATPH) Workhour Costs
002 100.0% $88,802 ] 002 $102,484003 100.0% $4 ] 003 $15009 100.0% $0 ] 009 $0010 100.0% $168,521 ] 010 $66,716011 100.0% $445 ] 011 $0012 100.0% $65,570 ] 012 $0014 100.0% $70,025 ] 014 $8,033015 100.0% $254,086 ] 015 $509,537017 100.0% $34,549 ] 017 $747,622018 100.0% $40 ] 018 $0020 100.0% $115 ] 020 $0021 100.0% $0 ] 021 $0022 100.0% $126,060 ] 022 $0030 100.0% $525,732 ] 030 $827,033040 100.0% $107,627 ] 040 $567,525044 100.0% $808,231 ] 044 $684,855046 100.0% $0 ] 046 $0053 100.0% $315 ] 053 $0055 100.0% $3,149 ] 055 $416,019056 100.0% $175 ] 056 $0060 100.0% $271,287 ] 060 $174,077063 100.0% $7,424 ] 063 $0066 100.0% $0 ] 066 $0067 100.0% $0 ] 067 $0070 100.0% $77,917 ] 070 $20,649074 100.0% $385,790 ] 074 $77,895081 100.0% $218 ] 081 $0082 100.0% $77 ] 082 $0083 100.0% $16,185 ] 083 $100084 100.0% $112,307 ] 084 $0087 100.0% $0 ] 087 $0089 100.0% $65,232 ] 089 $0091 100.0% $41,462 ] 091 $72,857092 100.0% $33,302 ] 092 $37,643093 100.0% $32,010 ] 093 $17,419094 100.0% $493 ] 094 $0095 100.0% $0 ] 095 $0096 100.0% $96 ] 096 $107097 100.0% $15,163 ] 097 $465,865098 100.0% $36,845 ] 098 $32,921
January 26, 2012
Workhour Costs - Current
Fayetteville P&DC Charlotte P&DC
Losing Current Workhour Rate by LDC
Function 4Function 1
% Moved to Losing
% Moved to Gaining
Losing Facility: Gaining Facility:
Date Range of Data
Function 1
Gaining Current Workhour Rate by LDC
Function 4
Package Page 13 AMP Workhour Costs - Current

(1) (2) (3) (4) (5) (6) (7) (8) (9) (10) (11) (12) (13) (14)Current Current Current Current Current Current Current Current Current Current Current Current
Operation Annual FHP Annual TPH or Annual Productivity Annual Operation Annual FHP Annual TPH or Annual Productivity AnnualNumbers Volume NATPH Volume Workhours (TPH or NATPH) Workhour Costs Numbers Volume NATPH Volume Workhours (TPH or NATPH) Workhour Costs
% Moved to Losing
% Moved to Gaining
099 100.0% $59,789 ] 099 $47,603100 100.0% $100,356 ] 200 $523,505110 100.0% $11,380 ] 110 $22,930117 100.0% $140,337 ] 117 $2,528,059118 100.0% $142 ] 118 $0122 100.0% $77,618 ] 122 $0123 100.0% $182,595 ] 123 $82,253125 100.0% $4,145 ] 125 $12,621126 100.0% $133,328 ] 126 $401,050127 100.0% $86 ] 127 $0128 100.0% $185 ] 128 $0137 25.0% $662,363 ] 137 $0140 100.0% $780,861 ] 140 $188,215168 100.0% $303 ] 168 $0169 100.0% $392,058 ] 169 $0170 100.0% $0 ] 170 $498,276178 100.0% $0 ] 178 $0179 100.0% $0 ] 179 $0181 100.0% $409,129 ] 181 $0185 100.0% $130,251 ] 185 $0200 100.0% $0 ] 200dup209 100.0% $31 ] 209 $0210 38.0% $462,453 ] 210 $374,765211 85.0% $1,600,060 ] 211 $379,155212 100.0% $10,811 ] 212 $1,203,633213 100.0% $549,347 ] 213 $134,085215 100.0% $269,683 ] 180 $246,150229 100.0% $198,901 ] 229 $852,091230 100.0% $53,005 ] 230 $1,129,258231 81.0% $977,142 ] 231 $29,725233 100.0% $122,731 ] 233 $283,717234 100.0% $402 ] 234 $0240 100.0% $20 ] 240 $0261 100.0% $7,936 ] 261 $0271 100.0% $345,048 ] 271 $517,617272 100.0% $11 ] 272 $1,200281 100.0% $137,423 ] 281 $700,009282 100.0% $45,709 ] 282 $0286 100.0% $65 ] 286 $0324 100.0% $124,977 ] 324 $0461 100.0% $33,258 ] 331 $23,556464 100.0% $504,175 ] 334 $15,166466 100.0% $223,676 ] 336 $1,123,469468 100.0% $0 ] 337 $0481 100.0% $24,610 ] 481 $9,337489 100.0% $239 ] 489 $93549 100.0% $95,406 ] 549 $36,220554 100.0% $472,147 ] 554 $578,425560 100.0% $71,605 ] 560 $470,717561 100.0% $169 ] 561 $0562 100.0% $8,742 ] 562 $158,692563 100.0% $138,012 ] 563 $0564 100.0% $97,295 ] 564 $347,213565 100.0% $128,221 ] 565 ($946)573 100.0% $90,868 ] 573 $0585 100.0% $235,217 ] 585 $899,200607 100.0% $262,858 ] 607 $408,861612 100.0% $19,621 ] 612 $73,058620 100.0% $50,218 ] 620 $47,129630 100.0% $67,176 ] 630 $0
Package Page 14 AMP Workhour Costs - Current

(1) (2) (3) (4) (5) (6) (7) (8) (9) (10) (11) (12) (13) (14)Current Current Current Current Current Current Current Current Current Current Current Current
Operation Annual FHP Annual TPH or Annual Productivity Annual Operation Annual FHP Annual TPH or Annual Productivity AnnualNumbers Volume NATPH Volume Workhours (TPH or NATPH) Workhour Costs Numbers Workhour Costs
% Moved to Losing
% Moved to Gaining
677 100.0% $57,666 ] 677 $0891 100.0% $96,800 ] 891 $336,334892 100.0% $8,700 ] 892 $8,108894 100.0% $1,937,060 ] 894 $1,054,149896 100.0% $2,446,100 ] 896 $384,614898 100.0% $442 ] 898 $221899 100.0% $0 ] 899 $0918 100.0% $455,249 ] 918 $4,179,406919 100.0% $162,257 ] 919 $725,362930 100.0% $39,351 ] 930 $220,962050 $235 050 $3,827120 $73,680 120 $546121 $3,791 121 $67,777134 $151 134 $0136 $146,267 136 $0138 $173,435 138 $0139 $961,894 139 $0208 $55,373 208 $45,876232 $127,071 232 $496,764320 $196 320 $0321 $965,387 321 $0322 $4,236 322 $0
035 $0043 $825,946047 $7,011073 $670,747088 $0112 $457,136114 $400,626115 $0124 $76,659129 $36,972132 $1,367,737150 $792,111
180dup225 $78,445235 $143,968264 $11,810284 $318
331dup332 $1,097333 $1,229,186
334dup335 $35,252
336dup337dup
340 $472464 $317466 $6,205468 $0486 $3,774488 $0776 $71,891793 $279,236893 $2,761,082895 $404897 $276,674961 $22,759963 $4,567964 $166,940
Package Page 15 AMP Workhour Costs - Current

(1) (2) (3) (4) (5) (6) (7) (8) (9) (10) (11) (12) (13) (14)Current Current Current Current Current Current Current Current Current Current Current Current
Operation Annual FHP Annual TPH or Annual Productivity Annual Operation Annual FHP Annual TPH or Annual Productivity AnnualNumbers Volume NATPH Volume Workhours (TPH or NATPH) Workhour Costs Numbers Volume NATPH Volume Workhours (TPH or NATPH) Workhour Costs
% Moved to Losing
% Moved to Gaining
Package Page 16 AMP Workhour Costs - Current
(1) (2) (3) (4) (5) (6) (7) (8) (9) (10) (11) (12) (13) (14)Current Current Current Current Current Current Current Current Current Current Current Current
Operation Annual FHP Annual TPH or Annual Productivity Annual Operation Annual FHP Annual TPH or Annual Productivity AnnualNumbers Volume NATPH Volume Workhours (TPH or NATPH) Workhour Costs Numbers Volume NATPH Volume Workhours (TPH or NATPH) Workhour Costs
% Moved to Losing
% Moved to Gaining
Package Page 17 AMP Workhour Costs - Current

(1) (2) (3) (4) (5) (6) (7) (8) (9) (10) (11) (12) (13) (14)Current Current Current Current Current Current Current Current Current Current Current Current
Operation Annual FHP Annual TPH or Annual Productivity Annual Operation Annual FHP Annual TPH or Annual Productivity AnnualNumbers Volume NATPH Volume Workhours (TPH or NATPH) Workhour Costs Numbers Volume NATPH Volume Workhours (TPH or NATPH) Workhour Costs
% Moved to Losing
% Moved to Gaining
Moved to Gain 521,749,234 1,529,353,630 453,453 3,373 $19,067,070 Impact to Gain 766,713,751 2,658,354,999 622,448 4,271 $26,084,635Impact to Lose 0 0 0 No Calc $0 Moved to Lose 0 0 0 No Calc $0Total Impact 521,749,234 1,529,353,630 453,453 3,373 $19,067,070 Total Impact 766,713,751 2,658,354,999 622,448 4,271 $26,084,635Non-impacted 5,739,875 25,365,384 57,632 440 $2,511,718 Non-impacted 0 1,378,146 14,744 93 $614,791
Gain Only 497,823,644 757,884,071 226,211 3,350 $9,729,341All 527,489,109 1,554,719,014 511,086 3,042 $21,578,788 All 1,264,537,395 3,417,617,216 863,403 3,958 $36,428,767
Impact to Gain 1,288,462,985 4,187,708,629 1,075,901 3,892 $45,151,705Impact to Lose 0 0 0 No Calc $0Total Impact 1,288,462,985 4,187,708,629 1,075,901 3,892 $45,151,705Non-impacted 5,739,875 26,743,530 72,376 370 $3,126,509
Gain Only 497,823,644 757,884,071 226,211 3,350 $9,729,341All 1,792,026,504 4,972,336,230 1,374,488 3,618 $58,007,555
.
rev 06/11/2008
Comb Totals
Totals Totals
(This number is carried forward to AMP Worksheet Executive Summary )
Combined Current Workhour Annual Workhour Costs :
1,683,062 Total FHP to be Transferred (Average Daily Volume) :
(This number is carried forward to the bottom of AMP Worksheet Workhour Costs-Proposed )$58,007,555
Current FHP at Gaining Facility (Average Daily Volume) : 4,079,153 (This number is carried forward to AMP Worksheet Executive Summary )
Package Page 18 AMP Workhour Costs - Current

Last Saved:
Losing Facility: Gaining Facility:
(1) (2) (3) (4) (5) (6) (7) (8) (9) (10) (11) (12)Proposed Proposed Proposed Proposed Proposed Proposed Proposed Proposed Proposed Proposed Proposed ProposedOperation Annual FHP Annual TPH or Annual Productivity Annual Operation Annual FHP Annual TPH or Annual Productivity AnnualNumbers Workhour Costs Numbers Volume NATPH Volume Workhours (TPH or NATPH) Workhour Costs
002 $0 002 $188,331003 $0 003 $19009 $0 009 $0010 $0 010 $229,630011 $0 011 $0012 $0 012 $63,388014 $0 014 $75,728015 $0 015 $660,445017 $0 017 $781,021018 $0 018 $39020 $0 020 $111021 $0 021 $0022 $0 022 $121,865030 $0 030 $1,321,773040 $0 040 $656,861044 $0 044 $1,463,038046 $0 046 $20053 $0 053 $0055 $0 055 $406,650056 $0 056 $0060 $0 060 $436,953063 $0 063 $7,337066 $0 066 $6,759067 $0 067 $6,487070 $0 070 $97,030074 $0 074 $456,813081 $0 081 $0082 $0 082 $0083 $0 083 $16,818084 $0 084 $108,570087 $0 087 $5,338089 $0 089 $63,061091 $0 091 $350,060092 $0 092 $62,403093 $0 093 $189,941094 $0 094 $20,026095 $0 095 $13,405096 $0 096 $15,052097 $0 097 $255,387098 $0 098 $39,348099 $0 099 $74,973100 $0 200 $606,976110 $0 110 $33,931117 $0 117 $2,663,727118 $0 118 $137122 $0 122 $75,035123 $0 123 $258,773125 $0 125 $16,628126 $0 126 $529,942
Workhour Costs - Proposed
Fayetteville P&DC
January 26, 2012
Charlotte P&DC
Package Page 19 AMP Workhour Costs - Proposed
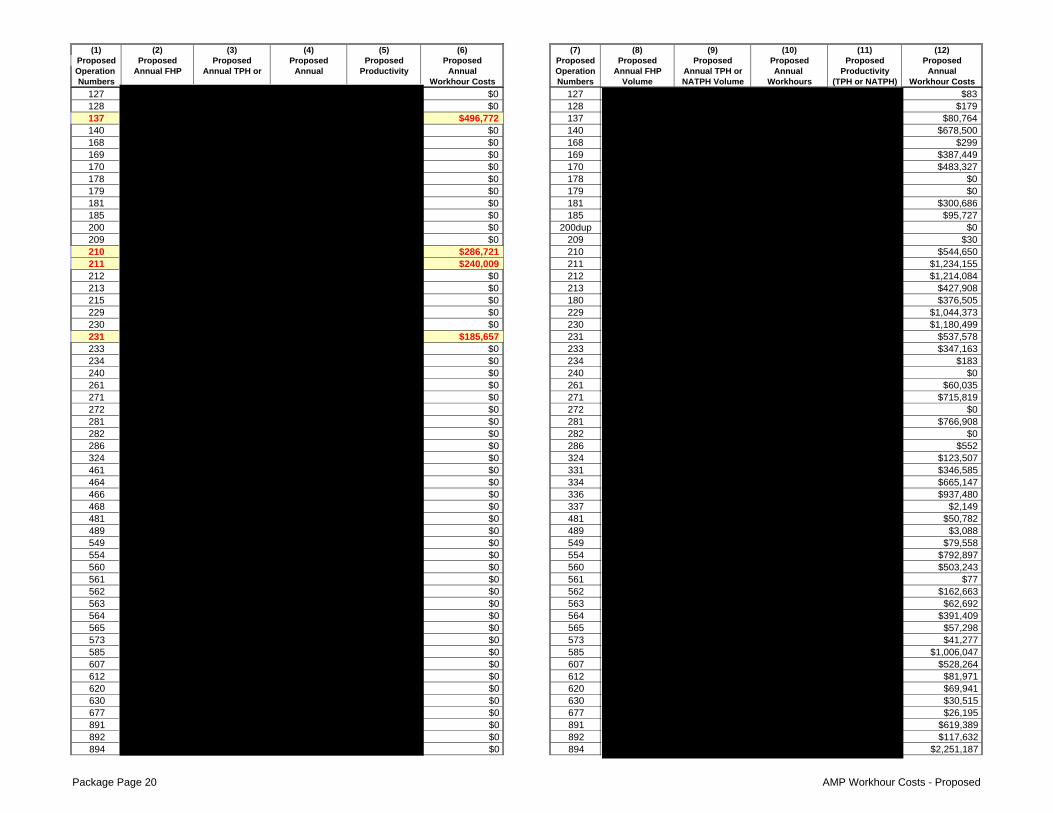
(1) (2) (3) (4) (5) (6) (7) (8) (9) (10) (11) (12)Proposed Proposed Proposed Proposed Proposed Proposed Proposed Proposed Proposed Proposed Proposed ProposedOperation Annual FHP Annual TPH or Annual Productivity Annual Operation Annual FHP Annual TPH or Annual Productivity AnnualNumbers Workhour Costs Numbers Volume NATPH Volume Workhours (TPH or NATPH) Workhour Costs
127 $0 127 $83128 $0 128 $179137 $496,772 137 $80,764140 $0 140 $678,500168 $0 168 $299169 $0 169 $387,449170 $0 170 $483,327178 $0 178 $0179 $0 179 $0181 $0 181 $300,686185 $0 185 $95,727200 $0 200dup $0209 $0 209 $30210 $286,721 210 $544,650211 $240,009 211 $1,234,155212 $0 212 $1,214,084213 $0 213 $427,908215 $0 180 $376,505229 $0 229 $1,044,373230 $0 230 $1,180,499231 $185,657 231 $537,578233 $0 233 $347,163234 $0 234 $183240 $0 240 $0261 $0 261 $60,035271 $0 271 $715,819272 $0 272 $0281 $0 281 $766,908282 $0 282 $0286 $0 286 $552324 $0 324 $123,507461 $0 331 $346,585464 $0 334 $665,147466 $0 336 $937,480468 $0 337 $2,149481 $0 481 $50,782489 $0 489 $3,088549 $0 549 $79,558554 $0 554 $792,897560 $0 560 $503,243561 $0 561 $77562 $0 562 $162,663563 $0 563 $62,692564 $0 564 $391,409565 $0 565 $57,298573 $0 573 $41,277585 $0 585 $1,006,047607 $0 607 $528,264612 $0 612 $81,971620 $0 620 $69,941630 $0 630 $30,515677 $0 677 $26,195891 $0 891 $619,389892 $0 892 $117,632894 $0 894 $2,251,187
Package Page 20 AMP Workhour Costs - Proposed

(1) (2) (3) (4) (5) (6) (7) (8) (9) (10) (11) (12)Proposed Proposed Proposed Proposed Proposed Proposed Proposed Proposed Proposed Proposed Proposed ProposedOperation Annual FHP Annual TPH or Annual Productivity Annual Operation Annual FHP Annual TPH or Annual Productivity AnnualNumbers Workhour Costs Numbers Volume NATPH Volume Workhours (TPH or NATPH) Workhour Costs
896 $0 896 $830,840898 $0 898 $14,887899 $0 899 $10,686918 $0 918 $3,589,177919 $0 919 $3,420,693930 $0 930 $238,837050 $0 050 $3,712120 $73,680 120 $546121 $3,791 121 $67,777134 $151 134 $0136 $146,267 136 $0138 $173,435 138 $0139 $961,894 139 $0208 $55,373 208 $45,876232 $127,071 232 $496,764320 $0 320 $0321 $965,387 321 $0322 $0 322 $0
0 No Calc 035 $00 No Calc 043 $801,1670 No Calc 047 $00 No Calc 073 $650,6250 No Calc 088 $00 No Calc 112 $457,1360 No Calc 114 $400,6260 No Calc 115 $00 No Calc 124 $76,6590 No Calc 129 $36,9720 No Calc 132 $1,367,7370 No Calc 150 $768,3470 No Calc 180dup $00 No Calc 225 $78,4450 No Calc 235 $143,9680 No Calc 264 $8,0700 No Calc 284 $00 No Calc 331dup $00 No Calc 332 $80,6500 No Calc 333 $758,3970 No Calc 334dup $00 No Calc 335 $110,9260 No Calc 336dup $00 No Calc 337dup $00 No Calc 340 $4720 No Calc 464 $00 No Calc 466 $00 No Calc 468 $00 No Calc 486 $41,6060 No Calc 488 $3240 No Calc 776 $34,0520 No Calc 793 $279,2360 No Calc 893 $1,602,6020 No Calc 895 $1,1970 No Calc 897 $501,9090 No Calc 961 $40,5640 No Calc 963 $1,629
Package Page 21 AMP Workhour Costs - Proposed

(1) (2) (3) (4) (5) (6) (7) (8) (9) (10) (11) (12)Proposed Proposed Proposed Proposed Proposed Proposed Proposed Proposed Proposed Proposed Proposed ProposedOperation Annual FHP Annual TPH or Annual Productivity Annual Operation Annual FHP Annual TPH or Annual Productivity AnnualNumbers Volume NATPH Volume Workhours (TPH or NATPH) Workhour Costs Numbers Workhour Costs
0 No Calc 964 $115,4100 No Calc 0 No Calc0 No Calc 0 No Calc0 No Calc 0 No Calc0 No Calc 0 No Calc0 No Calc 0 No Calc0 No Calc 0 No Calc0 No Calc 0 No Calc0 No Calc 0 No Calc0 No Calc 0 No Calc0 No Calc 0 No Calc0 No Calc 0 No Calc0 No Calc 0 No Calc0 No Calc 0 No Calc0 No Calc 0 No Calc0 No Calc 0 No Calc0 No Calc 0 No Calc0 No Calc 0 No Calc0 No Calc 0 No Calc0 No Calc 0 No Calc0 No Calc 0 No Calc0 No Calc 0 No Calc0 No Calc 0 No Calc0 No Calc 0 No Calc0 No Calc 0 No Calc0 No Calc 0 No Calc0 No Calc 0 No Calc0 No Calc 0 No Calc0 No Calc 0 No Calc0 No Calc 0 No Calc0 No Calc 0 No Calc0 No Calc 0 No Calc0 No Calc 0 No Calc0 No Calc 0 No Calc0 No Calc 0 No Calc0 No Calc 0 No Calc0 No Calc 0 No Calc0 No Calc 0 No Calc0 No Calc 0 No Calc0 No Calc 0 No Calc0 No Calc 0 No Calc0 No Calc 0 No Calc0 No Calc 0 No Calc0 No Calc 0 No Calc0 No Calc 0 No Calc0 No Calc 0 No Calc0 No Calc 0 No Calc0 No Calc 0 No Calc0 No Calc 0 No Calc0 No Calc 0 No Calc0 No Calc 0 No Calc0 No Calc 0 No Calc0 No Calc 0 No Calc0 No Calc 0 No Calc0 No Calc 0 No Calc
Package Page 22 AMP Workhour Costs - Proposed

(1) (2) (3) (4) (5) (6) (7) (8) (9) (10) (11) (12)Proposed Proposed Proposed Proposed Proposed Proposed Proposed Proposed Proposed Proposed Proposed ProposedOperation Annual FHP Annual TPH or Annual Productivity Annual Operation Annual FHP Annual TPH or Annual Productivity AnnualNumbers Volume NATPH Volume Workhours (TPH or NATPH) Workhour Costs Numbers Volume NATPH Volume Workhours (TPH or NATPH) Workhour Costs
0 No Calc 0 No Calc0 No Calc 0 No Calc0 No Calc 0 No Calc0 No Calc 0 No Calc0 No Calc 0 No Calc0 No Calc 0 No Calc0 No Calc 0 No Calc0 No Calc 0 No Calc0 No Calc 0 No Calc0 No Calc 0 No Calc0 No Calc 0 No Calc0 No Calc 0 No Calc0 No Calc 0 No Calc0 No Calc 0 No Calc0 No Calc 0 No Calc0 No Calc 0 No Calc0 No Calc 0 No Calc0 No Calc 0 No Calc0 No Calc 0 No Calc0 No Calc 0 No Calc0 No Calc 0 No Calc0 No Calc 0 No Calc0 No Calc 0 No Calc0 No Calc 0 No Calc0 No Calc 0 No Calc0 No Calc 0 No Calc0 No Calc 0 No Calc0 No Calc 0 No Calc0 No Calc 0 No Calc0 No Calc 0 No Calc0 No Calc 0 No Calc0 No Calc 0 No Calc0 No Calc 0 No Calc0 No Calc 0 No Calc0 No Calc 0 No Calc0 No Calc 0 No Calc0 No Calc 0 No Calc0 No Calc 0 No Calc0 No Calc 0 No Calc0 No Calc 0 No Calc0 No Calc 0 No Calc0 No Calc 0 No Calc0 No Calc 0 No Calc0 No Calc 0 No Calc0 No Calc 0 No Calc0 No Calc 0 No Calc0 No Calc 0 No Calc0 No Calc 0 No Calc0 No Calc 0 No Calc0 No Calc 0 No Calc0 No Calc 0 No Calc0 No Calc 0 No Calc0 No Calc 0 No Calc0 No Calc 0 No Calc0 No Calc 0 No Calc
Package Page 23 AMP Workhour Costs - Proposed

(1) (2) (3) (4) (5) (6) (7) (8) (9) (10) (11) (12)Proposed Proposed Proposed Proposed Proposed Proposed Proposed Proposed Proposed Proposed Proposed ProposedOperation Annual FHP Annual TPH or Annual Productivity Annual Operation Annual FHP Annual TPH or Annual Productivity AnnualNumbers Volume NATPH Volume Workhours (TPH or NATPH) Workhour Costs Numbers Volume NATPH Volume Workhours (TPH or NATPH) Workhour Costs
0 No Calc 0 No Calc0 No Calc 0 No Calc0 No Calc 0 No Calc0 No Calc 0 No Calc0 No Calc 0 No Calc0 No Calc 0 No Calc0 No Calc 0 No Calc0 No Calc 0 No Calc0 No Calc 0 No Calc0 No Calc 0 No Calc0 No Calc 0 No Calc0 No Calc 0 No Calc0 No Calc 0 No Calc0 No Calc 0 No Calc0 No Calc 0 No Calc0 No Calc 0 No Calc0 No Calc 0 No Calc0 No Calc 0 No Calc0 No Calc 0 No Calc0 No Calc 0 No Calc0 No Calc 0 No Calc0 No Calc 0 No Calc0 No Calc 0 No Calc0 No Calc 0 No Calc0 No Calc 0 No Calc0 No Calc 0 No Calc0 No Calc 0 No Calc0 No Calc 0 No Calc0 No Calc 0 No Calc0 No Calc 0 No Calc0 No Calc 0 No Calc0 No Calc 0 No Calc0 No Calc 0 No Calc0 No Calc 0 No Calc0 No Calc 0 No Calc0 No Calc 0 No Calc0 No Calc 0 No Calc0 No Calc 0 No Calc0 No Calc 0 No Calc0 No Calc 0 No Calc0 No Calc 0 No Calc
Moved to Gain 0 2,693,650 28,544 94 $1,209,159 Impact to Gain 1,288,462,985 4,185,014,979 951,174 4,400 $39,913,399Impact to Lose 0 0 0 No Calc $0 Moved to Lose 0 0 0 No Calc $0Total Impact 0 2,693,650 28,544 94 $1,209,159 Total Impact 1,288,462,985 4,185,014,979 951,174 4,400 $39,913,399Non Impacted 5,739,875 25,365,384 57,524 441 $2,507,050 Non Impacted 0 1,378,146 14,742 93 $614,676
Gain Only 497,823,644 757,884,071 194,848 3,890 $8,358,723All 5,739,875 28,059,035 86,068 326 $3,716,209 All 1,786,286,629 4,944,277,196 1,160,764 4,260 $48,886,799
Package Page 24 AMP Workhour Costs - Proposed

(1) (2) (3) (4) (5) (6) (7) (8) (9) (10) (11) (12)Proposed Proposed Proposed Proposed Proposed Proposed Proposed Proposed Proposed Proposed Proposed ProposedOperation Annual FHP Annual TPH or Annual Productivity Annual Operation Annual FHP Annual TPH or Annual Productivity AnnualNumbers Volume NATPH Volume Workhours (TPH or NATPH) Workhour Costs Numbers Volume NATPH Volume Workhours (TPH or NATPH) Workhour Costs
Op# FHP TPH/NATPH Workhours Productivity Workhour Cost Op# FHP TPH/NATPH Workhours Productivity Workhour Cost210 $1,311,671 892 ($8,108)892 ($11,154)
Totals 0 (14,224,702) 31,736 (448) $1,300,517 Totals 0 (12670729) (189) 67158 ($8,108)
Impact to Gain 1,288,462,985 4,187,708,629 979,718 4,274 $41,122,558Combined Current Annual Workhour Cost : Impact to Lose 0 0 0 No Calc $0
Total Impact 1,288,462,985 4,187,708,629 979,718 4,274 $41,122,558Non-impacted 5,739,875 26,743,530 72,266 370 $3,121,726
Gain Only 497,823,644 757,884,071 194,848 3,890 $8,358,723Tot Before Adj 1,792,026,504 4,972,336,230 1,246,832 3,988 $52,603,008
Lose Adj 0 -14,224,702 31,736 -448 $1,300,517Gain Adj 0 -12,670,729 -189 67,158 -$8,108
All 1,792,026,504 4,945,440,799 1,278,379 3,869 $53,895,417
Comb Current 1,792,026,504 4,972,336,230 1,374,488 3,618 $58,007,555Proposed 1,792,026,504 4,945,440,799 1,278,379 3,869 $53,895,417Change 0 26,895,431 (96,109) ($4,112,138)
Change % 0.0% 0.5% -7.0% -7.1%
Co
mb
To
tals
Cost Impact(This number equals the difference in the current and proposed workhour costs
above and is carried forward to the Executive Summary )
(This number brought forward from Workhour Costs - Current )
Function 1 Workhour Savings : $4,112,138
Minimum Function 1 Workhour Savings : ($1,234,060)(This number represents proposed workhour savings with no productivity improvements
applied to operations at the gaining facility)
(13) New Flow Adjustments at Losing Facility
$58,007,555
Proposed Annual Workhour Cost :(Total of Columns 6 and 12 on this page)
$53,895,417
rev 04/02/2009
(14) New Flow Adjustments at Gaining Facility
Package Page 25 AMP Workhour Costs - Proposed
Last Saved:
to
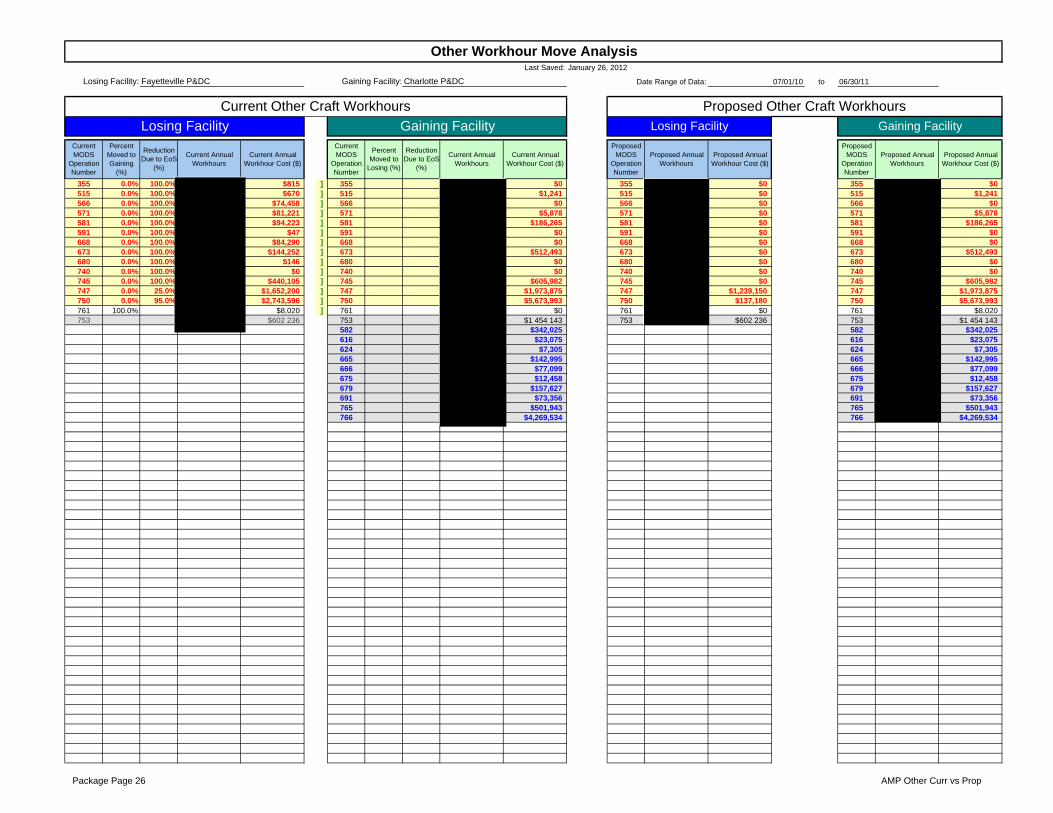
355 0.0% 100.0% $815 ] 355 $0 355 $0 355 $0515 0.0% 100.0% $670 ] 515 $1,241 515 $0 515 $1,241566 0.0% 100.0% $74,458 ] 566 $0 566 $0 566 $0571 0.0% 100.0% $81,221 ] 571 $5,878 571 $0 571 $5,878581 0.0% 100.0% $94,223 ] 581 $186,265 581 $0 581 $186,265591 0.0% 100.0% $47 ] 591 $0 591 $0 591 $0668 0.0% 100.0% $84,290 ] 668 $0 668 $0 668 $0673 0.0% 100.0% $144,252 ] 673 $512,493 673 $0 673 $512,493680 0.0% 100.0% $146 ] 680 $0 680 $0 680 $0740 0.0% 100.0% $0 ] 740 $0 740 $0 740 $0745 0.0% 100.0% $440,105 ] 745 $605,982 745 $0 745 $605,982747 0.0% 25.0% $1,652,200 ] 747 $1,973,875 747 $1,239,150 747 $1,973,875750 0.0% 95.0% $2,743,596 ] 750 $5,673,993 750 $137,180 750 $5,673,993761 100.0% $8,020 ] 761 $0 761 $0 761 $8,020753 $602 236 753 $1 454 143 753 $602 236 753 $1 454 143
582 $342,025 582 $342,025616 $23,075 616 $23,075624 $7,305 624 $7,305665 $142,995 665 $142,995666 $77,099 666 $77,099675 $12,458 675 $12,458679 $157,627 679 $157,627691 $73,356 691 $73,356765 $501,943 765 $501,943766 $4,269,534 766 $4,269,534
Gaining Facility
Current MODS
Operation Number
Percent Moved to
Losing (%)
Current Annual Workhour Cost ($)
Proposed MODS
Operation Number
Proposed Annual Workhour Cost ($)
Gaining Facility Losing FacilityLosing Facility
Current Other Craft Workhours
Current Annual Workhour Cost ($)
Current MODS
Operation Number
Percent Moved to Gaining
(%)
Current Annual Workhours
Current Annual Workhours
Reduction Due to EoS
(%)
Reduction Due to EoS
(%)
Proposed MODS
Operation Number
Proposed Annual Workhours
Other Workhour Move Analysis
Fayetteville P&DCLosing Facility: Gaining Facility: Charlotte P&DC Date Range of Data: 06/30/1107/01/10
January 26, 2012
Proposed Other Craft Workhours
Proposed Annual Workhours
Proposed Annual Workhour Cost ($)
Package Page 26 AMP Other Curr vs Prop

Package Page 27 AMP Other Curr vs Prop

116,047 $5,324,044 0 $0 Ops-Red 32,594 $1,376,329 Ops-Red 0 $00 $0 191 208 $8 959 727 Ops-Inc 0 $0 Ops-Inc 191 428 $8 967 747
13,293 $602,236 156,981 $7,061,560 Ops-Stay 13,293 $602,236 Ops-Stay 156,981 $7,061,560129,340 $5,926,280 348,189 $16,021,287 AllOps 45,887 $1,978,565 AllOps 348,409 $16,029,307
620 0.0% 100.0% $264 ] 620 $118 620 $0 620 $118671 0.0% 100.0% $108,134 ] 671 $185,138 671 $0 671 $185,138698 0.0% 100.0% $209,641 ] 698 $663,569 698 $0 698 $663,569699 0.0% 100.0% $14,807 ] 699 $136,660 699 $0 699 $136,660700 0.0% 100.0% $1,096,783 ] 700 $1,734,905 700 $0 700 $1,734,905701 0.0% 100.0% $90,529 ] 701 $472,858 701 $0 701 $472,858758 0.0% 100.0% $153,274 ] 758 $207,491 758 $0 758 $207,491922 0.0% 100.0% $105,070 ] 922 $207,601 922 $0 922 $207,601928 0.0% 54.0% $194,864 ] 928 $40,859 928 $89,637 928 $40,859951 0.0% 87.0% $741,357 ] 951 $978,899 951 $96,376 951 $978,899
679 $88,058 679 $88,058759 $276,384 759 $276,384927 $298,524 927 $298,524933 $112,445 933 $112,445952 $294,974 952 $294,974
Gaining Facility
Current MODS
Operation Number
Totals
Ops-ReducingOps-Increasing
Ops-StayingAll Operations
Percent (%) Moved to Losing
(%) Reduction
Due to EoS
Percent (%) Moved to Gaining
(%) Reduction
Due to EoS
Current Annual Workhours
Totals
Ops-ReducingOps-Increasing
Ops-StayingAll Operations
Current All Supervisory Workhours
Current Annual Workhour Cost ($)
Current Annual Workhours
Current MODS
Operation Number
Losing Facility Gaining Facility
Current Annual Workhour Cost ($)
Proposed Annual Workhour Cost ($)
Proposed MODS
Operation Number
Proposed Annual Workhours
Proposed Annual Workhour Cost ($)
Losing Facility
Proposed MODS
Operation Number
Proposed Annual Workhours
Proposed All Supervisory Workhours
Package Page 28 AMP Other Curr vs Prop

Package Page 29 AMP Other Curr vs Prop

54 877 $2 714 724 0 $0 Ops-Red 3 706 $186 014 Ops-Red 0 $00 $0 86,328 $4,628,097 Ops-Inc 0 $0 Ops-Inc 86,328 $4,628,0970 $0 20,981 $1,070,386 Ops-Stay 0 $0 Ops-Stay 20,981 $1,070,386
54 877 $2 714 724 107 309 $5 698 483 AllOps 3 706 $186 014 AllOps 107 309 $5 698 483
780 0.0% 100.0% $149 ] 780 $0 780 $0 780 $0781 0.0% 100.0% $69,982 ] 781 $36,108 781 $0 781 $36,108783 5.0% 95.0% $60,356 ] 783 $145,297 783 $0 783 $148,296
789 $1,149 789 $1,149
4 783 $130 487 0 $0 Ops-Red 0 $0 Ops-Red 0 $00 $0 5,056 $181,404 Ops-Inc 0 $0 Ops-Inc 5,134 $184,4040 $0 30 $1,149 Ops-Stay 0 $0 Ops-Stay 30 $1,149
4 783 $130 487 5 086 $182 554 AllOps 0 $0 AllOps 5 164 $185 554
31 $0 31 $157,627 31 $0 31 $157,62732 $8 020 32 $0 32 $0 32 $8 02033 $0 33 $0 33 $0 33 $034 $0 34 $4,771,477 34 $0 34 $4,771,47793 $0 93 $1 149 93 $0 93 $1 149Total $8,020 Totals $4,930,254 Total $0 Totals $4,938,274
0 $0 3 348 $157 627 0 $0 3 348 $157 6270 $0 107,182 $4,771,477 0 $0 107,182 $4,771,477
Subset for Trans-PVS
TabOps 617, 679, 764 (31)
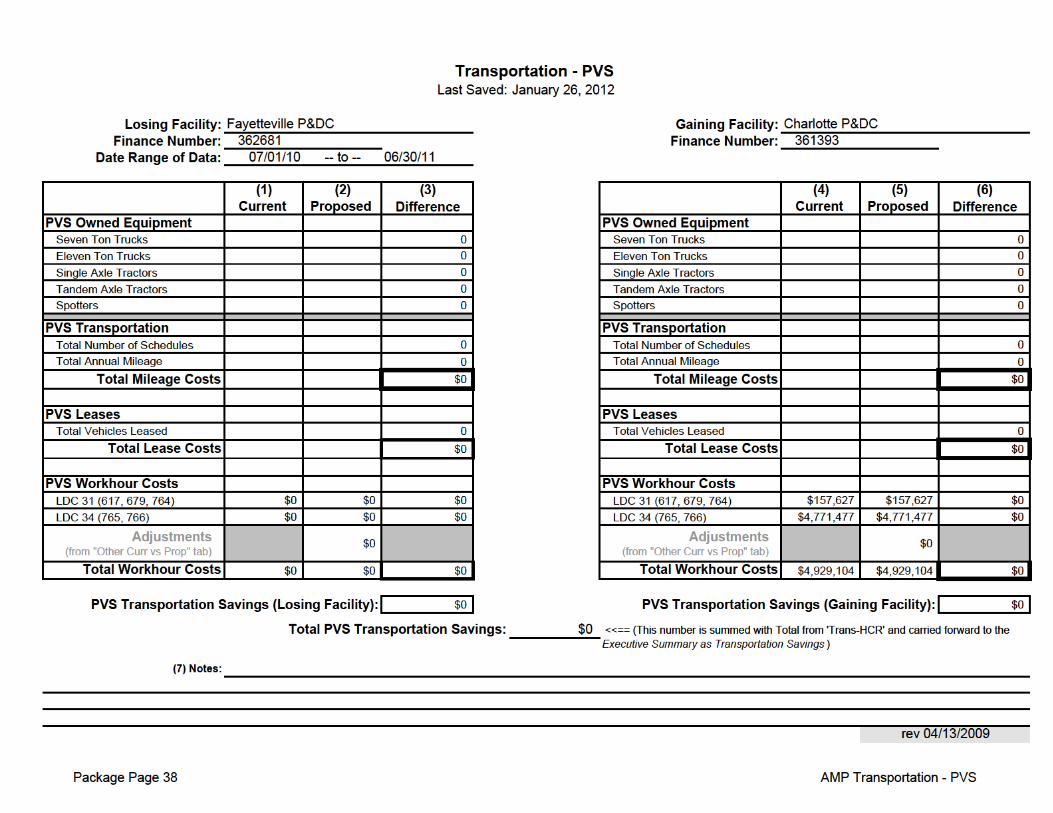
Transportation - PVS
LDCCurrent Annual
Workhours
Current Annual Workhour Cost
($)
Ops 765, 766 (34)
LDCCurrent Annual
Workhours
Current Annual Workhour Cost
($)
Current MODS
Operation Number
(%) Reduction
Due to EoS
Grouped Subtotals for Transportation, Maintenance, Supervision & Flow Adjustments, along with Facility and Combined Summaries
Ops-IncreasingOps-Staying
All Operations
Current Annual Workhours
All Operations
Percent (%) Moved to Losing
Gaining Facility Losing Facility
Current Annual Workhour Cost ($)
Gaining Facility
Ops 617, 679, 764 (31)
Ops 765, 766 (34)
Ops 617, 679, 764 (31)
Ops 765, 766 (34)
Ops-Reducing
All Operations
Current Workhours for LDCs Common to & Shared between Supv & Craft Proposed Workhours for LDCs Common to & Shared between Supv & Craft
Current MODS
Operation Number
Gaining Facility
Totals
Losing Facility
Losing Facility Gaining Facility
TotalsOps-Increasing
Ops-Staying
Losing Facility
Ops 617, 679, 764 (31)Subset for Trans-PVS
Tab
(%) Reduction
Due to EoS
Current Annual Workhours
Current Annual Workhour Cost ($)
Transportation - PVS
Totals
Ops-ReducingOps-Increasing
Ops-Staying
Ops-Reducing
Percent (%) Moved to Gaining
Totals
Ops-ReducingOps-Increasing
Ops-StayingAll Operations
Proposed Annual Workhour Cost ($)
Proposed MODS
Operation Number
Proposed Annual Workhours
Proposed Annual Workhour Cost ($)
LDC
Proposed MODS
Operation Number
Proposed Annual Workhours
Ops 765, 766 (34)
Proposed Annual Workhour Cost ($)
Transportation - PVS
Proposed Annual Workhours
Proposed Annual Workhour Cost ($)
Transportation - PVS
LDCProposed Annual
Workhours
Package Page 30 AMP Other Curr vs Prop
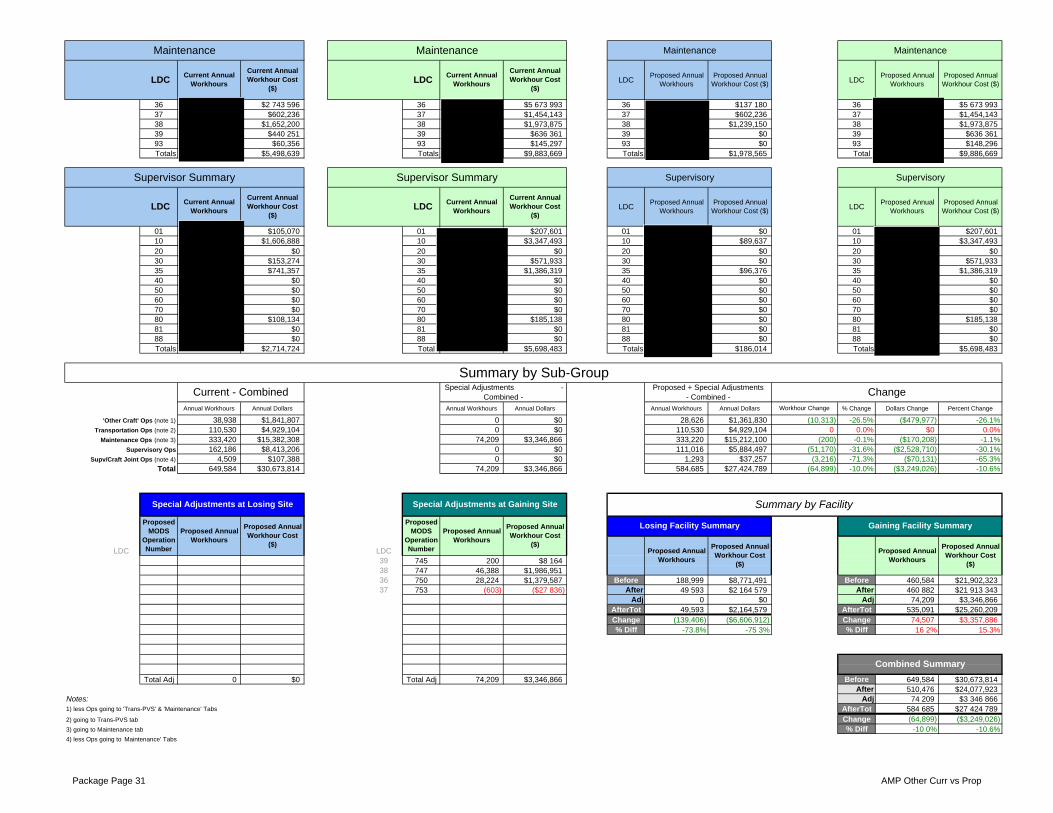
36 $2 743 596 36 $5 673 993 36 $137 180 36 $5 673 99337 $602,236 37 $1,454,143 37 $602,236 37 $1,454,14338 $1,652,200 38 $1,973,875 38 $1,239,150 38 $1,973,87539 $440 251 39 $636 361 39 $0 39 $636 36193 $60,356 93 $145,297 93 $0 93 $148,296Totals $5,498,639 Totals $9,883,669 Totals $1,978,565 Total $9,886,669
01 $105,070 01 $207,601 01 $0 01 $207,60110 $1,606,888 10 $3,347,493 10 $89,637 10 $3,347,49320 $0 20 $0 20 $0 20 $030 $153,274 30 $571,933 30 $0 30 $571,93335 $741,357 35 $1,386,319 35 $96,376 35 $1,386,31940 $0 40 $0 40 $0 40 $050 $0 50 $0 50 $0 50 $060 $0 60 $0 60 $0 60 $070 $0 70 $0 70 $0 70 $080 $108,134 80 $185,138 80 $0 80 $185,13881 $0 81 $0 81 $0 81 $088 $0 88 $0 88 $0 88 $0Totals $2,714,724 Total $5,698,483 Totals $186,014 Totals $5,698,483
Annual Workhours Annual Dollars Annual Workhours Annual Dollars Annual Workhours Annual Dollars % Change Dollars Change Percent Change
38,938 $1,841,807 0 $0 28,626 $1,361,830 -26.5% ($479,977) -26.1%110,530 $4,929,104 0 $0 110,530 $4,929,104 0.0% $0 0.0%333,420 $15,382,308 74,209 $3,346,866 333,220 $15,212,100 -0.1% ($170,208) -1.1%162,186 $8,413,206 0 $0 111,016 $5,884,497 -31.6% ($2,528,710) -30.1%
4,509 $107,388 0 $0 1,293 $37,257 -71.3% ($70,131) -65.3%649,584 $30,673,814 74,209 $3,346,866 584,685 $27,424,789 -10.0% ($3,249,026) -10.6%
LDC LDC 39 745 200 $8 164 38 747 46,388 $1,986,951 36 750 28,224 $1,379,587 Before 188,999 $8,771,491 Before 460,584 $21,902,323 37 753 (603) ($27 836) After 49 593 $2 164 579 After 460 882 $21 913 343 Adj 0 $0 Adj 74,209 $3,346,866 AfterTot 49,593 $2,164,579 AfterTot 535,091 $25,260,209 Change (139,406) ($6,606,912) Change 74,507 $3,357,886 % Diff -73.8% -75 3% % Diff 16 2% 15.3%
Total Adj 0 $0 Total Adj 74,209 $3,346,866 Before 649,584 $30,673,814After 510,476 $24,077,923
Adj 74 209 $3 346 866AfterTot 584 685 $27 424 789Change (64,899) ($3,249,026)% Diff -10 0% -10.6%
(10,313)
4) less Ops going to Maintenance' Tabs
'Other Craft' Ops (note 1)
Notes:1) less Ops going to 'Trans-PVS' & 'Maintenance' Tabs
2) going to Trans-PVS tab
3) going to Maintenance tab
Supervisory Ops
ChangeProposed + Special Adjustments - Combined -Current - Combined
Workhour Change
0(200)
(51,170)Maintenance Ops (note 3)
Transportation Ops (note 2)
Summary by FacilitySpecial Adjustments at Losing Site
(3,216)Supv/Craft Joint Ops (note 4)
Total (64,899)
Supervisory
LDCProposed Annual
WorkhoursProposed Annual
Workhour Cost ($)
Supervisor Summary Supervisor Summary
LDCCurrent Annual
Workhours
Current Annual Workhour Cost
($)LDC
Current Annual Workhours
Current Annual Workhour Cost
($)
Maintenance
Current Annual Workhours
Maintenance
Proposed Annual Workhour Cost ($)
Proposed Annual WorkhoursLDC
Proposed Annual WorkhoursLDC
Proposed Annual Workhours
Losing Facility Summary
Combined Summary
Proposed Annual Workhours
Proposed Annual Workhour Cost
($)
Proposed Annual Workhour Cost
($)
Proposed Annual Workhours
Proposed MODS
Operation Number
Proposed Annual Workhours
Proposed Annual Workhour Cost
($)
Proposed MODS
Operation Number
Proposed Annual Workhour Cost
($)
Special Adjustments at Gaining Site
Maintenance
Current Annual Workhour Cost
($)
Summary by Sub-GroupSpecial Adjustments -
Combined -
Gaining Facility Summary
Maintenance
LDC LDCCurrent Annual
Workhours
Current Annual Workhour Cost
($)
Proposed Annual Workhour Cost ($)
Supervisory
LDCProposed Annual
WorkhoursProposed Annual
Workhour Cost ($)
Package Page 31 AMP Other Curr vs Prop

rev 06/17/2008
Package Page 32 AMP Other Curr vs Prop

Last Saved:
Losing Facility:Data Extraction Date: 09/20/11
(2) (3) (4) (5) (6)
LevelCurrent Auth
StaffingCurrent On-Rolls
Proposed Staffing
Difference
1 EAS-25 1 0 0 0
2 EAS-22 1 1 0 -1
3 EAS-21 1 1 0 -1
4 EAS-20 4 3 0 -3
5 EAS-19 1 1 0 -1
6 EAS-19 1 0 0 0
7 EAS-17 2 2 0 -2
8 EAS-17 13 8 2 -6
9 EAS-17 4 4 1 -3
10 EAS-16 1 1 0 -1
11 EAS-12 1 1 0 -1
1213141516171819202122232425262728293031
Staffing - Management
362681
January 26, 2012
Fayetteville P&DC
Line
(1)
Position Title
MGR PROCESSING/DISTRIBUTION
Management Positions
SUPV DISTRIBUTION OPERATIONS
SUPV MAINTENANCE OPERATIONS
NETWORKS SPECIALIST
SECRETARY (FLD)
Finance Number:
MGR MAINTENANCE
MGR IN-PLANT SUPPORT
MGR DISTRIBUTION OPERATIONS
MGR MAINTENANCE OPERATIONS
MGR MAINTENANCE OPERATIONS SUPPT
OPERATIONS SUPPORT SPECIALIST
Package Page 32 AMP Staffing - PCES/EAS

444546474849505152535455565758596061626364656667686970717273747576777879
30 22 3 (19)
Retirement Eligibles: 5 Position Loss: 19
Totals
Package Page 33 AMP Staffing - PCES/EAS
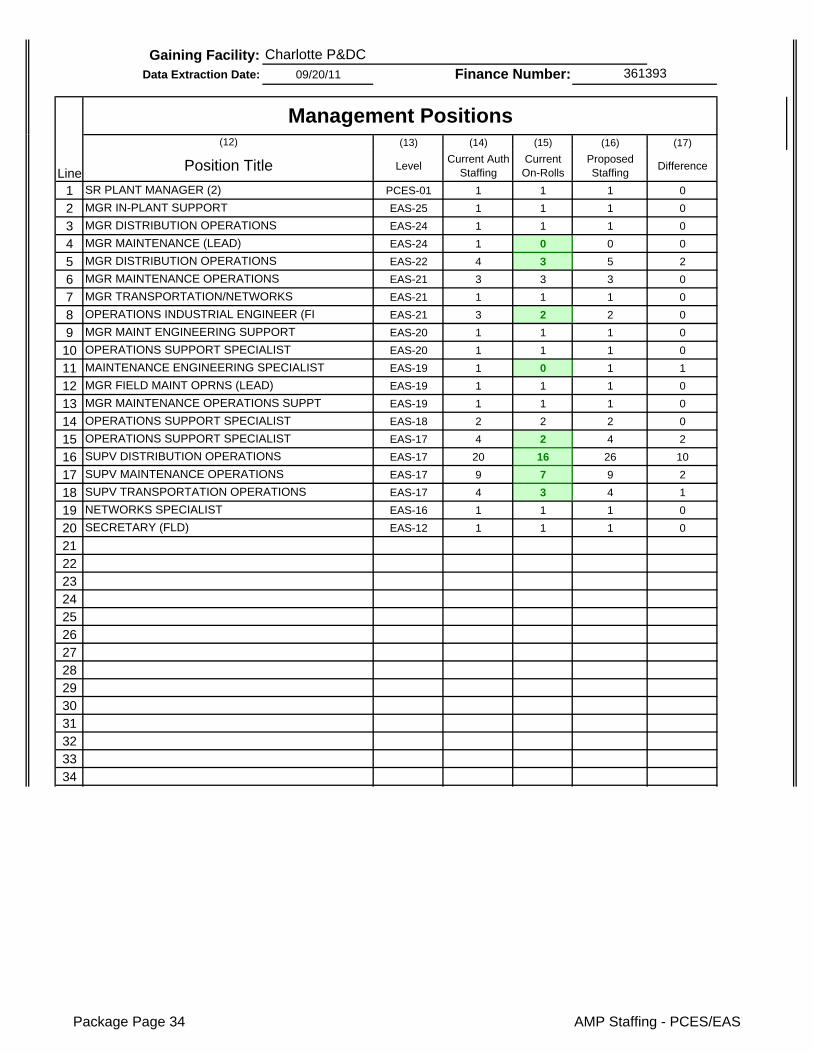
Gaining Facility:Data Extraction Date: 09/20/11
(13) (14) (15) (16) (17)
LevelCurrent Auth
StaffingCurrent On-Rolls
Proposed Staffing
Difference
1 PCES-01 1 1 1 0
2 EAS-25 1 1 1 0
3 EAS-24 1 1 1 0
4 EAS-24 1 0 0 0
5 EAS-22 4 3 5 2
6 EAS-21 3 3 3 0
7 EAS-21 1 1 1 0
8 EAS-21 3 2 2 0
9 EAS-20 1 1 1 0
10 EAS-20 1 1 1 0
11 EAS-19 1 0 1 1
12 EAS-19 1 1 1 0
13 EAS-19 1 1 1 0
14 EAS-18 2 2 2 0
15 EAS-17 4 2 4 2
16 EAS-17 20 16 26 10
17 EAS-17 9 7 9 2
18 EAS-17 4 3 4 1
19 EAS-16 1 1 1 0
20 EAS-12 1 1 1 0
2122232425262728293031323334
Finance Number: 361393
Charlotte P&DC
Line Position Title
(12)
Management Positions
SR PLANT MANAGER (2)
MGR IN-PLANT SUPPORT
MGR DISTRIBUTION OPERATIONS
MGR MAINTENANCE (LEAD)
MGR DISTRIBUTION OPERATIONS
MGR MAINTENANCE OPERATIONS
MGR TRANSPORTATION/NETWORKS
OPERATIONS INDUSTRIAL ENGINEER (FI
MGR MAINT ENGINEERING SUPPORT
OPERATIONS SUPPORT SPECIALIST
MAINTENANCE ENGINEERING SPECIALIST
MGR FIELD MAINT OPRNS (LEAD)
MGR MAINTENANCE OPERATIONS SUPPT
OPERATIONS SUPPORT SPECIALIST
OPERATIONS SUPPORT SPECIALIST
SUPV DISTRIBUTION OPERATIONS
SUPV MAINTENANCE OPERATIONS
SUPV TRANSPORTATION OPERATIONS
NETWORKS SPECIALIST
SECRETARY (FLD)
Package Page 34 AMP Staffing - PCES/EAS

474849505152535455565758596061626364656667686970717273747576777879
61 48 66 18
Retirement Eligibles: 15 Position Loss: (18)
1
Total
rev 11/05/2008
Total PCES/EAS Position Loss: (This number carried forward to the Executive Summary )
Package Page 35 AMP Staffing - PCES/EAS
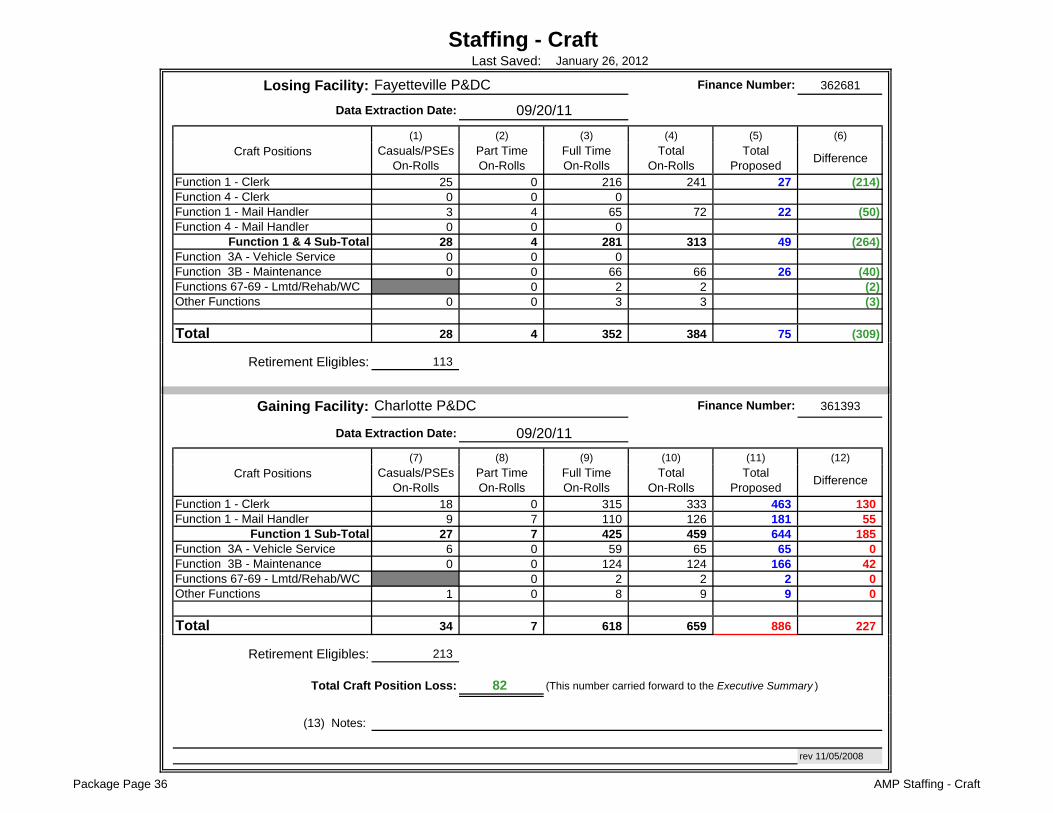
Losing Facility: 362681
(1) (2) (3) (4) (5) (6)
Craft Positions
Function 1 - Clerk 25 0 216 241 27 (214)Function 4 - Clerk 0 0 0Function 1 - Mail Handler 3 4 65 72 22 (50)Function 4 - Mail Handler 0 0 0
Function 1 & 4 Sub-Total 28 4 281 313 49 (264)Function 3A - Vehicle Service 0 0 0Function 3B - Maintenance 0 0 66 66 26 (40)Functions 67-69 - Lmtd/Rehab/WC 0 2 2 (2)Other Functions 0 0 3 3 (3)
Total 28 4 352 384 75 (309)
Retirement Eligibles: 113
Gaining Facility: 361393
(7) (8) (9) (10) (11) (12)
Craft Positions
Function 1 - Clerk 18 0 315 333 463 130Function 1 - Mail Handler 9 7 110 126 181 55
Function 1 Sub-Total 27 7 425 459 644 185Function 3A - Vehicle Service 6 0 59 65 65 0Function 3B - Maintenance 0 0 124 124 166 42Functions 67-69 - Lmtd/Rehab/WC 0 2 2 2 0Other Functions 1 0 8 9 9 0
Total 34 7 618 659 886 227
Retirement Eligibles: 213
82
(13) Notes:
rev 11/05/2008
Finance Number:
Charlotte P&DC Finance Number:
Total Craft Position Loss:
Total Proposed
Part Time On-Rolls
Full Time On-Rolls
Total On-Rolls
Staffing - Craft
Difference
Difference
Last Saved: January 26, 2012
Data Extraction Date: 09/20/11
Casuals/PSEs On-Rolls
09/20/11
Total Proposed
Data Extraction Date:
Fayetteville P&DC
Part Time On-Rolls
Full Time On-Rolls
Total On-Rolls
(This number carried forward to the Executive Summary )
Casuals/PSEs On-Rolls
Package Page 36 AMP Staffing - Craft

Losing Facility: Gaining Facility:
Date Range of Data: :
(1) (2) (3) (4) (5) (6)
Workhour Activity Current Cost Proposed Cost Difference Workhour Activity Current Cost Proposed Cost Difference
LDC 36Mail Processing
Equipment$ 2,743,596 $ 137,180 $ (2,606,416) LDC 36
Mail Processing Equipment
$ 5,673,993 $ 5,673,993 $ 0
LDC 37 Building Equipment $ 602,236 $ 602,236 $ 0 LDC 37 Building Equipment $ 1,454,143 $ 1,454,143 $ 0
LDC 38 Building Services (Custodial Cleaning)
$ 1,652,200 $ 1,239,150 $ (413,050) LDC 38 Building Services (Custodial Cleaning)
$ 1,973,875 $ 1,973,875 $ 0
LDC 39Maintenance
Operations Support$ 440,251 $ 0 $ (440,251) LDC 39
Maintenance Operations Support
$ 636,361 $ 636,361 $ 0
LDC 93Maintenance
Training$ 60,356 $ 0 $ (60,356) LDC 93
Maintenance Training
$ 145,297 $ 148,296 $ 3,000
Workhour Cost Subtotal $ 5,498,639 $ 1,978,565 $ (3,520,074) Workhour Cost Subtotal $ 9,883,669 $ 9,886,669 $ 3,000
Other Related Maintenance & Facility Costs
Current Cost Proposed Cost DifferenceOther Related Maintenance &
Facility Costs Current Cost Proposed Cost Difference
TotalMaintenance Parts, Supplies &
Facility Utilities$ 964,065 $ 192,813 $ (771,252) Total
Maintenance Parts, Supplies & Facility Utilities
$ 2,587,609 $ 2,665,237 $ 77,628
Adjustments (from "Other Curr vs Prop" tab)
$ 0 Adjustments (from "Other Curr vs Prop" tab)
$ 3,346,866
Grand Total $ 6,462,704 $ 2,171,378 $ (4,291,326) Grand Total $ 12,471,278 $ 15,898,772 $ 3,427,494
$863,832 (This number carried forward to the Executive Summary )
(7) Notes:
Annual Maintenance Savings:
rev 04/13/2009
MaintenanceLast Saved:
Fayetteville P&DC Charlotte P&DC
January 26, 2012
Jul-01-2010 Jun-30-2011
Package Page 37 AMP Maintenance

1 2 3 4 5 6 7 8 9 10 11 12 13 14Current Current Current Proposed Proposed Proposed Current Current Current Proposed Proposed Proposed
Route Annual Annual Cost per Annual Annual Cost per Route Annual Annual Cost per Annual Annual Cost perNumbers Mileage Cost Mile Mileage Cost Mile Numbers Mileage Cost Mile Mileage Cost Mile
27413 4,527,671 $5,137,511 $5,137,510.69 28011 577,936 $849,608 $1.4728311 402,422 $597,671 $597,670.93 284xx 0 $0 $0.0028337 229,496 $290,000 $290,000.0028340 252,722 $342,511 $342,511.4628345 71,506 $90,069 $90,069.01270CK 3,743,482 $3,115,954 $3,115,954.07270CK 1,107,144 $1,450,668 $1,450,667.65275L1 282,039 $295,500 $295,500.00278N3 46,935 $64,919 $64,919.26283BA 170,646 $613,807 $613,806.91283HE 232,698 $234,000 $234,000.00283L8 360,207 $499,233 $499,232.67283L9 204,509 $174,500 $174,500.00283LE 214,433 $207,814 $207,814.00283M2 157,529 $188,414 $188,414.35283NE 271,143 $215,000 $215,000.00284L3 195,711 $181,745 $181,745.00284L4 69,080 $98,051 $98,050.50
Type of Distribution to Consolidate:
Date of HCR Data File:
CET for cancellations:
Last Saved: January 26, 2012
Losing Facility: Fayetteville P&DC Charlotte P&DCGaining Facility:
Orig & Dest
10/01/11
CET for OGP:
CT for Outbound Dock:
Transportation - HCR
Package Page 39 AMP Transportation - HCR

1 2 3 4 5 6 7 8 9 10 11 12 13 14Current Current Current Proposed Proposed Proposed Current Current Current Proposed Proposed Proposed
Route Annual Annual Cost per Annual Annual Cost per Route Annual Annual Cost per Annual Annual Cost perNumbers Mileage Cost Mile Mileage Cost Mile Numbers Mileage Cost Mile Mileage Cost Mile
Totals 12,539,372 10,289,429 Totals 577,936 1,733,312
Package Page 40 AMP Transportation - HCR

1 2 3 4 5 6 7 8 9 10 11 12 13 14Current Current Current Proposed Proposed Proposed Current Current Current Proposed Proposed Proposed
Route Annual Annual Cost per Annual Annual Cost per Route Annual Annual Cost per Annual Annual Cost perNumbers Mileage Cost Mile Mileage Cost Mile Numbers Mileage Cost Mile Mileage Cost Mile
$2,396,208 ($1,503,774)
Total HCR Transportation Savings:
Trips from Losing
Moving to Lose (-)
<<== (This number is summed with Total from 'Trans-PVS' and carried forward to the Executive Summary as Transportation Savings )
rev 11/05/2008
Current Gaining
$892,434
Proposed Result
HCR Annual Savings (Losing Facility): HCR Annual Savings (Gaining Facility):
Proposed Trip Impacts
Other Changes
(+/-)
Moving to Gain (-)
Proposed Trip
Impacts
Current Losing
Proposed ResultTrips from Gaining
Other Changes (+/-)
Package Page 41 AMP Transportation - HCR

Orig & Dest
(1) (2)
DMM L011 From:
x x DMM L201 Action Code* Column A - 3-Digit ZIP Code Prefix Group
DMM L601
DMM L602
x DMM L603 To:
DMM L604 Action Code* Column A - 3-Digit ZIP Code Prefix Group
DMM L605
DMM L606
DMM L607
x DMM L801
(3)
Action Code*
Action Code*
Action Code*
Action Code*
(4)
Count % Count % Count % Count %
Aug 283AN 491 147 30% 129 26% 0 0% 344 70% 30
Sep 283AN 483 121 25% 128 27% 0 0% 362 75% 38
Aug 28H 665 139 21% 190 29% 0 0% 526 79% 9
Sep 28H 688 152 22% 229 33% 0 0% 536 78% 30
(5) Notes
*Action Codes: A=add D=delete CF-change from CT=change to
Important Note: Section 2 & 3 illustrate possible changes to DMM labeling lists. Section 2 relates to consolidation of Destination Operations. Section 3 pertains to Originating Operations. The Area Distribution Network group will submit appropriate requests for DMM changes after AMP approval.
Column A - Entry ZIP Codes Column B - 3-Digit ZIP Code Destinations Column C - Label to
Column A - Entry ZIP Codes Column B - 3-Digit ZIP Code Destinations Column C - Label to
DMM L009
DMM L010
DMM L005
DMM L006
DMM L007
DMM L008
DMM L003
DMM L004
DMM L001
DMM L002
Distribution Changes
Indicate each DMM labeling list affected by placing an "X" to the left of the list.
Losing Facility:Type of Distribution to Consolidate
If revisions to DMM L005 or DMM L201 are needed, indicate proposed DMM label change below.
Last Saved: January 26, 2012
Fayetteville P&DC
DMM Labeling List L005 - 3-Digit ZIP Code Prefix Groups - SCF Sortation
Column B - Label to
*Action Codes: A=add D=delete CF-change from CT=change to
Column B - Label to
rev 5/14/2009
Drop Shipments for Destination Entry Discounts - FAST Appointment Summary Report
Month Losing/GainingNASS Code
Facility NameTotal
Schd ApptsUnschd Count
Losing Facility FayettevilleP&DC Annex
Losing Facility FayettevilleP&DC Annex
No-Show Late Arrival Open Closed
Gaining Facility Charlotte L&DC
Gaining Facility Charlotte L&DC
DMM Labeling List L201 - Periodicals Origin Split
Column A - Entry ZIP Codes Column B - 3-Digit ZIP Code Destinations Column C - Label to
Column C - Label to
Column A - Entry ZIP Codes Column B - 3-Digit ZIP Code Destinations Column C - Label to
Package Page 42 AMP Distr bution Changes

Losing Facility: Gaining Facility:
(1) (2) (3) (4) (5) (6) (7) (8)
Equipment EquipmentType TypeAFCS 5 0 (5) AFCS 1 2 1 (4) $156,360
AFCS200 AFCS200 5 5 0 0
AFSM - ALL 1 0 (1) AFSM - ALL 2 2 0 (3) $120,012
APPS APPS
CIOSS 2 0 (2) CIOSS 2 2 0 (2) $16,180
CSBCS CSBCS
DBCS 10 0 (10) DBCS 20 25 5 (5) $80,900
DBCS-OSS DBCS-OSS
DIOSS 2 0 (2) DIOSS 6 9 3 1 $24,270
FSS FSS
SPBS 1 0 (1) SPBS (1) $68,000
UFSM UFSM
FC / MICRO MARK FC / MICRO MARK
ROBOT GANTRY ROBOT GANTRY
HSTS / HSUS HSTS / HSUS
LCTS / LCUS LCTS / LCUS
LIPS LIPS
MPBCS-OSS MPBCS-OSS
TABBER TABBER
PIV PIV
LCREM LCREM 1 1 0 0
(9) Notes:
rev 03/04/2008
AFSM/AI Equipment Change is incorrect. Losing facility will excess their AFSM at $60,006, 4 AFCS w/VFS and BDS at $39,090 per, 2 CIOSS's at $8,090 per,
5 DBCS's at $8,090 per, and 1 SPBS w/infeed at $68,000. NOTE: Source for additional DIOSS has not been identified. Site prep for 2 DBCS & 1 SPBS $2500/p
(This number is carried forward to Space Evaluation and Other Costs )
Proposed Number
Difference
Mail Processing Equipment Relocation Costs from Losing to Gaining Facility: $465,722
01/09/12
MPE Inventory
Assumption: Gaining Facility relocating 2 AFSM/AI to L&DC at $60,006 per. Relocating 5 DBCS's at $8,090 per and 3 DIOSS's at $8,090 per
Fayetteville P&DC Charlotte P&DC
Current Number
DifferenceEquipment
ChangeRelocation
Costs
Last Saved:
Current Number
Data Extraction Date:
Proposed Number
January 26, 2012
Package Page 43 AMP MPE Inventory

Last Saved:
3-Digit ZIP Code: 284 3-Digit ZIP Code:
1. Collection Points Mon. - Fri. Sat. Mon. - Fri. Sat. Mon. - Fri. Sat. Sat.
127 268 48 160
203 107 52 32
97 14 27 9
427 389 127 201 0 0 0
2. How many collection boxes are designated for "local delivery"?
3. How many "local delivery" boxes will be removed as a result of AMP?
4.
Quarter/FY Percent
QTR 3 FY11 43.9%
QTR 2 FY11 26.1%
QTR 1 FY11 37.7%
QTR 4 FY10 30.1%
5. 6.
Start End Start End Start End Start End
Monday 8:00 17:00 8:00 17:00 Monday 9:30 18:00 9:30 18:00
Tuesday 8:00 17:00 8:00 17:00 Tuesday 9:30 18:00 9:30 18:00
Wednesday 8:00 14:00 8:00 14:00 Wednesday 9:30 18:00 9:30 18:00
Thursday 8:00 17:00 8:00 17:00 Thursday 9:30 18:00 9:30 18:00
Friday 8:00 17:00 8:00 17:00 Friday 9:30 18:00 9:30 18:00
Saturday Closed Closed Closed Closed Saturday Closed Closed Closed Closed
7.
8. Notes:
9.
Line 1
Line 2
January 26, 2012
Fayetteville P&DC
11/01/11
Current CurrentCurrent
Current
3-Digit ZIP Code:
Current
rev 6/18/2008
28301
Can customers obtain a local postmark in accordance with applicable policies in the Postal Operations Manual?
Gaining Facility:
What postmark will be printed on collection mail?
Proposed
% Carriers returning before 5 p.m.
Mon. - Fri.
Customer Service Issues
Current Proposed
Number picked up after 5 p.m.
Number picked up between 1-5 p.m.
Total Number of Collection Points
Delivery Performance Report
Retail Unit Inside Losing Facility (Window Service Times)
Losing Facility:
5-Digit ZIP Code:Data Extraction Date:
3-Digit ZIP Code: 283
Number picked up before 1 p.m.
Business (Bulk) Mail Acceptance Hours
Charlotte P&DC
0
Package Page 44 AMP Customer Service Issues

Last Saved:
1.
2. Lease Information. (If not leased skip to 3 below.)
3.
4. Planned use for acquired space from approved AMP
5. Facility Costs
(This number shown below under One-Time Costs section.
6. Savings Information
(This number carried forward to the Executive Summary )
7. Notes
(This number carried forward to Executive Summary )
$0
$465,722
Facility Costs:
Fayetteville P&DC Charlotte P&DC
Space Evaluation and Other Costs
Street Address:City, State ZIP:
Losing Facility:
Space Evaluation
Affected FacilityFacility Name:
January 26, 2012
Fayetteville P&DC
Mail Processing Equipment Relocation Costs: (from MPE Inventory )
Space Savings ($):
One-Time Costs
Employee Relocation Costs:
$465,722
Gaining Facility:Losing Facility:
Enter any projected one-time facility costs:
Enter annual lease cost:
Enter the total interior square footage of the facility:Enter gained square footage expected with the AMP:
Enter lease options/terms:
Current Square Footage
Enter lease expiration date:
(from above)
Total One-Time Costs:
Remote Encoding Center Cost per 1000
Package Page 45 AMP Space Evaluation and Other Costs