Embed Size (px)
Citation preview

8/10/2019 AMP - 140704.pdf
http://slidepdf.com/reader/full/amp-140704pdf 1/27
STRICTLY CONFIDENTIAL
AMPNTIQUE’S MORNING PRESENTATION
4 July 2014
Global News
Dow Jones index rose above 17,000 for the first time following job report that
suggested hiring in the country accelerated last month. The jobs report is the
latest piece of data to show the US economy continues to improve steadily.
Japanese stocks dropped on Thursday, snapping a three-day winning streak
as investors took a breather from recent gains as they awaited the outcome of
the U.S. jobs data.
Sector & Corporate News
Sesa Sterlite Ltd: India's largest private iron ore miner, expects to resume
production in the country's Goa state in September. The miner expects its total
iron ore output at 9.29 MT in the current fiscal year to March 2015.
Sun Pharma: The Company is recalling 200 vials of the chemotherapy
drug gemcitabine in the United States due to a lack of assurance of sterility.
The voluntary recall was initiated in April and was classified by the FDA as
Class II, meaning that use of or exposure to the recalled drug may cause
temporary or medically reversible adverse health consequences.
SAIL: The new government could sell a 5% stake in the state-run SAIL in the
last week of this month. The marketing roadshows for the stake sale, valuedat about USD340mn at the current market price, will begin soon after the
presentation of the federal budget scheduled for July 10.
HDIL: The Company has sold its multiplex business, HDIL Entertainment which
runs 33 multiplexes under the brand name Kulraj Broadway, to Carnival
Films for INR1.05bn.
FROM THE RESEARCH DESK
INITIATING COVERAGE
KPIT Technologies LimitedBack on the growth track; Buy
COMPANY UPDATE
Strides Arcolab LimitedHigh growth in unsold business
Market SnapshotGlobal Indices Closing % Chg
Dow Jones 17,068 0.5
NASDAQ 4,486 0.6
FTSE 6,865 0.7
CAC 4,490 1.0
DAX 10,029 1.2
Russia 1,391 0.0
Bovespa 53,875 1.6
Nikkei 15,348 (0.1)
Hang Seng 23,531 (0.1)
Shanghai Composite 2,063 0.2
Indian Indices Closing % Chg
Sensex 25,824 (0.1)
Nifty 7,715 (0.1)
MSCI India 501 (0.4)
CNX Midcap 11,360 0.1
BSE Smallcap 10,419 (0.1)
Flows (USDm) Prev. Day
FII (688)
Locals 12
Provisional flows (U
FIIs
Locals
Volumes USDbn
Cash (NSE + BSE) 3.5
F&O (net) 17.5
FII F&O Stock Fut Ind
Net ($ mn) (113)
Open Int (%) 2.2
ADR/GDR Gainers Last
Tata Motors 42.1
Ranbaxy 8.9
ICICI Bank 50.8
Wipro 12.2
HDFC 49.7
ADR/GDR Losers Last
Reliance 33.9
8/10/2019 AMP - 140704.pdf
http://slidepdf.com/reader/full/amp-140704pdf 2/27
T IQUE STOCK BROKING L IMITED 4 July 201FROM THE RESEARCH DESK
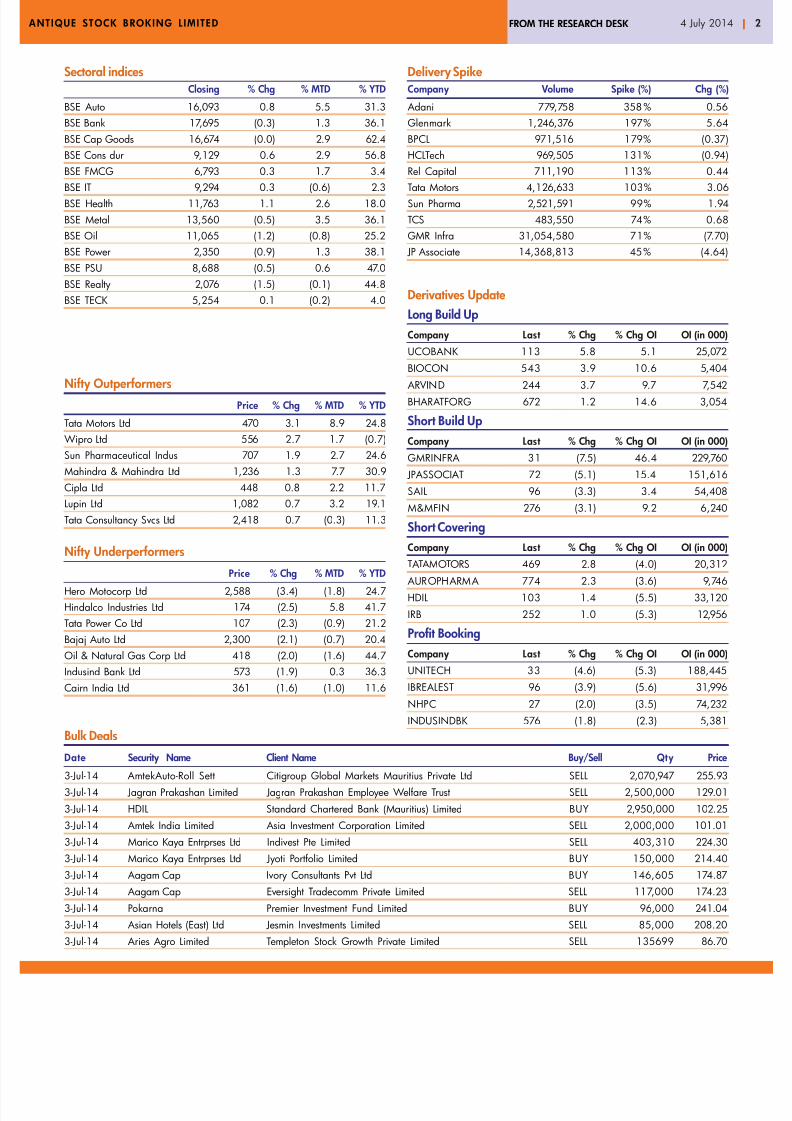
Sectoral indices Closing % Chg % MTD % YTD
BSE Auto 16,093 0.8 5.5 31.3
BSE Bank 17,695 (0.3) 1.3 36.1
BSE Cap Goods 16,674 (0.0) 2.9 62.4
BSE Cons dur 9,129 0.6 2.9 56.8
BSE FMCG 6,793 0.3 1.7 3.4
BSE IT 9,294 0.3 (0.6) 2.3BSE Health 11,763 1.1 2.6 18.0
BSE Metal 13,560 (0.5) 3.5 36.1
BSE Oil 11,065 (1.2) (0.8) 25.2
BSE Power 2,350 (0.9) 1.3 38.1
BSE PSU 8,688 (0.5) 0.6 47.0
BSE Realty 2,076 (1.5) (0.1) 44.8
BSE TECK 5,254 0.1 (0.2) 4.0
Nifty Outperformers
Price % Chg % MTD % YTD
Tata Motors Ltd 470 3.1 8.9 24.8
Wipro Ltd 556 2.7 1.7 (0.7)
Sun Pharmaceutical Indus 707 1.9 2.7 24.6
Mahindra & Mahindra Ltd 1,236 1.3 7.7 30.9
Cipla Ltd 448 0.8 2.2 11.7
Lupin Ltd 1,082 0.7 3.2 19.1
Tata Consultancy Svcs Ltd 2,418 0.7 (0.3) 11.3
Nifty Underperformers
Price % Chg % MTD % YTD
Hero Motocorp Ltd 2,588 (3.4) (1.8) 24.7
Hindalco Industries Ltd 174 (2.5) 5.8 41.7
Tata Power Co Ltd 107 (2.3) (0.9) 21.2
Bajaj Auto Ltd 2,300 (2.1) (0.7) 20.4
Oil & Natural Gas Corp Ltd 418 (2.0) (1.6) 44.7
Indusind Bank Ltd 573 (1.9) 0.3 36.3
Cairn India Ltd 361 (1.6) (1.0) 11.6
Bulk Deals
Date Security Name Client Name Buy/Sell Qty Price
3-Jul-14 AmtekAuto-Roll Sett Citigroup Global Markets Mauritius Private Ltd SELL 2,070,947 255.93
3-Jul-14 Jagran Prakashan Limited Jagran Prakashan Employee Welfare Trust SELL 2,500,000 129.01
3-Jul-14 HDIL Standard Chartered Bank (Mauritius) Limited BUY 2,950,000 102.25
3-Jul-14 Amtek India Limited Asia Investment Corporation Limited SELL 2,000,000 101.01
3-Jul-14 Marico Kaya Entrprses Ltd Indivest Pte Limited SELL 403,310 224.30
3-Jul-14 Marico Kaya Entrprses Ltd Jyoti Portfolio Limited BUY 150,000 214.40
3-Jul-14 Aagam Cap Ivory Consultants Pvt Ltd BUY 146,605 174.87
3-Jul-14 Aagam Cap Eversight Tradecomm Private Limited SELL 117,000 174.23
3-Jul-14 Pokarna Premier Investment Fund Limited BUY 96,000 241.04
3-Jul-14 Asian Hotels (East) Ltd Jesmin Investments Limited SELL 85,000 208.20
3-Jul-14 Aries Agro Limited Templeton Stock Growth Private Limited SELL 135699 86.70
Derivatives Update
Long Build Up
Company Last % Chg % Chg OI OI (in 000)
UCOBANK 113 5.8 5.1 25,072
BIOCON 543 3.9 10.6 5,404
ARVIND 244 3.7 9.7 7,542
BHARATFORG 672 1.2 14.6 3,054
Short Build Up
Company Last % Chg % Chg OI OI (in 000)
GMRINFRA 31 (7.5) 46.4 229,760
JPASSOCIAT 72 (5.1) 15.4 151,616
SAIL 96 (3.3) 3.4 54,408
M&MFIN 276 (3.1) 9.2 6,240
Short Covering
Company Last % Chg % Chg OI OI (in 000)
TATAMOTORS 469 2.8 (4.0) 20,312 AUROPHARMA 774 2.3 (3.6) 9,746
HDIL 103 1.4 (5.5) 33,120
IRB 252 1.0 (5.3) 12,956
Profit Booking
Company Last % Chg % Chg OI OI (in 000)
UNITECH 33 (4.6) (5.3) 188,445
IBREALEST 96 (3.9) (5.6) 31,996
NHPC 27 (2.0) (3.5) 74,232
INDUSINDBK 576 (1.8) (2.3) 5,381
Delivery SpikeCompany Volume Spike (%) Chg (%
Adani 779,758 358% 0.56
Glenmark 1,246,376 197% 5.64
BPCL 971,516 179% (0.37
HCLTech 969,505 131% (0.94
Rel Capital 711,190 113% 0.44
Tata Motors 4,126,633 103% 3.06Sun Pharma 2,521,591 99% 1.94
TCS 483,550 74% 0.68
GMR Infra 31,054,580 71% (7.70
JP Associate 14,368,813 45% (4.64
8/10/2019 AMP - 140704.pdf
http://slidepdf.com/reader/full/amp-140704pdf 3/27
T IQUE STOCK BROKING L IMITED 4 July 201FROM THE RESEARCH DESK
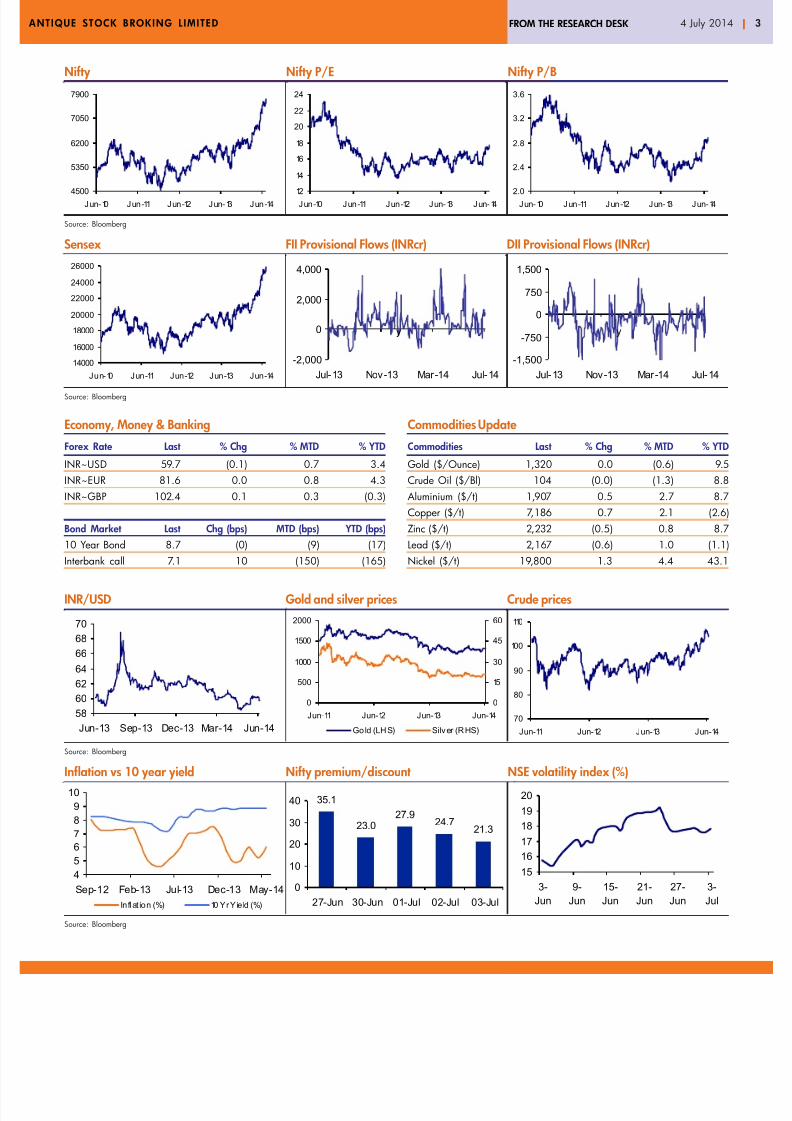
Commodities Update
Commodities Last % Chg % MTD % YTD
Gold ($/Ounce) 1,320 0.0 (0.6) 9.5
Crude Oil ($/Bl) 104 (0.0) (1.3) 8.8
Aluminium ($/t) 1,907 0.5 2.7 8.7
Copper ($/t) 7,186 0.7 2.1 (2.6
Zinc ($/t) 2,232 (0.5) 0.8 8.7
Lead ($/t) 2,167 (0.6) 1.0 (1.1
Nickel ($/t) 19,800 1.3 4.4 43.1
Economy, Money & Banking
Forex Rate Last % Chg % MTD % YTD
INR~USD 59.7 (0.1) 0.7 3.4
INR~EUR 81.6 0.0 0.8 4.3
INR~GBP 102.4 0.1 0.3 (0.3)
Bond Market Last Chg (bps) MTD (bps) YTD (bps)
10 Year Bond 8.7 (0) (9) (17)
Interbank call 7.1 10 (150) (165)
Nifty Nifty P/E Nifty P/B
Source: Bloomberg
Sensex FII Provisional Flows (INRcr) DII Provisional Flows (INRcr)
Source: Bloomberg
INR/USD Gold and silver prices Crude prices
Source: Bloomberg
Inflation vs 10 year yield Nifty premium/discount NSE volatility index (%)
Source: Bloomberg
4
5
6
7
8
9
10
Sep-12 Feb-13 Jul-13 Dec-13 May-14
Inflat ion (%) 10 Yr Yie ld (%)
-1,500
-750
0
750
1,500
Jul-13 Nov-13 Mar-14 Jul-14
y
-2,000
0
2,000
4,000
Jul-13 Nov-13 Mar-14 Jul-14
y
35.1
23.027.9
24.721.3
0
10
20
30
40
27-Jun 30-Jun 01-Jul 02-Jul 03-Jul
15
16
17
18
19
20
3-
Jun
9-
Jun
15-
Jun
21-
Jun
27-
Jun
3-
Jul
58
60
62
64
66
68
70
Jun-13 Sep-13 Dec-13 Mar-14 Jun-14
4500
5350
6200
7050
7900
Jun-10 Jun-11 Jun-12 Jun-13 Jun-14
12
14
16
18
20
22
24
Jun-10 Jun-11 Jun-12 Jun-13 Jun-14
2.0
2.4
2.8
3.2
3.6
Jun-10 Jun-11 Jun-12 Jun-13 Jun-14
14000
16000
18000
20000
22000
24000
26000
Jun-10 Jun-11 Jun-12 Jun-13 Jun-14
0
500
1000
1500
2000
Jun-11 Jun-12 Jun-13 Jun-14
0
15
30
45
60
Gold (LHS) Silver (RHS)
70
80
90
100
110
Jun-11 Jun-12 Jun-13 Jun-14

8/10/2019 AMP - 140704.pdf
http://slidepdf.com/reader/full/amp-140704pdf 4/27
T IQUE STOCK BROKING L IMITED 4 July 201FROM THE RESEARCH DESK
Key financials Year ended March (INRm) 2012 2013 2014 2015e 2016e
Revenues (USDm) 313 410 445 505 579
Revenues (INRm) 15,000 22,386 26,940 30,305 34,711
EBITDA 2,166 3,641 4,208 4,845 5,875
EBITDA margin (%) 14.4 16.3 15.6 16.0 16.9
PAT 1,450 2,367 2,515 3,005 3,595
Net profit margin (%) 9.7 10.6 9.3 9.9 10.4
EPS 8.1 12.1 13.2 15.9 19.1Source: Company, Antique
INITIATING COVERAGE
KPIT Technologies LimitedBack on the growth track; Buy
We initiate coverage on KPIT Technologies with a Buy rating and target price ofINR230 per share. KPIT is a leading player in the automotive engineering spacemaking it well-positioned to capture growth opportunities from increasingadoption of electronics in automobiles. We have a positive outlook on thecompany led by: 1) Earnings CAGR of 20% over FY14-16e on account of strongrevenue growth and likely margin expansion, 2) Revenue CAGR of 14% (FY14-16e), led by leadership in the automotive engineering space, stabilisation ofdecline in top client (Cummins) and turnaround in SAP practice, 3) Increasedfocus on key clients and re-organisation leading to improved client mining. Themanagement expects key accounts to contribute to 65-70% of its goal of USD1bn in revenues by 2017, 4) Potential to expand margins, given tailwinds fromprofitability in SAP SBU; higher offshoring; and increased utilisation.
The stock trades at 11x FY15e and 9x FY16e earnings, which is ~15% discountto its peers. In its peer set, it is the third largest player in terms of revenues(after Mphasis and Mindtree). However, it trades at a FY16e EV/Sales of
1.2x, which is lower than Mphasis (1.5x) and Mindtree (1.6x). Post a dismaFY14, margins and earnings are set to improve and we see scope for re-rating. We recommend a Buy with a target price of INR230 per share.
Turnaround in top client and SAP SBUIn FY14, KPIT's YoY revenue growth slowed to 8% from 20% CAGR over FY08-13. It saw a5% decline in revenues from its top client and 10% dip from the SAP SBU. Together these twoareas constitute to 42% of revenues. Going ahead, revenues from Cummins are likely tostabilise as the company's outlook improves. On the SAP front, KPIT has successfully alignedits services with SAP's transformed product mix and has closed multiple deals recently, showingsigns of recovery. We expect the SBU to grow at a 10% CAGR over FY14-16e.
Well positioned in the automotive engineering spaceKPIT provides product engineering services for every sub-domain of automobiles, from invehicle networks to powertrain. The total spend on electronics in vehicles is expected to rise to
~30% in the next five years from 12-13%. Outsourcing in this area is still nascent at 8% (resin-house) and is growing faster by 250-300bps than captives. KPIT's leadership will aid itsgrowth in this segment. This SBU constitutes for 25% of revenues and we expect organicCAGR of 21% over FY14-16e.
See significant tailwinds to marginsIn FY14, the SAP SBU reported negative margins of 5-6%. With this business turning around,we expect 5% EBITDA margins in the SBU for FY15e. In addition, the margin levers availableare: 1) Likely increase in offshoring to 52-53% in 2-3 years from 46% in FY14; 2) Likely higheutilisation to ~74% in FY15e from 71% in FY14; 3) Employee pyramid rationalisation; and 4likely growth in IP revenues with monetisation of products like Revolo.
Valuations and outlookThe stock trades at 11x FY15e and 9x FY16e. Considering its likely recovery and positioningcompared to midcap peers, we see potential for a re-rating. We are valuing the company a12x FY16e earnings, which is a 20% discount to Persistent. We are valuing midcap IT stocksat a discount of 15-30% to Tier-I vendors. We initiate a Buy on KPIT with a target price ofINR230 per share.
Sagar Lele+91 22 4031 [email protected]
Pratish Krishnan+91 22 4031 [email protected]
Reco : BUY
CMP : INR170
Target Price : INR230
Potential Return : 35%
Market dataSensex : 25,824
Sector : IT
Market Cap (INRbn) : 33.7
Market Cap (USDbn) : 0.6
O/S Shares (m) : 194.9
52-wk HI/LO (INR) : 190/117
Avg Daily Vol ('000) : 569
Bloomberg : KPIT IN
Returns (%)1m 3m 6m 12m
Absolute 6 5 0 44
Relative 2 (8) (19) 9
Source: Bloomberg
Shareholding pattern
Promoters : 22%FII : 33%
DII : 7%
Others : 38%
Source: Bloomberg
ValuationFY14 FY15e FY16e
EPS (INR) 13.2 15.9 19.1PE (x) 12.9 10.7 8.9
P/BV (x) 2.5 2.0 1.7
EV/EBITDA (x) 14.3 8.6 7.8
Dividend Yield (%) 0.6 0.8 0.9
Source: Bloomberg
Price performance vs Nifty
Source: Bloomberg
Source: Bloomberg
80
100
120
140
160
Jun-13 Oct-13 Feb-14 Jun-14
KPIT Tech NIFTY

8/10/2019 AMP - 140704.pdf
http://slidepdf.com/reader/full/amp-140704pdf 5/27
T IQUE STOCK BROKING L IMITED 4 July 201FROM THE RESEARCH DESK
Investment thesis
KPIT is an IT services and product engineering company, which specialises in automotive andtransportation, manufacturing and energy, and utilities. It provides product engineering servicesfor every sub-domain of an automobile, including in-vehicle networks, body electronics, safetyinfotainment, powertrain, vehicle diagnostics, etc. It works with 10 of the top 12 automotiveoriginal equipment manufacturers in the world. It is also a leading provider of application
services for Oracle and SAP. From FY08-14, its revenues have organically and inorganicallygrown at 20% CAGR.
We initiate coverage on KPIT with a Buy rating and target price of INR230 per share, anupside of 23% from current levels. From FY08 to FY13, KPIT saw revenue and earningsCAGR of 23% and 35%, respectively. However, it faced some headwinds in FY14, whichslowed revenue and earnings growth to 8% and 9%, respectively. Going forward, we expect
1. The company's performance is likely to pick-up, with the pain areas behind it. Top clienrevenues (which declined 5% in FY14) are likely to stabilise while the SAP SBU (whichdeclined 10% in FY14) is likely to turnaround.
2. Leadership in the fast-growing automotive product engineering market (25% of revenueswill help boost growth. We expect organic growth from automotive and engineering to
be 14% for FY15e and 16% for FY16e.
3. Changed organisation structure, sales approach, and focus areas to penetrate clientwider and deeper are likely to support growth in the coming years. The company intendsto mine ~50 strategic and potential strategic accounts in order to reach its goal of USD1bnin revenues by 2017.
4. The company has potential to expand margins given the turnaround in its SAP businessprospective offshoring, higher utilisation, and pyramid rationalisation.
5. The stock is trading at 11x FY15e and 9x FY16e, which is at a ~15% discount to itspeers. Going forward, likely recovery in problem areas and higher margins, and improvinggrowth trajectory are likely to lead to a re-rating.
Key assumptionsFY08 FY09 FY10 FY11 FY12 FY13 FY14 FY15e FY16e
Revenue (USDm) 147 174 154 222 313 410 445 505 579
YoY growth (%) 43% 19% -12% 44% 41% 31% 8% 13% 15%
EBITDA margin (%) 13% 23% 22% 15% 14% 16% 16% 16% 17%
EBITDA margin change (bps) -270 1055 -105 -703 -60 183 -74 46 94
EPS (INR) 6.56 8.41 10.80 5.49 8.08 12.07 13.21 15.94 19.07
YoY growth (%) 20% 28% 28% -49% 47% 49% 9% 21% 20%
PE (x) 12.87 10.66 8.91
Target PE (x) 12.00
YoY growth (%)
Integrated Enterprise Solutions 49% 22% 16% 13% 16%
Auto and Engineering 36% 22% 11% 23% 17%
SAP 38% 24% -10% 8% 12%
Business Transformation Unit 32% 7% 11%
Source: Company, Antique
Valuations attractive, re-rating likely
KPIT under-performed its peers throughout the last 12 months
On account of headwinds from Cummins and the SAP SBU, KPIT saw a decline in revenuegrowth rate, and thus profitability. Revenue growth declined to 8% YoY in FY14 from 31% inFY13. EBIT margin fell to 13.5% in FY14 from 14.2% in FY13. The stock has underperformedthe NSE IT index by 12% over the last 12 months. It has under-performed by 27% and 44%relative to largecap and midcaps vendors, respectively. It has also under-performed its peersthroughout the year.
8/10/2019 AMP - 140704.pdf
http://slidepdf.com/reader/full/amp-140704pdf 6/27
T IQUE STOCK BROKING L IMITED 4 July 201FROM THE RESEARCH DESK
Reduced under-performance in recent times1 month 3 months 6 months 12 months
Indices Nifty 3 15 21 35
NSE IT Index 6 4 2 50
Large caps TCS 7 10 10 61
Infosys 4 -1 -9 34
Wipro 5 -3 -4 52
HCL Tech 2 2 14 85Tech Mahindra 12 11 11 94
Mid caps under coverage Mphasis 4 4 -2 13
Hexaware -1 0 15 83
KPIT -1 2 -4 38
Persistent 11 3 13 122
Other mid caps MindTree 30 36 18 120
Cyient 30 9 2 95
NIIT Tech 16 6 22 60
Polaris 4 9 58 83
Source: Bloomberg
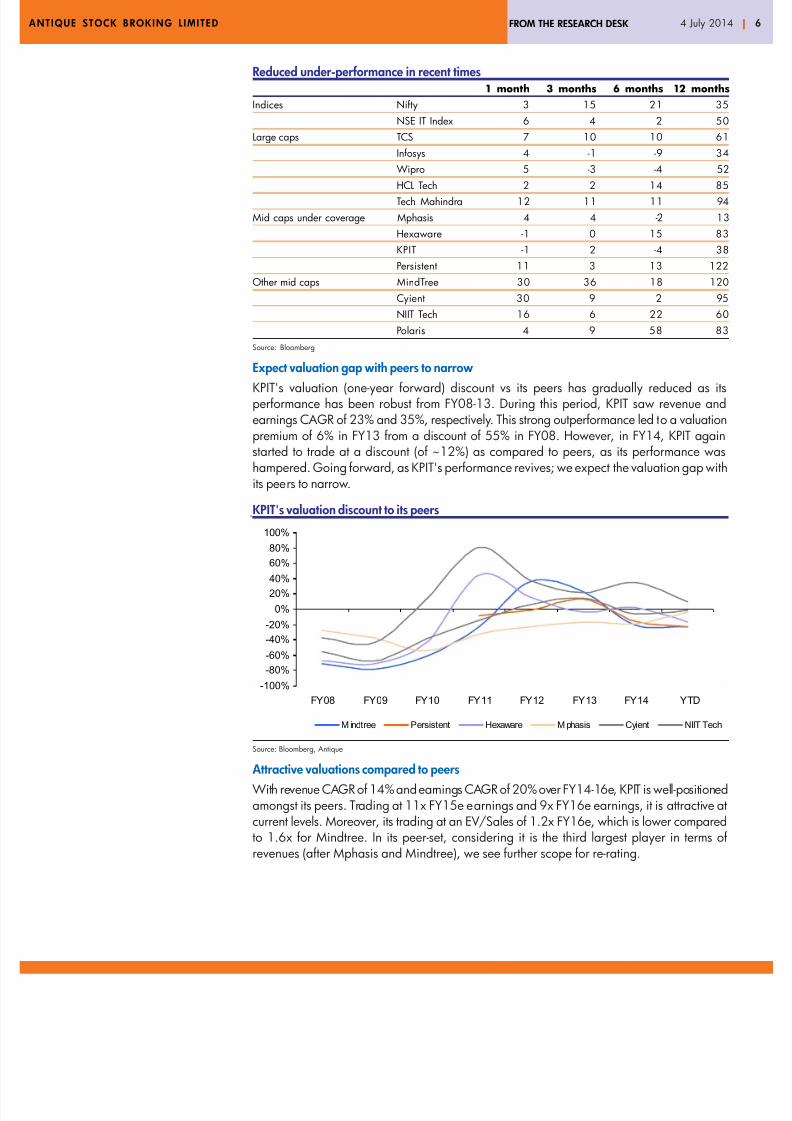
Expect valuation gap with peers to narrow
KPIT's valuation (one-year forward) discount vs its peers has gradually reduced as itsperformance has been robust from FY08-13. During this period, KPIT saw revenue andearnings CAGR of 23% and 35%, respectively. This strong outperformance led to a valuationpremium of 6% in FY13 from a discount of 55% in FY08. However, in FY14, KPIT againstarted to trade at a discount (of ~12%) as compared to peers, as its performance washampered. Going forward, as KPIT's performance revives; we expect the valuation gap withits peers to narrow.
KPIT's valuation discount to its peers
Source: Bloomberg, Antique
Attractive valuations compared to peers
With revenue CAGR of 14% and earnings CAGR of 20% over FY14-16e, KPIT is well-positionedamongst its peers. Trading at 11x FY15e earnings and 9x FY16e earnings, it is attractive acurrent levels. Moreover, its trading at an EV/Sales of 1.2x FY16e, which is lower comparedto 1.6x for Mindtree. In its peer-set, considering it is the third largest player in terms orevenues (after Mphasis and Mindtree), we see further scope for re-rating.
-100%
-80%
-60%
-40%
-20%
0%
20%
40%60%
80%
100%
FY08 FY09 FY10 FY11 FY12 FY13 FY14 YTD
M indtree Persistent Hexaware M phasis Cyient NIIT Tech

8/10/2019 AMP - 140704.pdf
http://slidepdf.com/reader/full/amp-140704pdf 7/27
T IQUE STOCK BROKING L IMITED 4 July 201FROM THE RESEARCH DESK
Midcap synopsisKPIT Mindtree Cyient NIIT Tech Hexaware Mphasis Persisten
Recommendation BUY na na na SELL BUY BUY
Target Price 230 na na na 125 520 1,400
CMP 170 864 653 449 152 425 1,087
Upside/ (Downside) % 35% na na na -18% 22% 29%
Revenue (USD)
FY13 410 436 345 372 364 1,025 238FY14 445 502 363 382 388 420 274
FY15e 505 589 429 419 397 1,020 329
FY16e 579 694 480 467 445 1,143 387
CAGR (%) (FY13-15e) 10.9% 16.2% 11.5% 6.2% 4.4% na 17.6%
CAGR (%) (FY14-16e) 14.1% 17.7% 15.0% 10.6% 7.1% na 18.8%
Revenue YoY (USD)
FY14 8.3% 15.1% 5.3% 2.7% 6.4% na 15%
FY15e 13.5% 17.4% 17.9% 9.7% 2.5% na 20%
FY16e 14.7% 17.9% 12.1% 11.5% 12.0% 12% 18%
EBITDA (INRm)
FY13 3,641 4,864 3,416 3,380 4,074 10,335 3,349
FY14 4,183 6,100 4,101 3,631 5,123 4,778 4,262
FY15e 4,845 6,635 4,779 4,155 4,885 11,044 5,217
FY16e 5,875 8,224 5,369 4,750 5,484 12,997 6,171
EBITDA %
FY14 15.5% 20.1% 18.6% 15.8% 22.4% 18.2% 25.5%
FY15e 16.0% 19.0% 18.6% 16.5% 20.2% 17.9% 26.2%
FY16e 16.9% 20.0% 18.6% 16.9% 20.4% 18.8% 26.4%
PAT (INRm)
FY13 2,276 3,393 2,311 2,184 3,276 7,437 1,876
FY14 2,490 4,508 2,660 2,382 3,791 3,472 2,493
FY15e 3,005 4,664 3,474 2,644 3,512 8,160 3,209
FY16e 3,595 5,798 3,956 3,022 4,088 9,686 3,957
EPS (INR)
FY13 12 41 21 36 11 35 47
FY14 13 54 24 38 13 15 62
FY15e 16 55 31 43 12 39 80
FY16e 19 68 35 49 14 46 99
YoY %
FY14 9% 31% 15% 7% 16% na 33%
FY15e 21% 2% 29% 13% -7% na 29%
FY16e 20% 23% 15% 14% 16% 19% 23%
CAGR (%) (FY13-15) 15% 15.5% 21.8% 10.2% 4% na 31%
CAGR (%) (FY14e-16e) 20% 12.0% 21.9% 13.7% 4% na 26%
ValuationsEV/ Sales
FY14 2.1 1.6 1.3 1.0 1.9 1.6 2.3
FY15e 1.4 1.9 1.3 1.0 1.8 nm 1.8
FY16e 1.2 1.6 1.1 0.9 1.6 1.5 1.4
EV/ EBITDA
FY14 14.5 8.0 7.1 6.2 8.3 9.1 8.9
FY15e 8.7 10.1 6.8 6.2 8.7 nm 6.7
FY16e 8.0 8.1 6.1 5.5 7.8 8.5 5.2
PE (x)
FY15e 10.7 15.6 21.3 10.4 12.8 10.9 13.5
FY16e 8.9 12.7 18.5 9.1 11.0 9.2 11.0
Source: Company, Bloomberg, Antique

8/10/2019 AMP - 140704.pdf
http://slidepdf.com/reader/full/amp-140704pdf 8/27
T IQUE STOCK BROKING L IMITED 4 July 201FROM THE RESEARCH DESK
Recent downgrades hold scope for re-rating as performance improves
Historically, the company has provided annual revenue and net profit guidance. While it hasmissed its revenue guidance twice: FY09 (by 6-8%) and FY14 (by 4-7%), it has met its profiguidance in all years. The street has downgraded FY15 and FY16 earnings estimates by ~79% over the last six months. We are slightly ahead of street estimates and see scope foupgrades, with KPIT's performance reviving in FY15e.
Lower street estimates in recent times
Source: Bloomberg, Antique
Re-rating likely given an improvement in performance
Although KPIT saw its FY14 revenue growth decline to 8% YoY from 31% in FY13, and FY14EBIT margin dip to 13.5% from 14.2% in FY13, it sustained its base valuations. At present, iis trading at 11x and 9x FY15e and FY16e earnings, respectively. Revenue and earningsCAGR of 14% and 20% over FY14-16e, respectively, marks a significant improvement fromFY14. The recovery and likely growth hold scope for a potential re-rating. We value the stockat 12x FY16e earnings, targeting the stock at INR230 per share.
KPIT's P/E band
Source: Bloomberg, Antique
0
5
10
15
20
25
J u n - 0 9
S e p - 0 9
D e c - 0 9
M a r - 1 0
J u n - 1 0
S e p - 1 0
D e c - 1 0
M a r - 1 1
J u n - 1 1
S e p - 1 1
D e c - 1 1
M a r - 1 2
J u n - 1 2
S e p - 1 2
D e c - 1 2
M a r - 1 3
J u n - 1 3
S e p - 1 3
D e c - 1 3
M a r - 1 4
J u n - 1 4
FY11 FY12 FY13 FY14
FY15e FY16e Antique FY15e Antique FY16e
Valuationssustaineddespite
relativelylowerperformancein FY14
0
20
40
60
80
100
120
140
160
180
200
A p r - 0 7
J u l - 0 7
O c t - 0 7
J a n - 0 8
A p r - 0 8
J u l - 0 8
O c t - 0 8
J a n - 0 9
A p r - 0 9
J u l - 0 9
O c t - 0 9
J a n - 1 0
A p r - 1 0
J u l - 1 0
O c t - 1 0
J a n - 1 1
A p r - 1 1
J u l - 1 1
O c t - 1 1
J a n - 1 2
A p r - 1 2
J u l - 1 2
O c t - 1 2
J a n - 1 3
A p r - 1 3
J u l - 1 3
O c t - 1 3
J a n - 1 4
A p r - 1 4
KPIT 3X 5X 7X 9X 11X
FY09 revenue guidance missed Low guidance for FY14 (13-16%)

8/10/2019 AMP - 140704.pdf
http://slidepdf.com/reader/full/amp-140704pdf 9/27
T IQUE STOCK BROKING L IMITED 4 July 201FROM THE RESEARCH DESK
Revenue CAGR of 14% over FY14-16e EPS CAGR of 20% over FY14-16e
Source: Bloomberg, Antique Source: Bloomberg, Antique
Turnaround likely in the pain areas of FY14
Over the last six years, KPIT has seen 20% revenue CAGR. However, revenue growth slowed
in FY14, wherein revenues were USD445m. It fell shy of its annual guidance of USD465475m (13-16% growth), having grown 8% over FY13. The drag came in because of a 5%decline in revenues from its top client - Cummins (17% of revenues), and a decline of 10%from its SAP practice (25% of revenues). In effect, the company saw a decline in 42% of itsbusiness. Going forward, we expect: 1) Decline from Cummins to stabilise and growmoderately in FY15e; and 2) Revenues from SAP to turnaround on account of re-alignment oKPIT's SAP offerings, with SAP's changed product mix and strong deal closures. This is likelyto accelerate revenue growth. We expect 13% and 15% revenue growth for FY15e andFY16e, respectively.
Growth slows to 8% YoY in FY14 FY14 revenues from Cummins declines by 5%
Source: Company, Antique Source: Company, Antique
MindtreePersistent
KPIT
Polaris
Cyient
NIIT Tech
Hexaware
0%
2%
4%
6%
8%
10%
12%
14%
16%
18%
20%
0.0 5.0 10.0 15.0
PE (x)
R e v e n u e C A G
R ( F Y 1 4 - 1 6 e ) ( % )
Mindtree
Persistent
KPITPolaris Cyient
NIIT Tech
Hexaware
0%
5%
10%
15%
20%
25%
30%
0.0 5.0 10.0 15.0
PE (x)
E P S C A G R
( F Y 1 4 - 1 6 e ) ( %
0
50
100
150
200
250
300
350
400
450
500
FY08 FY09 FY10 FY11 FY12 FY13 FY14
-20%
-10%
0%
10%
20%
30%
40%
50%
Revenue (USDm) - LHS YoY growth (%) - RHS
0
10
20
30
40
50
60
70
80
90
FY09 FY10 FY11 FY12 FY13 FY14
-40%
-30%
-20%
-10%
0%
10%
20%
30%
40%
Revenue (USDm) - LHS YoY grow th (%) - RHS
8/10/2019 AMP - 140704.pdf
http://slidepdf.com/reader/full/amp-140704pdf 10/27
T IQUE STOCK BROKING L IMITED 4 July 2014FROM THE RESEARCH DESK
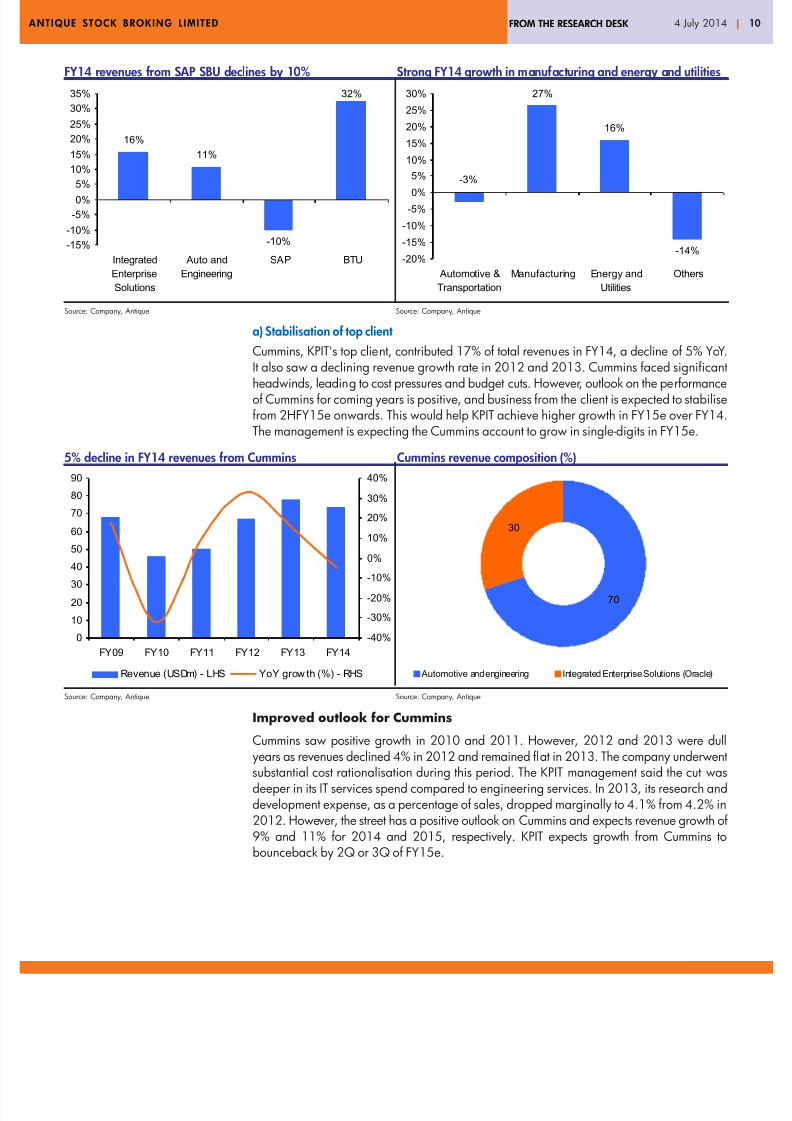
FY14 revenues from SAP SBU declines by 10% Strong FY14 growth in manufacturing and energy and utilities
Source: Company, Antique Source: Company, Antique
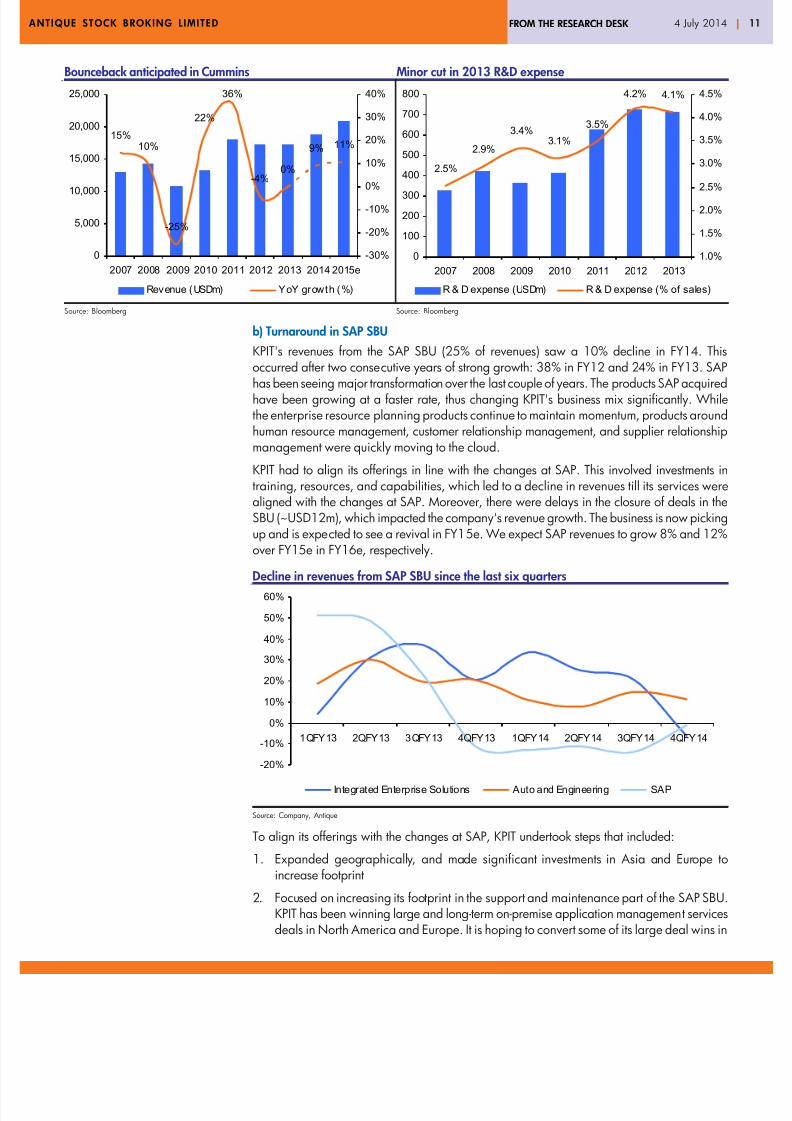
a) Stabilisation of top client
Cummins, KPIT's top client, contributed 17% of total revenues in FY14, a decline of 5% YoYIt also saw a declining revenue growth rate in 2012 and 2013. Cummins faced significanheadwinds, leading to cost pressures and budget cuts. However, outlook on the performanceof Cummins for coming years is positive, and business from the client is expected to stabilisefrom 2HFY15e onwards. This would help KPIT achieve higher growth in FY15e over FY14The management is expecting the Cummins account to grow in single-digits in FY15e.
5% decline in FY14 revenues from Cummins Cummins revenue composition (%)
Source: Company, Antique Source: Company, Antique
Improved outlook for Cummins
Cummins saw positive growth in 2010 and 2011. However, 2012 and 2013 were dul
years as revenues declined 4% in 2012 and remained flat in 2013. The company underwensubstantial cost rationalisation during this period. The KPIT management said the cut wasdeeper in its IT services spend compared to engineering services. In 2013, its research anddevelopment expense, as a percentage of sales, dropped marginally to 4.1% from 4.2% in2012. However, the street has a positive outlook on Cummins and expects revenue growth o9% and 11% for 2014 and 2015, respectively. KPIT expects growth from Cummins tobounceback by 2Q or 3Q of FY15e.
27%
16%
-14%
-3%
-20%
-15%
-10%
-5%
0%
5%
10%
15%
20%
25%
30%
Automotive &
Transportation
Manufacturing Energy and
Utilities
Others
16%
11%
-10%
32%
-15%
-10%
-5%
0%5%
10%
15%
20%
25%
30%
35%
Integrated
Enterprise
Solutions
Auto and
Engineering
SAP BTU
0
10
20
30
40
50
60
70
80
90
FY09 FY10 FY11 FY12 FY13 FY14
-40%
-30%
-20%
-10%
0%
10%
20%
30%
40%
Revenue (USDm) - LHS YoY grow th (%) - RHS
70
30
Automotive and engineering Integrated Enterprise Solutions (Oracle)
8/10/2019 AMP - 140704.pdf
http://slidepdf.com/reader/full/amp-140704pdf 11/27
T IQUE STOCK BROKING L IMITED 4 July 2014FROM THE RESEARCH DESK
Bounceback anticipated in Cummins Minor cut in 2013 R&D expense
Source: Bloomberg Source: Bloomberg
b) Turnaround in SAP SBU
KPIT's revenues from the SAP SBU (25% of revenues) saw a 10% decline in FY14. Thisoccurred after two consecutive years of strong growth: 38% in FY12 and 24% in FY13. SAPhas been seeing major transformation over the last couple of years. The products SAP acquiredhave been growing at a faster rate, thus changing KPIT's business mix significantly. Whilethe enterprise resource planning products continue to maintain momentum, products aroundhuman resource management, customer relationship management, and supplier relationshipmanagement were quickly moving to the cloud.
KPIT had to align its offerings in line with the changes at SAP. This involved investments intraining, resources, and capabilities, which led to a decline in revenues till its services werealigned with the changes at SAP. Moreover, there were delays in the closure of deals in theSBU (~USD12m), which impacted the company's revenue growth. The business is now pickingup and is expected to see a revival in FY15e. We expect SAP revenues to grow 8% and 12%over FY15e in FY16e, respectively.
Decline in revenues from SAP SBU since the last six quarters
Source: Company, Antique
To align its offerings with the changes at SAP, KPIT undertook steps that included:
1. Expanded geographically, and made significant investments in Asia and Europe toincrease footprint
2. Focused on increasing its footprint in the support and maintenance part of the SAP SBUKPIT has been winning large and long-term on-premise application management servicesdeals in North America and Europe. It is hoping to convert some of its large deal wins in
15%10%
-25%
22%
36%
-4%0%
9% 11%
0
5,000
10,000
15,000
20,000
25,000
2007 2008 2009 2010 2011 2012 2013 2014 2015e
-30%
-20%
-10%
0%
10%
20%
30%
40%
Revenue (USDm) YoY growth (%)
2.5%
2.9%
3.4%3.1%
3.5%
4.2% 4.1%
0
100
200
300
400
500
600
700
800
2007 2008 2009 2010 2011 2012 2013
1.0%
1.5%
2.0%
2.5%
3.0%
3.5%
4.0%
4.5%
R & D expense (USDm) R & D expense (% of sales)
-20%
-10%
0%
10%
20%
30%
40%
50%
60%
1QFY13 2QFY13 3QFY13 4QFY13 1QFY14 2QFY14 3QFY14 4QFY14
Integrated Enterprise Solutions Auto and Engineering SAP

8/10/2019 AMP - 140704.pdf
http://slidepdf.com/reader/full/amp-140704pdf 12/27
T IQUE STOCK BROKING L IMITED 4 July 2014FROM THE RESEARCH DESK
Asia to AMS on-premise deals. It intends to receive 60-70% of AMS revenues from ~20%currently, which is more profitable and stable
3. Offerings specific to the energy and utilities vertical turned mature, with KPIT seeingincreased traction in this space, due to the go-to-market strategy with SAP
4. Added a team of 25 SuccessFactors' certified consultants, under a business transfeagreement with an SF specialist company: Learn2Perform. As per the deal, all employees
and customers of L2P were transferred to KPIT, thus adding growth capability in the SAPSBU
5. Incurred heavy investments in the cloud aspect of SAP. This area has been seeingtremendous traction. KPIT expects 4x growth from the cloud business in FY15e
6. Invested in the High-Performance Analytic Appliance suite, where SAP is seeing significanprogress. It is beginning to see increased traction here, and expects it to auger welgoing forward.
SAP SBU back on track led by strong deal flows
For FY15e, KPIT aims to: 1) Concentrate on profitability in the SAP SBU; and 2) Usher growthback. In FY15e, it expects to return to modest profitability in the SAP SBU. Over the last fewquarters, it has progressed in terms of deal flows. These include:
1. Closed orders worth USD50m and built a healthy pipeline in the SAP SBU during 3QFY14
2. KPIT won over 17 deals in 4QFY14, with a total value of USD78.5m (on-premise andcloud together). The company is seeing very high traction in the geographies of US and
Asia-Pacific
3. AMS support services have been a major area of focus, where KPIT has landed sevenmulti-year, multi-million dollar deals to support SAP and other technologies for largecustomers
Leadership in the fast-growing automotive and engineering segment
KPIT is a leading player in the A&E space. It works with 10 of the top 12 global OEMs in
developing automotive solutions in multiple areas. In India, KPIT is the largest player in thisspace. It had revenues of USD110m (25% of its total revenues) in FY14. The automotiveproduct engineering space is fast-growing. Being a market leader in the segment, KPIT wilbenefit from this growth trend. We expect KPIT's A&E revenues to grow organically by 14%and 16% during FY15e and FY16e, respectively.
Expect 14% CAGR in A&E over FY14-16e
Source: Company, Antique
0
20
40
60
80
100
120
140
160
FY12 FY13 FY14 FY15e FY16e
0%
5%
10%
15%
20%
25%
30%
35%
40%
Auto and Engineering revenue (USDm) - LHS YoY grow th (%) - RHS

8/10/2019 AMP - 140704.pdf
http://slidepdf.com/reader/full/amp-140704pdf 13/27
T IQUE STOCK BROKING L IMITED 4 July 2014FROM THE RESEARCH DESK
Opportunity in the A&E space
The automotive electronics market refers to the embedded systems space, wherein electroniccontrol units are installed in a vehicle for purposes ranging from entertainment to powertrainand chassis control. As many as 100 ECUs are used in a vehicle, connected via several invehicle networks. KPIT develops solutions in the areas of AUTOSAR and in-vehicle networks,body electronics, chassis and driver assistance systems, engineering design, functional safetyinfotainment, instrument clusters, powertrain, and vehicle diagnostics. This is a fast growing
area on account of: 1) Increasing R&D spend in the auto industry; 2) Higherusage of electronics in vehicles; 3) Growing offshoring in the automotiveproduct engineering space; 4) Consolidation of ECUs by selling to OEMs;and 5) Standardisation of product development and higher adoption of AUTOSAR (Automotive Open System Architecture).
1. Increasing R&D expenditure in the automotive space
R&D expenditure has been growing at a fast pace since the last few years. While globaauto sales grew at a CAGR of 5% over 2010 to 2013, R&D expenditure of 25 top automobileOEMs saw a CAGR of 9% from 2010 to 2013. This signifies increased investments in producdevelopment, which would auger well for KPIT.
R&D expenditure growing faster than auto sales
Source: Bloomberg
Automobile R&D a major component in key geographies
Source: Zinnov Research
62,000,000
64,000,000
66,000,000
68,000,000
70,000,000
72,000,000
74,000,000
76,000,000
78,000,000
2010 2011 2012 2013
40,000
45,000
50,000
55,000
60,000
65,000
70,000
Global auto sales (LHS) R&D expenditure (USDm) (RHS)
5% CAGR in glob al auto sales
9% CAGR in R&D expenditure
Contribution of North Amer ica to
R&D
35%
23%
17%
13%
9% 3%
ISV Semiconductor
Automotive Telecom
Aerospace Others
Contribution o f Europe to R&D
54%
20%
10%
7%5%4%
Automotive Telecom
Aerospace Semiconductor
ISV Others
Contr ibutio n of Japan to R&D
49%
43%
8%
Automotive Consumer electronics
Semiconductor

8/10/2019 AMP - 140704.pdf
http://slidepdf.com/reader/full/amp-140704pdf 14/27
T IQUE STOCK BROKING L IMITED 4 July 2014FROM THE RESEARCH DESK
2. Increasing use of electronics in vehicles
The usage of electronics in vehicles has been increasing at a rapid rate. According to theKPIT management, overall spend on electronics has reached 12-13% of the car's total valuefrom ~5% in the past. In the next five years, the management expects 35% of the vehicle'svalue to be electronics. Each car and truck built in North America now contains over USD3,200worth of electric equipment, up from just under USD1,500 a decade ago. A multi-fold increaseis expected over the next five years. Worldwide sales of automotive electronic technology are
expected to soar to USD274bn in 2017 from USD189bn in 2012. This is likely to put KPIT ina sweet spot, being the segment leader.
3. Offshoring of product engineering in the automotive space is growing250-300bps faster than captives
The management said 92% of the product engineering in the automotive space is undergonein captives. Only 8% of the total spend is outsourced. While the total spend in this space isincreasing, the pie of outsourcing is growing at a faster rate. Outsourcing of product engineeringin the automotive space is growing faster than captives by 250-300bps. This provides playerslike KPIT a bigger opportunity in the already fast-growing segment.
4. Consolidation of ECUs
The number of ECUs in a car has nearly doubled in the last 10 years. A car is likely to haveup to 100 separate ECUs, with separate software, CPUs, code bases, and multi-layeredruntime environments. Consolidation of ECUs would result in increased efficiency in terms ospace, power usage, and hardware and software integration. The industry is moving towardsconsolidation, with increased standardisation. For instance, the GENIVI alliance has beendeveloped to reduce complexity from the development process, by creating standards foLinux-based in-vehicle infotainment systems. This approach reduces the overall cost odevelopment, minimises project risks, and timelines. This is likely to result in higher growth andbenefits accruing out of supplying solutions to OEMs directly. At present, 60% of KPIT'scustomers in the A&E space are OEMs, while 40% are Tier I and II suppliers. Going forwardKPIT intends to focus on direct supplies to OEMs to reap the benefits of higher opportunitiesfrom consolidation of ECUs.
KPIT's customer composition in the A&E SBU
Source: Company, Antique
5. Standardisation of product development and higher adoption of AUTOSAR
At the onset of the 90s, vehicle manufacturers developed software standards for electronicssuch as OSEK (open systems and their interfaces for the electronics in vehicles) to easemanagement of the increasingly complex bus systems in vehicle electronics. Later, AUTOSARwas introduced as embedded electronics and software systems attained a new level ocomplexity, and required a wider reaching model of standardisation. The adoption of
60%
40%
OEMs Tier-I and II suppliers
8/10/2019 AMP - 140704.pdf
http://slidepdf.com/reader/full/amp-140704pdf 15/27
T IQUE STOCK BROKING L IMITED 4 July 2014FROM THE RESEARCH DESK
AUTOSAR has been fast growing as:
1. Increases scalability to different vehicle and platform variants
2. Allows transferability of functions throughout the network
3. Enables OEMs to drive the process of software development, rather than it being led bysuppliers
4. OEMs can share intellectual property with multiple suppliers over a standardised platform
5. Helps saves costs and time for implementation
6. Enables maintenance, software updates, and upgrades
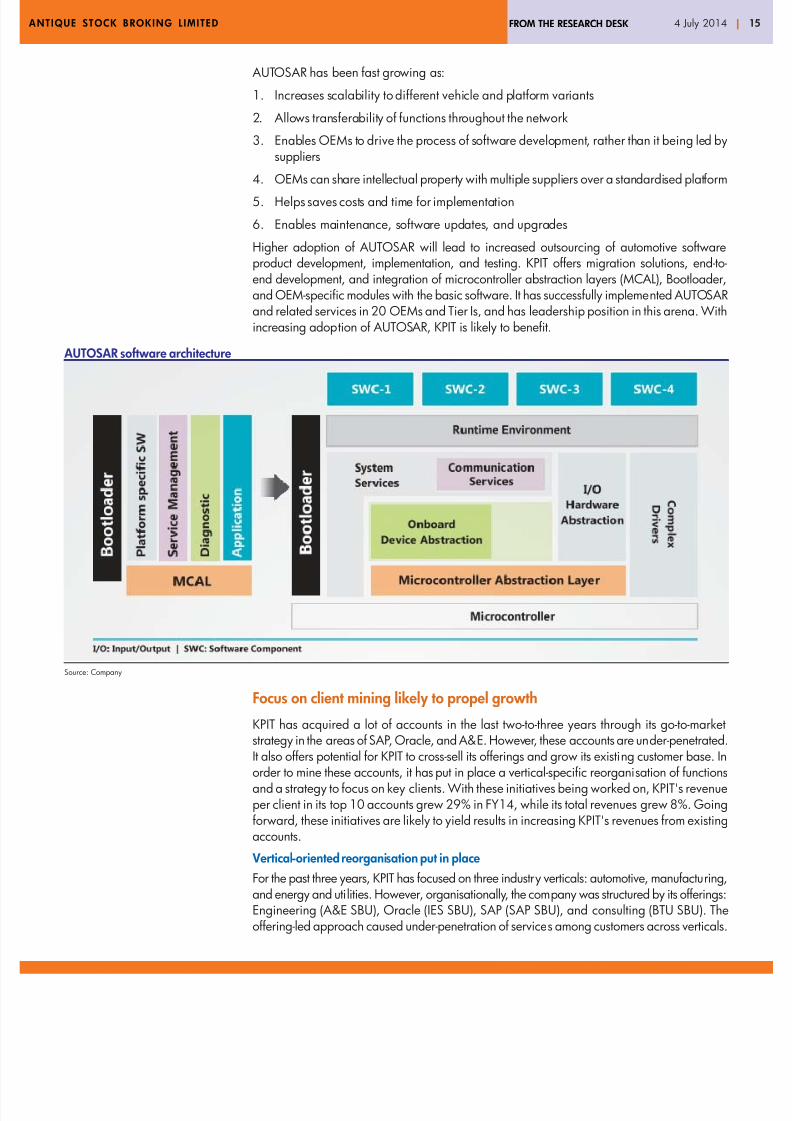
Higher adoption of AUTOSAR will lead to increased outsourcing of automotive softwareproduct development, implementation, and testing. KPIT offers migration solutions, end-toend development, and integration of microcontroller abstraction layers (MCAL), Bootloader,and OEM-specific modules with the basic software. It has successfully implemented AUTOSARand related services in 20 OEMs and Tier Is, and has leadership position in this arena. Withincreasing adoption of AUTOSAR, KPIT is likely to benefit.
AUTOSAR software architecture
Source: Company
Focus on client mining likely to propel growth
KPIT has acquired a lot of accounts in the last two-to-three years through its go-to-marketstrategy in the areas of SAP, Oracle, and A&E. However, these accounts are under-penetrated
It also offers potential for KPIT to cross-sell its offerings and grow its existing customer base. Inorder to mine these accounts, it has put in place a vertical-specific reorganisation of functionsand a strategy to focus on key clients. With these initiatives being worked on, KPIT's revenueper client in its top 10 accounts grew 29% in FY14, while its total revenues grew 8%. Goingforward, these initiatives are likely to yield results in increasing KPIT's revenues from existingaccounts.
Vertical-oriented reorganisation put in place
For the past three years, KPIT has focused on three industry verticals: automotive, manufacturingand energy and utilities. However, organisationally, the company was structured by its offeringsEngineering (A&E SBU), Oracle (IES SBU), SAP (SAP SBU), and consulting (BTU SBU). Theoffering-led approach caused under-penetration of services among customers across verticals

8/10/2019 AMP - 140704.pdf
http://slidepdf.com/reader/full/amp-140704pdf 16/27
T IQUE STOCK BROKING L IMITED 4 July 2014FROM THE RESEARCH DESK
For example, a domain expert from the A&E SBU would sell solutions but would be unable toextend it to application services. This left customers under-penetrated, with gaps in serviceprovided to accounts. This is evident from the high concentration of certain services in KPIT'sverticals, leaving potential areas for growth.
KPIT: Vertical/SBU splitFY14 revenues (USDm) Automotive Manufacturing Energy and utilities
A&E 55% 10% 0%
SAP 15% 30% 60%
IES 30% 60% 40%
Total 100% 100% 100%
Source: Company, Antique
To ensure consolidated offerings, KPIT reorganised its business to focus on verticals. With thissales and account management functions were organised by verticals and backed by offeringsprovided by SBUs. Recently, the company hired some high-level people to strengthen itsvertical leadership. KPIT is in the process of reorganising its structure, and expects fulimplementation to be complete by 1QFY15.
Focus on key accounts
With the new organisation in place, KPIT has identified ~26 strategic accounts and ~20potentially strategic clients, which are aligned with the verticals. It will focus on ~50 topaccounts to penetrate deeper, by partnering in multiple areas. In the last two-to -three yearsit has acquired a lot of accounts through its go-to-market strategy in the areas of SAP, Oracleand A&E. Now, the whole focus will be to bring collaboration and cross-selling across businessunits. To aid this process, it also formed the Business Transformation Unit, which will bringtogether the strengths of all SBUs and create larger deals for strategic accounts. According tothe management, these accounts have the potential of contributing 65-70% of the USD1bnrevenue goal that KPIT aims to achieve by 2017.
Faster growth from key customers in FY14
KPIT's focus on penetrating clients deeper can be seen as growth in its Top 10 clients and sta
customer accounts were more in FY14 than overall revenues. In FY14, while overall revenuesgrew 8% YoY, revenues from the Top 10 clients, excluding Cummins, grew 29%. The samefrom star customers (excluding Cummins) grew 14%. We have excluded Cummins as theaccount witnessed a 5% decline in FY14.
Faster growth in Top 10 accounts (excluding Cummins) Faster growth in star customer accounts (excluding Cummins)than overall growth than overall growth
Source: Company, Antique Source: Company, Antique
Increasing revenue per client
Increasing client penetration can also be seen from the rising average size of its key clients.Revenue per client of the Top 10 customers (excluding Cummins) grew 29% to USD14.9m in
FY14 from USD11.5m in FY13. This is much faster than the 8% revenue growth, indicatinghigh focus on its key clients and validating potential results of its main account strategy.
29%
8%
0
2040
60
80
100
120
140
160
FY09 FY10 FY11 FY12 FY13 FY14
-20%
-10%
0%
10%
20%
30%
40%
50%
Revenue from top 10 clients (ex. Cummins)
YoY grow th in top 10 clients, ex. Cummins (%)
Revenue growth (%)
14%
8%
0
50
100
150
200
FY09 FY10 FY11 FY12 FY13 FY14
-20%
-10%0%
10%
20%
30%
40%
50%
Star customer revenues (ex. Cummins) (USDm)
Grow th in star customer revenues (ex. Cummins)Revenue grow th (%)

8/10/2019 AMP - 140704.pdf
http://slidepdf.com/reader/full/amp-140704pdf 17/27
T IQUE STOCK BROKING L IMITED 4 July 2014FROM THE RESEARCH DESK
Revenue per client for Top 10 clients grew 29%
Source: Company, Antique
Potential margin expansion
In FY14, lower revenue growth was accompanied by a 55bps decline in EBIT margins to13.6%. This occurred on account of losses at the operating level in the SAP SBU on delays in
closure of three deals by up to four months, cost overruns in certain projects, higher investmentsand training costs, and increase onsite bench. In FY14, EBITDA for the SAP SBU stood at anegative 5-6%. From FY13, profitability in the SAP SBU swung negatively by ~10% from 45% last year. This is much lower than historical levels and compared to other SBUs. Goingforward, KPIT can see margin expansion resulting out of: 1) Turnaround in SAP profitability;2) Higher offshoring; 3) Increased utilisation; and 4) Pyramid rationalisation.
Margins likely to trend higher
Source: Company, Antique
1. Turnaround in SAP SBU profitability
The SAP SBU saw negative EBITDA margins of 5-6% in FY14, a sharp decline compared to
4-5% in FY13. Towards FY14-end, margins in the SAP SBU had come close to breaking evenGoing forward, margin improvement is likely to take place given: 1) Profitability in the SAPSBU is the management's top priority; 2) Volumes in the business are perking up; 3) Themanagement intends to take the onsite-offshore ratio in the SBU to 70:30/75:25 in FY15efrom 85:15 in FY14. We expect 5% EBITDA margins for the SAP SBU in FY15e.
SBU margins for FY13 and FY14 EBITDA margin (%)
SBU FY13 FY14
A&E 24-25 22-23
IES 18 18-19
BTU nm 19-20
SAP 4-5 (5-6Source: Company
3%
-7%
44%
17%
33%29%
02,000
4,000
6,000
8,000
10,000
12,000
14,000
16,000
FY09 FY10 FY11 FY12 FY13 FY14
-20-10
0%
10%
20%
30%
40%
50%
Revenue per client (top 10, ex. Cummins) (USD'000)
Grow th in revenue per client (top 10, ex. Cummins) (%)
Growth in non top-10 clients (%)
0
1,000
2,000
3,000
4,000
5,000
6,000
FY08 FY09 FY10 FY11 FY12 FY13 FY14 FY15e FY16e
6%
8%
10%
12%14%
16%
18%
20%
EBIT (INRm) - LHS EBIT margin (%) - RHS

8/10/2019 AMP - 140704.pdf
http://slidepdf.com/reader/full/amp-140704pdf 18/27
T IQUE STOCK BROKING L IMITED 4 July 2014FROM THE RESEARCH DESK
2. Higher offshoring likely going forward
KPIT has a high level of onsite work in its SAP SBU, and elevated level of offshore work in its A&E SBU. While offshore revenues constitute 15% of SAP SBU revenues, 75% of A&E revenuesare offshore. At the company level, FY14 offshore revenues stood at 46%. Going forwardoverall offshoring is expected to increase to 52-53% as:
1) A&E is expected to grow faster than other SBUs, leading to increased composition o
offshore revenues. We expect growth in A&E to be 23% for FY15e and 17% for FY16ewhich is higher than the overall revenue growth of 13% for FY15e and 15% for FY16e
2) KPIT's FY15 priority is to increase profitability in the SAP SBU. As part of this effort, thecompany intends to increase offshoring in the SAP SBU to 25-30% in FY15e from 15% inFY14.
Offshore component in SBUsOffshore (%) FY14 In 2-3 years
A&E 75 75
SAP 15 25-30
IES 59 70
Total 46 52-53
Source: Company
3. Headroom left on utilisation
On account of delays in deal closures, shifts in technology, higher bench, and increasedpeople on training in the SAP SBU, KPIT's utilisation levels saw a decline through FY13 andFY14. Onsite utilisation declined to 90% in 4QFY14 from 95% in 4QFY12. Offshore utilisationfell to 71% in 4QFY14 from 74% in 4QFY12. With a bounce back anticipated in the SAP SBUand increased traction across all other SBUs, the company sees headroom for expansionhere. It intends to take its onsite and offshore utilisation level to over 90% and ~74%, respectively
Decline in FY14 utilisation levels
Source: Company, Antique
4. Pyramid rationalisation
Of KPIT's total hiring, 50% constitutes freshers hired in the last three years. This has led tosignificant pyramid rationalisation in recent years. As of FY14, 35% of KPIT's employee basewas in the within three year work experience bracket. This number is expected to go higheras KPIT intends to maintain 50% of its hires as freshers for the next two-to-three years. Thiswould lead to further margin expansion going forward.
84%
86%
88%
90%
92%
94%
96%
4QFY12 1QFY13 2QFY13 3QFY13 4QFY13 1QFY14 2QFY14 3QFY14 4QFY14
68%
69%
70%
71%
72%
73%
74%
75%
76%
Onsite - LHS Offshore - RHS
8/10/2019 AMP - 140704.pdf
http://slidepdf.com/reader/full/amp-140704pdf 19/27
T IQUE STOCK BROKING L IMITED 4 July 2014FROM THE RESEARCH DESK
Financials
Profit and loss account (INRm) Year ended 31 Mar 2012 2013 2014 2015e 2016e
Revenues 15,000 22,386 26,940 30,305 34,711
Expenses 12,834 18,745 22,732 25,460 28,837
EBIDTA 2,166 3,641 4,208 4,845 5,875
Depreciation 445 472 540 606 694EBIT 1,721 3,170 3,669 4,239 5,181
Other income 138 117 -78 224 93
Interest expense 73 142 258 231 211
Profit before tax 1,786 3,146 3,334 4,232 5,063
Taxes including deferred taxation 437 766 941 1,227 1,468
Extra ordinary items & others 100 -13 122 0 0
Profit after tax 1,450 2,367 2,515 3,005 3,595
Recurring EPS 8.1 12.1 13.2 15.9 19.1
Balance sheet (INRm) Year ended 31 Mar 2012 2013 2014 2015e 2016e
Share capital 357 387 387 387 387
Reserves & surplus 7,094 10,246 12,364 15,369 18,964Net worth 7,451 10,633 12,751 15,756 19,351
Debt 2,139 3,213 4,390 3,722 3,171
Deferred tax liability & others 375 143 233 273 313
Capital employed 9,965 13,988 17,374 19,752 22,835
Gross fixed assets 3,822 4,335 5,273 6,073 7,073
Accumulated depreciation 2,155 2,573 3,112 3,719 4,413
Net assets 1,668 1,762 2,161 2,355 2,661
Capital work in progress & others 958 1,498 1,182 1,928 2,158
Investments 582 2,154 1,741 2,656 2,722
Goodwill 3,623 4,423 5,994 5,994 5,994
Current assets, loans & adv 6,450 8,010 10,156 10,850 13,533
Debtors 4,233 4,673 6,743 7,473 8,369
Cash & bank balances 1,473 1,921 1,908 1,079 2,666
Loans & advances and others 745 1,417 1,505 2,299 2,499
Current liabilities & provs 3,315 3,860 3,860 4,032 4,234
Creditors 1,757 1,904 1,021 1,143 1,295
Other liabilities & provisions 1,559 1,956 2,839 2,889 2,939
Net current assets 3,135 4,151 6,296 6,818 9,299
Application of funds 9,965 13,988 17,374 19,752 22,835
Per share data Year ended 31 Mar 2012 2013 2014 2015e 2016e
No. of shares (m) 180 188 188 188 188
BVPS (INR) 41.4 56.4 67.7 83.6 102.7
CEPS (INR) 11.4 21.6 19.4 19.8 28.6
DPS (INR) 0.7 0.9 1.1 1.3 1.6
Margins (%) Year ended 31 Mar 2012 2013 2014 2015e 2016e
EBIDTA 14.4 16.3 15.6 16.0 16.9
EBIT 11.5 14.2 13.6 14.0 14.9
PAT 9.7 10.6 9.3 9.9 10.4
Source: Company, Antique
Cash flow statement (INRm) Year ended 31 Mar 2012 2013 2014 2015e 2016e
PBT 1,886 2,847 3,430 4,232 5,063
Depreciation & amortisation 445 472 540 606 694
Interest expense 73 142 258 231 211
Interest/dividend received (54) (72) - (77) (93Other adjustments (204) (104) - -
(Inc)/dec in working capital (870) (1,083) (1,995) (1,784) (1,055
Tax paid (268) (998) (941) (1,227) (1,468
CF from operating activities 1,008 1,203 1,292 1,981 3,352
Capital expenditure (609) (701) (696) (1,073) (1,030
(Purchase)/sale of Investments (2,285) (2,875) 413 (915) (66
Income from investments 66 72 - 77 93
CF from investing activities (2,828) (3,503) (283) (1,911) (1,003
Inc/(dec) in share capital 65 1,662 - -
Inc/(dec) in debt 1,160 1,332 1,177 (667) (552
Dividends & interest paid (141) (273) (258) (231) (211
Others 126 4 (1,841) -
CF from financing activities 1,210 2,726 (921) (898) (762Net cash flow (610) 426 88 (829) 1,587
Opening balance 2,080 1,467 1,921 1,908 1,079
Closing balance 1,470 1,893 2,009 1,079 2,666
Growth indicators (%) Year ended 31 Mar 2012 2013 2014 2015e 2016e
Revenue 52.0 49.2 20.3 12.5 14.5
EBITDA 45.9 68.1 15.6 15.1 21.3
PAT 53.0 63.3 6.3 19.5 19.6
EPS 47.2 49.5 9.4 20.7 19.6
Valuation (x)
Year ended 31 Mar 2012 2013 2014 2015e 2016ePE 21.0 14.1 12.9 10.7 8.9
P/BV 4.1 3.0 2.5 2.0 1.7
EV/EBITDA 7.9 18.6 14.3 8.6 7.8
EV/Sales 1.7 2.8 2.1 1.4 1.2
Dividend Yield (%) 0.4 0.5 0.6 0.8 0.9
Financial ratios Year ended 31 Mar 2012 2013 2014 2015e 2016e
RoE (%) 19.5 22.3 19.7 19.1 18.6
RoCE (%) 21.7 26.0 24.2 24.5 25.7
Debt/Equity (x) 0.3 0.3 0.3 0.2 0.2
EBIT/Interest (x) 23.5 22.4 14.2 18.4 24.6
Source: Company Antique
8/10/2019 AMP - 140704.pdf
http://slidepdf.com/reader/full/amp-140704pdf 20/27
T IQUE STOCK BROKING L IMITED 4 July 2014FROM THE RESEARCH DESK
Key financials Year ended 31 Mar CY11 CY12 FY14 FY15e FY16e
Revenue (INRm) 25,245 23,073 13,410 13,818 17,951
EBITDA (INRm) 4,878 5,353 2,234 2,847 4,057
EBITDA Margin (%) 19.3 23.2 16.7 20.6 22.6
PAT (INRm) 1,976 3,061 946 2,225 3,298
EPS (INR) 34.2 53.0 16.4 37.8 56.1
P/E (x) 14.2 9.1 29.6 12.8 8.6
ROCE 9.2 9.5 4.3 12.8 17.7
ROE 15.4 22.3 4.7 20.5 25.2
Source: Company, Antique Year ending changed to March from FY14. FY14 is a 15-month period.
COMPANY UPDATE
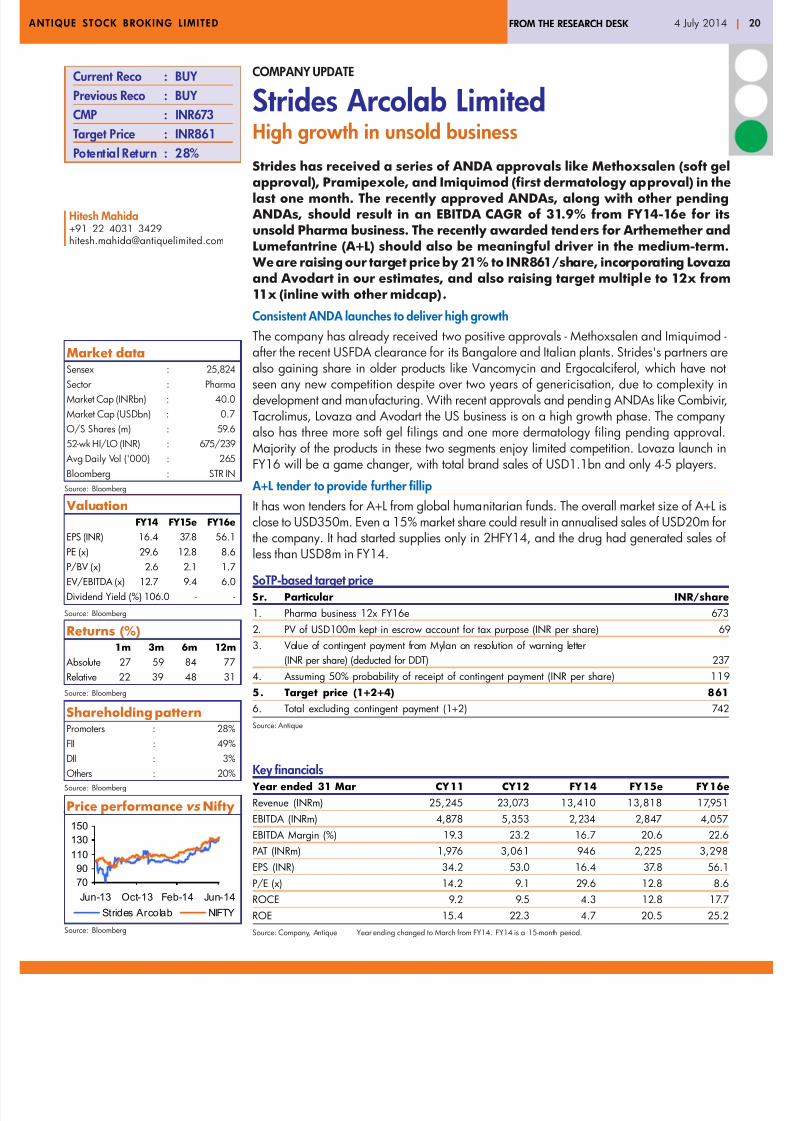
Strides Arcolab LimitedHigh growth in unsold business
Strides has received a series of ANDA approvals like Methoxsalen (soft ge
approval), Pramipexole, and Imiquimod (first dermatology approval) in thelast one month. The recently approved ANDAs, along with other pending ANDAs, should result in an EBITDA CAGR of 31.9% from FY14-16e for itsunsold Pharma business. The recently awarded tenders for Arthemether andLumefantrine (A+L) should also be meaningful driver in the medium-term. We are raising our target price by 21% to INR861/share, incorporating Lovazaand Avodart in our estimates, and also raising target multiple to 12x from11x (inline with other midcap).
Consistent ANDA launches to deliver high growth
The company has already received two positive approvals - Methoxsalen and Imiquimod after the recent USFDA clearance for its Bangalore and Italian plants. Strides's partners arealso gaining share in older products like Vancomycin and Ergocalciferol, which have notseen any new competition despite over two years of genericisation, due to complexity indevelopment and manufacturing. With recent approvals and pending ANDAs like CombivirTacrolimus, Lovaza and Avodart the US business is on a high growth phase. The companyalso has three more soft gel filings and one more dermatology filing pending approval.Majority of the products in these two segments enjoy limited competition. Lovaza launch inFY16 will be a game changer, with total brand sales of USD1.1bn and only 4-5 players.
A+L tender to provide further fillip
It has won tenders for A+L from global humanitarian funds. The overall market size of A+L isclose to USD350m. Even a 15% market share could result in annualised sales of USD20m forthe company. It had started supplies only in 2HFY14, and the drug had generated sales ofless than USD8m in FY14.
SoTP-based target priceSr. Particular INR/share
1. Pharma business 12x FY16e 673
2. PV of USD100m kept in escrow account for tax purpose (INR per share) 69
3. Value of contingent payment from Mylan on resolution of warning letter
(INR per share) (deducted for DDT) 237
4. Assuming 50% probability of receipt of contingent payment (INR per share) 119
5. Target price (1+2+4) 861
6. Total excluding contingent payment (1+2) 742
Source: Antique
Hitesh Mahida+91 22 4031 [email protected]
Current Reco : BUY
Previous Reco : BUY
CMP : INR673
Target Price : INR861
Potential Return : 28%
Market dataSensex : 25,824
Sector : Pharma
Market Cap (INRbn) : 40.0
Market Cap (USDbn) : 0.7
O/S Shares (m) : 59.6
52-wk HI/LO (INR) : 675/239
Avg Daily Vol ('000) : 265
Bloomberg : STR IN
Returns (%)1m 3m 6m 12m
Absolute 27 59 84 77
Relative 22 39 48 31
Source: Bloomberg
Shareholding patternPromoters : 28%
FII : 49%
DII : 3%
Others : 20%
Source: Bloomberg
ValuationFY14 FY15e FY16e
EPS (INR) 16.4 37.8 56.1
PE (x) 29.6 12.8 8.6
P/BV (x) 2.6 2.1 1.7
EV/EBITDA (x) 12.7 9.4 6.0
Dividend Yield (%) 106.0 - -
Source: Bloomberg
Price performance vs Nifty
Source: Bloomberg
Source: Bloomberg
70
90
110
130
150
Jun-13 Oct-13 Feb-14 Jun-14
Strides Arcolab NIFTY

8/10/2019 AMP - 140704.pdf
http://slidepdf.com/reader/full/amp-140704pdf 21/27
T IQUE STOCK BROKING L IMITED 4 July 2014FROM THE RESEARCH DESK
Key ANDA launches expected from Strides ArcolabBrand name Launch Brand Number Expected Expected Comments
status size of sales EBITDA
(USDm) players (USDm) (USDm)
Methoxsalen Launched 14 2 5 3 Soft gel product. Only generic to receive approval
Lovaza FY16 1,100 5 22 7 Teva has already launched in Apr-14 since it was
awarded FTF. Apotex has settled for 1QCY15 launch.
Par is other known filer
Avodart Nov-15 580 6 6 2 Patent expires in Nov-15
Combivir 2QFY15 275 5 6 2
Tacrolimus 2QFY15 955 7 10 3
Calcitriol 2QFY15 30 4 5 2 Soft gel
Source: Company, Antique
Strides Arcolab's partners Alvogen and Paddock have gained positive market share in Vancomycin and Ergocalciferol
Oral Vancomycin TRx share Ergocalciferol TRx share
Source: Company, Antique Source: Company, Antique
Alvogen
48%
Actavis
21%
Prasco
17%
Akorn
12%
Others
2%
Teva
43%
Rising
16%
Breckenridge
15%
Paddock14%
Others
12%

8/10/2019 AMP - 140704.pdf
http://slidepdf.com/reader/full/amp-140704pdf 22/27
T IQUE STOCK BROKING L IMITED 4 July 2014FROM THE RESEARCH DESK
Financials
Profit and loss account (INRm) Year ended 31 Mar CY11 CY12 FY14 FY15e FY16e
Net Sales 25,245 23,073 13,410 13,818 17,951
Material costs 12,638 9,980 7,147 7,600 9,711
Employee cost 2,801 2,809 1,572 1,575 1,993
Other Expenses 4,929 4,931 2,457 1,796 2,190Operating expenses 20,367 17,720 11,175 10,972 13,894
EBITDA 4,878 5,353 2,234 2,847 4,057
Depreciation 1,043 1,095 565 507 593
EBIT 3,835 4,258 1,669 2,339 3,464
Other income 526 583 602 663 729
Interest 1,903 1,934 1,089 220 70
PBT 2,459 2,907 1,183 2,782 4,123
Tax 387 1,021 3,245 556 825
APAT 2,072 3,072 946 2,225 3,298
Minority interest & prior period items 95 11 0 0 0
Net profits 1,976 3,061 946 2,225 3,298
AEPS 34.2 53.0 16.4 37.8 56.1
Balance sheet (INRm) Year ended 31 Mar CY11 CY12 FY14 FY15e FY16e
Share capital 584 588 588 588 588
Reserves & surplus 13,131 19,674 10,265 12,490 15,788
Net Worth 13,715 20,263 10,853 13,078 16,376
Minority interest 465 719 719 719 719
Total borrowings 25,664 14,161 2,711 1,611 511
Other liabilities 93 287 287 287 287
Total liabilities 39,937 35,429 14,570 15,696 17,894
Gross block 16,622 18,239 6,239 6,739 7,879
Less: Acc. depreciation -4,572 -4,976 -1,541 -2,048 -2,641
Net block 12,050 13,264 4,699 4,692 5,239
CWIP 3,523 2,414 562 607 709
Others 20,046 16,919 16 16 16
Investments 0 1 4430 4430 4430
Current assets 18,921 15,378 11,323 12,301 15,429
Inventories 4,799 4,423 1,797 1,974 2,564
Debtors 5,384 4,832 3,618 3,937 5,016
Cash and bank balances 2,597 1,657 2,942 3,422 4,881
Other current assets 1,597 1,872 374 374 374
Loans & Advances 4,543 2,592 2,592 2,592 2,592
Current liabilities 11,449 11,147 6,040 5,930 7,509
Provisions 3,257 1,399 420 420 420
Net current assets 4,216 2,831 4,863 5,951 7,500
Others 101 0 0 0 0
Total Assets 39,937 35,429 14,570 15,695 17,893
Per share data Year ended 31 Mar CY11 CY12 FY14 FY15e FY16e
No.of Shares (Mn) 58 59 59 59 59
BVPS (INR) 235 345 185 222 278
CEPS (INR) 52 71 26 46 66
DPS (INR) 2 2 591 - -
Source: Company, Antique
* Company had paid high dividend due to payment from MylanYear ending changed to March from FY14. FY14 is a 15-month period.
Revenue Mix (INRm) Year ended 31 Mar FY13 FY14 FY15e FY16e
Generic 3,560 4,218 5,490 8,792
Branded 2,180 2,736 3,283 3,940
Institutional 3,520 4,446 5,045 5,219
Total 9,260 11,400 13,818 17,951
Cash flow statement (INRm) Year ended 31 Mar CY11 CY12 FY14 FY15e FY16e
Net profit 1976 3061 946 2225 3298
Depn and w/o 1043 1095 565 507 593
Change in working cap -5354 -445 748 607 90
Others 1933 8670 0 0 0
CF from operations (a) 6,481 1,344 763 2,126 3,801
Capital expenditure 6,720 508 (13,853) 545 1,243
Chg in investments and others (18) 1 4,430 0 0
CF from investing (b) (6,565) (8,065) 46,714 (545) (1,243
Free cash flow (a+b) (83) (6,722) 47,478 1,581 2,559
Equity raised/(repaid) 1 2 0 0 0Debt 5,566 (11,504) (11,449) (1,100) (1,100
Dividend (incl. tax) 136 137 34,744 0 0
Others (6,446) 21,541 0 0 0
CF from financing (c) (1,017) 9,900 (46,193) (1,100) (1,100
Net chg in cash (a+b+c) (1,100) 3,179 1,284 481 1,459
Growth indicators (%) Year ended 31 Mar CY11 CY12 FY14 FY15e FY16e
Revenue 48.9 (8.6) (41.9) 3.0 29.9
EBITDA 49.4 9.7 (58.3) 27.4 42.5
PAT 62.2 54.9 (69.1) 135.1 48.2
AEPS 62.2 54.9 (69.1) 130.9 48.2
Valuation (x) Year ended 31 Mar CY11 CY12 FY14 FY15e FY16e
PE (X) 14.2 9.1 29.6 12.8 8.6
P/BV (X) 2.0 1.4 2.6 2.1 1.7
EV/EBITDA (X) 10.5 7.7 12.7 9.4 6.0
EV/Sales (X) 2.0 1.8 2.1 1.9 1.3
Dividend Yield (%) 0.4 0.4 106.0 -
Financial ratios Year ended 31 Mar CY11 CY12 FY14 FY15e FY16e
RoE 15.4 22.3 4.7 20.5 25.2
RoCE 9.2 9.5 4.3 12.8 17.7
Debt/Equity (x) 1.9 0.7 0.2 0.1 0.0EBIT/Interest (x) 2.0 2.2 1.5 10.6 49.6
Margins (%) Year ended 31 Mar CY11 CY12 FY14 FY15e FY16e
EBITDA 19.3 23.2 16.7 20.6 22.6
EBIT 15.2 18.5 12.4 16.9 19.3
APAT 7.8 13.3 7.1 16.1 18.4
Source: Company Antique

8/10/2019 AMP - 140704.pdf
http://slidepdf.com/reader/full/amp-140704pdf 23/27
T IQUE STOCK BROKING L IMITED 4 July 2014FROM THE RESEARCH DESK
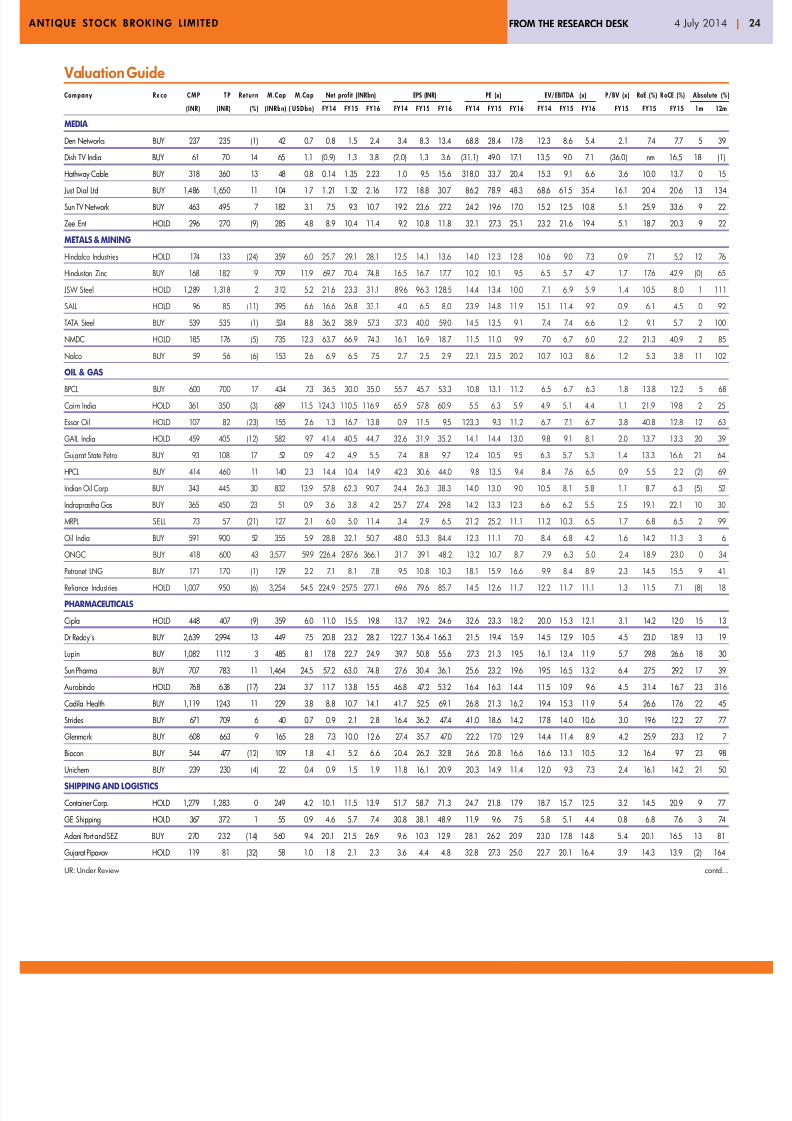
Valuation GuideCompany Reco C M P T P Return M.Cap M.Cap Net profit (INRbn) EPS (INR) PE (x) EV/EBITDA (x) P/BV (x) RoE (%) RoCE (%) Absolute (%
(INR) (INR) (%) ( INRbn) ( USDbn ) FY14 FY15 FY16 FY14 FY15 FY16 FY14 FY15 FY16 FY14 FY15 FY16 FY15 FY15 FY15 1m 12m
AUTOMOBILES
Ashok Leyland HOLD 36 32 (10) 95 1.6 (4.8) (1.5) 4.4 (1.8) (0.6) 1.6 (19.9) (62.3) 21.7 80.1 22.1 10.5 2.7 (7.8) 0.4 6 77
Bajaj Auto HOLD 2,300 2,156 (6) 666 11.1 32.4 36.6 41.2 112.0 126.5 142.4 20.5 18.2 16.2 15.1 13.8 12.2 5.8 32.5 45.7 17 22
Bosch HOLD 13,700 10,689 (22) 430 7.2 8.8 10.2 13.4 281.8 324.9 427.6 48.6 42.2 32.0 36.0 32.2 25.1 6.1 14.4 23.9 12 56
Eicher Motors BUY 8,583 12,039 40 233 3.9 7.4 11.3 17.1 273.0 416.3 633.5 31.4 20.6 13.5 20.8 13.8 9.4 6.4 31.0 35.2 19 139
Exide Industries HOLD 159 132 (17) 135 2.3 4.9 5.9 6.7 5.7 7.0 7.9 27.6 22.8 20.0 16.3 14.1 12.5 3.3 14.3 19.5 10 32
Hero MotoCorp HOLD 2,588 2,827 9 517 8.7 21.1 28.6 36.3 105.6 143.2 181.6 24.5 18.1 14.3 18.9 13.9 10.9 7.5 41.8 57.4 5 56
M&M BUY 1,236 1,316 6 761 12.7 38.5 40.5 49.2 58.6 61.7 74.9 21.1 20.0 16.5 14.5 12.6 10.0 4.0 20.0 24.5 0 26
Maruti Suzuki BUY 2,630 2,443 (7) 794 13.3 27.8 33.7 45.0 92.1 111.6 148.8 28.5 23.6 17.7 13.7 11.5 8.6 3.3 14.2 21.7 13 68
Tata Motors BUY 470 575 22 1,415 23.7 161.4 188.1 233.1 50.1 58.4 72.4 9.4 8.0 6.5 4.8 4.1 3.3 1.8 22.7 20.5 12 65
Balkrishna Industries Limited BUY 736 822 12 71 1.2 4.9 6.0 6.6 50.5 62.3 68.5 14.6 11.8 10.7 10.6 8.4 7.2 3.1 27.7 18.9 19 246
Ceat Limited BUY 661 597 (10) 24 0.4 2.8 3.4 3.6 78.1 94.5 99.5 8.5 7.0 6.6 5.2 4.7 4.6 1.7 25.6 25.8 53 537
Apollo Tyres Limited HOLD 212 212 0 107 1.8 9.6 11.2 11.9 19.0 22.2 23.5 11.1 9.5 9.0 6.2 5.5 5.4 1.8 20.6 29.5 15 252
Bharat Forge BUY 672 628 (7) 156 2.6 4.2 5.7 7.6 18.0 24.4 32.7 37.5 27.6 20.5 16.8 14.0 11.2 5.0 19.6 17.5 29 210
FMCG & RETAIL
Asian Paints HOLD 582 539 (7) 558 9.3 12.2 14.3 17.3 12.8 14.9 18.0 45.4 39.0 32.4 27.6 23.7 19.4 13.3 34.1 43.4 14 27
Colgate HOLD 1,608 1,338 (17) 219 3.7 4.8 5.3 6.1 35.0 39.1 44.6 46.0 41.1 36.1 34.2 29.3 24.2 33.3 81.2 102.1 14 22
Dabur India BUY 192 195 2 337 5.6 9.2 10.8 13.1 5.3 6.2 7.5 36.5 30.9 25.6 29.9 25.3 20.8 10.3 33.5 30.9 4 23
Radico Khaitan BUY 113 136 21 15 0.3 0.9 1.0 1.2 6.8 7.6 8.8 16.6 14.9 12.8 10.9 9.9 8.9 1.7 11.6 11.3 9 18
Godrej Consumer HOLD 807 789 (2) 275 4.6 7.6 9.0 10.7 22.9 26.3 31.6 35.2 30.7 25.6 24.6 21.2 17.6 6.2 20.2 20.4 1 (0
HUL HOLD 624 592 (5) 1,350 22.6 35.5 38.2 42.7 16.4 17.6 19.7 38.0 35.4 31.6 29.7 27.0 23.5 40.7 115.0 140.3 5 6
ITC BUY 331 397 20 2,635 44.1 87.9 102.1 122.1 11.0 12.8 15.3 30.0 25.8 21.6 21.5 18.4 15.2 8.8 33.9 43.2 (1) 2
Jyothy Labs BUY 180 240 33 33 0.5 1.1 1.7 1.9 6.0 9.6 10.4 30.0 18.7 17.2 23.9 19.2 13.9 3.2 16.9 7.6 (4) 5
Marico HOLD 249 232 (7) 161 2.7 5.2 5.3 6.2 8.1 8.1 9.7 30.9 30.6 25.8 21.8 19.8 16.3 8.7 28.6 30.0 2 26
Nestle India HOLD 4,998 4,430 (11) 482 8.1 11.2 11.4 14.2 117.6 117.9 147.7 42.5 42.4 33.8 25.1 25.0 20.3 16.2 38.2 39.5 4 (1
Titan Company BUY 361 420 16 320 5.4 7.6 9.2 12.4 8.6 10.4 14.0 42.1 34.8 25.8 33.6 27.7 19.5 9.9 28.5 32.0 13 60
TBZ BUY 209 258 24 14 0.2 0.5 0.8 1.1 8.3 12.2 17.2 25.3 17.1 12.1 14.8 11.6 7.9 2.7 16.0 10.9 16 17
United Spirits SELL 2,491 2,203 (12) 362 6.1 0.5 2.6 5.7 3.4 18.1 39.5 730.8 137.9 63.1 38.7 32.6 23.6 4.3 3.1 7.1 (12) (1
Tilaknagar Ind BUY 59 71 21 7 0.1 0.6 0.7 1.1 4.8 6.0 8.6 12.3 9.7 6.9 8.6 7.9 6.6 1.1 11.4 11.1 4 21
V- Mart BUY 390 366 (6) 7 0.1 0.3 0.4 0.5 14.0 21.8 28.7 27.8 17.9 13.6 13.8 9.5 7.4 3.3 18.7 25.7 27 188
INDUSTRIALS
ABB HOLD 1,137 706 (38) 241 4.0 1.8 2.9 4.3 8.3 13.6 20.2 136.2 83.5 56.4 51.9 39.0 30.1 8.5 10.1 15.8 21 87
BGR HOLD 221 125 (43) 16 0.3 1.5 1.7 2.0 20.2 23.9 27.8 11.0 9.2 7.9 7.1 5.9 5.2 1.1 12.7 11.4 4 76
BHEL BUY 261 315 21 639 10.7 32.3 34.4 38.6 13.2 14.0 15.8 19.8 18.6 16.6 11.5 11.8 8.7 1.8 9.9 10.1 1 46
Crompton Greaves BUY 205 203 (1) 129 2.2 2.4 6.0 7.6 3.9 9.5 12.0 52.8 21.6 17.1 21.6 12.8 10.2 2.6 11.8 11.3 4 127
Cummins India BUY 687 811 18 191 3.2 6.2 7.2 9.0 22.3 26.0 32.5 30.8 26.4 21.2 27.1 24.1 19.0 6.9 25.0 25.5 5 55
Havells India HOLD 1,193 1,043 (13) 149 2.5 4.5 6.2 7.4 35.7 49.5 58.9 33.4 24.1 20.3 22.6 22.7 22.1 7.3 33.2 32.3 13 64
Larsen & Toubro BUY 1,752 1,810 3 1,626 27.2 45.7 55.3 68.8 49.3 59.6 74.2 35.6 29.4 23.6 25.5 21.8 18.3 4.3 14.1 14.2 6 89
Siemens BUY 988 892 (10) 352 5.9 5.1 7.7 10.5 14.2 21.5 29.5 69.6 45.9 33.5 36.4 25.2 18.2 7.6 16.5 23.9 5 82
KEC HOLD 132 90 (32) 34 0.6 0.7 1.7 2.3 3.3 6.5 9.0 40.1 20.5 14.7 10.3 8.0 6.7 2.6 12.8 17.1 12 312
Voltas BUY 218 242 11 72 1.2 2.2 3.2 4.5 6.8 9.7 13.4 32.2 22.5 16.2 27.2 20.1 14.0 3.6 16.1 14.7 9 175
INFORMATION TECHNOLOGY
HCL Tech HOLD 1,466 1500 2 1,026 17.2 60.1 69.2 77.7 85.7 98.6 110.6 17.1 14.9 13.3 11.1 9.4 8.0 4.0 30.3 29.2 9 91
Hexaware Tech SELL 152 125 (18) 46 0.8 3.8 3.5 4.1 12.8 11.8 13.8 11.9 12.8 11.0 7.6 8.1 6.9 2.9 22.9 22.6 7 74
Infosys Ltd. BUY 3,211 3,900 21 1,844 30.9 108.7 120.9 140.5 189.8 211.1 245.2 16.9 15.2 13.1 11.6 9.8 8.1 3.3 23.4 22.9 6 34
KPIT BUY 170 210 23 33 0.6 2.5 3.0 3.6 13.2 15.9 19.1 12.9 10.7 8.9 8.1 6.8 5.3 2.0 19.1 24.5 5 42
MphasiS BUY 426 510 20 89 1.5 3.5 8.2 9.7 14.7 38.8 46.1 29.0 11.0 9.2 18.9 8.1 6.8 1.6 15.4 12.1 1 15
Persistent Sys BUY 1,087 1,400 29 43 0.7 2.5 3.2 4.0 62.3 80.2 98.9 17.4 13.5 11.0 10.1 7.9 6.4 3.0 21.9 26.8 3 125
TCS BUY 2,418 2,550 5 4,736 79.3 189.9 220.9 259.0 97.0 112.9 132.3 24.9 21.4 18.3 18.3 15.8 13.3 6.6 30.9 36.6 14 62
Tech Mahindra BUY 2,113 2,350 11 495 8.3 25.8 31.9 37.2 110.6 136.7 159.2 19.1 15.5 13.3 11.5 9.5 8.2 4.2 30.7 35.3 11 112
Wipro HOLD 556 585 5 1,371 22.9 78.4 92.0 103.1 31.8 37.4 41.9 17.5 14.9 13.3 13.5 10.9 9.5 3.3 22.3 24.4 12 62
UR: Under Review contd.
8/10/2019 AMP - 140704.pdf
http://slidepdf.com/reader/full/amp-140704pdf 24/27
T IQUE STOCK BROKING L IMITED 4 July 2014FROM THE RESEARCH DESK
Valuation GuideCompany Reco C M P T P Return M.Cap M.Cap Net profit (INRbn) EPS (INR) PE (x) EV/EBITDA (x) P/BV (x) RoE (%) RoCE (%) Absolute (%
(INR) (INR) (%) ( INRbn) ( USDbn ) FY14 FY15 FY16 FY14 FY15 FY16 FY14 FY15 FY16 FY14 FY15 FY16 FY15 FY15 FY15 1m 12m
MEDIA
Den Networks BUY 237 235 (1) 42 0.7 0.8 1.5 2.4 3.4 8.3 13.4 68.8 28.4 17.8 12.3 8.6 5.4 2.1 7.4 7.7 5 39
Dish TV India BUY 61 70 14 65 1.1 (0.9) 1.3 3.8 (2.0) 1.3 3.6 (31.1) 49.0 17.1 13.5 9.0 7.1 (36.0) nm 16.5 18 (1
Hathway Cable BUY 318 360 13 48 0.8 0.14 1.35 2.23 1.0 9.5 15.6 318.0 33.7 20.4 15.3 9.1 6.6 3.6 10.0 13.7 0 15
Just Dial Ltd BUY 1,486 1,650 11 104 1.7 1.21 1.32 2.16 17.2 18.8 30.7 86.2 78.9 48.3 68.6 61.5 35.4 16.1 20.4 20.6 13 134
Sun TV Network BUY 463 495 7 182 3.1 7.5 9.3 10.7 19.2 23.6 27.2 24.2 19.6 17.0 15.2 12.5 10.8 5.1 25.9 33.6 9 22
Zee Ent HOLD 296 270 (9) 285 4.8 8.9 10.4 11.4 9.2 10.8 11.8 32.1 27.3 25.1 23.2 21.6 19.4 5.1 18.7 20.3 9 22
METALS & MINING
Hindalco Industries HOLD 174 133 (24) 359 6.0 25.7 29.1 28.1 12.5 14.1 13.6 14.0 12.3 12.8 10.6 9.0 7.3 0.9 7.1 5.2 12 76
Hindustan Zinc BUY 168 182 9 709 11.9 69.7 70.4 74.8 16.5 16.7 17.7 10.2 10.1 9.5 6.5 5.7 4.7 1.7 17.6 42.9 (0) 65
JSW Steel HOLD 1,289 1,318 2 312 5.2 21.6 23.3 31.1 89.6 96.3 128.5 14.4 13.4 10.0 7.1 6.9 5.9 1.4 10.5 8.0 1 11
SAIL HOLD 96 85 (11) 395 6.6 16.6 26.8 33.1 4.0 6.5 8.0 23.9 14.8 11.9 15.1 11.4 9.2 0.9 6.1 4.5 0 92
TATA Steel BUY 539 535 (1) 524 8.8 36.2 38.9 57.3 37.3 40.0 59.0 14.5 13.5 9.1 7.4 7.4 6.6 1.2 9.1 5.7 2 100
NMDC HOLD 185 176 (5) 735 12.3 63.7 66.9 74.3 16.1 16.9 18.7 11.5 11.0 9.9 7.0 6.7 6.0 2.2 21.3 40.9 2 85
Nalco BUY 59 56 (6) 153 2.6 6.9 6.5 7.5 2.7 2.5 2.9 22.1 23.5 20.2 10.7 10.3 8.6 1.2 5.3 3.8 11 102
OIL & GAS
BPCL BUY 600 700 17 434 7.3 36.5 30.0 35.0 55.7 45.7 53.3 10.8 13.1 11.2 6.5 6.7 6.3 1.8 13.8 12.2 5 68
Cairn India HOLD 361 350 (3) 689 11.5 124.3 110.5 116.9 65.9 57.8 60.9 5.5 6.3 5.9 4.9 5.1 4.4 1.1 21.9 19.8 2 25
Essar Oil HOLD 107 82 (23) 155 2.6 1.3 16.7 13.8 0.9 11.5 9.5 123.3 9.3 11.2 6.7 7.1 6.7 3.8 40.8 12.8 12 63
GAIL India HOLD 459 405 (12) 582 9.7 41.4 40.5 44.7 32.6 31.9 35.2 14.1 14.4 13.0 9.8 9.1 8.1 2.0 13.7 13.3 20 39
Gujarat State Petro BUY 93 108 17 52 0.9 4.2 4.9 5.5 7.4 8.8 9.7 12.4 10.5 9.5 6.3 5.7 5.3 1.4 13.3 16.6 21 64
HPCL BUY 414 460 11 140 2.3 14.4 10.4 14.9 42.3 30.6 44.0 9.8 13.5 9.4 8.4 7.6 6.5 0.9 5.5 2.2 (2) 69
Indian Oil Corp BUY 343 445 30 832 13.9 57.8 62.3 90.7 24.4 26.3 38.3 14.0 13.0 9.0 10.5 8.1 5.8 1.1 8.7 6.3 (5) 52
Indraprastha Gas BUY 365 450 23 51 0.9 3.6 3.8 4.2 25.7 27.4 29.8 14.2 13.3 12.3 6.6 6.2 5.5 2.5 19.1 22.1 10 30
MRPL SELL 73 57 (21) 127 2.1 6.0 5.0 11.4 3.4 2.9 6.5 21.2 25.2 11.1 11.2 10.3 6.5 1.7 6.8 6.5 2 99
Oil India BUY 591 900 52 355 5.9 28.8 32.1 50.7 48.0 53.3 84.4 12.3 11.1 7.0 8.4 6.8 4.2 1.6 14.2 11.3 3 6
ONGC BUY 418 600 43 3,577 59.9 226.4 287.6 366.1 31.7 39.1 48.2 13.2 10.7 8.7 7.9 6.3 5.0 2.4 18.9 23.0 0 34
Petronet LNG BUY 171 170 (1) 129 2.2 7.1 8.1 7.8 9.5 10.8 10.3 18.1 15.9 16.6 9.9 8.4 8.9 2.3 14.5 15.5 9 41
Reliance Industries HOLD 1,007 950 (6) 3,254 54.5 224.9 257.5 277.1 69.6 79.6 85.7 14.5 12.6 11.7 12.2 11.7 11.1 1.3 11.5 7.1 (8) 18
PHARMACEUTICALS
Cipla HOLD 448 407 (9) 359 6.0 11.0 15.5 19.8 13.7 19.2 24.6 32.6 23.3 18.2 20.0 15.3 12.1 3.1 14.2 12.0 15 13
Dr Reddy's BUY 2,639 2,994 13 449 7.5 20.8 23.2 28.2 122.7 136.4 166.3 21.5 19.4 15.9 14.5 12.9 10.5 4.5 23.0 18.9 13 19
Lupin BUY 1,082 1112 3 485 8.1 17.8 22.7 24.9 39.7 50.8 55.6 27.3 21.3 19.5 16.1 13.4 11.9 5.7 29.8 26.6 18 30
Sun Pharma BUY 707 783 11 1,464 24.5 57.2 63.0 74.8 27.6 30.4 36.1 25.6 23.2 19.6 19.5 16.5 13.2 6.4 27.5 29.2 17 39
Aurobindo HOLD 768 638 (17) 224 3.7 11.7 13.8 15.5 46.8 47.2 53.2 16.4 16.3 14.4 11.5 10.9 9.6 4.5 31.4 16.7 23 316
Cadila Health BUY 1,119 1243 11 229 3.8 8.8 10.7 14.1 41.7 52.5 69.1 26.8 21.3 16.2 19.4 15.3 11.9 5.4 26.6 17.6 22 45
Strides BUY 671 709 6 40 0.7 0.9 2.1 2.8 16.4 36.2 47.4 41.0 18.6 14.2 17.8 14.0 10.6 3.0 19.6 12.2 27 77
Glenmark BUY 608 663 9 165 2.8 7.3 10.0 12.6 27.4 35.7 47.0 22.2 17.0 12.9 14.4 11.4 8.9 4.2 25.9 23.3 12 7
Biocon BUY 544 477 (12) 109 1.8 4.1 5.2 6.6 20.4 26.2 32.8 26.6 20.8 16.6 16.6 13.1 10.5 3.2 16.4 9.7 23 98
Unichem BUY 239 230 (4) 22 0.4 0.9 1.5 1.9 11.8 16.1 20.9 20.3 14.9 11.4 12.0 9.3 7.3 2.4 16.1 14.2 21 50
SHIPPING AND LOGISTICS
Container Corp. HOLD 1,279 1,283 0 249 4.2 10.1 11.5 13.9 51.7 58.7 71.3 24.7 21.8 17.9 18.7 15.7 12.5 3.2 14.5 20.9 9 77
GE Shipping HOLD 367 372 1 55 0.9 4.6 5.7 7.4 30.8 38.1 48.9 11.9 9.6 7.5 5.8 5.1 4.4 0.8 6.8 7.6 3 74
Adani Port and SEZ BUY 270 232 (14) 560 9.4 20.1 21.5 26.9 9.6 10.3 12.9 28.1 26.2 20.9 23.0 17.8 14.8 5.4 20.1 16.5 13 81
Gujarat Pipavav HOLD 119 81 (32) 58 1.0 1.8 2.1 2.3 3.6 4.4 4.8 32.8 27.3 25.0 22.7 20.1 16.4 3.9 14.3 13.9 (2) 164
UR: Under Review contd.

8/10/2019 AMP - 140704.pdf
http://slidepdf.com/reader/full/amp-140704pdf 25/27
T IQUE STOCK BROKING L IMITED 4 July 2014FROM THE RESEARCH DESK
Company Reco C M P T P Return M.Cap M.Cap Net profit (INRbn) EPS (INR) PE (x) NNPA Ratio (%) P/AdjBV (x) RoE (%) RoA (%) Absolute (%
(INR) (INR) (%) ( INRbn) ( USDbn ) FY14 FY15 FY16 FY14 FY15 FY16 FY14 FY15 FY16 FY14 FY15 FY16 FY15 FY15 FY15 1m 12m
FINANCIALS
Axis Bank HOLD 1,926 2,200 14 908 15.2 62.2 71.4 81.6 132.3 151.9 173.7 14.6 12.7 11.1 0.4 0.5 - 2.1 17.2 1.7 1 51
Bank of Baroda BUY 876 1,007 15 376 6.3 45.4 50.6 58.9 105.4 117.5 136.8 8.3 7.5 6.4 1.5 1.8 1.6 1.1 13.3 0.7 1 61
Bank of India HOLD 304 268 (12) 195 3.3 27.3 34.1 38.7 42.4 53.0 60.2 7.2 5.7 5.0 3.2 3.2 3.1 0.8 10.8 0.6 (4) 38
Canara Bank HOLD 447 315 (30) 206 3.5 24.4 33.3 42.2 52.9 72.1 91.5 8.5 6.2 4.9 2.0 1.8 1.7 0.8 10.7 0.6 2 25
HDFC HOLD 1,008 904 (10) 1580 26.4 54.4 63.4 76.5 34.9 40.6 49.0 28.9 24.8 20.6 0.2 0.2 0.2 5.0 21.0 2.9 10 18
HDFC Bank BUY 837 780 (7) 2015 33.7 84.8 106.8 135.6 35.5 44.5 56.5 23.6 18.8 14.8 0.3 0.2 0.2 3.9 22.4 2.0 2 29
ICICI Bank BUY 1,454 1,575 8 1681 28.1 98.1 111.5 130.2 84.5 95.9 112.1 17.2 15.2 13.0 1.0 1.0 1.0 2.2 13.7 1.7 (0) 37
IndusInd Bank BUY 573 550 (4) 302 5.0 14.1 18.0 22.4 26.9 34.5 42.7 21.3 16.6 13.4 0.3 0.4 0.4 2.9 18.4 1.9 6 23
Kotak Mahindra HOLD 891 806 (10) 687 11.5 15.3 18.4 21.6 20.5 24.6 28.9 43.5 36.2 30.9 1.1 1.4 1.8 5.8 15.8 1.6 2 28
PNB HOLD 991 785 (21) 359 6.0 33.4 43.1 52.1 92.3 119.0 144.0 10.7 8.3 6.9 2.8 2.6 2.3 1.2 11.4 0.7 2 59
SBI BUY 2,696 3,045 13 2013 33.7 108.9 154.4 213.7 145.9 206.8 286.3 18.5 13.0 9.4 2.1 2.1 2.0 1.9 12.4 0.8 2 42
Union Bank HOLD 231 150 (35) 145 2.4 17.0 22.4 26.7 26.9 35.5 42.3 8.6 6.5 5.4 2.3 2.4 2.5 1.0 12.5 0.6 7 35
YES Bank BUY 563 653 16 233 3.9 16.2 18.3 21.1 44.9 50.7 58.4 12.5 11.1 9.6 0.0 0.0 0.0 2.3 23.1 1.5 (3) 21
Bajaj Auto Fin BUY 2,176 2,157 (1) 109 1.8 7.2 8.6 10.3 144.5 172.9 207.0 15.1 12.6 10.5 0.2 0.3 0.3 2.3 19.9 3.2 3 53
Chola Invst & Fin. HOLD 406 301 (26) 58 1.0 3.3 4.5 5.4 25.4 31.3 37.9 16.0 13.0 10.7 0.8 1.1 1.3 2.2 19.0 1.9 18 69
Gruh Finance BUY 198 305 54 71 1.2 1.8 2.3 2.8 9.8 12.6 15.8 20.2 15.8 12.6 - - - 4.7 33.6 3.5 3 73
LIC Housing Fin BUY 324 310 (4) 164 2.7 13.1 16.5 20.3 26.0 32.7 40.3 12.5 9.9 8.0 0.1 0.1 0.1 1.9 20.2 1.6 (3) 35
M&M Fin. BUY 274 290 6 156 2.6 8.9 10.9 13.7 15.8 19.3 24.4 17.4 14.2 11.2 1.9 2.2 2.5 2.6 21.3 3.4 (10) 4
Manappuram HOLD 23 24 3 20 0.3 2.3 1.7 2.1 2.7 2.0 2.4 8.7 11.7 9.5 0.4 0.4 0.4 0.8 8.0 1.6 11 127
Muthoot Finance BUY 189 232 23 75 1.3 7.8 9.1 10.8 21.0 22.9 27.2 9.0 8.3 7.0 1.1 0.9 0.9 1.6 18.8 4.1 (7) 94
PFC HOLD 319 338 6 421 7.1 54.2 63.8 72.9 41.0 49.5 56.4 7.8 6.4 5.7 0.5 1.0 1.0 1.3 20.9 3.1 3 133Repco Home Fin. HOLD 473 391 (17) 29 0.5 1.1 1.5 1.8 17.7 24.4 29.6 26.7 19.3 16.0 0.7 0.7 0.7 3.4 19.5 2.6 7 85
REC HOLD 369 374 1 365 6.1 46.8 54.3 63.3 47.4 56.5 65.6 7.8 6.5 5.6 0.1 0.3 0.5 1.5 23.6 3.5 13 86
Shriram Transport HOLD 936 759 (19) 212 3.6 13.6 15.0 18.0 60.0 66.4 79.4 15.6 14.1 11.8 0.5 0.7 1.5 2.2 16.6 2.9 (2) 38
SKS Microfinance Hold 276 355 29 35 0.6 0.7 1.6 2.1 6.5 13.1 17.0 42.6 21.0 16.2 0.1 0.2 0.3 5.6 19.3 5.1 (8) 155
UR: Under Review
Valuation GuideCompany Reco C M P T P Return M.Cap M.Cap Net profit (INRbn) EPS (INR) PE (x) EV/EBITDA (x) P/BV (x) RoE (%) RoCE (%) Absolute (%
(INR) (INR) (%) ( INRbn) ( USDbn ) FY14 FY15 FY16 FY14 FY15 FY16 FY14 FY15 FY16 FY14 FY15 FY16 FY15 FY15 FY15 1m 12m
UTILITIES
CESC HOLD 714 501 (30) 89 1.5 6.5 6.7 7.1 39.2 42.6 64.8 18.2 16.7 11.0 11.6 8.7 6.5 1.6 9.6 7.2 18 108
NTPC HOLD 157 141 (10) 1,297 21.7 114.0 103.6 109.6 13.8 12.6 13.3 11.4 12.5 11.8 9.6 9.5 9.2 1.4 11.1 7.8 (4) 10
Power Grid BUY 141 152 8 735 12.3 45.0 50.9 57.6 8.6 9.7 11.0 16.3 14.4 12.8 11.8 10.9 9.9 1.9 13.2 7.5 12 30
PTC India BUY 97 125 29 29 0.5 3.6 2.7 3.7 8.5 5.9 8.7 11.4 16.3 11.1 3.4 5.1 1.1 0.3 6.7 10.2 11 105
Tata Power BUY 107 90 (16) 289 4.8 10.4 16.9 17.9 4.4 6.2 6.6 24.5 17.1 16.1 8.2 6.9 6.4 1.8 10.6 10.8 1 34
Coal India BUY 396 442 12 2,502 41.9 151.1 177.4 210.4 23.9 28.1 33.3 16.6 14.1 11.9 12.5 10.4 7.8 5.1 36.3 32.6 1 33
OTHERS
Supreme Industries BUY 550 553 1 70 1.2 2.9 3.6 4.3 22.8 28.1 33.5 24.1 19.5 16.4 12.7 10.6 9.3 4.2 31.5 31.9 7 65
Cera Sanitaryware BUY 1,297 863 (33) 16 0.3 0.5 0.7 0.8 41.6 55.1 66.4 31.2 23.5 19.5 18.6 14.4 12.0 5.8 27.5 32.2 (7) 163
Kajaria Ceramics BUY 545 417 (23) 41 0.7 1.2 1.7 2.2 15.6 21.3 27.8 34.9 25.5 19.6 15.5 12.3 9.6 6.7 26.4 30.2 (6) 133
Finolex Industries BUY 288 340 18 36 0.6 1.7 2.4 2.8 13.7 19.4 22.7 21.0 14.9 12.7 11.5 8.9 7.7 4.0 28.5 24.5 12 123
Astral Poly Technik Limited HOLD 732 490 (33) 41 0.7 0.8 1.1 1.6 14.0 20.4 28.8 52.1 35.8 25.4 26.1 20.9 16.0 9.9 31.3 37.2 22 22

8/10/2019 AMP - 140704.pdf
http://slidepdf.com/reader/full/amp-140704pdf 26/27
T IQUE STOCK BROKING L IMITED 4 July 2014FROM THE RESEARCH DESK
1 Jul 2 Jul 3 Jul 4 Jul 5 Jul 6 Jul
7 Jul 8 Jul 9 Jul 10 Jul 11 Jul 12 Jul 13 Jul
IndusInd Bank Cera Sanitaryware Unichem Lab
Infosys
14 Jul 15 Jul 16 Jul 17 Jul 18 Jul 19 Jul 20 Jul
Bajaj Finance Bajaj Auto
Kotak Mahindra Bank
21 Jul 22 Jul 23 Jul 24 Jul 25 Jul 26 Jul 27 Jul
Exide Ind Biocon Colgate Palmolive
M&M Financial
28 Jul 29 Jul 30 Jul 31 Jul 1 Aug 2 Aug 3 Aug
MphasiS
4 Aug 5 Aug 6 Aug 7 Aug 8 Aug 9 Aug 10Aug
11 Aug 12 Aug 13 Aug 14 Aug
Monday Tuesday Wednesday Thursday Friday Saturday Sun
Events Calendar Jul/Aug 2014
8/10/2019 AMP - 140704.pdf
http://slidepdf.com/reader/full/amp-140704pdf 27/27
T IQUE STOCK BROKING L IMITED 4 July 2014FROM THE RESEARCH DESK
Antique Stock Broking LimitedNirmal, 2nd Floor, Nariman Point, Mumbai 400 021.
Important Disclaimer:
This report is prepared and published on behalf of the research team of Antique Stock Broking Limited (ASBL). ASBL, its holding company and associate
companies are a full service, integrated investment banking, investment advisory and brokerage group. Our research analysts and sales persons provide
important inputs for our investment banking and allied activities. We have exercised due diligence in checking the correctness and authenticity of the
information contained herein, so far as it relates to current and historical information, but do not guarantee its accuracy or completeness. The opinions
expressed are our current opinions as of the date appearing in the material and may be subject to change from time to time without any notice. ASBL or any
persons connected with it do not solicit any action based on this report and do not accept any liability arising from the use of this document. The recipientsof this material should rely on their own judgment and take their own professional advice before acting on this information. The research reports are for
private circulation and are not to be construed as, an offer to sell or solicitation of an offer to buy any securities. Unless otherwise noted, all research reports
provide information of a general nature and do not address the circumstances of any particular investor. The distribution of this document in certain
jurisdictions may be restricted by law, and persons in whose possession this document comes, should inform themselves about and observe, any such
restrictions. ASBL its holding company and associate companies or any of its connected persons including its directors or employees shall not be in any way
responsible for any loss or damage that may arise to any person from any inadvertent error in the information contained, views and opinions expressed in
this publication. ASBL its holding company and associate companies, officers, directors, and employees may: (a) from time to time, have long or short position
in, and buy or sell the securities thereof, of company(ies) mentioned herein or (b) be engaged in any other transaction involving such securities and earn
brokerage or other compensation or act as advisor or lender/borrower to such company(ies) or have other potential conflict of interest with respect to any
recommendation and related information and opinions. ASBL, its holding company and associate companies, directors, officers or employees may, from time
to time, deal in the securities mentioned herein, as principal or agent. ASBL its holding company and associate companies may have acted as an Investmen
Advisor or Merchant Banker for some of the companies (or its connected persons) mentioned in this report. The research reports and all the information
opinions and conclusions contained in them are proprietary information of ASBL and the same may not be reproduced or distributed in whole or in partwithout express consent of ASBL. The analyst for this report certifies that all of the views expressed in this report accurately reflect his or her personal views
about the subject company or companies and its or their securities, and no part of his or her compensation was, is or will be, directly or indirectly related to
specific recommendations or views expressed in this report.
Analyst ownership in stock Yes for Strides Arcolab


![경제주평 위안화 국제화 평가와 시사점 140704 - HRIhri.co.kr/upload/publication/2014779558[1].pdf · 2016. 9. 23. · 5) swift(2014.2)에 따르면, 위안화 지급결제](https://img.dokumen.tips/doc/110x75/60e96dea4ce98f0e2e0751c1/eoe-oe-eoe-e-oe-140704-1pdf-2016-9.jpg)

![Finale 2002 - [Nossa ] - portal.secult.ce.gov.br · PDF fileNOSSA SENHORA De: Roberto Carlos Arr.: Marcelo A. Vitor & & & & & & & & & & &?????](https://img.dokumen.tips/doc/110x75/5a9593b47f8b9a8b5d8d0e58/finale-2002-nossa-portalsecultcegovbr-senhora-de-roberto-carlos-arr.jpg)


![Finale 2006 - [ ] - secult.ce.gov.br · PDF fileLAMENTOS De: Pixinguinha Arr:. Manoel Ferreira Lima & & & & & & & & & & & & & & &????? bb # # # # # # bb bb bb bb 10](https://img.dokumen.tips/doc/110x75/5a7991ed7f8b9a197e8cdd8a/finale-2006-secultcegovbr-lamentos-de-pixinguinha-arr-manoel-ferreira.jpg)