Embed Size (px)
Citation preview
Amoral Familism, Social Capital, or Trust? The Behavioral
Foundations of the Italian North-South Divide
Maria Bigoni
⇤
Stefania Bortolotti
†
Marco Casari
‡
University of Bologna
Diego Gambetta
§
European University Institute & Nu�eld College, University of Oxford
Francesca Pancotto
¶
University of Modena and Reggio Emilia
July 31, 2014
Abstract
We present the first lab-in-the field experimental study of the North-South divide in Italy. Usinga representative sample of the population, we measure whether regional di↵erences in the abilityto cooperate emerge even when ruling out confounding factors due to geography, institutions, andcriminal intrusion. We find that people in the North achieve higher levels of cooperation than in theSouth, and show that this behavioral gap cannot be accounted for by tolerance for risk, proxies ofsocial capital, and ‘amoral familism.’ Northern and Southern citizens react di↵erently to the sameincentives. This evidence suggests that equalizing the structure of incentives would not completelyeliminate the North-South disparities, as they derive at least in part from di↵erences in social norms,which are slow to change.Keywords: Trust, social norms, experiments, Italy.JEL codes: C72, C93, Z13
1 Introduction
The divide between the Northern and the Southern Italian regions embodies a paradigmatic
puzzle of within-country di↵erences. Since the Country’s Unification in 1861, Italians have
been sharing the same institutions, language and dominant religion, yet the di↵erences have
⇤Bigoni: Department of Economics, University of Bologna, Piazza Scaravilli 2, 40126 Bologna, Italy;[email protected], Phone: +39 051 209 8122, Fax: +39 051 0544 522.
†Bortolotti: Department of Economics, University of Bologna, Piazza Scaravilli 2, 40126 Bologna, Italy; [email protected], Phone: +39 051 209 8135.
‡Casari (corresponding author): Department of Economics, University of Bologna, Piazza Scaravilli 2, 40126 Bologna,Italy; [email protected], Phone: +39 051 209 8662, Fax: +39051 209 8493.
§Gambetta: European University Institute, Badia Fiesolana - Via dei Roccettini 9, I-50014 San Domenico di Fiesole,Italy, [email protected].
¶Pancotto: Department of Communication and Economics, University of Modena and Reggio Emilia, Viale A. Allegri9, 42121 Reggio Emilia (RE) – Italy, [email protected], Phone: +39 0522 523 264.
1
persisted, manifesting themselves through every available socio-economic measure (Putnam
et al., 1993; Felice, 2014). The puzzle intensified after WW II, for while the North steadily
developed turning this part of the peninsula into an advanced industrial society on a par
with the rest of Western Europe, the South remained tenaciously behind, the gap getting
even wider.
Despite the relentless institutional e↵ort and the vast economic resources which were spent
trying to promote their development, the Southern regions remain Italy’s major economic
burden. In comparison with the North, the South has a lower per-capita GDP (13,704 vs.
23,837 Euros), a higher unemployment rate (12.6% vs. 5.3%), more homicides (1.95 vs. 0.75
out of 100,000), a higher child mortality rate (0.41% vs. 0.29%), and a lower rate of waste
collection sorted for recycling (24% vs. 51%).1 Much scholarly attention has been devoted,
for well over a century, to what in Italy is known as La Questione Meridionale (Jacini, 1884;
Salvemini, 1955). A core issue traversing the Questione has been whether disparities in
performance across regions originate from di↵erences in incentives or from di↵erences in how
people react to similar incentives.
Traditional explanations have focused on incentives, which are a↵ected by geographical
and structural problems (e.g., distance from Northern Europe, lack of proper roads), inef-
ficient land property institutions (e.g., latifundia; see Franchetti and Sonnino, 1877), rent-
seeking informal institutions (e.g., political patronage, the mafia), and by counterproductive
economic policies, which destroyed the motivations to work hard, invest and innovate. In
contrast, other approaches have stressed that people can react di↵erently to similar incen-
tives, because of di↵erent preferences, expectations, and norms (Ichino and Maggi, 2000).
Two influential contributions along this line have been proposed by Edward Banfield’s The
moral basis of a backward society, and by Robert Putnam’s Making democracy work, and
have inspired countless studies. Although they stress di↵erent mechanisms, both scholars
share the view that the ability to cooperate is at the basis of socio-economic development.
Edward Banfield claimed that the origin of the North-South gap in Italy lies in moral flaws of
Southerners, whose only concern would be with their personal welfare and that of their fam-
ilies with utter disregard for anyone else (Banfield and Fasano, 1958). Putnam instead called
into question collective dispositions towards cooperation and good government. He posited
that these dispositions would originate in the regionally varying levels of social capital, which
in turn would relate to varying historical experiences (Putnam et al., 1993). The enduring
gap in development of the Southern regions was also the question which propelled the notion
of trust to gain systematic attention and attain the central role it has now achieved in the
social sciences (Gambetta, 1987). Amoral familism, social capital and trust, notions that
1The data source is the National Bureau of Statistics (Istat). The regions of the North are Piemonte, Valled’Aosta, Lombardia, Trentino-Alto Adige, Veneto, Friuli-Venezia Giulia, Liguria, Emilia-Romagna. The regions ofthe center are: Toscana, Umbria, Marche, Lazio. The regions of the South are Abruzzo, Molise, Campania,Puglia, Calabria, Sicilia, and Sardegna. Central regions are excluded from this comparison. GDP: year 2009,(http://sitis.istat.it/sitis/html/indexEng.htm); unemployment: 2009; culpable homicides per 100,000 inhabitants, 2007;mortality measures the number of deaths before 1 year out of those children born alive, 2006; waste collection, 2011,http://www.istat.it/en/archive/30344
2

have now entered the social sciences debates well beyond Italy’s borders, were “born in the
South.”2
Here we employ, for the first time, an experimental approach to study these conjectures,
and test whether a North-South di↵erential in the ability to cooperate emerges even if incen-
tives are held constant. We believe that this approach can usefully complement the range
of evidence scholars have used so far in several ways. First, relying merely on field data
one cannot be sure that, if incentives were equalized, people reaction to identical incentives
would continue to be di↵erent. Banfield’s work, for all its inspiring claims, was based on
an ethnography carried out in a single village in the South of Italy (Basilicata region). He
could obviously not have observed how the same villagers would have responded under more
favorable economic opportunities. Second, scholars who stress the role of social capital rely
on indirect measures – such as blood donations, voting turnout, and association density
(Putnam, 2000; Cartocci, 2007; Guiso et al., 2004; Buonanno et al., 2009) – whose link with
cooperative dispositions is of a strength which cannot be establish (Durlauf, 2002; Bowles and
Gintis, 2002). Finally, measures of trust derived from surveys, such as the Eurobarometer
or the World Value Survey, elicit opinions rather than actual behavior, and people have no
incentives to carefully understand the question or to tell the truth. For instance, they would
hardly state to be untrustworthy.3 Moreover, available data from surveys rely on rather vague
questions, whose interpretation depends on the external context. For example, stating in a
questionnaire that you “generally trust people” can reflect a preference for – or a norm to
– trust. However, trust can also depend on the level of legal enforcement: indeed, given the
same preferences and norms, if trust on average pays o↵ more, then people’ opinion will be
more favorable toward trust. It is furthermore impossible to establish which reference group
respondents have in mind when considering the ‘people’ in the question, they could be kin,
neighbors, compatriots and so on. Despite their scholarly success we do not know whether
the feet of these explanations for the North-South divide are made of iron or clay.
In this paper we present the results of a lab-in-the-field experiment aimed to uncover
di↵erences in preferences, expectations, and social norms across Italian regions through clean
behavioral measures of cooperation. Should no regional disparities emerge in response to
otherwise identical experimental conditions, the implication would be that the root of the
North-South divide lies in di↵erences in incentives. Instead, should regional disparities in
behavior emerge, the implication would be that preferences, expectations, and social norms
play a role. We define cooperation as a joint e↵ort which benefits the group at some cost to
the individual, and measure it through a Trust Game (Sutter and Kocher, 2007) and a Public
Good Game (Henrich et al., 2001; Herrmann et al., 2008). Having two measures serves as a
robustness check as it allows us to study whether regional di↵erences in cooperation levels
2Banfield’s book has 3,677 citations, Putnam’s book 27,668, and Gambetta’s book has 2,355 (Google Scholar on April10, 2014).
3More generally, in cross-cultural comparisons of trust and trustworthiness, the interpretation of survey answers relieson the assumption that the degrees of attention and aversion to lying do not correlate with the variable of interest. If lyingcorrelates with the variables of interest, the comparison is troublesome.
3

emerge within di↵erent games, played by di↵erent people. In addition, we study both Ban-
field’s amoral familism conjecture by measuring self-interest levels through a set of dictator
games, and social capital, in particular considering – both at city and individual level – the
proxies which are typically used to measure it. We relate all these measures to the behavioral
measures of trust and contributions to the public good in our experiment.
We run the experiment in two cities in the North and two in the South. We chose medium-
size cities, large enough to study cooperation among individuals beyond the immediate family
circle, but small enough to face a stable community, in which dispositions should be shared
and deep-rooted.4
A typical limitation of experiments has been the di�culty to run them on a representative
sample, which is extremely valuable when the aim is to obtain a measure of the preferences
and norms of a society. 5
There is indeed evidence that results obtained with college students cannot be readily
extended to a general sample (Bortolotti et al., 2013), and that age matters for sustaining
cooperative norms (Sutter and Kocher, 2007; Egas and Riedl, 2008). Cross-cultural experi-
ments with representative samples are rare (Buchan et al., 2009; Cappelen et al., 2010); the
present study is one of them. In each location, we recruited a sample balanced in terms of
age, sex, and occupation to reflect the composition of the national population.6 Having a
representative sample increases the comparability across locations and boosts the external
validity of the results. It further allows us to rule out that di↵erences emerging across loca-
tions depend on di↵erent socio-demographic characteristics of the samples, and improves the
generalizability of our findings.
The remainder of the paper is organized as follows. Section 2 describes the procedures used
to select the sample and the experimental locations and Section 3 details the experimental
design. Section 4 presents the main findings and Section 5 compares them with other existing
measures of the North-South gap. Section 6 discusses possible interpretations of our results.
4Our study relates to the literature on cross-cultural experiments. While most previous experiments were run acrossdi↵erent countries (Henrich et al., 2001; Herrmann et al., 2008; Buchan et al., 2009; Henrich et al., 2010), this paper is awithin-country study. Another notable exception is Lamba and Mace (2011), which studies whether the natural environmentcan a↵ect the level of cooperation in small scale societies in central India. Previous experiments based on cross-countryevidence have shown that cooperation co-varies with factors shared at society level, such as market integration, productiontechnology, religion, the quality of the rule of law, and the degree of globalization. Here we focus on regional di↵erences incooperation that emerge when holding these factors constant.
5While several experimental study employ a wide variety of specific subject pools beyond college students – rangingfrom employees (Bandiera et al., 2011; Bigoni et al., 2012) to public a↵air o�cials (Potters and Van Winden, 2000) andprisoners (Block and Gerety, 1995) – the use of a stratified sample to encompass a whole society remains an exception inthe literature (see Bortolotti et al., 2013 for a discussion). As the adoption of norms of cooperation is an emergent propertyand can depend on the composition of the population, civic norms cannot be reduced to the sum of the behavior of specificsub-samples. Thus recruiting a representative sample is extremely valuable given the objectives of our study.
6This stratification strategy and the sample size in our study are similar to the one used in the World Value Survey forItaly.
4

2 Participants in the study
The main aim of our experiment is to obtain a measure of deep-seated social norms of
cooperation among strangers, in di↵erent parts of Italy. The pursue of such a goal determined
our choices in terms of three crucial design features: the selection of the participant pool, of
the locations where to run the experiment, and of the type of tasks that participant faced.
This section will discuss the selection of participants and locations. The next section will
illustrate the experimental tasks.
Participant pools. A total of 618 participants were recruited among the general popu-
lation. The sample was representative of the Italian population in respect to age, sex, and
employment status, since these demographic characteristics could be important to identify
social norms in the society at large. It was stratified according to three categories of age
(18-39, 40-59, 60 and older), two of sex (male and female), and three of employment sta-
tus (employed; housewives and retired; others, including students and unemployed). For the
composition of the target sample, we referred to the 2009 statistics on the Italian population.7
Two professional companies – Metis-Ricerche and Demoskopea – were hired for the recruit-
ment of subjects.8 Table A-2 in Appendix summarizes the socio-demographic characteristics
of the actual sample.
To ensure that subjects shared the local norms or had at least a profound knowledge
of them, we added four additional restrictions. To be eligible for the study, subjects had
to: (i) be at least 18 years old; (ii) be born in the county; (iii) be resident in the county;
(iv) have a good knowledge of spoken and written Italian. These restrictions were explained
during the recruitment process and the experimenters double checked conditions (i) to (iii)
by looking at each participant’s ID before the experimental sessions. At the beginning of
each session, the experimenter made it public that all subjects in the room were born and
resident in the county (or at least in the region) in order to make this information common
knowledge. Among the 581 subjects who completed our questionnaire, about 92.7% of the
participants turned out to be at least second generation natives of the county, based on the
reported birthplace of their mother and father (i.e., at least one of their parents was born in
the county).9
A trade-o↵ emerged between the number of participants per location, and the number of
locations involved in the study. The need to recruit a large and representative sample of the
population, in each of the locations where the experiment would have taken place, induced us
7Inhabitants at 1st of January 2009. Age range: 18-39 years, 34.8%; 40-59 years, 34.6%; 60 and more, 31.6%.Sex: male, 48%; female 52%. Employment status: employed, 42%; housewives and retired, 37%; others 21%. Source:http://demo.istat.it/pop2009/index1.html
8 See the Appendix for further details on the recruitment process.9Due to technical problems, we lack personal information for 37 persons in the sample (24 from the first PGG session
in Faenza and 13 from two PGG sessions, May 25 and 28 in Ragusa).
5

to favor the former element over the latter and focus only on four Italian counties (‘Province’
in Italian),10 the choice of these counties, therefore, gained even more importance.
Experimental locations. We selected the experimental locations following rigorous cri-
teria and with three goals in mind: (i) to cover Italian counties both in the North and in
the South macro-areas; (ii) to maximize the di↵erence relative to social capital within each
macro-area; and (iii) to have medium-size cities. First, in order to cover both macro-areas,
we included two counties in the North and two in the South of Italy.11
The second selection criterion aimed at increasing the likelihood of sampling counties that
would di↵er in terms of trusting and cooperative behavior. To achieve this goal, we picked
the two counties in the North, and the two in the South, presenting the most extreme levels
of social capital. The literature on social capital widely adopts three proxies for Italy (e.g.
Putnam, 2000; Cartocci, 2007; Guiso et al., 2004; Buonanno et al., 2009): association density,
electoral participation, and and blood donations.12 To aggregate these multiple measures of
social capital into a single index, we adopted the following procedure. First, we separately
ranked all Italian counties according to each of the three dimensions, assigning position 1 to
the county with the highest value. To pick the county with the highest level of social capital we
adopted a minimax criterion: for each county we computed a “score” equal to the maximum
among the three rankings, than we selected the county with the lowest score. By contrast,
to pick the county with the lowest level of social capital we adopted a maximin criterion: for
each county we computed a “score” equal to the minimum among the three rankings, than
we selected the county with the highest score. The procedure was performed including all
Italian counties, divided into two groups: North and South. The Central counties are placed
in one of the two clusters.13 The county with the highest (lowest) social capital in the North
was Ravenna (Cuneo), while the county with the highest (lowest) social capital in the South
was Ragusa (Crotone).14
Finally, we considered the size of the city where the experiment would take place. Al-
though participants were recruited from the whole county, we aimed at cities that could be
compared in terms of size (between 50,000-100,000 inhabitants). Consider that the average
size of an Italian county capital is 160,428 inhabitants, a value that lowers to 94,824 when
excluding the five largest Italian cities (Roma, Milano, Torino, Palermo, Napoli). The corre-
sponding median populations are 82,367 and 72,329, respectively. The average municipality
in Italy is much smaller: 7,492 inhabitants.15 We avoided on purpose both extremely small
10As of December 2000, there were 103 counties in Italy; other 7 counties were introduced by the Italian Governmentbetween 2001 and 2011, which we did not include due to lack of data for one or more of the adopted selection criteria.
11We excluded the Island of Sardegna because of its geographical and historical peculiarities. North and South are definedaccording to the o�cial classification of the National Bureau of Statistics, Istat, see http://www.istat.it/it/archivio/6789.
12More details on these measures can be found in Section 5.13Marche, Umbria and Toscana to the Northern group and Lazio to the Southern group, with latitude as the yardstick
for the assignment.14The procedure is robust to excluding the counties of Central Italy.15Source: Istat, http://demo.istat.it/pop2010/index.html
6

towns and large metropolitan cities. As we aimed at studying interactions among non-kins,
very small cities could make di�cult to achieve the required anonymity among participants.
On the other hand, in large cities the population is more diverse and it has higher mobil-
ity, which would hinder the elicitation norms and preferences that are strictly specific to
a geographical area. After identifying the counties of interest, we focused on medium-size
cities. All the cities are provincial capitals except for Faenza. In particular, Faenza (56,992
inhabitants) was selected instead of Ravenna as the latter has more than 100,000 inhabi-
tants (155,997 at 2009).16 Thus, the four cities selected are: Cuneo, Faenza, Crotone, and
Ragusa.17
3 Experimental design
The study included two types of sessions: roughly half of the subjects participated in the
Public Good Game (PGG) session and half in the Trust Game (TG) session. In each session,
every participant faced a sequence of individual and group tasks (Table 1). Individual tasks
included a choice over lotteries – played in all sessions – and three modified Dictator Games
(DG) – played in TG sessions only. Group tasks included either a Public Good Game
or a Trust Game with the goal of measuring cooperation levels, in the form of voluntary
contributions to a group project or of trusting behavior. Below we will first present the
group tasks and then the individual tasks, although in the sessions the order was reversed.
Table 1: Sequence of tasks in each type of session
PGG sessions TG sessions
INDIVIDUAL TASKSChoice over Lotteries Risk preferences Risk preferencesThree Dictator Games – Concerns for equality and
e�ciency
GROUP TASKSPublic Good Game Cooperation (i.e.,
contributions)–
Trust Game – Cooperation (i.e., trustingbehavior)
Notes: PGG sessions included three variants of the Public Good Game: Standard, Punishment
and Threshold (in this order). TG sessions included two versions of the Trust Game: Baseline and
Coordination (more details on the games in Bigoni et al., 2013). Due to space constraints, only the
Standard version of the PGG and the Baseline version of the TG are included in this paper.
16Source. Istat, http://demo.istat.it/pop2010/index.html17The four Italian cities chosen as experimental locations are geographically distant both in terms of kilometers and
traveling times. Consider traveling by car from the northernmost town of Cuneo to the southernmost town of Ragusa.According to Google maps, it takes 4 hours and 25 minutes to drive from Cuneo to Faenza (458 km), and then anadditional 9 hours and 46 minutes to reach Crotone (919 km). From Crotone it takes 6 hours and 13 minutes to arrive inRagusa (425 km). For further information on the four selected counties, see Table A-1 in Appendix.
7

Group tasks. In the PGG, subjects faced 8 rounds of a voluntary contribution mechanism.
Subjects were randomly assigned to groups of N = 4, which were randomly changed in every
round according to a strangers matching protocol. In every round, a participant received an
endowment of w = 20 Monetary Units (MUs) and everybody had to simultaneously decide
how much of their endowment to invest in a group account, xi 2 {0, 6, 14, 20}, and how
much to keep in their private account (w-xi). Every MU invested in the group account was
doubled and shared equally among group members and individual earnings were determined
as follows:
⇡
1
i = w � xi + a
NX
j=1
xj
The marginal per capita return (MPCR) of the public good was a = 0.5. As the MPCR is
above 1/N and below 1, free-riding is a dominant strategy for rational self-interested subjects,
while group e�ciency is maximized when everyone contributes the whole endowment. After
each round, subjects could observe their contributions, the contributions of the other group
members, and individual earnings in their own group. Earnings cumulated from one period
to the next.
In the TG, subjects were divided into groups of three – one truster and two trustees –
and played 10 rounds of a modified investment game (Figure 1). We moved away from the
standard dyadic trust game and employed a game where trust is not a simple one-to-one
relationship, in order to better capture norms of generalized trust (Bigoni et al., 2013). The
truster decided first and could either trust or not. If the truster did not trust (Keep), everyone
in the group earned 20 MUs and the trustees had no choice to make. If the truster trusted
(Send) and at least one trustee reciprocated (Return), the truster earned 36 MUs, and each
trustee earned 30 MUs. When no trustee reciprocated (Breach, Breach), the truster earned
0 MUs and each trustee earned 48 MUs. This three-player trust game has two equilibria
in pure strategies: (Send, Return, Return) and (Keep, Breach, Breach), but only the latter
survives the elimination of weakly dominated strategies. At the end of each round, roles
were randomly re-assigned and new groups were formed according to a strangers protocol.18
Changing roles should facilitate learning and help spreading norms within the population.
Individual tasks. A choice over lotteries was used to elicit subjects’ risk preferences (Eckel
and Grossman, 2008). Subjects had to select one from a list of six lotteries; each lottery had
two possible outcomes (low or high) that occurred with equal probability. The first lottery
was the safest and yielded 17.5 Euros for sure, while the last lottery was the riskiest and
yielded 44.0 Euros with probability 1/2 and 1.0 Euro with probability 1/2 (see Figure A-3 in
the Appendix). Only two randomly selected subjects per session received a payment for this
18In each TG session there were two matching groups; participants in one matching group never met a participant fromanother matching group.
8
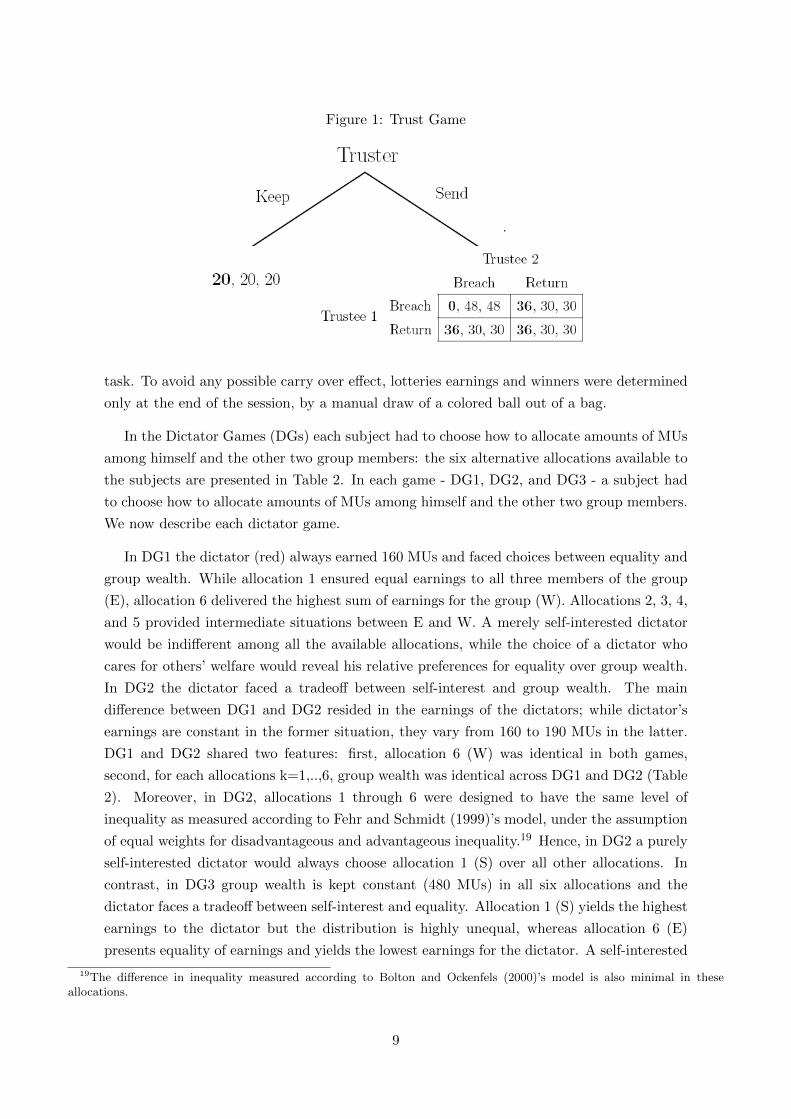
Figure 1: Trust Game
task. To avoid any possible carry over e↵ect, lotteries earnings and winners were determined
only at the end of the session, by a manual draw of a colored ball out of a bag.
In the Dictator Games (DGs) each subject had to choose how to allocate amounts of MUs
among himself and the other two group members: the six alternative allocations available to
the subjects are presented in Table 2. In each game - DG1, DG2, and DG3 - a subject had
to choose how to allocate amounts of MUs among himself and the other two group members.
We now describe each dictator game.
In DG1 the dictator (red) always earned 160 MUs and faced choices between equality and
group wealth. While allocation 1 ensured equal earnings to all three members of the group
(E), allocation 6 delivered the highest sum of earnings for the group (W). Allocations 2, 3, 4,
and 5 provided intermediate situations between E and W. A merely self-interested dictator
would be indi↵erent among all the available allocations, while the choice of a dictator who
cares for others’ welfare would reveal his relative preferences for equality over group wealth.
In DG2 the dictator faced a tradeo↵ between self-interest and group wealth. The main
di↵erence between DG1 and DG2 resided in the earnings of the dictators; while dictator’s
earnings are constant in the former situation, they vary from 160 to 190 MUs in the latter.
DG1 and DG2 shared two features: first, allocation 6 (W) was identical in both games,
second, for each allocations k=1,..,6, group wealth was identical across DG1 and DG2 (Table
2). Moreover, in DG2, allocations 1 through 6 were designed to have the same level of
inequality as measured according to Fehr and Schmidt (1999)’s model, under the assumption
of equal weights for disadvantageous and advantageous inequality.19 Hence, in DG2 a purely
self-interested dictator would always choose allocation 1 (S) over all other allocations. In
contrast, in DG3 group wealth is kept constant (480 MUs) in all six allocations and the
dictator faces a tradeo↵ between self-interest and equality. Allocation 1 (S) yields the highest
earnings to the dictator but the distribution is highly unequal, whereas allocation 6 (E)
presents equality of earnings and yields the lowest earnings for the dictator. A self-interested
19The di↵erence in inequality measured according to Bolton and Ockenfels (2000)’s model is also minimal in theseallocations.
9

Table 2: Dictator Games
DG1: Equality vs. E�ciencyAllocations
1 (E) 2 3 4 5 6 (W)You (red) 160 160 160 160 160 160Other participant (black) 160 154 148 142 136 130Other participant (white) 160 196 232 268 304 340E�ciency 480 510 540 570 600 630
DG2: Self-Interest vs. E�ciencyAllocations
1 (S) 2 3 4 5 6 (W)You (red) 190 184 178 172 166 160Other participant (black) 40 58 76 94 112 130Other participant (white) 250 268 286 304 322 340E�ciency 480 510 540 570 600 630
DG3: Self-Interest vs. EqualityAllocations
1 (S) 2 3 4 5 6 (E)You (red) 190 184 178 172 166 160Other participant (black) 40 64 88 112 136 160Other participant (white) 250 232 214 196 178 160E�ciency 480 480 480 480 480 480
dictator will choose allocation 1 and earn 190 MUs, while a dictator concerned with inequality
may choose allocation 6 and earn 160 MUs.
Each subject was asked to play as the dictator (red player) in DG1, DG2, and DG3; at the
end of the session, only one of the games was selected at random for payment. Importantly,
roles in the game were then randomly assigned to determine earnings.
Experimental procedures. All sessions were held in hotel conference rooms or educa-
tional centers located near to the city center and each location was devoid of any political
or religious connotation. Venues were easy to reach for the participants, i.e. accessible by
car and by public transport, and near or at well-known locations. The experiment was con-
ducted using the mobile Bologna Laboratory for Experiments in Social Sciences (BLESS),
which was moved from Bologna to the locations of the experiment by van. The laboratory
hardware and set-up were identical across all cities – 32 laptop computers connected through
a wireless network to a laptop server. Upon arrival, subjects were seated at a desk; visual
contact among participants was not possible, and no form of communication was allowed
during the experiment. All participants signed a consent form and a data release form. At
the beginning of each task, the relevant instructions were handed out and read aloud. The
experimenter who read the instructions was the same in all sessions and in all cities. Before
each task, subjects had to answer a computerized quiz to ensure correct understanding of the
game before each task, with the exception of the lottery. Our subject pool included a rather
large number of elderly and uneducated people: this called for a user friendly interface and
10

simplified tasks. We largely relied on graphical elements to make the task more intuitive;20
choices were made by simply touching the screen. Indeed, there was no need to type on the
keyboard or use the mouse. In an e↵ort to reduce the complexity of the decision tasks, we
limited the number of available options in each decision.
The study was conducted between March and October 2011. The number of participants
in a session ranged between 24 and 32, and everyone participated in only one session. Sessions
were run in the evening or on a Saturday in order to favor a wider participation. The exper-
iment was programmed with z-Tree (Fischbacher, 2007). At the end of the sessions, we ad-
ministrated a computerized questionnaire with measures of social capital, socio-demographic
characteristics, and other information. A PGG session lasted on average about 2 hours and
a TG session about 1 hour and 30 minutes. Subjects received 30 Euros gasoline vouchers
for showing up on time, plus a cash payment corresponding to the sum of their earnings
in each part. Payments were made privately right after the end of the experiment; average
per-capita earnings were 16.5 (17.5) Euros in cash in PGG (TG) sessions plus 30 Euros in
gasoline vouchers.21
4 A resilient cooperation divide
In this Section we document how patterns of cooperation di↵er within Italy. We report that
a North-South gap in behavior emerges also when holding incentives constant (Result 1).
This evidence suggests that people di↵er systematically in their interaction with fellow citi-
zens, and that the reasons of the Italian divide transcend the mere presence of di↵erences in
institutions, returns from cooperation, or mafia intrusion.
Result 1 There exists a North-South gap in cooperative behavior.
We find that in the North cooperation levels are higher than in the South. Support for
Result 1 is provided by Figure 2 and by a series of linear regressions in Tables 3 and 4.
Figure 2 reports county-average contributions in the PGG (Public Good Game) as a fraction
of the endowment, and county-average trust frequencies in the TG (Trust Game) across all
rounds and individuals. On both tasks, the most cooperative county is Cuneo (0.502 in TG
and 0.485 in PGG), and the least cooperative is Ragusa (0.346 in TG and 0.365 in PGG).
The dashed ellipses are drawn at a 95% confidence level after a bootstrapping procedure:
for every county, we randomly draw, with repetition, 10,000 pairs of observations from our
sample.
20see Figure A-2 in Appendix. In programming our interfaces, we took inspiration form the first wave ofexperiments conducted at the Internet Laboratory for Experimental Economics, iLEE (for further details see:http://www.econ.ku.dk/cee/ilee/description/ilee1/). Instead, Figure A-1 in the Appendix shows the appearance of thelab room.
21Reported payments comprise earnings from all tasks, including tasks not reported in this paper.
11

Figure 2: Cooperation levels across Italy
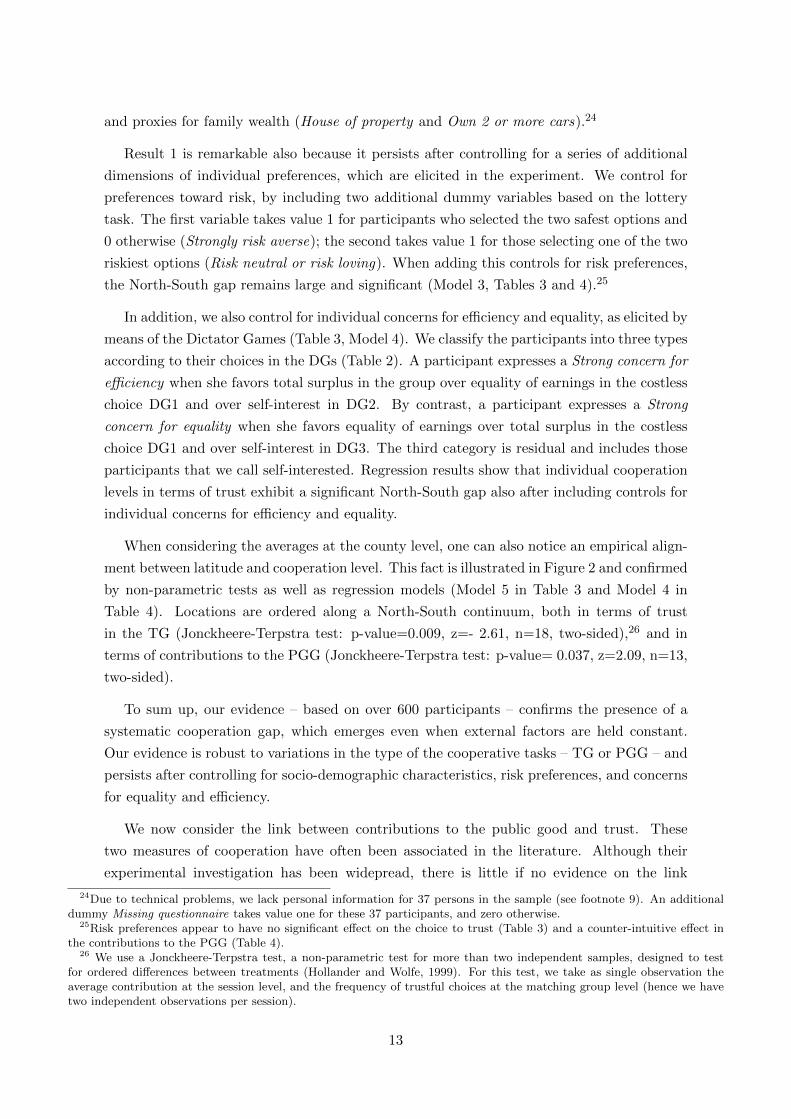
The regression models employ as dependent variable either the individual frequency of
trust in the TG (Table 3) or the average individual contribution level in the PGG (Table 4).
The dummy Northern Italy is the main regressor of interest and takes value 1 for Northern
regions and 0 otherwise; the positive and significant coe�cients suggest that participants
from the North cooperate significantly more than those from the South (Tables 3 and 4,
Model 1). All regressions in this Section account for possible session e↵ects by modelling
standard errors with robust estimators clustered at the session level.22
The divide in cooperation remains significant after controlling for task comprehension,
socio-demographic characteristics, and other individual traits. Elderly or uneducated peo-
ple could have had di�culties understanding the experimental tasks. To control whether
comprehension’s problem a↵ected our results, we included the dummy Task comprehension,
which takes value 1 for participants that had troubles answering a battery of control ques-
tions.23 Measuring and controlling for participants’ task comprehension is a key stress test
for lab-in-the-field experiments with a population of ordinary citizens. One obstacle when
venturing beyond a pool of college students is the reliability of the elicited responses. In
addition, we control for a series of socio-demographic characteristics based on self-reported
questionnaire data, which include dummy variables for gender, age (18-39, 40-59, 60 and
above), occupational status (Housewife or retired, Employed, and Student or unemployed),
22For the TG sessions, errors are clustered at the matching-group level.23The experiment did not proceed until everyone correctly answered all the control questions. To account both for
participants that were particularly slow in answering the control questions, and for those who made several mistakes, welabeled their task comprehension as “low” if they were in the last decile according either to their total answering time, orto their total number of mistakes. This measure is built at the county level and separating the TG and PGG treatments.
12
and proxies for family wealth (House of property and Own 2 or more cars).24
Result 1 is remarkable also because it persists after controlling for a series of additional
dimensions of individual preferences, which are elicited in the experiment. We control for
preferences toward risk, by including two additional dummy variables based on the lottery
task. The first variable takes value 1 for participants who selected the two safest options and
0 otherwise (Strongly risk averse); the second takes value 1 for those selecting one of the two
riskiest options (Risk neutral or risk loving). When adding this controls for risk preferences,
the North-South gap remains large and significant (Model 3, Tables 3 and 4).25
In addition, we also control for individual concerns for e�ciency and equality, as elicited by
means of the Dictator Games (Table 3, Model 4). We classify the participants into three types
according to their choices in the DGs (Table 2). A participant expresses a Strong concern for
e�ciency when she favors total surplus in the group over equality of earnings in the costless
choice DG1 and over self-interest in DG2. By contrast, a participant expresses a Strong
concern for equality when she favors equality of earnings over total surplus in the costless
choice DG1 and over self-interest in DG3. The third category is residual and includes those
participants that we call self-interested. Regression results show that individual cooperation
levels in terms of trust exhibit a significant North-South gap also after including controls for
individual concerns for e�ciency and equality.
When considering the averages at the county level, one can also notice an empirical align-
ment between latitude and cooperation level. This fact is illustrated in Figure 2 and confirmed
by non-parametric tests as well as regression models (Model 5 in Table 3 and Model 4 in
Table 4). Locations are ordered along a North-South continuum, both in terms of trust
in the TG (Jonckheere-Terpstra test: p-value=0.009, z=- 2.61, n=18, two-sided),26 and in
terms of contributions to the PGG (Jonckheere-Terpstra test: p-value= 0.037, z=2.09, n=13,
two-sided).
To sum up, our evidence – based on over 600 participants – confirms the presence of a
systematic cooperation gap, which emerges even when external factors are held constant.
Our evidence is robust to variations in the type of the cooperative tasks – TG or PGG – and
persists after controlling for socio-demographic characteristics, risk preferences, and concerns
for equality and e�ciency.
We now consider the link between contributions to the public good and trust. These
two measures of cooperation have often been associated in the literature. Although their
experimental investigation has been widepread, there is little if no evidence on the link
24Due to technical problems, we lack personal information for 37 persons in the sample (see footnote 9). An additionaldummy Missing questionnaire takes value one for these 37 participants, and zero otherwise.
25Risk preferences appear to have no significant e↵ect on the choice to trust (Table 3) and a counter-intuitive e↵ect inthe contributions to the PGG (Table 4).
26 We use a Jonckheere-Terpstra test, a non-parametric test for more than two independent samples, designed to testfor ordered di↵erences between treatments (Hollander and Wolfe, 1999). For this test, we take as single observation theaverage contribution at the session level, and the frequency of trustful choices at the matching group level (hence we havetwo independent observations per session).
13
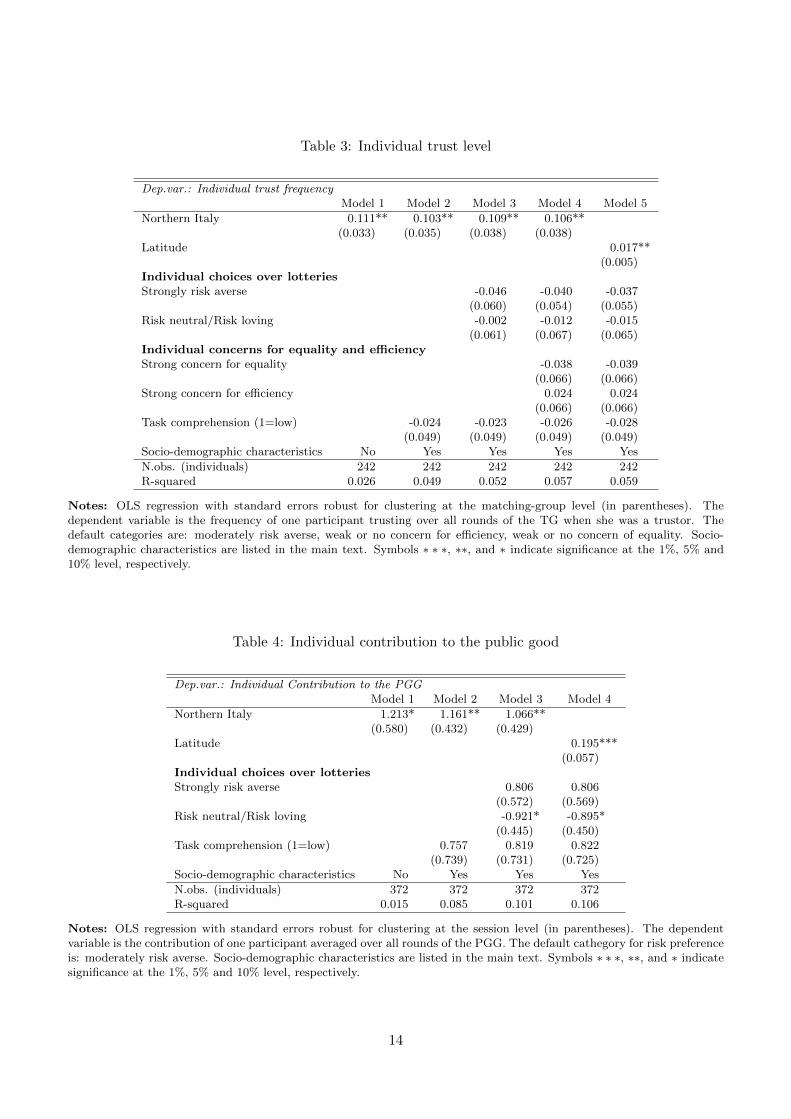
Table 3: Individual trust level
Dep.var.: Individual trust frequency
Model 1 Model 2 Model 3 Model 4 Model 5Northern Italy 0.111** 0.103** 0.109** 0.106**
(0.033) (0.035) (0.038) (0.038)Latitude 0.017**
(0.005)Individual choices over lotteries
Strongly risk averse -0.046 -0.040 -0.037(0.060) (0.054) (0.055)
Risk neutral/Risk loving -0.002 -0.012 -0.015(0.061) (0.067) (0.065)
Individual concerns for equality and e�ciency
Strong concern for equality -0.038 -0.039(0.066) (0.066)
Strong concern for e�ciency 0.024 0.024(0.066) (0.066)
Task comprehension (1=low) -0.024 -0.023 -0.026 -0.028(0.049) (0.049) (0.049) (0.049)
Socio-demographic characteristics No Yes Yes Yes YesN.obs. (individuals) 242 242 242 242 242R-squared 0.026 0.049 0.052 0.057 0.059
Notes: OLS regression with standard errors robust for clustering at the matching-group level (in parentheses). Thedependent variable is the frequency of one participant trusting over all rounds of the TG when she was a trustor. Thedefault categories are: moderately risk averse, weak or no concern for e�ciency, weak or no concern of equality. Socio-demographic characteristics are listed in the main text. Symbols ⇤ ⇤ ⇤, ⇤⇤, and ⇤ indicate significance at the 1%, 5% and10% level, respectively.
Table 4: Individual contribution to the public good
Dep.var.: Individual Contribution to the PGG
Model 1 Model 2 Model 3 Model 4Northern Italy 1.213* 1.161** 1.066**
(0.580) (0.432) (0.429)Latitude 0.195***
(0.057)Individual choices over lotteries
Strongly risk averse 0.806 0.806(0.572) (0.569)
Risk neutral/Risk loving -0.921* -0.895*(0.445) (0.450)
Task comprehension (1=low) 0.757 0.819 0.822(0.739) (0.731) (0.725)
Socio-demographic characteristics No Yes Yes YesN.obs. (individuals) 372 372 372 372R-squared 0.015 0.085 0.101 0.106
Notes: OLS regression with standard errors robust for clustering at the session level (in parentheses). The dependentvariable is the contribution of one participant averaged over all rounds of the PGG. The default cathegory for risk preferenceis: moderately risk averse. Socio-demographic characteristics are listed in the main text. Symbols ⇤ ⇤ ⇤, ⇤⇤, and ⇤ indicatesignificance at the 1%, 5% and 10% level, respectively.
14

between contributions in the PGG and trust in the TG across cultures. Here we provide
data of the correlation between these two measures.
Result 2 Our two independent measures of cooperative behavior – contributions to the public
good and trust – move in unison.
Support for Result 2 comes from Figure 2 and Table 5. We report that the ranking of
counties according to trust is identical to the ranking based on contributions. The higher
is trust in the TG, the higher are the levels of voluntary contribution in the PGG. TG and
PGG involved di↵erent participants – which makes the two measures fully independent of
each other – and tasks with di↵erent parameters and types of strategic interaction. Yet,
results are agreeing, which indicates the presence of a robust behavioral trait. This novel
evidence that trust and contributions vary in unison across locations suggests that these
phenomena share a common root, which we identify as the collective ability to cooperate.
Support for Result 2 is provided by linear regression analyses (Table 5). The dependent
variable is the contribution of each participant as averaged over all rounds of the PGG. The
independent variables are the county-average frequency of trust alone or with controls for
demographic characteristics. Results indicate that an increase by 10 percentage points in
the frequency of trust corresponds to a highly significant increase of the average contribution
by about 1.5 points (Model 1). In this study, the relation between trust and individual
contributions in the PGG remains positive and significant also after controlling for socio-
demographic characteristics and task comprehension (Model 2).27
Table 5: Individual contributions to the public good vs. trust.
Dep.var.: Individual Contribution to the PGG
Model 1 Model 2County-average trust frequency 15.320*** 14.507***
(3.421) (2.913)Task comprehension (1=low) 0.759
(0.719)Socio-demographic characteristics No YesN.obs. (individuals) 372 372R-squared 0.027 0.096
Notes: OLS regression with standard errors robust for clustering at the session level (in parentheses). Demographiccharacteristics are listed in the main text. The trust frequency comes from sessions run in the same county but with adistinct set of individuals. Socio-demographic characteristics are listed in the main text. Symbols ⇤ ⇤ ⇤, ⇤⇤, and ⇤ indicatesignificance at the 1%, 5% and 10% level, respectively.
Finally, we report some findings on trustworthiness. One could interpret trust levels as
a response to trustworthiness levels: trustworthiness can influence trust because trust pays
o↵ when a high fraction of the population is trustworthy. Being trustworthy also follows
a North-South ordering: the individual frequencies of trustworthy choices in the TG are
27 These e↵ects persist also in a regression where the dependent variable is the individual frequency of trust and thedependent variable is the county-level contribution to the PGG (robustness check in Appendix, see Table A-3).
15

34% in Cuneo, 33% in Faenza, 32% in Crotone, and 25% in Ragusa (Jonckheere-Terpstra
test: p-value=0.049, z=-1.97, n=18, two-sided). However, trustworthiness is not significantly
di↵erent from North to South according to an OLS regression (see Table 6). In Model 1, we
include the dummy Northern Italy as a regressor, and in Model 2 we add controls for the same
socio-demographic characteristics considered in Table 3. In Model 3, we also add controls
for participants’ preferences over risk, and in Model 4 we introduce controls for concerns for
equality and e�ciency. The average frequency of reciprocal actions is indeed higher in the
North, but the correlation does not seem to be significant.
Table 6: Individual trustworthiness level
Dep.var.: Individual trustworthiness frequency
Model 1 Model 2 Model 3 Model 4 Model 5Northern Italy 0.048 0.045 0.048 0.048
(0.048) (0.044) (0.047) (0.048)Latitude 0.008
(0.007)Individual choices over lotteries
Strongly risk averse 0.032 0.033 0.034(0.071) (0.074) (0.074)
Risk neutral/Risk loving 0.039 0.038 0.037(0.078) (0.081) (0.081)
Individual concerns for equality and e�ciency
Strong concern for equality 0.001 0.000(0.055) (0.054)
Strong concern for e�ciency 0.002 0.002(0.058) (0.058)
Task comprehension (1=low) 0.032 0.029 0.029 0.029(0.065) (0.070) (0.070) (0.070)
Socio-demographic characteristics No Yes Yes Yes YesN.obs. (individuals) 238 238 238 238 238R-squared 0.004 0.033 0.036 0.036 0.037
Notes: OLS regression with standard errors robust for clustering at the matching-group level (in parentheses). Thedependent variable is the frequency of one participant trustworthiness over all rounds of the TG when she was a trustee.The default categories are: moderately risk averse, weak or no concern for e�ciency, weak or no concern of equality. Socio-demographic characteristics are listed in the main text. Symbols ⇤ ⇤ ⇤, ⇤⇤, and ⇤ indicate significance at the 1%, 5% and10% level, respectively.
5 Amoral familism and social capital
We reported a substantial gap in behavior between societies in Northern and Southern Italy
in terms of their ability to achieve and sustain cooperative behaviors. We devoted great
attention to place all participants in front of identical situations, using the experimental
method to isolate subjects from confounding factors that influence the payo↵ structure. In
such a highly controlled context, institutions, geographical factors, mafia extractions, degree
of corruption and the e�ciency of the public administration do not vary across locations.
Our evidence hence suggests that the North-South gap in the ability to cooperate depends
also on how di↵erently people respond to the same incentives.
16
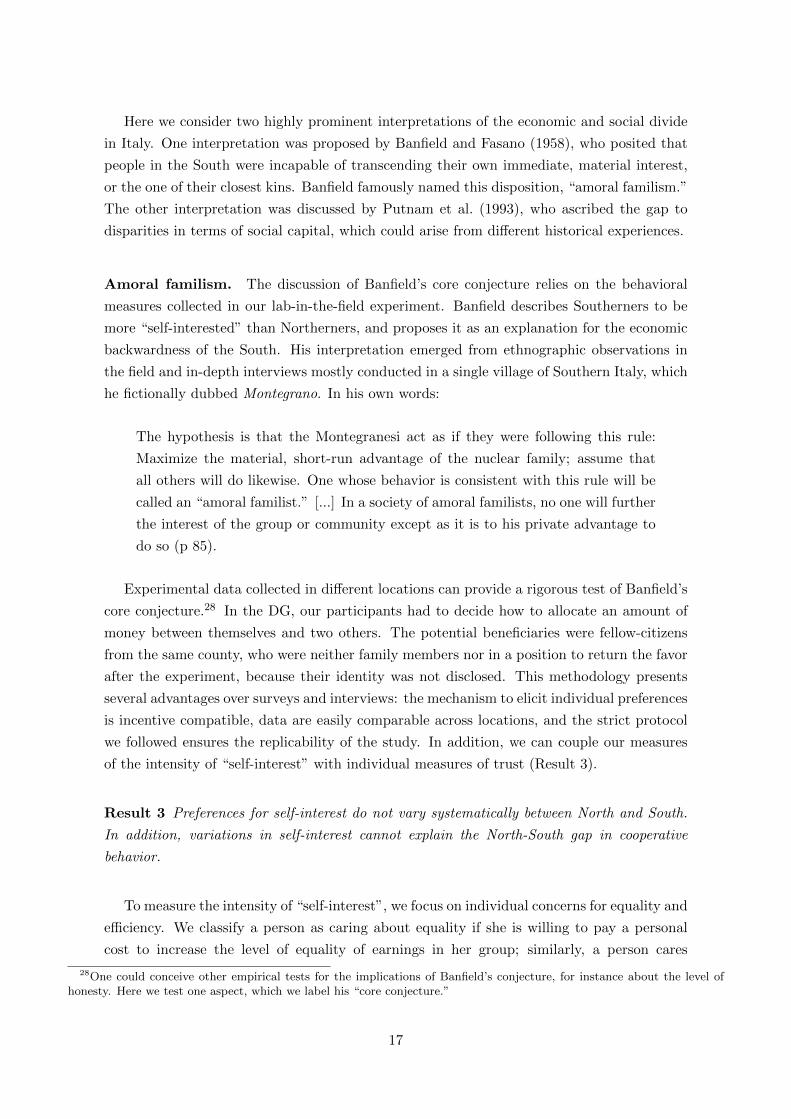
Here we consider two highly prominent interpretations of the economic and social divide
in Italy. One interpretation was proposed by Banfield and Fasano (1958), who posited that
people in the South were incapable of transcending their own immediate, material interest,
or the one of their closest kins. Banfield famously named this disposition, “amoral familism.”
The other interpretation was discussed by Putnam et al. (1993), who ascribed the gap to
disparities in terms of social capital, which could arise from di↵erent historical experiences.
Amoral familism. The discussion of Banfield’s core conjecture relies on the behavioral
measures collected in our lab-in-the-field experiment. Banfield describes Southerners to be
more “self-interested” than Northerners, and proposes it as an explanation for the economic
backwardness of the South. His interpretation emerged from ethnographic observations in
the field and in-depth interviews mostly conducted in a single village of Southern Italy, which
he fictionally dubbed Montegrano. In his own words:
The hypothesis is that the Montegranesi act as if they were following this rule:
Maximize the material, short-run advantage of the nuclear family; assume that
all others will do likewise. One whose behavior is consistent with this rule will be
called an “amoral familist.” [...] In a society of amoral familists, no one will further
the interest of the group or community except as it is to his private advantage to
do so (p 85).
Experimental data collected in di↵erent locations can provide a rigorous test of Banfield’s
core conjecture.28 In the DG, our participants had to decide how to allocate an amount of
money between themselves and two others. The potential beneficiaries were fellow-citizens
from the same county, who were neither family members nor in a position to return the favor
after the experiment, because their identity was not disclosed. This methodology presents
several advantages over surveys and interviews: the mechanism to elicit individual preferences
is incentive compatible, data are easily comparable across locations, and the strict protocol
we followed ensures the replicability of the study. In addition, we can couple our measures
of the intensity of “self-interest” with individual measures of trust (Result 3).
Result 3 Preferences for self-interest do not vary systematically between North and South.
In addition, variations in self-interest cannot explain the North-South gap in cooperative
behavior.
To measure the intensity of “self-interest”, we focus on individual concerns for equality and
e�ciency. We classify a person as caring about equality if she is willing to pay a personal
cost to increase the level of equality of earnings in her group; similarly, a person cares
28One could conceive other empirical tests for the implications of Banfield’s conjecture, for instance about the level ofhonesty. Here we test one aspect, which we label his “core conjecture.”
17

about e�ciency if she is willing to pay a cost in order to increase the total earnings in her
group.29 Both preferences can be viewed as departures from self-interest and serve as useful
measurements to compare behavior in di↵erent locations. We report similar preferences for
self-interest in the North and the in the South of Italy. In particular, about 26 percent of
participants can be classified as being self-interested or having weak concerns for others, both
in the North and in the South. When looking at county-averages, concerns for equality and
e�ciency, unlike cooperation levels, are not aligned along a North-South continuum.30
Support for Result 3 comes from Tables 3 and 7. The available evidence suggests that
cooperation does not critically depend on concerns for equality and e�ciency: for instance,
residents of Cuneo display the weakest concerns for e�ciency and yet they are the most co-
operative in our sample (Table 2). More precisely, individual trust levels do not significantly
correlate with individual concerns for equality and e�ciency, and the North-South gap per-
sists even after controlling for levels of self-interest (Model 4 in Table 3). Furthermore, an
Oaxaca decomposition shows that the North-South di↵erence in trust is not explained by
di↵erences in individual concerns for equality and e�ciency (Table 7).31 Results indicate
that the di↵erence in average trusting behavior between Southern and Northern residents is
equal to -0.111 (Prediction South minus Prediction North), and is statistically significant at
the 5% level. We can estimate how much of this di↵erence can be attributed to concerns for
equality and e�ciency (Table 7, Model 1). Overall, the two dummy variables Strong concern
for equality and Strong concern for e�ciency explain less than 1% of the North-South dif-
ference. Concerns for equality and e�ciency cannot significantly explain the observed gap
in terms of trusting behavior. In sum, this evidence leads to both a lack of corroboration
of Banfield’s core conjecture and a refinement of the main result regarding the di↵erences
between the North and the South of Italy in how people respond to the same incentives.
Before moving to the discussion about social capital, we comment on the possible role
of risk preferences. Cooperative tasks such as the PGG and TG expose subjects to the risk
of being cheated and exploited by others, which is absent in DGs, where the allocation of
money among group members only depends on the unilateral choice of the dictator. The
choices of dictators reflect individual preferences toward the well-being of others, but present
no elements of strategic interaction. One possible interpretation for the North-South gap
in the ability to cooperate is that Southern people are generally less willing to take risks.
Such an interpretation does not find support in our data. The evidence is articulated into
29 These measures should capture well the traits characterising Southerners according to Banfield, who writes that: “Theamoral familist will value gains accruing to the community only insofar as he and his are likely to share them. In fact,he will vote against measures which will help the community without helping him because, even though his position isunchanged in absolute terms, he considers himself worse o↵ if his neighbors’ position changes for the better. Thus it mayhappen that measures which are of decided general benefit will provoke a protest vote from those who feel that they havenot shared in them or have not shared in them su�ciently.” (Banfield and Fasano, 1958, pg. 101)
30 See Table A-5 in Appendix.31 The Oaxaca decomposition (Blinder, 1973; Oaxaca, 1973) is an econometric technique used to decompose a di↵erential
between two groups with respect to a variable of interest: in our case, trust in Northern and Southern Italy. This techniqueallows to single out what fraction of this di↵erential can be explained by the available control variable, and what fractioninstead remains unexplained.
18

Table 7: Variations in self-interest: an Oaxaca decomposition of the North-South gap in trust.
Dependent Variable: Individual trust in the TG
Model 1 Model 2Prediction South 0.364*** 0.364***
(0.029) (0.029)Prediction North 0.475*** 0.4750***
(0.032) (0.032)Di↵erence -0.111** -0.111**
(0.043) (0.043)Explained part
Strong concern for equality -0.001 - 0.001(0.003) (0.003)
Strong concern for e�ciency -0.000 -0.000(0.001) (0.001)
Strongly risk averse 0.006(0.009)
Risk neutral/Risk loving -0.003(0.008)
Total explained -0.001 0.002(0.003) (0.011)
Unexplained part
Total unexplained -0.110** -0.113**(0.037) (0.045)
N.obs. (individuals) 242 242
Notes: The dependent variable is the frequency of oneparticipant trusting over all rounds of the TG when shewas a trustor.Symbols ⇤⇤⇤, ⇤⇤, and ⇤ indicate significanceat the 1%, 5% and 10% level, respectively.
three points. First – unlike cooperation – risk preferences do not exhibit a North-South
ordering.32 Second, trust in TG and contributions in PGG are significantly explained by
the dummy Northern Italy also after controlling for individual risk preferences (Model 3 in
Tables 3 and 4). Third, an Oaxaca decomposition confirms that individual risk preferences
do not significantly account for the observed North-South di↵erences neither in trust nor in
contributions (Tables 7 and Table A-6 in Appendix). We conclude that the cooperation gap
is not driven by individual di↵erences in risk aversion.
Social capital. This study provides empirical evidence to shed light on the link between
proxies of social capital and cooperative behavior. Social capital is a wide-encompassing
concept (Nannicini et al., 2013). Here we focus on Putnam’s concept of social capital, which
entails a collective dimension of social interaction:
”[...] social capital refers to connections among individuals – social networks and
the norms of reciprocity and trustworthiness that arise from them [...] A society
of many virtuous but isolated individuals is not necessarily rich in social capital”
(Putnam et al., 1993, p.19).
32 See Table A-5 in Appendix.
19

One obstacle to surmount when using social capital is to find appropriate proxies. Studies
about Italy custumarily employ data about association density, electoral participation, and
blood donations, which are the proxies that we use in Result 4 (Putnam, 2000; Cartocci,
2007; Guiso et al., 2004; Buonanno et al., 2009).
Result 4 Our behavioral measures of cooperation do not correlate with any of the customary
proxies for social capital.
Support for Result 4 comes from comparing cooperation patterns in the experiment and
proxies of social capital both at the county level and at the individual level. Below there is
a description of the proxies for social capital at the county level.
Association density is defined as the number of associations per 100,000 inhabitants.
Associations can be cultural, leisure, artistic, sports, environmental, and any kind of nonprofit
associations with the exclusion of professional and religious associations (Putnam et al., 1993).
We used county-level data for year 2000 and considered registered voluntary associations
according to law 291/91 per 100,000 inhabitants (data from Buonanno et al., 2009), base on
Istat, ‘Primo censimento istituzioni nonprofit in Italia, 1999.’
Electoral participation considers the average voting turnout, expressed as the percentage
of eligible voters in all referenda held in Italy from 1946 to 1999 (Guiso et al., 2004 on original
data of the Italian Ministry of Internal A↵airs). Referenda are chosen in place of political
elections as they are considered a better proxy of the desire of civic participation, rather
than the regular elections for the National Parliament. The reasons are varied: voting at
referenda is not mandatory in Italy, the issues on the ballot in referenda are less related to
local interests, and referenda are immune from possible contamination from the so called
‘exchange vote.’ The exchange vote is an illegal practice according to which people may
receive a payment in order to cast a vote for a particular candidate (see for instance Putnam
et al., 1993).33
Finally, Blood donations are measured as the instances of donations per 1,000 inhabitants.
Our data are based on (Cartocci, 2007) and refer to year 2002.34
The above proxies of social capital seem to capture the North-South divide in a broad
sense. The average number of associations is 49 every 1000 inhabitants in the two counties
of the North and 27 in the two counties of the South; average referenda turnout is 87%
in the North and 71% in the South; the number of blood donations in a year is 59.5 per
1000 inhabitants versus 41.2. However, they do not correlate with the observed patterns of
cooperation in the PGG and TG at the county level. According to social capital proxies,
33 In our data, the counties of Belluno and Aosta have missing values for referenda turnout. We assigned to Belluno theaverage value for the Veneto region and to Aosta the average value of the Piemonte region.
34Data for Lazio and Puglia are available at the regional rather than county level and data for the counties of Goriziaand Trieste are the average value for the two counties.
20
Faenza scores first, followed by Ragusa, Cuneo, Crotone.35 Cuneo and Ragusa are the closest
counties in terms of social capital proxies and the most further apart in terms of ability to
cooperate in the experiment. Faenza unquestionably appears the best in social capital but
not in terms of cooperation levels. Within each macro area, the county with the lowest level
of social capital cooperated more than the one with the highest level.36
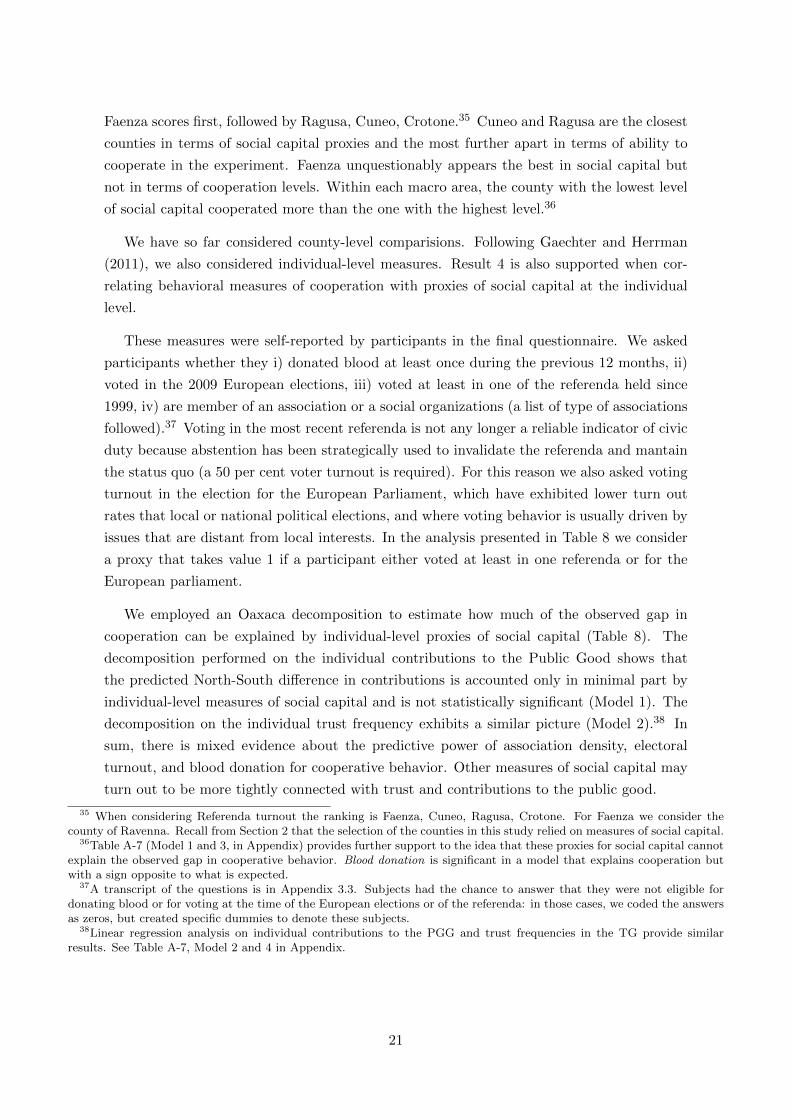
We have so far considered county-level comparisions. Following Gaechter and Herrman
(2011), we also considered individual-level measures. Result 4 is also supported when cor-
relating behavioral measures of cooperation with proxies of social capital at the individual
level.
These measures were self-reported by participants in the final questionnaire. We asked
participants whether they i) donated blood at least once during the previous 12 months, ii)
voted in the 2009 European elections, iii) voted at least in one of the referenda held since
1999, iv) are member of an association or a social organizations (a list of type of associations
followed).37 Voting in the most recent referenda is not any longer a reliable indicator of civic
duty because abstention has been strategically used to invalidate the referenda and mantain
the status quo (a 50 per cent voter turnout is required). For this reason we also asked voting
turnout in the election for the European Parliament, which have exhibited lower turn out
rates that local or national political elections, and where voting behavior is usually driven by
issues that are distant from local interests. In the analysis presented in Table 8 we consider
a proxy that takes value 1 if a participant either voted at least in one referenda or for the
European parliament.
We employed an Oaxaca decomposition to estimate how much of the observed gap in
cooperation can be explained by individual-level proxies of social capital (Table 8). The
decomposition performed on the individual contributions to the Public Good shows that
the predicted North-South di↵erence in contributions is accounted only in minimal part by
individual-level measures of social capital and is not statistically significant (Model 1). The
decomposition on the individual trust frequency exhibits a similar picture (Model 2).38 In
sum, there is mixed evidence about the predictive power of association density, electoral
turnout, and blood donation for cooperative behavior. Other measures of social capital may
turn out to be more tightly connected with trust and contributions to the public good.
35 When considering Referenda turnout the ranking is Faenza, Cuneo, Ragusa, Crotone. For Faenza we consider thecounty of Ravenna. Recall from Section 2 that the selection of the counties in this study relied on measures of social capital.
36Table A-7 (Model 1 and 3, in Appendix) provides further support to the idea that these proxies for social capital cannotexplain the observed gap in cooperative behavior. Blood donation is significant in a model that explains cooperation butwith a sign opposite to what is expected.
37A transcript of the questions is in Appendix 3.3. Subjects had the chance to answer that they were not eligible fordonating blood or for voting at the time of the European elections or of the referenda: in those cases, we coded the answersas zeros, but created specific dummies to denote these subjects.
38Linear regression analysis on individual contributions to the PGG and trust frequencies in the TG provide similarresults. See Table A-7, Model 2 and 4 in Appendix.
21
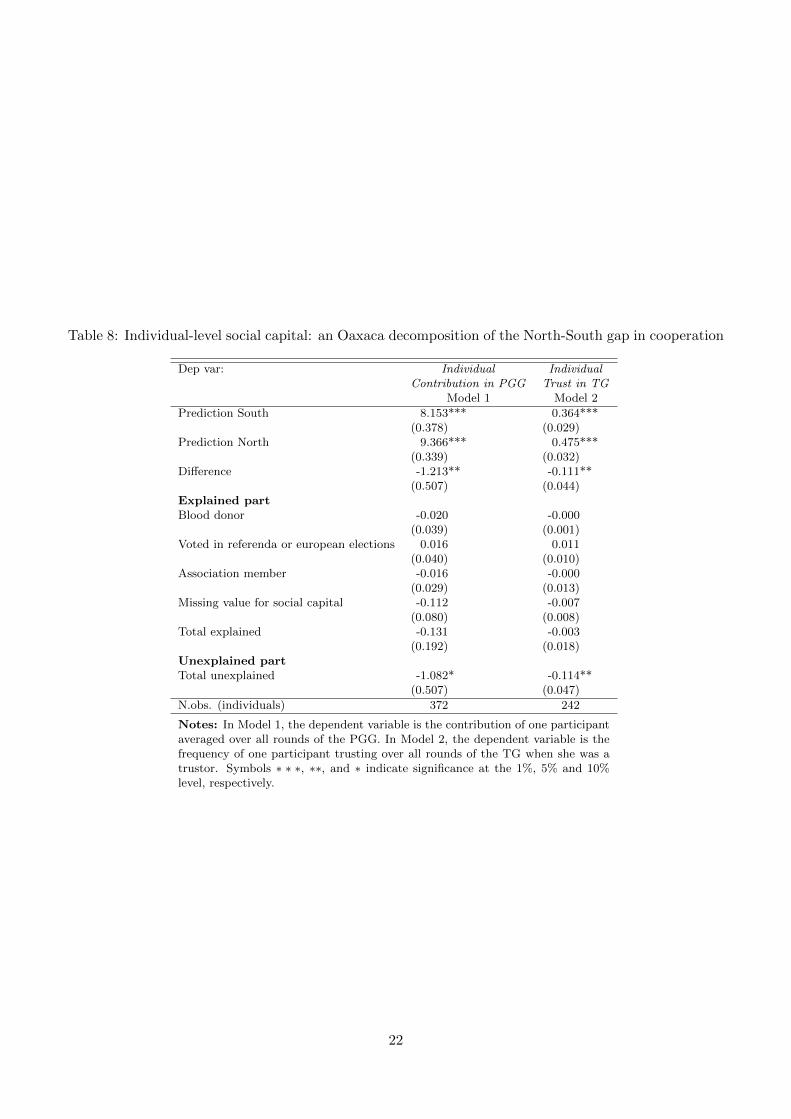
Table 8: Individual-level social capital: an Oaxaca decomposition of the North-South gap in cooperation
Dep var: Individual Individual
Contribution in PGG Trust in TG
Model 1 Model 2Prediction South 8.153*** 0.364***
(0.378) (0.029)Prediction North 9.366*** 0.475***
(0.339) (0.032)Di↵erence -1.213** -0.111**
(0.507) (0.044)Explained part
Blood donor -0.020 -0.000(0.039) (0.001)
Voted in referenda or european elections 0.016 0.011(0.040) (0.010)
Association member -0.016 -0.000(0.029) (0.013)
Missing value for social capital -0.112 -0.007(0.080) (0.008)
Total explained -0.131 -0.003(0.192) (0.018)
Unexplained part
Total unexplained -1.082* -0.114**(0.507) (0.047)
N.obs. (individuals) 372 242
Notes: In Model 1, the dependent variable is the contribution of one participantaveraged over all rounds of the PGG. In Model 2, the dependent variable is thefrequency of one participant trusting over all rounds of the TG when she was atrustor. Symbols ⇤ ⇤ ⇤, ⇤⇤, and ⇤ indicate significance at the 1%, 5% and 10%level, respectively.
22

6 Discussion
Does the Italian North-South divide originate from regional di↵erences in incentives or rather
in how di↵erently people respond to equal payo↵s? Our findings support the importance of
the latter factor.
In a lab-in-the-field experiment, we find that people in the North have a higher propensity
to cooperate than people in the South (Result 1). This evidence was obtained in a highly
controlled situation, which o↵ered participants in all locations identical opportunities to earn
money: in such situation both the institutions and the returns from cooperation were the
same. In this study, a representative sample of the Italian population was presented with
two classic social dilemmas, the trust game and the voluntary contribution to a public good,
which were played among people who live in the same location but that are not friends or
relatives.
Not only do we find that in the North people trust and contribute more than in the South;
we also observe that, in terms of ability to cooperate, the ranking of the four locations under
study is the same according to both our two empirical measures (Result 2). These findings
imply first, that the experimental measures of the ability to cooperate are reliable, in that
they are robust to changes in the design and do not depend on idiosyncratic characteristics of
the participants. Second, they indicate that we have captured a deep trait, which manifests
itself regardless of the specific social dilemma faced by the subjects. This result highlights
the resilience of the North-South gap in cooperative behavior.
We look at our data through the lenses of two well-known conjectures on the determinants
of the North-South divide, which were formulated by Banfield and Fasano (1958) and Putnam
et al. (1993). They suggest that preferences, expectations, and social norms are key factors
in explaining the di↵erences in outcome between the South and the North of Italy (Result
1) – that is, these conjectures go beyond the disparities in opportunities. In this sense, they
are broadly in line with our findings.
At a closer look, however, these conjectures miss the mark. Banfield and Fasano (1958)
suggests that Southerners display a higher level of self-interest than Northerners and framed
it as a morality issue. We elicit individual concerns towards equity and e�ciency through
incentivized tasks (Dictator Games) and find no systematic North-South divide along this
dimension. Moreover, data about self-interest at the individual level cannot explain the
observed gap in cooperative behavior (Result 3). Putnam et al. (1993) instead relies on the
concept of social capital to interpret the wide disparities present between North and South
of Italy. The customary proxies for social capital do vary dramatically between Northern
and Southern regions; they cannot, however, account for the gap in cooperative behavior we
observe in our data. This implies that these proxies do not correlate with the actual ability
of a society to overcome a social dilemma (Result 4).
23

To summarize, the experiment provides support for the role of preferences, expectations,
and social norms in shaping the di↵erential ability to cooperate that we observe across Italy.
Our findings also suggest directions for a more precise identification of the behavioral dimen-
sions that determine why people respond so di↵erently to identical incentives, in the North
and in the South. Two such dimensions relate to how people’s deal with aspects of social
interaction that characterize group tasks. One possible interpretation of our results is that
the North-South behavioral gap may originate in a di↵erence in social norms of conditional
cooperation, or in the expectations thereof (Kocher2008). Cooperation is conditional when
it emerges as a reciprocal response to others’ actions, or it relies on the expectations that
others will cooperate as well (Fischbacher et al., 2001). If a norm of conditional cooperation
is in place, when people interact with each other in group tasks (e.g. Trust Game, Public
Good Game), the higher is the observed or expected level of initial cooperation, the easier
it is to sustain cooperation in a society. To explain the gap, it would be enough to prove
either that the fraction of conditional cooperators is lower in the South, or simply that the
expectations on others’ cooperation are more optimistic in the North. In the present experi-
ment, the ability to cooperate is inherently social and can spread as a beneficial bacterium,
in a self-reinforcing process. This mechanism can operate even if, according to choices in
the Dictator Games, the fraction of self-interested participants is similar in Northern and
Southern Italy.
A second interpretation relates to the aversion to a specific type of risk. Our evidence
shows that tolerance of financial risk – elicited through a lottery task – plays a minor role
in accounting for the North-South gap in the ability to cooperate. One should consider,
however, that this finding is based on the customary assumption that the degree of risk
aversion is identical for all domains, which cannot be taken for granted. In particular, previous
experiments suggest that people exhibit a higher degree of aversion towards the social risk of
being cheated by others, than to the risk related to events that only depend on luck, as in our
lottery task (Bohnet and Zeckhauser, 2004). Existing evidence also indicates that the degree
of this betrayal aversion varies across societies (Bohnet et al., 2008). The Italian gap in
cooperation levels could spring from a specific aversion of Southerners, not to risk in general,
but to the social risk of being cheated by others. This type of social risk is present when
playing both the Trust Game and the Public Good Game, but not in unilateral decisions
such as those in Dictator Games.
The two interpretations lead to distinct behavioral predictions when moving from in-
group to out-group cooperation. If the cooperation gap depends on conditional cooperation,
people would increase their level of cooperation when facing a group that is expected to
cooperate more. On the contrary, if the betrayal aversion interpretation holds, the in-group
and out-group cooperation levels would remain similar.
Our study contributes to the understanding of the characteristics of the North-South gap
in the ability to cooperate, which appears to lie in the ability to cooperate but not necessarily
24

in other dimensions and is rooted in behaviors related to social interaction. These results
are novel. An implication of the findings is that building infrastructures, removing the
pressure from organized crime, increasing the productive investment in the South may not
be enough to equalize regional outcomes – at least not in the short-medium run – unless
people’s dispositions toward in-group cooperation change as well. We acknowledge that
regional variations in the structure of incentives may contribute to the existing North-South
divide in Italy. What we claim is that our study identifies the presence of a gap in cooperative
behavior that persists even when incentives are held constant. In a sense, what we measure
represents a lower bound for the North-South divide.
The next step would be to understand the origins of such distinct norms at the local level.
Regional disparities in Italy survived 150 years of common national history (Felice, 2014;
Daniele and Malanima, 2011), thus displaying long-term persistence, and several scholars
have pointed at heterogeneous experiences in the distant past as the source of the gap in
cooperation levels (Putnam et al., 1993; Nunn and Wantchekon, 2011).
Acknowledgments: We thank A. Barr, S. Bowles, C.F. Camerer, T.N. Cason, R. Durante, B. Herrmann,
E. Fatas, G. Negroni and D.G. Rand for critical discussion and reading of the manuscript, and M. Adami for
technical support and help in conducting the experiments. We are grateful to participants to presentations
at Bocconi University, EUI, University of Padova, the ASSA Meeting in San Diego, the IMEBE conference
in Madrid, the BEElab meeting in Florence, the Trento Workshop on Social Norms and Social Preferences,
the Young Economists Workshop in Bertinoro, the ESA meeting in Zurich, EWEBE meeting in London, the
2014 Political Economy Workshop in Milan, and the Bologna Workshop on the Italian North-South divide.
We also thank P. Mantovani, P. Motetti, G. Pignataro, C. Tagliapietra for logistic help. M. Casari gratefully
acknowledges support from an ERC Starting Grant (No. 241196).
25
References
Bandiera, O., I. Barankay, and I. Rasul (2011). Field experiments with firms. Journal of
Economic Perspectives 25 (3), 63–82.
Banfield, E. C. and L. Fasano (1958). The Moral Basis of a Backward Society. The Free
Press.
Bigoni, M., S. Bortolotti, M. Casari, and D. Gambetta (2013). It takes two to cheat: An
experiment on derived trust. European Economic Review 64 (0), 129 – 146.
Bigoni, M., M. Casari, and G. Camera (2012). Strategies of cooperation and punishment
among students and clerical workers. Journal of Economic Behavior and Organization.
Blinder, A. S. (1973). Wage Discrimination: Reduced Form and Structural Estimates. The
Journal of Human Resources 8 (4), 436–455.
Block, M. K. and V. E. Gerety (1995). Some experimental evidence on di↵erences between
student and prisoner reactions to monetary penalties and risk. The Journal of Legal Stud-
ies 24 (1), 123–38.
Bohnet, I., F. Greig, B. Herrmann, and R. Zeckhauser (2008). Betrayal Aversion: Evi-
dence from Brazil, China, Oman, Switzerland, Turkey, and the United States. American
Economic Review 98 (1), 294–310.
Bohnet, I. and R. Zeckhauser (2004). Trust, risk and betrayal. Journal of Economic Behavior
& Organization 55 (4), 467–484.
Bolton, G. E. and A. Ockenfels (2000). ERC: A Theory of Equity, Reciprocity, and Compe-
tition. American Economic Review 90 (1), 166–193.
Bortolotti, S., M. Casari, and F. Pancotto (2013). Norms of pupunishment in the general
population. Technical report, Working Papers DSE.
Bowles, S. and H. Gintis (2002). Social Capital and Community Governance. Economic
Journal 112 (483), 419–436.
Buchan, N., G. Grimalda, R. Wilson, M. Brewer, E. Fatas, and M. Foddy (2009). Globaliza-
tion and Human Cooperation. Proceedings of the National Academy of Sciences 106 (11),
4138–4142.
Buonanno, P., D. Montolio, and P. Vanin (2009). Does social capital reduce crime? Journal
of Law and Economics 52 (1), pp. 145–170.
Cappelen, A. W., K. Nygaard, E. O. Sørensen, and B. Tungodden (2010). E�ciency, equal-
ity and reciprocity in social preferences: A comparison of students and a representative
population. Discussion Paper Series in Economics 28/2010, Department of Economics,
Norwegian School of Economics.
26
Carmigiani, A. and S. Giacomelli (2009). La giustizia civile in italia: i divari territoriali.
Questioni di Economia e Finanza, Occasional papers (40), 1–38.
Cartocci, R. (2007). Mappe del tesoro: atlante del capitale sociale in Italia. Il mulino.
Daniele, V. and P. Malanima (2011). Il divario Nord-Sud in Italia 1861-2011. Rubbettino.
Durlauf, S. N. (2002). On the Empirics of Social Capital. Economic Journal 112 (483),
459–479.
Eckel, C. and P. Grossman (2008). Forecasting risk attitudes: An experimental study using
actual and forecast gamble choices. Journal of Economic Behavior & Organization 68 (1),
1–17.
Egas, M. and A. Riedl (2008). The economics of altruistic punishment and the maintenance
of cooperation. Proceedings of the Royal Society B: Biological Sciences 275, 871–878.
Fehr, E. and K. Schmidt (1999). A Theory Of Fairness, Competition, And Cooperation. The
Quarterly Journal of Economics 114 (3), 817–868.
Felice, E. (2014). Perche il Sud e rimasto indietro.
Fischbacher, U. (2007). z-Tree: Zurich toolbox for ready-made economic experiments. Ex-
perimental Economics 10 (2), 171–178.
Fischbacher, U., S. Gachter, and E. Fehr (2001). Are people conditionally cooperative?
evidence from a public goods experiment. Economics Letters 71 (3), 397–404.
Franchetti, L. and S. Sonnino (1877). La Sicilia nel 1876. Number v. 1 in La Sicilia nel 1876.
G. Barbera.
Gambetta, D. (1987). Trust: Making and Breaking Cooperative Relations. B. Blackwell.
Guiso, L., P. Sapienza, and L. Zingales (2004). The Role of Social Capital in Financial
Development. The American Economic Review 94 (3), 526–556.
Guiso, L., P. Sapienza, and L. Zingales (2010). Civic Capital as the Missing Link. EIEF
Working Papers Series 1005, Einaudi Institute for Economic and Finance (EIEF).
Henrich, J., R. Boyd, S. Bowles, C. Camerer, E. Fehr, H. Gintis, and R. McElreath (2001).
In Search of Homo Economicus: Behavioral Experiments in 15 Small-Scale Societies. The
American Economic Review 91 (2), 73–78.
Henrich, J., J. Ensminger, R. McElreath, A. Barr, C. Barrett, A. Bolyanatz, J. Cardenas,
M. Gurven, E. Gwako, N. Henrich, C. Lesorogol, F. Marlowe, D. Tracer, and J. Ziker
(2010). Markets, Religion, Community Size, and the Evolution of Fairness and Punishment.
Science 327 (5972), 1480–1484.
27
Herrmann, B., C. Thoni, and S. Gachter (2008). Antisocial Punishment across Societies.
Science 319 (5868), 1362.
Hollander, M. and D. Wolfe (1999). Nonparametric Statistical Methods, 2nd Edition (2 ed.).
Wiley-Interscience.
Ichino, A. and G. Maggi (2000). Work environment and individual background: Explain-
ing regional shirking di↵erentials in a large italian firm. The Quarterly Journal of Eco-
nomics 115 (3), 1057–1090.
Jacini, S. (1884). Atti della Giunta per la inchiesta agraria e sulle condizioni della classe
agricola. Number v. 15,pt. 1 in Atti della Giunta per la inchiesta agraria e sulle condizioni
della classe agricola. A. Forni.
Lamba, S. and R. Mace (2011). Demography and ecology drive variation in cooperation
across human populations. Proceedings of the National Academy of Sciences 108 (35),
14426–14430.
Nannicini, T., A. Stella, G. Tabellini, and U. Troiano (2013). Social capital and political
accountability. American Economic Journal: Economic Policy 5 (2), 222–50.
Nunn, N. and L. Wantchekon (2011). The Slave Trade and the Origins of Mistrust in Africa.
American Economic Review 101 (7), 3221–52.
Oaxaca, R. (1973). Male-female wage di↵erentials in urban labor markets. International
Economic Review 14 (3), 693–709.
Potters, J. and F. Van Winden (2000). Professionals and students in a lobbying experiment:
Professional rules of conduct and subject surrogacy. Journal of Economic Behavior &
Organization 43 (4), 499–522.
Putnam, R. (2000). Bowling Alone: The Collapse and Revival of American Community. A
Touchstone book. Simon & Schuster.
Putnam, R., R. Leonardi, and R. Nanetti (1993). Making Democracy Work: Civic Traditions
in Modern Italy. Princeton University Press.
Salvemini, G. (1955). Scritti sulla questione meridionale: 1896-1955. Opere di Gaetano
Salvemini. G. Einaudi.
Sutter, M. and M. G. Kocher (2007). Trust and trustworthiness across di↵erent age groups.
Games and Economic Behavior 59 (2), 364–382.
28
Appendixes
1 Selection of locations and participants
We selected four medium-sized cities in Italy to conduct our experiments. Table A-1 sum-
marizes the main characteristics of the four cities and Figure A-1 depicts the laboratory in
the di↵erent locations.
Study participants were recruited among the general population of each county. Socio-
demographic characteristics of the actual sample are reported in Table A-2.
Two professional companies -Metis-Ricerche and Demoskopea- were hired for the recruit-
ment of subjects; we provided them with a script to approach potential participants.1 The
recruiters had no prior knowledge of the purpose or content of the study. We asked them
to recruit people residing in or outside the town where we ran the experiment. In addition
to the aforementioned requirements, special categories of people were ex-ante barred from
participation: employees of the research sector; people who took part in market researches in
the preceding three months prior to the contract; family members of the recruiters; employees
of marketing companies and of the press in general. Moreover, no more than two people per
session should be acquainted with each other.
One company (Metis-Ricerche) recruited subjects for the first five sessions in Faenza. Po-
tential subjects were identified by using telephone book entries and they were approached by
telephone calls. All phases of the recruitment process were carried out from the headquarters
of the company, and, in case of acceptance, the company mailed a confirmation letter to the
participant. Metis-Ricerche decided not to renew the contract for the other locations because
the recruitment procedures turned out to be more costly than expected for them. The other
company (Demoskopea) recruited subjects for two sessions in Faenza and for five sessions in
each of the other cities. Local representatives of Demoskopea carried out the recruitment of
the subjects in each county, by choosing/ randomly extracting names from telephone books
and by using random contacts obtained through personal interactions, as instructed by the
headquarter.
1The script is available upon request to the authors.
1

Tab
leA-1:Characteristic
oftheselected
counties
Sou
thNorth
Sou
rce
Year
City
Rag
usa
Crotone
Faenza
Cuneo
Population
Citypop
ulation
73,333
61,392
57,664
55,464
Istat
2009
Cou
nty
pop
ulation
316,11
317
3,81
238
9,50
958
9,58
6Istat
2009
Pop
ulation
den
sity
(residents/squared
km)
196
101
209
85Istat
2009
Foreign
citizens(%
ofresiden
ts)
2.8%
1.5%
4.5%
4.6%
Istat
2003
Geography
Latitude
36o
560
N39
o
050
N44
o
170
N44
o
230
NCityelevation(m
ton
thesealevel)
520
834
534
Sop
ros
Economy
Per-cap
itaGDP
(euros)
20,008
15,447
29,110
30,414
Unioncamere
2008
Regional
cost
ofliving(Italy=10
0)90
.983
.910
5.2
103.1
Activelabor
force(%
ofpop
ulation
above15
)43
.8%
32.6%
53.8%
54.9%
Istat
Socialcapital
Number
ofvo
luntary
associations/1,00
0inhab
itan
ts37
.77
16.08
64.45
33.73
Istat
2000
(rankingoutof103)
(44)
(101)
(9)
(48)
Referen
daturnou
tas
%of
eligible
tovo
te78
%64
%91
%83
%DatabaseGuisoet
al.(201
0)20
04(rankingoutof103)
(66)
(101)
(2)
(56)
N.of
blooddon
ationsper
1000
inhab
itan
ts64
.518
84.8
34.2
Cartocci(200
7)20
02(rankingoutof103)
(5)
(95)
(1)
(58)
Justice
Average
duration
ofaciviltrial
1007
1463
1004
555
Ministryof
Justice
2006
Violentdeaths(N
.hom
icides/1
00,000
inhab
itan
ts)
1.93
5.8
0.53
0.17
Istat
2007
Education
6thgrad
estan
dardized
test
inReadingan
dMathem
atics
9910
128
16Invalsi
2009
/201
0(rankingsoutof103)
(94)
(100)
(25)
(6)
Literacyin
theregion
97.20%
95.30%
99.30%
99.30%
Istat
2001
Notes:Dataareat
thecounty
levelunless
noted
.Cityelevationfrom
http://www.sopros.it/download/TabellaGradiItalia.pdf.GDP
isin
Euro
atcu
rrentprices.
StatisticsforGDP
atthelevelof
theprovince
arenot
available,thusdataon
valuead
ded
atthelevelof
theprovince
are
usedas
aproxy.
Average
duration
ofaciviltrialreferto
day
sforan
ordinarytrialin
thejudiciary
district.
Invalsiis
thenational
institute
for
theevaluationof
Italianschoolingan
ded
ucation
system
,‘Istitutonazionaleperlavalutazionedelsistemaeducativodiistruzioneediformazione’.
Dataon
theaverag
eduration
ofaciviltrialaretakenfrom
Carmigianian
dGiacomelli(200
9).
2
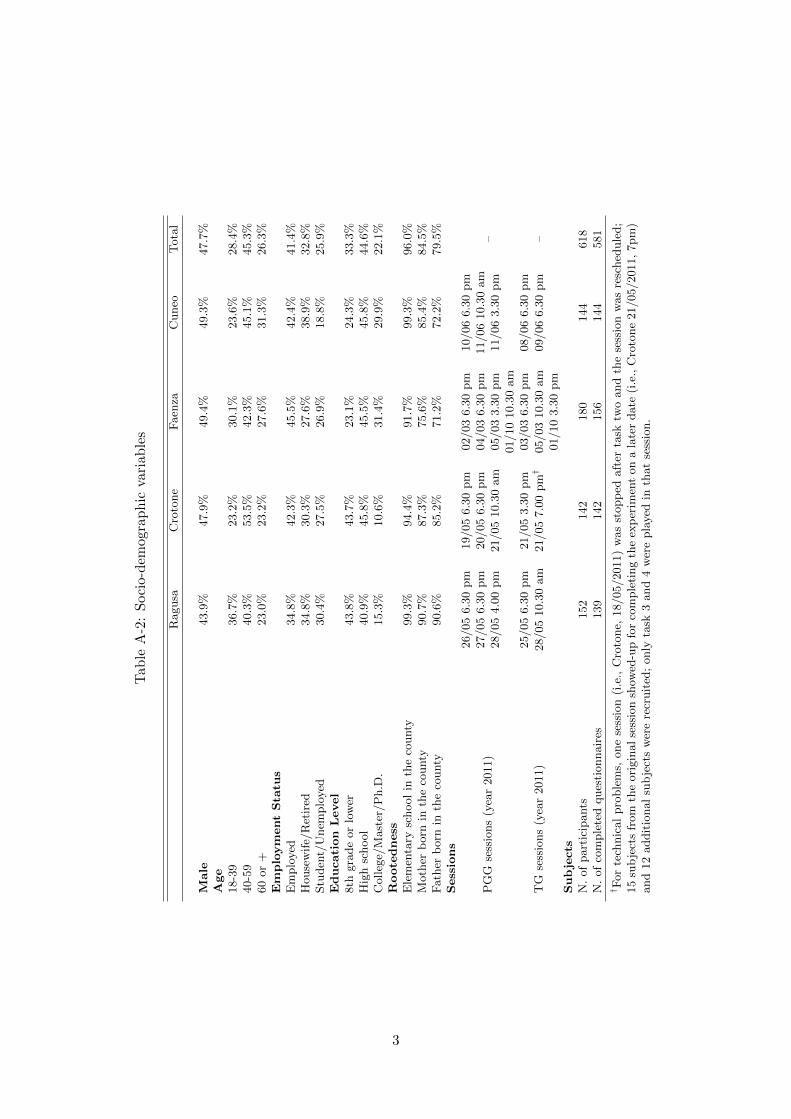
Tab
leA-2:Socio-dem
ographic
variab
les
Rag
usa
Crotone
Faenza
Cuneo
Total
Male
43.9%
47.9%
49.4%
49.3%
47.7%
Age
18-39
36.7%
23.2%
30.1%
23.6%
28.4%
40-59
40.3%
53.5%
42.3%
45.1%
45.3%
60or
+23
.0%
23.2%
27.6%
31.3%
26.3%
EmploymentStatus
Employed
34.8%
42.3%
45.5%
42.4%
41.4%
Hou
sewife/Retired
34.8%
30.3%
27.6%
38.9%
32.8%
Student/Unem
ployed
30.4%
27.5%
26.9%
18.8%
25.9%
Education
Level
8thgrad
eor
lower
43.8%
43.7%
23.1%
24.3%
33.3%
Highschool
40.9%
45.8%
45.5%
45.8%
44.6%
College/M
aster/Ph.D
.15
.3%
10.6%
31.4%
29.9%
22.1%
Rootedness
Elementary
school
inthecounty
99.3%
94.4%
91.7%
99.3%
96.0%
Mother
bornin
thecounty
90.7%
87.3%
75.6%
85.4%
84.5%
Father
bornin
thecounty
90.6%
85.2%
71.2%
72.2%
79.5%
Sessions
PGG
sessions(year20
11)
26/0
56.30
pm
19/0
56.30
pm
02/0
36.30
pm
10/0
66.30
pm
–27
/056.30
pm
20/0
56.30
pm
04/0
36.30
pm
11/0
610
.30am
28/0
54.00
pm
21/0
510
.30am
05/0
33.30
pm
11/0
63.30
pm
01/1
010
.30am
TG
sessions(year20
11)
25/0
56.30
pm
21/0
53.30
pm
03/0
36.30
pm
08/0
66.30
pm
–28
/0510
.30am
21/0
57.00
pm
†
05/0
310
.30am
09/0
66.30
pm
01/1
03.30
pm
Subjects
N.of
participan
ts15
214
218
014
461
8N.of
completedquestion
naires
139
142
156
144
581
†
For
technical
problems,
onesession(i.e.,Crotone,
18/0
5/20
11)was
stop
ped
aftertask
twoan
dthesessionwas
resched
uled;
15subjectsfrom
theoriginal
sessionshow
ed-upforcompletingtheexperim
enton
alaterdate(i.e.,Crotone21
/05/
2011
,7p
m)
and12
additional
subjectswererecruited
;on
lytask
3an
d4wereplayedin
that
session.
3

Figure A-1: Mobile laboratory
(a) Crotone (b) Cuneo
(c) Faenza
4

Figure
A-2:Screenshot
samples(E
nglishtran
slation)
(a)PublicGoodGam
e(P
GG)
(b)Trust
Gam
e(T
G)
(c)DictatorGam
e(D
G1)
(d)Lottery
choice
5

2 Additional statistical analysis
This Section presents additional statistical analysis and details on the relation between con-
tributions to the PGG, trust, trustworthiness, concerns for equality and e�ciency, risk of
nature, and demographic characteristics of the subject pool.
In Table 5 in the main text, we provide evidence of a positive and significant relation
between individual contributions and trust. As a robustness check, we also run the symmetric
linear regression, where the dependent variable is the frequency of trust measured at the
individual level (Table A-3), and the only independent variable in Model 1 is the average
contribution to the public good at the county level. Results indicate that an increase by 1
point (5 percent) in the average contribution to the PGG corresponds to a highly significant
increase of the frequency of trust, by about 6 percentage points. In a second specification
(Table A-3, Model 2), we include additional regressors to control for task comprehension and
demographic characteristics. Results from Model 2 confirm that the positive and significant
relation between trust and individual contributions to the public good is not driven uniquely
by di↵erences in the individual characteristics of our subjects across counties.
Table A-3: Average individual trust vs. contribution to the PGG at the county level.
Dep.var.: Trust frequency in the TG
Model 1 Model 2County-average contribution 0.060*** 0.063***
(0.011) (0.015)Task comprehension (1=low) -0.033
(0.048)Socio-demographic characteristics No YesN.obs. (individuals) 242 242R-squared 0.023 0.050
Notes: OLS regression with standard errors robust for clustering at the matching-group level (in parentheses). Symbols⇤ ⇤ ⇤, ⇤⇤, and ⇤ indicate significance at the 1%, 5% and 10% level, respectively.
In Table A-4 we test whether a significant relation emerges between the dummy Northern
Italy and the average gains from trust, measured as the average profit obtained by a subject
in all periods when he had the role of truster and decided to trust. Gains were higher in
the North as compared to the South, but the coe�cient is not significant (Model 1). We
also tested for latitude and find that is not significantly correlated with the gains from trust
(Model 2).
In Section 5 we report data on individual preferences as elicited in the Dictator Games
and in the lottery task. Table A-5 reports data on individual types divided by county and
task. We classify 246 participants according to their choices in the three DGs (Table 2):2 a
participant expresses a “strong concern for group e�ciency” when she favors total surplus
in the group both (i) over equality of earnings in the costless choice DG1, and (ii) over self-
interest in DG2; by contrast, a participant expresses a “strong concern for equality” when
2Only participats in the TG sessions took part in the modified DGs.
6
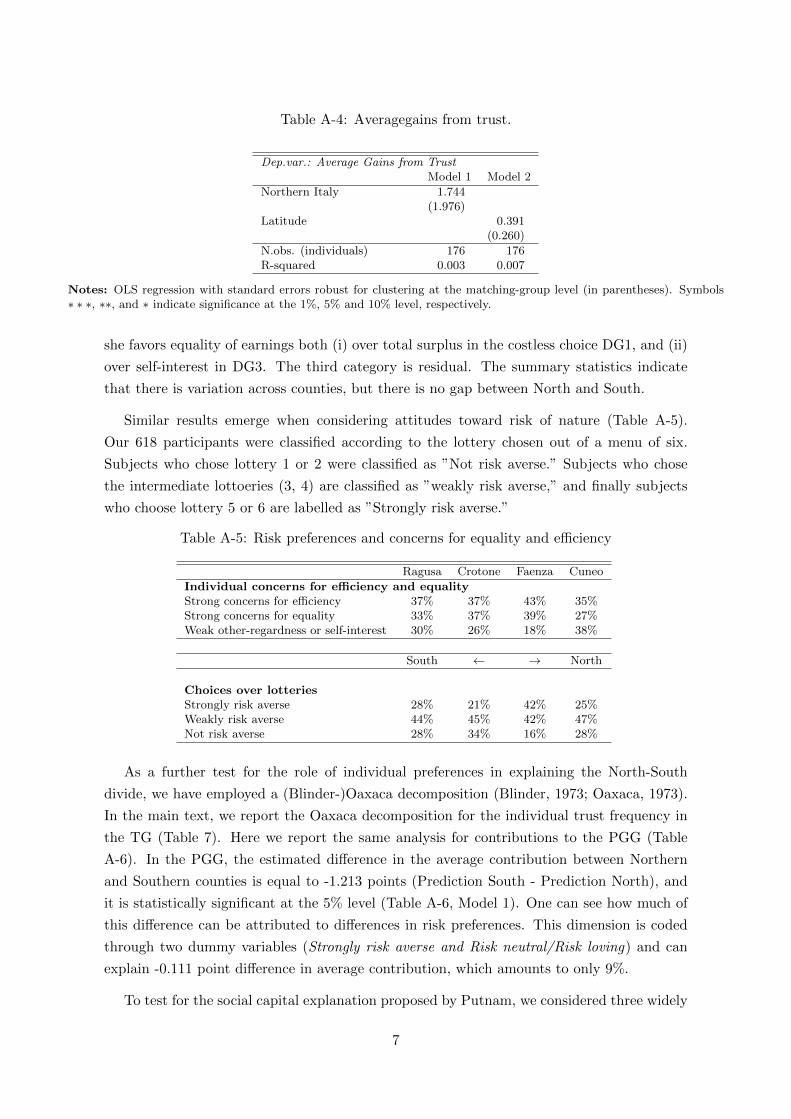
Table A-4: Averagegains from trust.
Dep.var.: Average Gains from Trust
Model 1 Model 2Northern Italy 1.744
(1.976)Latitude 0.391
(0.260)N.obs. (individuals) 176 176R-squared 0.003 0.007
Notes: OLS regression with standard errors robust for clustering at the matching-group level (in parentheses). Symbols⇤ ⇤ ⇤, ⇤⇤, and ⇤ indicate significance at the 1%, 5% and 10% level, respectively.
she favors equality of earnings both (i) over total surplus in the costless choice DG1, and (ii)
over self-interest in DG3. The third category is residual. The summary statistics indicate
that there is variation across counties, but there is no gap between North and South.
Similar results emerge when considering attitudes toward risk of nature (Table A-5).
Our 618 participants were classified according to the lottery chosen out of a menu of six.
Subjects who chose lottery 1 or 2 were classified as ”Not risk averse.” Subjects who chose
the intermediate lottoeries (3, 4) are classified as ”weakly risk averse,” and finally subjects
who choose lottery 5 or 6 are labelled as ”Strongly risk averse.”
Table A-5: Risk preferences and concerns for equality and e�ciency
Ragusa Crotone Faenza CuneoIndividual concerns for e�ciency and equality
Strong concerns for e�ciency 37% 37% 43% 35%Strong concerns for equality 33% 37% 39% 27%Weak other-regardness or self-interest 30% 26% 18% 38%
South ! North
Choices over lotteries
Strongly risk averse 28% 21% 42% 25%Weakly risk averse 44% 45% 42% 47%Not risk averse 28% 34% 16% 28%
As a further test for the role of individual preferences in explaining the North-South
divide, we have employed a (Blinder-)Oaxaca decomposition (Blinder, 1973; Oaxaca, 1973).
In the main text, we report the Oaxaca decomposition for the individual trust frequency in
the TG (Table 7). Here we report the same analysis for contributions to the PGG (Table
A-6). In the PGG, the estimated di↵erence in the average contribution between Northern
and Southern counties is equal to -1.213 points (Prediction South - Prediction North), and
it is statistically significant at the 5% level (Table A-6, Model 1). One can see how much of
this di↵erence can be attributed to di↵erences in risk preferences. This dimension is coded
through two dummy variables (Strongly risk averse and Risk neutral/Risk loving) and can
explain -0.111 point di↵erence in average contribution, which amounts to only 9%.
To test for the social capital explanation proposed by Putnam, we considered three widely
7

Table A-6: Oaxaca decomposition of North South di↵erence in average contribution to the public good.
Dependent variable: Individual contribution
to the PGG
Model 1Prediction South 8.153***
(0.377)Prediction North 9.366***
(0.338)Di↵erence -1.213**
(0.507)Explained Part
Strongly risk averse -0.067(0.062)
Risk neutral/Risk loving -0.044(0.050)
Total explained -0.111(0.078)
Unexplained Part
Total unexplained -1.102**(0.507)
N.obs. (individuals) 372
Notes: Symbols ⇤⇤⇤, ⇤⇤, and ⇤ indicate sig-nificance at the 1%, 5% and 10% level, re-spectively.
used proxies: association density, electoral participatin, and blood donation.3
In Table A-7 we test for the correlation between cooperation (contribution to the PGG
in Model 1 and trust in the TG in Model 3) and county-level measures of social capital.
The specifications also include controls for individual preferences, understanding and demo-
graphic characteristics. The only proxy for social capital that is significant is Blood donations,
however the sign is negative and not positive as suggested by the literature on social capital.
Individual-level measures of social capital –described in the main text– are included in Mod-
els 2 and 4. Once more, we do not find support for the idea that the North-South divide is
explained by the social capital hypothesis.
3 Experimental Instructions
3.1 Instructions (PGG Experiment)
Welcome! This study is part of a research project led by the Universities of Bologna and
Oxford and financed by the European Commission. All participants in this room were born
in this Province, or in this Region.
(You will earn 30 euros in gasoline vouchers for taking part in the study). You will be able to
earn additional money depending on your choices and the choices of the other participants.
You will be paid in private at the end of today’s study.
3See the main text for a detailed description of the proxies.
8

Table A-7: Regression analysis on social capital.
Dep.var.: Individual Contribution (PGG) Individual trust (TG)
Model 1 Model 2 Model 3 Model 4Strongly risk averse 0.896 0.683 -0.032 -0.028
(0.586) (0.611) (0.055) (0.057)Risk neutral/Risk loving -0.887* -1.001** -0.019 -0.022
(0.479) (0.396) (0.064) (0.066)Strong concerns for equality -0.036 -0.040
(0.065) (0.069)Strong concerns for e�ciency 0.026 0.024
(0.068) (0.068)Task comprehension (1=low) 0.820 1.039 -0.029 -0.035
(0.704) (0.751) (0.048) (0.055)County-level measures of social capital
Blood donations -0.080*** -0.005***(0.017) (0.002)
Electoral participation 3.578 0.359(5.402) (0.451)
Association density 0.086* 0.007(0.043) (0.005)
Individual-level measures of social capital (questionnaire)
Blood donor -1.154 -0.026(0.685) (0.094)
Voted in referenda or europeanelections
1.261s -0.022
(1.130) (0.086)Association member 0.822 0.029
(0.490) (0.054)Social capital missing -0.137 -0.049
(0.570) (0.057)Socio-demographic character-istics
Yes Yes Yes Yes
N.obs. (individuals) 372 372 242 242R-squared 0.115 0.106 0.061 0.043
Notes: The dependent variable in Models 1-2 is the contribution of one participant averaged over all rounds of the PGG.
The dependent variable in Models 3-4 is the frequency of one participant trusting over all rounds of the TG when she was
a trustor. Association member takes value 1 for all subjects who declared to be active member of at least one association,
and 0 otherwise. The default category for risk preferences is: moderately risk averse. Socio-demographic chacracteristics
are listed in the main text.
9

Please, turn o↵ your mobile phone. From this moment on, no form of communication among
participants is allowed. In case you have a question, please rise your hand and one of us will
come to your desk to answer it.
It is important that you carefully follow the instructions. There are five parts to this study
; I am about to read instructions for Part 1.4
Instructions Part 1
In this part, you have to choose among six di↵erent earnings options. Each option can
produce either a high or a low earning. Please, look at the screen. For each option:
• the high earning is in the second column;
• the low earning is in the third column.
Figure A-3: Sample screenshot for Lottery task.
The high earning has a 50 percent probability of being realized and the low earning has a 50
percent probability of being realized.
What is your task? You have to choose your favorite option. Look at the screen: for each
row you can see a button, numbered from I to VI (see Figure A-3. In order to choose, you
have to press the button next to your favorite option. Please, touch the screen with your
fingers only; pencils could damage the screen.
How are your earnings computed?
• at the end of today’s study, two participants in this room will be randomly selected
; only the selected persons will receive a payment for this part. The payment can be
either high or low;
4For brevity, we report instructions only for part 1 and 2 and omit part 3 to 5, which are not included in the presentpaper. The full set of instructions is available upon request to the authors. Original instructions were in Italian.
10

• there will be a urn with ten balls: 5 orange and 5 white balls;
• if an orange ball is drawn from the urn, the selected people will get the high payment
for the option they’ve chosen ;
• if a white ball is drawn from the urn, the selected people will get the low payment for
the option they’ve chosen .
Let’s run a test, with no consequences for your final earnings. Please, press the button V.
You earn 37.5 Euros if an orange ball is drawn from the urn, while you earn 7.5 Euros if
a white ball is drawn from the urn. [ Did you press the button?] A box to CONFIRM
or CHANGE your choice has appeared on the screen; please, press CHANGE. Now you can
change your choice . [OK] Now press the button III; you earn 27.5 Euros if an orange ball
is drawn from the urn, while you earn 12.5 Euros if a white ball is drawn from the urn.
Please, press CONFIRM. [The choice cannot be changed anymore. Please, everyone press
CONFIRM. Is everything clear? If there are no questions, we can start with Part 1.]
Instructions Part 2
In the present and subsequent parts, your earnings are expressed in tokens that will be
converted in Euros at the rate of 1 Euro for 40 tokens.
For this part, people in this room are randomly divided in groups of four; nobody can know
the identity of the other members of the group.
The screen displays your group: you are the person in red.
What is your task? Each member of the group is endowed with 20 tokens, that have to be
divided between a common project and his wallet. You can see four red buttons on the screen
(see Figure A-4 for two sample screenshots. You can decide to:
• put 0 tokens in the common project and keep 20 tokens in your wallet;
• put 6 tokens in the common project and keep 14 tokens in your wallet;
• put 14 tokens in the common project and keep 6 tokens in your wallet;
• put 20 tokens in the common project and keep 0 tokens in your wallet.
As an example with no consequences for your earnings, please press the button PUT 0 AND
KEEP 20. [Have you pressed the button? ] A box to CONFIRM or CHANGE your choice has
appeared on the screen; please, press CONFIRM. [The choice cannot be changed anymore.
Please, everyone press CONFIRM.]
After everyone has confirmed his choice, you can see:
• the tokens kept in the wallet by each member of the group;
• the tokens put in the common project by each member of the group;
• the total number of tokens that the group has put in the common project.
11
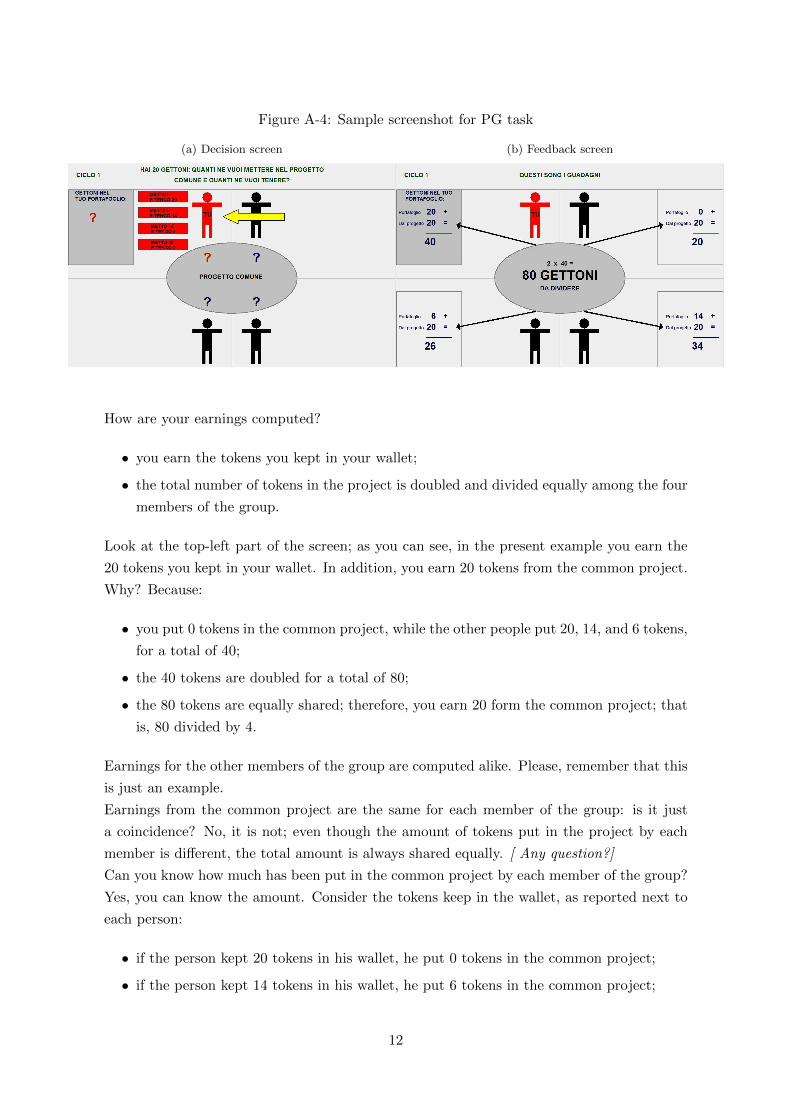
Figure A-4: Sample screenshot for PG task
(a) Decision screen (b) Feedback screen
How are your earnings computed?
• you earn the tokens you kept in your wallet;
• the total number of tokens in the project is doubled and divided equally among the four
members of the group.
Look at the top-left part of the screen; as you can see, in the present example you earn the
20 tokens you kept in your wallet. In addition, you earn 20 tokens from the common project.
Why? Because:
• you put 0 tokens in the common project, while the other people put 20, 14, and 6 tokens,
for a total of 40;
• the 40 tokens are doubled for a total of 80;
• the 80 tokens are equally shared; therefore, you earn 20 form the common project; that
is, 80 divided by 4.
Earnings for the other members of the group are computed alike. Please, remember that this
is just an example.
Earnings from the common project are the same for each member of the group: is it just
a coincidence? No, it is not; even though the amount of tokens put in the project by each
member is di↵erent, the total amount is always shared equally. [ Any question?]
Can you know how much has been put in the common project by each member of the group?
Yes, you can know the amount. Consider the tokens keep in the wallet, as reported next to
each person:
• if the person kept 20 tokens in his wallet, he put 0 tokens in the common project;
• if the person kept 14 tokens in his wallet, he put 6 tokens in the common project;
12

• if the person kept 6 tokens in his wallet, he put 14 tokens in the common project;
• if the person kept 0 tokens in his wallet, he put 20 tokens in the common project.
In this part there are 8 rounds with the same rules. In the upper-left part of the screen you
can see the number of the current round. At the beginning of each round, new groups of four
people are formed at random.
To sum up, in every round:
• you are endowed with 20 tokens;
• you have to decide how to allocate the tokens between your wallet and the common
project;
• the tokens put in the common project by the group members are doubled and then
equally divided among the four members of the group;
• your earnings are equal to the sum of what is in your wallet and the tokens from the
common project.
Earnings cumulate from round to round. [Is everything clear?]
Before starting, please answer a few questions. ?
3.2 Instructions (TG Experiment)
Welcome! This study is part of a research project of the Universities of Bologna and Oxford
and is financed by the European Commission. All participants in this room were born in this
Province, or in this Region.
You will earn Euros 30 in gasoline vouchers for taking part to the study. You will be able to
earn additional money depending on your choices and the choices of the other participants.
You will be paid in private at the end of today’s study.
Please, turn o↵ your mobile phone. From this moment on, no form of communication among
participants is allowed. In case you have a question, please rise your hand and one of us will
come to your desk to answer it.
It is important you carefully follow the instructions. In this study there are four parts; I am
about to read instructions for Part 1.5
Instructions Part 2
In the present and subsequent parts, your earnings are expressed in tokens that will be
converted in Euros at the rate of 1 Euro for 40 tokens.
In this part, people in this room are randomly divided in groups of three; nobody can know
5For brevity, we report istructions only for part 2 and 3 and omit part 4 that is not included in the present paper.Instructions for part 1 are identical to part 1 instructions in the PGG experiment. The full set of instructions is availableupon request to the authors
13
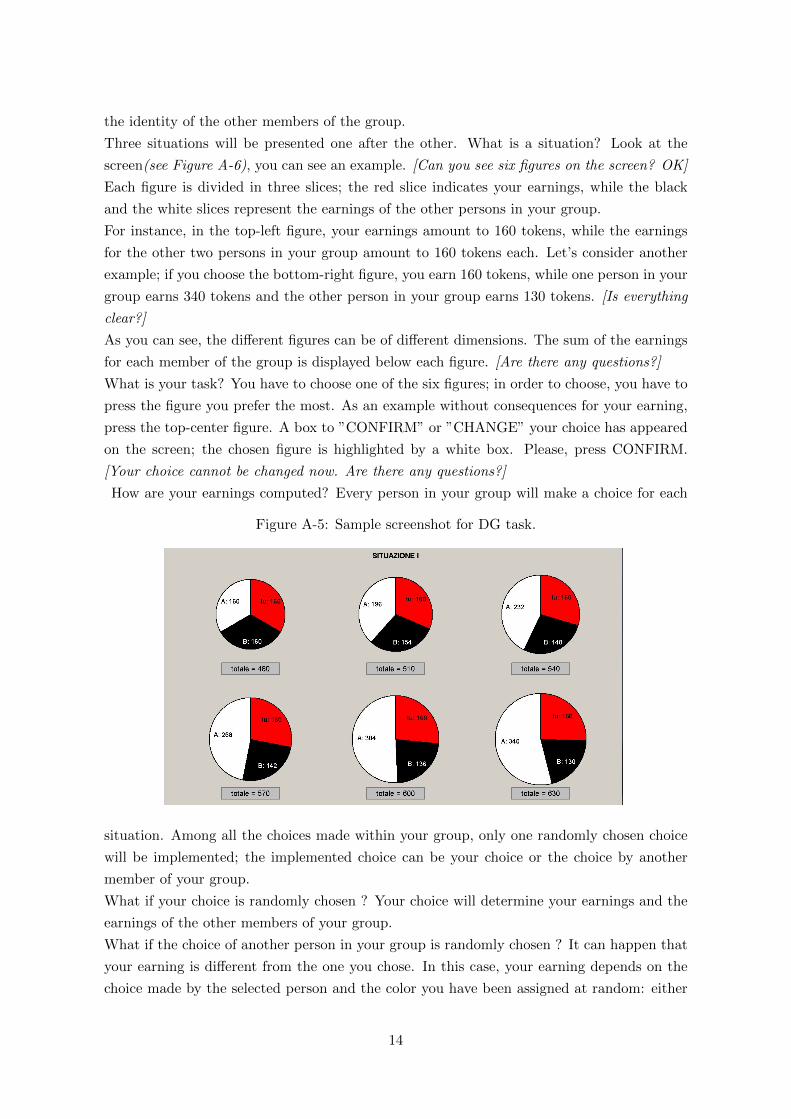
the identity of the other members of the group.
Three situations will be presented one after the other. What is a situation? Look at the
screen(see Figure A-6), you can see an example. [Can you see six figures on the screen? OK]
Each figure is divided in three slices; the red slice indicates your earnings, while the black
and the white slices represent the earnings of the other persons in your group.
For instance, in the top-left figure, your earnings amount to 160 tokens, while the earnings
for the other two persons in your group amount to 160 tokens each. Let’s consider another
example; if you choose the bottom-right figure, you earn 160 tokens, while one person in your
group earns 340 tokens and the other person in your group earns 130 tokens. [Is everything
clear?]
As you can see, the di↵erent figures can be of di↵erent dimensions. The sum of the earnings
for each member of the group is displayed below each figure. [Are there any questions?]
What is your task? You have to choose one of the six figures; in order to choose, you have to
press the figure you prefer the most. As an example without consequences for your earning,
press the top-center figure. A box to ”CONFIRM” or ”CHANGE” your choice has appeared
on the screen; the chosen figure is highlighted by a white box. Please, press CONFIRM.
[Your choice cannot be changed now. Are there any questions?]
How are your earnings computed? Every person in your group will make a choice for each
Figure A-5: Sample screenshot for DG task.
situation. Among all the choices made within your group, only one randomly chosen choice
will be implemented; the implemented choice can be your choice or the choice by another
member of your group.
What if your choice is randomly chosen ? Your choice will determine your earnings and the
earnings of the other members of your group.
What if the choice of another person in your group is randomly chosen ? It can happen that
your earning is di↵erent from the one you chose. In this case, your earning depends on the
choice made by the selected person and the color you have been assigned at random: either
14

white or black. The choice will be randomly selected at the end of this part; therefore, you
have to pay attention to all your choices. [Is everything clear?]
Before starting, please answer a few questions.
Instructions Part 3
As in the previous part, people in this room are randomly divided in groups of three people;
nobody can know the identity of the other members of the group.
There are two di↵erent roles in each group: role A and role B. In each group, a person has
the role A and two have the role B. Roles are randomly assigned by the computer.
What is the task for a role A person? Look at the screen (see Figure A-6), the role A person
has to decide between PASS and KEEP.
• if the person A decides to KEEP, everyone in the group earns 20 tokens. In this case,
role B people do not have to take any decisions;
• if the person A decides to PASS, he earns either 0 or 36 depending on the choices made
by the role B people in the group.
As an example with no consequences for your earnings, please press the button PASS. You
can now decide whether to CONFIRM or CHANGE your choice; please, press CONFIRM.
[The choice cannot be changed anymore. Please, everyone press CONFIRM]
What is the task for a role B person if the role A person decides to PASS? Look at the screen,
the two role B people have to simultaneously choose between GIVE and KEEP. If A decides
Figure A-6: Sample screenshot for TG task
(a) Decision truster (b) Decision trustees
to PASS, how are the earnings computed?
• if both role B persons decide to KEEP, role B persons earn 48 tokens each and the role
A person earns 0 tokens;
15

• if both role B people decide to GIVE, role B persons earn 30 tokens each and the role
A person earns 36 tokens;
• if one role B person decides to GIVE and the other decides to KEEP, role B persons
earn 30 tokens each and the role A person earns 36 tokens.
Please remember that everyone in the group earns 20 tokens if role A person decides to
KEEP.
Let’s make an example with no consequences for your earnings. In this example, you have the
role B. Please, press KEEP and then CONFIRM. [The choice cannot be changed anymore.
Please, everyone press CONFIRM]
In the following screen, you can see the final earnings for the group. In the present example,
you have been assigned role B and have decided to KEEP, while the other person who has
been assigned role B decided to GIVE. Both you and the other person with the role B earn
30 tokens and the person with the role A earns 36 tokens.
In this part, there are 10 rounds with the same rules. In the upper-left part of the screen
you can see the number of the current round. At the beginning of every round, new groups
of three people are formed at random.
To sum up, in every round:
• the person with role A has to decide between PASS and KEEP;
• if A decides to KEEP, the round ends and everyone earns 20 tokens;
• if A decides to PASS, the two people with role B have to choose between GIVE and
KEEP and earnings are computed as explained above.
Earnings cumulate from round to round. [Is everything clear?] Before starting, please answer
a few questions.
3.3 Questionnaire (PGG and TG experiments)
Were the instructions clear to you?
1.Not at all clear
2.Not very clear
3.Somewhat clear
4.Very clear
What is your age range?
1.18-25
2.26-32
3.33-39
4.40-49
16

5.50-59
6.60-69
7.70 and more
Sex
1.Female
2.Male
Birthplace
1.In this city or county
2.Outside this county, but in this region
3.Trentino AA, Veneto, Friuli VG
4.Piemonte, Valle d’Aosta, Lombardia, Liguria
5.Toscana, Umbria, Marche, Lazio
6.Abruzzo, Molise, Puglia, Basilicata, Calabria, Campania
7.Sicila, Sardegna
8.Foreign Country
Mother’s birthplace
1.In this city or county
2.Outside this county, but in this region
3.Trentino AA, Veneto, Friuli VG
4.Piemonte, Valle d’Aosta, Lombardia, Liguria
5.Toscana, Umbria, Marche, Lazio
6.Abruzzo, Molise, Puglia, Basilicata, Calabria, Campania
7.Sicila, Sardegna
8.Foreign Country
Father’s birthplace
1.In this city or county
2.Outside this county, but in this region
3.Trentino AA, Veneto, Friuli VG
4.Piemonte, Valle d’Aosta, Lombardia, Liguria
5.Toscana, Umbria, Marche, Lazio
6.Abruzzo, Molise, Puglia, Basilicata, Calabria, Campania
7.Sicila, Sardegna
8.Foreign Country
17

Where did you attend elementary school?
1.In this city or county
2.Outside this county, but in this region
3.Trentino AA, Veneto, Friuli VG
4.Piemonte, Valle d’Aosta, Lombardia, Liguria
5.Toscana, Umbria, Marche, Lazio
6.Abruzzo, Molise, Puglia, Basilicata, Calabria, Campania
7.Sicila, Sardegna
8.Foreign Country
Marital status:
1.Unmarried
2.Married
3.Separated
4.Divorced
5.Widower
How many people compose your family, including yourself?
1.1
2.2
3.3
4.4
5.5 or more
Are you your family’s main source of income?
1.Yes
2.No
Have you got brothers and/or sisters?
1.No
2.1
3.2
4.3 or more
Does your family possesses a car?
1.Yes, 1
2.Yes, 2 or more
3.No
18

Is the house where your family lives:
1.Rented
2.Your property
3.Other
Employment:
1.Inexperienced worker
2.Experienced labor force
3.Self-employed
4.Employed with fixed term contract
5.Employed with permanent contract
6.Retired
7.Student
8.Housewife
9.Not able to work or not searching for a job
If in the previous question you responded 3. Self-employed:
1.Entrepreneur with employees
2.Entrepreneur without employees
3.Free-lance professional
4.Partner in a cooperative
5.Family co-worker
6.Artisan (Craftsman)
7.Merchant
8.Fixed term worker in a project (co.co.pro).
If you instead responded 4. or 5. Employee (with fixed term or permanent con-
tract):
1.Executive, medical doctor or university professor
2.Managing employee, white collar
3.O�ce worker
4.Teacher
5.Worker, shop assistant, nurse and similar
6.Apprentice
7.Cottage worker for a firm
8.Fixed term worker in a project (co.co.pro).
Education level
1.Primary school or lower
19

2.Intermediate school (8th grade)
3.High school
4.College
5.Master or PhD
In general, would you say that most people can be trusted or that you need to
be very careful in dealing with people
1.Most people can be trusted
2.Need to be very careful
3.Do not know
Do you think that most people would try to take advantage of you if they got a
chance, or would they try to be fair? Please show your response on this card,
where 1 means that “people would try to take advantage of you”, and 10 means
that “people would try to be fair”:
1.People would try to take advantage of you
10. People would try to be fair
Imagine you lost your wallet or purse while walking in the main street of this city.
The wallet contained 100 euros in cash. Someone finds it and understands that
you are the owner, because documents show your identity and address. Which
do you think would be the probability that the person that finds it would return
it to you, if the person in question is born in this city but you do not know it
personally?
1.Almost sure
2.Very probable
3.Rather probable
4.Not very probable
5.Not at all probable
What happens if it is an elementary school teacher of this city to find it?
1.Almost sure
2.Very probable
3.Rather probable
4.Not very probable
5.Not at all probable
What if it is a shop assistant of this city to find it?
1.Almost sure
20

2.Very probable
3.Rather probable
4.Not very probable
5.Not at all probable
What if it is a police man of this city to find it?
1.Almost sure
2.Very probable
3.Rather probable
4.Not very probable
5.Not at all probable
Are you generally ready to take on risks or you tend to avoid them? Please use
this scale where 1 means “risk averse”, while 10 means “ready to take risks”.
1. risk averse
10. ready to take risks
I am going to name a number of voluntary organizations. For each one, could
you tell us if you are an active member? (You can check more than 1 answer)
1.I am not a member of any organization or association
2.Associations or groups related to the “churches”
3.Sport or leisure associations or organizations
4.Artistic, music or educational associations or organizations
5.Labor Unions
6.Political Parties
7.Environmental organizations
8.Professional organizations
9.Charitable or humanitarian organizations
10.Consumers organizations
Have you made a blood donation in the last 12 months?
1.Yes
2.No
3.I cannot donate for medical reasons
Did you vote in the last european elections in 2009?
1.Yes
2.No
21

3.I had no voting right
Did you vote in one referendum at least since 1999? In 1999 there has been a ref-
erendum on the abolition of the proportional share for the chamber of deputies.
There have been other referendum on other issues in 2000, 2003, 2005 e 2009.
1.Yes
2.No
3.I had no voting right
22