Embed Size (px)
Citation preview

designAMODEL®
PolyphthalamideDesign Guide
AM
OD
EL

Abbreviations used in this Manual
Abbreviation Meaning
ABS acrylonitrile-butadiene-styreneASTM American Society for Testing and MaterialsAWG American Wire GaugeBtu British thermal unitCLTE coefficient of linear thermal expansionCTI comparative tracking indexDAM “dry, as molded”DSC differential scanning calorimetryEMI electromagnetic interferenceFD flow directionGF glass filledGR glass reinforcedHDT heat deflection (distortion) temperatureHS heat stabilizedHVATR high voltage arc tracking rateHWI hot wire ignitionHz HertzIR infraredISO International Organization for Standardizationkpsi kilo (1000) pounds per square inchMF mineral filledNBS National Bureau of StandardsPA polyamidePEI polyetherimidePEEK polyetheretherketonePET polyethylene terephthalatePLC Performance Level Class (UL 746A)PPA polyphthalamidePPS polyphenylene sulfidepsi pounds per square inchRFI radio frequency interferenceRH relative humidityRTI relative thermal indexSI International System of UnitsTD transverse directionTMA thermomechanical analysisUL Underwriters Laboratories Inc.UV ultraviolet radiation
Table of ContentsIntroduction· · · · · · · · · · · · · · · · · · · · · · · · · · · · · · · · · · · · · · · · · · · · · · · · · · · · · · · · · · · · · · · · · · · · · · · · 1-1
Chemistry - - - - - - - - - - - - - - - - - - - - - - - - - - - - - - - - - - - - - - - - - - - - - - - - - - - - - - - - - - - - - - - - - - - - - 1-1Crystallinity · · · · · · · · · · · · · · · · · · · · · · · · · · · · · · · · · · · · · · · · · · · · · · · · · · · · · · · · · · · · · · · · · · · · · · · · · · · · · · · · · · · · · · 1-1
AMODEL PPA Base Resin Properties · · · · · · · · · · · · · · · · · · · · · · · · · · · · · · · · · · · · · · · · · · · · · · · · · · · · · · · · · · · · 1-1Moisture Effects · · · · · · · · · · · · · · · · · · · · · · · · · · · · · · · · · · · · · · · · · · · · · · · · · · · · · · · · · · · · · · · · · · · · · · · · · · · · · · · · · · 1-3
AMODEL Resin Property Tables · · · · · · · · · · · · · · · · · · · · · · · · · · · · · · · · · · · · · · · · · · · · · · · · · · · · · · · · 2-1Nomenclature- - - - - - - - - - - - - - - - - - - - - - - - - - - - - - - - - - - - - - - - - - - - - - - - - - - - - - - - - - - - - - - - - - - 2-1Product Selection - - - - - - - - - - - - - - - - - - - - - - - - - - - - - - - - - - - - - - - - - - - - - - - - - - - - - - - - - - - - - - - - 2-2Typical Property Tables- - - - - - - - - - - - - - - - - - - - - - - - - - - - - - - - - - - - - - - - - - - - - - - - - - - - - - - - - - - - - 2-3
Typical Properties · · · · · · · · · · · · · · · · · · · · · · · · · · · · · · · · · · · · · · · · · · · · · · · · · · · · · · · · · · · · · · · · · · · · · · · · · · · · · · · · · 2-3Glass-Reinforced Grades - Mechanical Properties - US units· · · · · · · · · · · · · · · · · · · · · · · · · · · · · · · · · · · · · · · · · · 2-4Glass-Reinforced Grades - Mechanical Properties - SI units · · · · · · · · · · · · · · · · · · · · · · · · · · · · · · · · · · · · · · · · · · 2-5Glass-Reinforced Grades - Thermal, Electrical, and General Properties · · · · · · · · · · · · · · · · · · · · · · · · · · · · · · · · · · 2-6Toughened Grades - Mechanical Properties - US units · · · · · · · · · · · · · · · · · · · · · · · · · · · · · · · · · · · · · · · · · · · · · · 2-7Toughened Grades - Mechanical Properties - SI Units · · · · · · · · · · · · · · · · · · · · · · · · · · · · · · · · · · · · · · · · · · · · · · 2-8Toughened Grades - Thermal, Electrical, and General Properties · · · · · · · · · · · · · · · · · · · · · · · · · · · · · · · · · · · · · · 2-9Toughened Glass-Reinforced and Flame Retardant Grades - Mechanical Properties - US units · · · · · · · · · · · · · · · 2-10Toughened Glass-Reinforced and Flame Retardant Grades - Mechanical Properties - SI units· · · · · · · · · · · · · · · · 2-11Toughened Glass-Reinforced and Flame Retardant Grades - Thermal, Electrical, and General Properties · · · · · · · 2-12Mineral and Mineral/Glass Filled Grades - Mechanical Properties - US units · · · · · · · · · · · · · · · · · · · · · · · · · · · · · 2-13Mineral and Mineral/Glass Filled Grades - Mechanical Properties - SI units · · · · · · · · · · · · · · · · · · · · · · · · · · · · · · 2-14Mineral and Mineral/Glass Filled Grades - Thermal, Electrical, and General Properties · · · · · · · · · · · · · · · · · · · · · 2-15
Mechanical Properties · · · · · · · · · · · · · · · · · · · · · · · · · · · · · · · · · · · · · · · · · · · · · · · · · · · · · · · · · · · · · · · 3-1Short-term Mechanical Properties - - - - - - - - - - - - - - - - - - - - - - - - - - - - - - - - - - - - - - - - - - - - - - - - - - - - - - 3-1
Tensile Properties · · · · · · · · · · · · · · · · · · · · · · · · · · · · · · · · · · · · · · · · · · · · · · · · · · · · · · · · · · · · · · · · · · · · · · · · · · · · · · · · · 3-1Test Methods · · · · · · · · · · · · · · · · · · · · · · · · · · · · · · · · · · · · · · · · · · · · · · · · · · · · · · · · · · · · · · · · · · · · · · · · · · · · · · · · · · 3-1Tensile Property Comparison · · · · · · · · · · · · · · · · · · · · · · · · · · · · · · · · · · · · · · · · · · · · · · · · · · · · · · · · · · · · · · · · · · · · · · 3-2Tensile Properties for GR PPA vs. Temperature · · · · · · · · · · · · · · · · · · · · · · · · · · · · · · · · · · · · · · · · · · · · · · · · · · · · · · · · · 3-3Tensile Properties of A-1000 GR Grades at Elevated Temperatures· · · · · · · · · · · · · · · · · · · · · · · · · · · · · · · · · · · · · · · · · · 3-4
Flexural Properties · · · · · · · · · · · · · · · · · · · · · · · · · · · · · · · · · · · · · · · · · · · · · · · · · · · · · · · · · · · · · · · · · · · · · · · · · · · · · · · · 3-5Test methods · · · · · · · · · · · · · · · · · · · · · · · · · · · · · · · · · · · · · · · · · · · · · · · · · · · · · · · · · · · · · · · · · · · · · · · · · · · · · · · · · · 3-5Flexural Property Comparison · · · · · · · · · · · · · · · · · · · · · · · · · · · · · · · · · · · · · · · · · · · · · · · · · · · · · · · · · · · · · · · · · · · · · · 3-5Flexural Properties at Elevated Temperatures · · · · · · · · · · · · · · · · · · · · · · · · · · · · · · · · · · · · · · · · · · · · · · · · · · · · · · · · · · 3-6
Shear Properties · · · · · · · · · · · · · · · · · · · · · · · · · · · · · · · · · · · · · · · · · · · · · · · · · · · · · · · · · · · · · · · · · · · · · · · · · · · · · · · · · · 3-7Compressive Strength and Modulus · · · · · · · · · · · · · · · · · · · · · · · · · · · · · · · · · · · · · · · · · · · · · · · · · · · · · · · · · · · · · · · · · · · 3-8Impact Strength · · · · · · · · · · · · · · · · · · · · · · · · · · · · · · · · · · · · · · · · · · · · · · · · · · · · · · · · · · · · · · · · · · · · · · · · · · · · · · · · · · 3-9
Izod (Cantilevered Beam) Impact· · · · · · · · · · · · · · · · · · · · · · · · · · · · · · · · · · · · · · · · · · · · · · · · · · · · · · · · · · · · · · · · · · · · 3-9Izod Impact Property Comparison · · · · · · · · · · · · · · · · · · · · · · · · · · · · · · · · · · · · · · · · · · · · · · · · · · · · · · · · · · · · · · · · · · · 3-9Charpy (Supported Beam) Impact · · · · · · · · · · · · · · · · · · · · · · · · · · · · · · · · · · · · · · · · · · · · · · · · · · · · · · · · · · · · · · · · · · 3-10Falling Weight Impact Properties· · · · · · · · · · · · · · · · · · · · · · · · · · · · · · · · · · · · · · · · · · · · · · · · · · · · · · · · · · · · · · · · · · · 3-11
Poisson’s Ratio · · · · · · · · · · · · · · · · · · · · · · · · · · · · · · · · · · · · · · · · · · · · · · · · · · · · · · · · · · · · · · · · · · · · · · · · · · · · · · · · · · 3-11Long-term Mechanical Properties - - - - - - - - - - - - - - - - - - - - - - - - - - - - - - - - - - - - - - - - - - - - - - - - - - - - - - 4-1
Creep · · · · · · · · · · · · · · · · · · · · · · · · · · · · · · · · · · · · · · · · · · · · · · · · · · · · · · · · · · · · · · · · · · · · · · · · · · · · · · · · · · · · · · · · · · 4-2Tensile Creep · · · · · · · · · · · · · · · · · · · · · · · · · · · · · · · · · · · · · · · · · · · · · · · · · · · · · · · · · · · · · · · · · · · · · · · · · · · · · · · · · · 4-3Isochronous Stress/Strain Curves · · · · · · · · · · · · · · · · · · · · · · · · · · · · · · · · · · · · · · · · · · · · · · · · · · · · · · · · · · · · · · · · · · · 4-4Tensile Creep Rupture · · · · · · · · · · · · · · · · · · · · · · · · · · · · · · · · · · · · · · · · · · · · · · · · · · · · · · · · · · · · · · · · · · · · · · · · · · · 4-5Flexural Creep· · · · · · · · · · · · · · · · · · · · · · · · · · · · · · · · · · · · · · · · · · · · · · · · · · · · · · · · · · · · · · · · · · · · · · · · · · · · · · · · · · 4-5Compressive Creep· · · · · · · · · · · · · · · · · · · · · · · · · · · · · · · · · · · · · · · · · · · · · · · · · · · · · · · · · · · · · · · · · · · · · · · · · · · · · · 4-6
Fatigue Resistance · · · · · · · · · · · · · · · · · · · · · · · · · · · · · · · · · · · · · · · · · · · · · · · · · · · · · · · · · · · · · · · · · · · · · · · · · · · · · · · · 4-6Fatigue Strength of AMODEL resin · · · · · · · · · · · · · · · · · · · · · · · · · · · · · · · · · · · · · · · · · · · · · · · · · · · · · · · · · · · · · · · · · · 4-6
Moisture Effects · · · · · · · · · · · · · · · · · · · · · · · · · · · · · · · · · · · · · · · · · · · · · · · · · · · · · · · · · · · · · · · · · · · · · · · · · · · · · · · · · · 4-8Significance of Moisture Absorption · · · · · · · · · · · · · · · · · · · · · · · · · · · · · · · · · · · · · · · · · · · · · · · · · · · · · · · · · · · · · · · · · 4-8Moisture Absorption and Glass Transition Temperature (Tg) · · · · · · · · · · · · · · · · · · · · · · · · · · · · · · · · · · · · · · · · · · · · · · · 4-8Absorption Amount · · · · · · · · · · · · · · · · · · · · · · · · · · · · · · · · · · · · · · · · · · · · · · · · · · · · · · · · · · · · · · · · · · · · · · · · · · · · · · 4-9
i
Effect of Moisture on Strength and Stiffness · · · · · · · · · · · · · · · · · · · · · · · · · · · · · · · · · · · · · · · · · · · · · · · · · · · · · · · · · · · 4-9Dimensional Change due to Moisture · · · · · · · · · · · · · · · · · · · · · · · · · · · · · · · · · · · · · · · · · · · · · · · · · · · · · · · · · · · · · · · · 4-9Dimensional Change Compared to PA 66 · · · · · · · · · · · · · · · · · · · · · · · · · · · · · · · · · · · · · · · · · · · · · · · · · · · · · · · · · · · · 4-10
Thermal Properties · · · · · · · · · · · · · · · · · · · · · · · · · · · · · · · · · · · · · · · · · · · · · · · · · · · · · · · · · · · · · · · · · · 5-1Heat Deflection Temperature - HDT · · · · · · · · · · · · · · · · · · · · · · · · · · · · · · · · · · · · · · · · · · · · · · · · · · · · · · · · · · · · · · · · · · · 5-1
Deflection Temperature Values for AMODEL Resins· · · · · · · · · · · · · · · · · · · · · · · · · · · · · · · · · · · · · · · · · · · · · · · · · · · · · · 5-2Coefficient of Linear Thermal Expansion · · · · · · · · · · · · · · · · · · · · · · · · · · · · · · · · · · · · · · · · · · · · · · · · · · · · · · · · · · · · · · · · 5-2Thermal Conductivity · · · · · · · · · · · · · · · · · · · · · · · · · · · · · · · · · · · · · · · · · · · · · · · · · · · · · · · · · · · · · · · · · · · · · · · · · · · · · · 5-4
Thermal Conductivity of AMODEL PPA Resins · · · · · · · · · · · · · · · · · · · · · · · · · · · · · · · · · · · · · · · · · · · · · · · · · · · · · 5-4Specific Heat· · · · · · · · · · · · · · · · · · · · · · · · · · · · · · · · · · · · · · · · · · · · · · · · · · · · · · · · · · · · · · · · · · · · · · · · · · · · · · · · · · · · · 5-5Thermal Stability · · · · · · · · · · · · · · · · · · · · · · · · · · · · · · · · · · · · · · · · · · · · · · · · · · · · · · · · · · · · · · · · · · · · · · · · · · · · · · · · · · 5-6
Thermogravimetric Analysis (TGA)· · · · · · · · · · · · · · · · · · · · · · · · · · · · · · · · · · · · · · · · · · · · · · · · · · · · · · · · · · · · · · · · · · · 5-6Thermal Aging · · · · · · · · · · · · · · · · · · · · · · · · · · · · · · · · · · · · · · · · · · · · · · · · · · · · · · · · · · · · · · · · · · · · · · · · · · · · · · · · · 5-6Relative Thermal Index (UL)· · · · · · · · · · · · · · · · · · · · · · · · · · · · · · · · · · · · · · · · · · · · · · · · · · · · · · · · · · · · · · · · · · · · · · · · 5-6
Combustion Properties · · · · · · · · · · · · · · · · · · · · · · · · · · · · · · · · · · · · · · · · · · · · · · · · · · · · · · · · · · · · · · · · · · · · · · · · · · · · · 5-8Glow Wire Testing· · · · · · · · · · · · · · · · · · · · · · · · · · · · · · · · · · · · · · · · · · · · · · · · · · · · · · · · · · · · · · · · · · · · · · · · · · · · · · · 5-8
Relative Thermal Indices of AMODEL PPA Grades · · · · · · · · · · · · · · · · · · · · · · · · · · · · · · · · · · · · · · · · · · · · · · · · · · 5-8Smoke Density Test (NBS) · · · · · · · · · · · · · · · · · · · · · · · · · · · · · · · · · · · · · · · · · · · · · · · · · · · · · · · · · · · · · · · · · · · · · · · · 5-9Vertical Flammability per UL 94· · · · · · · · · · · · · · · · · · · · · · · · · · · · · · · · · · · · · · · · · · · · · · · · · · · · · · · · · · · · · · · · · · · · 5-10
Horizontal Burning Test · · · · · · · · · · · · · · · · · · · · · · · · · · · · · · · · · · · · · · · · · · · · · · · · · · · · · · · · · · · · · · · · · · · · · · · · 5-1020 MM Vertical Burn Test · · · · · · · · · · · · · · · · · · · · · · · · · · · · · · · · · · · · · · · · · · · · · · · · · · · · · · · · · · · · · · · · · · · · · · 5-10500 W Vertical Burning Test · · · · · · · · · · · · · · · · · · · · · · · · · · · · · · · · · · · · · · · · · · · · · · · · · · · · · · · · · · · · · · · · · · · · 5-10
UL94 Ratings of AMODEL PPA Grades· · · · · · · · · · · · · · · · · · · · · · · · · · · · · · · · · · · · · · · · · · · · · · · · · · · · · · · · · · 5-11
Electrical Properties · · · · · · · · · · · · · · · · · · · · · · · · · · · · · · · · · · · · · · · · · · · · · · · · · · · · · · · · · · · · · · · · · 6-1Dielectric Breakdown Voltage and Strength - ASTM D 149 · · · · · · · · · · · · · · · · · · · · · · · · · · · · · · · · · · · · · · · · · · · · · · · · 6-1Volume Resistivity - ASTM D 257 · · · · · · · · · · · · · · · · · · · · · · · · · · · · · · · · · · · · · · · · · · · · · · · · · · · · · · · · · · · · · · · · · · · 6-1Surface Resistivity - ASTM D 257 · · · · · · · · · · · · · · · · · · · · · · · · · · · · · · · · · · · · · · · · · · · · · · · · · · · · · · · · · · · · · · · · · · · 6-1Dielectric Constant - ASTM D 150· · · · · · · · · · · · · · · · · · · · · · · · · · · · · · · · · · · · · · · · · · · · · · · · · · · · · · · · · · · · · · · · · · · 6-2Dissipation Factor - ASTM D 150 · · · · · · · · · · · · · · · · · · · · · · · · · · · · · · · · · · · · · · · · · · · · · · · · · · · · · · · · · · · · · · · · · · · 6-2
UL 746A Short-Term Properties · · · · · · · · · · · · · · · · · · · · · · · · · · · · · · · · · · · · · · · · · · · · · · · · · · · · · · · · · · · · · · · · · · · · · · 6-2High-Voltage, Low-Current, Dry Arc Resistance - ASTM D 495 · · · · · · · · · · · · · · · · · · · · · · · · · · · · · · · · · · · · · · · · · · · · · 6-2Comparative Tracking Index (CTI) - ASTM D 3638· · · · · · · · · · · · · · · · · · · · · · · · · · · · · · · · · · · · · · · · · · · · · · · · · · · · · · · 6-3High-Voltage Arc-Tracking-Rate (HVTR) · · · · · · · · · · · · · · · · · · · · · · · · · · · · · · · · · · · · · · · · · · · · · · · · · · · · · · · · · · · · · · 6-3Hot Wire Ignition (HWI) - ASTM D 3874 · · · · · · · · · · · · · · · · · · · · · · · · · · · · · · · · · · · · · · · · · · · · · · · · · · · · · · · · · · · · · · · 6-3High-Current Arc Ignition (HAI) · · · · · · · · · · · · · · · · · · · · · · · · · · · · · · · · · · · · · · · · · · · · · · · · · · · · · · · · · · · · · · · · · · · · · 6-3High-Voltage Arc Resistance to Ignition · · · · · · · · · · · · · · · · · · · · · · · · · · · · · · · · · · · · · · · · · · · · · · · · · · · · · · · · · · · · · · 6-4UL 746A Properties of AMODEL Resins · · · · · · · · · · · · · · · · · · · · · · · · · · · · · · · · · · · · · · · · · · · · · · · · · · · · · · · · · · · · · · · 6-4UL Relative Thermal Indices · · · · · · · · · · · · · · · · · · · · · · · · · · · · · · · · · · · · · · · · · · · · · · · · · · · · · · · · · · · · · · · · · · · · · · · 6-4
UL 746A Property PLC for AMODEL PPA Grades · · · · · · · · · · · · · · · · · · · · · · · · · · · · · · · · · · · · · · · · · · · · · · · · · · · 6-4
Environmental Resistance · · · · · · · · · · · · · · · · · · · · · · · · · · · · · · · · · · · · · · · · · · · · · · · · · · · · · · · · · · · · 7-1Chemical Resistance - - - - - - - - - - - - - - - - - - - - - - - - - - - - - - - - - - - - - - - - - - - - - - - - - - - - - - - - - - - - - - 7-1
Chemical Compatibility · · · · · · · · · · · · · · · · · · · · · · · · · · · · · · · · · · · · · · · · · · · · · · · · · · · · · · · · · · · · · · · · · · · · · · · · · · · · · 7-5Gamma Radiation - - - - - - - - - - - - - - - - - - - - - - - - - - - - - - - - - - - - - - - - - - - - - - - - - - - - - - - - - - - - - - - - 7-6
Design Information · · · · · · · · · · · · · · · · · · · · · · · · · · · · · · · · · · · · · · · · · · · · · · · · · · · · · · · · · · · · · · · · · · 8-1Mechanical Design - - - - - - - - - - - - - - - - - - - - - - - - - - - - - - - - - - - - - - - - - - - - - - - - - - - - - - - - - - - - - - - 8-2
Maximum Stress and Deflection Equations · · · · · · · · · · · · · · · · · · · · · · · · · · · · · · · · · · · · · · · · · · · · · · · · · · · · · · · 8-3Area and Moment Equations for Selected Cross-Sections · · · · · · · · · · · · · · · · · · · · · · · · · · · · · · · · · · · · · · · · · · · · 8-4
Using Classical Stress/Strain Equations· · · · · · · · · · · · · · · · · · · · · · · · · · · · · · · · · · · · · · · · · · · · · · · · · · · · · · · · · · · · · · · · · 8-5Deflection Calculations · · · · · · · · · · · · · · · · · · · · · · · · · · · · · · · · · · · · · · · · · · · · · · · · · · · · · · · · · · · · · · · · · · · · · · · · · · · 8-6Stress calculations · · · · · · · · · · · · · · · · · · · · · · · · · · · · · · · · · · · · · · · · · · · · · · · · · · · · · · · · · · · · · · · · · · · · · · · · · · · · · · 8-6
Reinforcing FiberOrientation Considerations · · · · · · · · · · · · · · · · · · · · · · · · · · · · · · · · · · · · · · · · · · · · · · · · · · · · · · · · · · · · · · · · · · · · · · 8-6
Designing for Equivalent Part Stiffness · · · · · · · · · · · · · · · · · · · · · · · · · · · · · · · · · · · · · · · · · · · · · · · · · · · · · · · · · · · · · · · 8-7Changing Section Thickness · · · · · · · · · · · · · · · · · · · · · · · · · · · · · · · · · · · · · · · · · · · · · · · · · · · · · · · · · · · · · · · · · · · · · 8-7
ii
Table of Contents - continued

Adding Ribs to Maintain Stiffness · · · · · · · · · · · · · · · · · · · · · · · · · · · · · · · · · · · · · · · · · · · · · · · · · · · · · · · · · · · · · · · · · 8-8Designing for Sustained Load · · · · · · · · · · · · · · · · · · · · · · · · · · · · · · · · · · · · · · · · · · · · · · · · · · · · · · · · · · · · · · · · · · · · · · · · 8-9
Calculating Deflection · · · · · · · · · · · · · · · · · · · · · · · · · · · · · · · · · · · · · · · · · · · · · · · · · · · · · · · · · · · · · · · · · · · · · · · · · · · · 8-9Calculating Allowable Stress - Creep Rupture · · · · · · · · · · · · · · · · · · · · · · · · · · · · · · · · · · · · · · · · · · · · · · · · · · · · · · · · · 8-10
Considering Stress Concentrations · · · · · · · · · · · · · · · · · · · · · · · · · · · · · · · · · · · · · · · · · · · · · · · · · · · · · · · · · · · · · · · · · · · 8-11Considering Thermal Stresses· · · · · · · · · · · · · · · · · · · · · · · · · · · · · · · · · · · · · · · · · · · · · · · · · · · · · · · · · · · · · · · · · · · · · · · 8-12
Loss of Bolt Tightness Due to Creep · · · · · · · · · · · · · · · · · · · · · · · · · · · · · · · · · · · · · · · · · · · · · · · · · · · · · · · · · · · · · · · · 8-13Designing for Assembly- - - - - - - - - - - - - - - - - - - - - - - - - - - - - - - - - - - - - - - - - - - - - - - - - - - - - - - - - - - - 8-14
Interference or Press Fits · · · · · · · · · · · · · · · · · · · · · · · · · · · · · · · · · · · · · · · · · · · · · · · · · · · · · · · · · · · · · · · · · · · · · · · · · · 8-14Calculating the Allowable Interference · · · · · · · · · · · · · · · · · · · · · · · · · · · · · · · · · · · · · · · · · · · · · · · · · · · · · · · · · · · · · · 8-14
Mechanical Fasteners · · · · · · · · · · · · · · · · · · · · · · · · · · · · · · · · · · · · · · · · · · · · · · · · · · · · · · · · · · · · · · · · · · · · · · · · · · · · · 8-15Self-tapping Screws · · · · · · · · · · · · · · · · · · · · · · · · · · · · · · · · · · · · · · · · · · · · · · · · · · · · · · · · · · · · · · · · · · · · · · · · · · · · 8-15Improving Torque Retention · · · · · · · · · · · · · · · · · · · · · · · · · · · · · · · · · · · · · · · · · · · · · · · · · · · · · · · · · · · · · · · · · · · · · · 8-16Tightening Torque· · · · · · · · · · · · · · · · · · · · · · · · · · · · · · · · · · · · · · · · · · · · · · · · · · · · · · · · · · · · · · · · · · · · · · · · · · · · · · 8-16Pull out force calculation· · · · · · · · · · · · · · · · · · · · · · · · · · · · · · · · · · · · · · · · · · · · · · · · · · · · · · · · · · · · · · · · · · · · · · · · · 8-16Threaded Inserts· · · · · · · · · · · · · · · · · · · · · · · · · · · · · · · · · · · · · · · · · · · · · · · · · · · · · · · · · · · · · · · · · · · · · · · · · · · · · · · 8-17Molded-in Threads · · · · · · · · · · · · · · · · · · · · · · · · · · · · · · · · · · · · · · · · · · · · · · · · · · · · · · · · · · · · · · · · · · · · · · · · · · · · · 8-18Designing with Snap Fits · · · · · · · · · · · · · · · · · · · · · · · · · · · · · · · · · · · · · · · · · · · · · · · · · · · · · · · · · · · · · · · · · · · · · · · · 8-18
Straight Cantilever Beam Equation · · · · · · · · · · · · · · · · · · · · · · · · · · · · · · · · · · · · · · · · · · · · · · · · · · · · · · · · · · · · · · · 8-18Tapered Cantilever Beam Equation · · · · · · · · · · · · · · · · · · · · · · · · · · · · · · · · · · · · · · · · · · · · · · · · · · · · · · · · · · · · · · · 8-19
Designing for Injection Molding- - - - - - - - - - - - - - - - - - - - - - - - - - - - - - - - - - - - - - - - - - - - - - - - - - - - - - - 8-20Wall Thickness · · · · · · · · · · · · · · · · · · · · · · · · · · · · · · · · · · · · · · · · · · · · · · · · · · · · · · · · · · · · · · · · · · · · · · · · · · · · · · · · · · 8-20Wall Thickness Variation · · · · · · · · · · · · · · · · · · · · · · · · · · · · · · · · · · · · · · · · · · · · · · · · · · · · · · · · · · · · · · · · · · · · · · · · · · · 8-20Draft Angle · · · · · · · · · · · · · · · · · · · · · · · · · · · · · · · · · · · · · · · · · · · · · · · · · · · · · · · · · · · · · · · · · · · · · · · · · · · · · · · · · · · · · 8-21Ribs · · · · · · · · · · · · · · · · · · · · · · · · · · · · · · · · · · · · · · · · · · · · · · · · · · · · · · · · · · · · · · · · · · · · · · · · · · · · · · · · · · · · · · · · · · 8-21Coring· · · · · · · · · · · · · · · · · · · · · · · · · · · · · · · · · · · · · · · · · · · · · · · · · · · · · · · · · · · · · · · · · · · · · · · · · · · · · · · · · · · · · · · · · 8-22Bosses · · · · · · · · · · · · · · · · · · · · · · · · · · · · · · · · · · · · · · · · · · · · · · · · · · · · · · · · · · · · · · · · · · · · · · · · · · · · · · · · · · · · · · · · 8-22Undercuts · · · · · · · · · · · · · · · · · · · · · · · · · · · · · · · · · · · · · · · · · · · · · · · · · · · · · · · · · · · · · · · · · · · · · · · · · · · · · · · · · · · · · · 8-23
Secondary Operations · · · · · · · · · · · · · · · · · · · · · · · · · · · · · · · · · · · · · · · · · · · · · · · · · · · · · · · · · · · · · · · 9-1Welding - - - - - - - - - - - - - - - - - - - - - - - - - - - - - - - - - - - - - - - - - - - - - - - - - - - - - - - - - - - - - - - - - - - - - - 9-1
Hot Plate Welding · · · · · · · · · · · · · · · · · · · · · · · · · · · · · · · · · · · · · · · · · · · · · · · · · · · · · · · · · · · · · · · · · · · · · · · · · · · · · · · · · 9-1Vibrational Welding · · · · · · · · · · · · · · · · · · · · · · · · · · · · · · · · · · · · · · · · · · · · · · · · · · · · · · · · · · · · · · · · · · · · · · · · · · · · · · · · 9-1Spin Welding· · · · · · · · · · · · · · · · · · · · · · · · · · · · · · · · · · · · · · · · · · · · · · · · · · · · · · · · · · · · · · · · · · · · · · · · · · · · · · · · · · · · · 9-2Ultrasonic Welding · · · · · · · · · · · · · · · · · · · · · · · · · · · · · · · · · · · · · · · · · · · · · · · · · · · · · · · · · · · · · · · · · · · · · · · · · · · · · · · · 9-2
Adhesive Bonding - - - - - - - - - - - - - - - - - - - - - - - - - - - - - - - - - - - - - - - - - - - - - - - - - - - - - - - - - - - - - - - - 9-3Coatings and Surface Finishes - - - - - - - - - - - - - - - - - - - - - - - - - - - - - - - - - - - - - - - - - - - - - - - - - - - - - - - - 9-4
Vacuum Metallizing· · · · · · · · · · · · · · · · · · · · · · · · · · · · · · · · · · · · · · · · · · · · · · · · · · · · · · · · · · · · · · · · · · · · · · · · · · · · · · · · 9-4Laser Marking· · · · · · · · · · · · · · · · · · · · · · · · · · · · · · · · · · · · · · · · · · · · · · · · · · · · · · · · · · · · · · · · · · · · · · · · · · · · · · · · · · · · 9-4Inkjet Printing · · · · · · · · · · · · · · · · · · · · · · · · · · · · · · · · · · · · · · · · · · · · · · · · · · · · · · · · · · · · · · · · · · · · · · · · · · · · · · · · · · · · 9-4Painting · · · · · · · · · · · · · · · · · · · · · · · · · · · · · · · · · · · · · · · · · · · · · · · · · · · · · · · · · · · · · · · · · · · · · · · · · · · · · · · · · · · · · · · · 9-4Overmolding · · · · · · · · · · · · · · · · · · · · · · · · · · · · · · · · · · · · · · · · · · · · · · · · · · · · · · · · · · · · · · · · · · · · · · · · · · · · · · · · · · · · · 9-5
iii
Table of Contents - continued

IntroductionSolvay Advanced Polymers has a broad line of engineeringthermoplastics that offer exceptional value. The product lineincludes ACUDEL® polyphenylsulfone blends, AMODEL®
polyphthalamide, IXEF® polyarylamide, KADEL® polyketone,MINDEL® modified polysulfones, PRIMEF® polyphenylenesulfide, RADEL® A polyethersulfone, RADEL® Rpolyphenylsulfone, TORLON® polyamide-imide, UDEL®
polysulfone, and XYDAR® liquid crystal polymers.
AMODEL polyphthalamide (PPA) resins were commercializedin 1991. Polyphthalamide resin technology can produce awide range of polymers that includes both semi-crystallineand amorphous resins. Since 1991, several base polymerformulations have been commercialized to meet specificindustry needs. All of the commercial AMODEL products aresemi-crystalline.
The semi-crystalline grades of AMODEL PPA resins haveexcellent mechanical properties, outstanding dimensionalstability, exceptional elevated thermal performance, andgood processing characteristics. AMODEL resins bridge thecost/performance gap between the high-volume, moder-ate-performance engineering resins, such as thermoplasticpolyesters and aliphatic nylons, and the low-volume,high-cost specialty thermoplastics, such aspolyetheretherketone (PEEK).
The AMODEL product portfolio contains well over 100 differ-ent grades. Each grade has been designed to have a uniquebalance of properties that are important for specific applica-tion and processing requirements. Applications for AMODELPPA have been developed in a wide range of industriesincluding automotive / transportation, industrial equipment,water handling, telecommunications, electrical / electronic,coatings and composites, food service, and consumergoods.
This manual is intended to be an easy to use reference toolfor designers and fabricators interested in AMODEL PPA as asolution to their material needs. It includes property data forselect grades of the portfolio as well as part design and pro-cessing recommendations.
Chemistry
AMODEL resins are classified in the general chemical familyknown as polyamides. Polyamides may be produced by thereaction of a difunctional organic acid with a difunctionalamine, or the self-condensation of either an ω-amino acidor a lactam. Polyamides can be produced from a wide vari-ety of acids and amines, and a number of polyamides arecommercially important.
A naming convention for polyamides has evolved. The con-vention is to name the polyamide using the number of car-bon atoms in the monomers with the diamine component
first. Thus, a polyamide made from hexamethylene diamineand adipic acid is called polyamide 66 or nylon 66, and onemade from hexamethylene diamine and dodecanedioic acidwould be nylon 6,12.
When an aromatic diacid is used instead of an aliphaticdiacid, the nomenclature is modified to reflect the isomericform of the aromatic diacid, and the term polyphthalamidemay be used to distinguish these polymers from those ofsolely aliphatic raw materials.
Polyamide 6,T produced by the condensation ofhexamethylene diamine with terephthalic acid, has longbeen recognized for its excellent dimensional stability, lowmoisture absorption, high strength, and heat resistance. Thefundamental problem preventing its commercialization hasbeen that its high crystalline melting point of 370°C (698°F)is above its thermal decomposition temperature. Therefore,it cannot be processed by most conventional melt process-ing techniques, such as injection molding or extrusion. Inaddition, its melting point, among other factors, complicatesthe polymerization process.
The basic polyamide 6,T technology has been modified byadding comonomers to produce the AMODEL family ofpolyphthalamide (PPA) resins which are composed of propri-etary compositions of matter. Varying the amount and natureof the comonomers leads to a family of resins. All of theseresins have melting points lower than polyamide 6,T andexhibit rapid crystallization. The thermal properties of theAMODEL PPA base resins are shown in Table 1-1.
These base resins when combined with mineral, glass-fiber,and/or other compounding ingredients provide a wide rangeof injection molding compounds that offer an excellent bal-ance of processing and thermal/mechanical performance.Compounds based on A-1000 base resin require moldsusing oil for temperature control, but compounds based onthe other base resins can be processed using water con-trolled molds.
CrystallinityThermoplastics are often divided into two classes, amor-phous and semi-crystalline. One of the major differencesbetween amorphous and semi-crystalline polymers is theway their properties change in response to changes in
1– 1 Solvay Advanced Polymers, L.L.C.
Base Tg Tm
Resin °C °F °C °FA-1000 123 253 313 595
A-4000 100 212 325 617
A-5000 89 192 294 561
A-6000 88 190 310 590
Table 1-1
AMODEL PPA Base Resin Properties

temperature. Figure 1-1 shows a typical response ofmodulus to temperature change for amorphous andsemi-crystalline polymers.
When the temperature is raised, the modulus of amorphouspolymers generally decreases slowly until the glass transi-tion temperature ( Tg ) is reached. At temperatures abovethe Tg, the modulus decreases rapidly. Therefore, amor-phous thermoplastics are rarely used at temperatureshigher than their glass transition temperature.
In the case of semi-crystalline polymers, the modulus alsogradually decreases with increasing temperature. At or nearthe glass transition temperature, the modulus decreasesrapidly to a lower but still useful level. Continuing toincrease the temperature causes the modulus to remain ator near this new level (the crystalline plateau) until the melt-ing point temperature (Tm ) is reached. At Tm, the modulusdecreases rapidly again. Semi-crystalline polymers are oftenused at temperatures above their glass transition tempera-tures, but below their melting points, particularly when theyare modified with glass fibers and/or mineral fillers.
When semi-crystalline polymers are processed, the amountof crystallinity can be affected by processing conditions. Forexample, AMODEL A-1000 PPA based products require moldsurface temperatures of at least 135°C (275°F) for develop-ment of the maximum amount of crystallinity during injec-tion molding. Products based on AMODEL A-4000 or A-6000base resin will give high crystallinity at mold temperaturesof about 80°C (176°F).
Above the Tm, a semi-crystalline polymer melts, changingfrom the solid state to the liquid state.
The thermal capability of a semi-crystalline polymer isdefined to a large extent by its Tg and Tm, as these valuesindicate the temperature ranges where the polymer hashigh stiffness (below Tg), moderate stiffness (between Tgand Tm), or no useful stiffness (above Tm). Figure 1-2shows the modulus versus temperature behavior of theAMODEL base resins as measured by dynamic mechanicalanalysis (DMA).
AMODEL PPA Design Guide 1– 2 Chemistry
Figure 1-1
Modulus Changes with Temperature
Figure 1-2
Modulus versus Temperature for AMODEL Base Resins

Moisture EffectsLike other polymers, polyphthalamide resins absorbs mois-ture from the environment. In general, polyphthalamides willabsorb less water than aliphatic polyamides, like PA 66, andthey will absorb the moisture at a slower rate.
When an article made from AMODEL grade based onA-1000 base resin reaches equilibrium with a 100% relativehumidity (RH) atmosphere, the increase in weight due tomoisture absorption will be roughly 5 to 6 percent of thepolyphthalamide resin weight.
Figure 1-3 compares the glass transition temperatures ofAMODEL A-1000 resin and PA 66 at a range of moisturecontents. These materials absorb moisture at different ratesand they have different maximum moisture adsorptionamounts. The most useful and practical comparison isachieved by plotting the Tg versus the equilibrium moisturecontent at various relative humidities.
Comparing dry PA 66 to dry AMODEL A-1000 resin,AMODEL resin has a Tg advantage of about 60°C (108°F). Ifthe comparison is made at the 50% RH equivalent moisturecontent, the Tg advantage of AMODEL resin is about 89°C(160°F). The exceptional dimensional stability and propertyretention of AMODEL polyphthalamide is due largely to thehigher Tg and the fact that the Tg remains well above roomtemperature, even at the moisture content appropriate for100% RH. The Tg of PA 66, on the other hand, falls to -15°C(5°F) at moisture contents consistent with equilibria at 50 to60% RH.
Figure 1-4 compares the dimensional change of AMODELA-1000 resin to that of PA 66 after being immersed in waterat 23°C (73°F). Results shown are for 3.2 mm (0.125 in.)thick plaques. After one year (about 8,800 hours), thedimensional change of the PA resin is approximately threetimes that of the PPA resin.
Not only do polyphthalamides absorb less moisture thantypical polyamides, they do so much more slowly. The diffu-sion coefficient for water in AMODEL A-1000 resin isapproximately 20% of that for PA 66 at 23°C (73°F).
Crystallinity 1– 3 Solvay Advanced Polymers, L.L.C.
Figure 1-3
Effect of Moisture Content on Tg
Figure 1-4
Dimension Change vs. Water Immersion Time
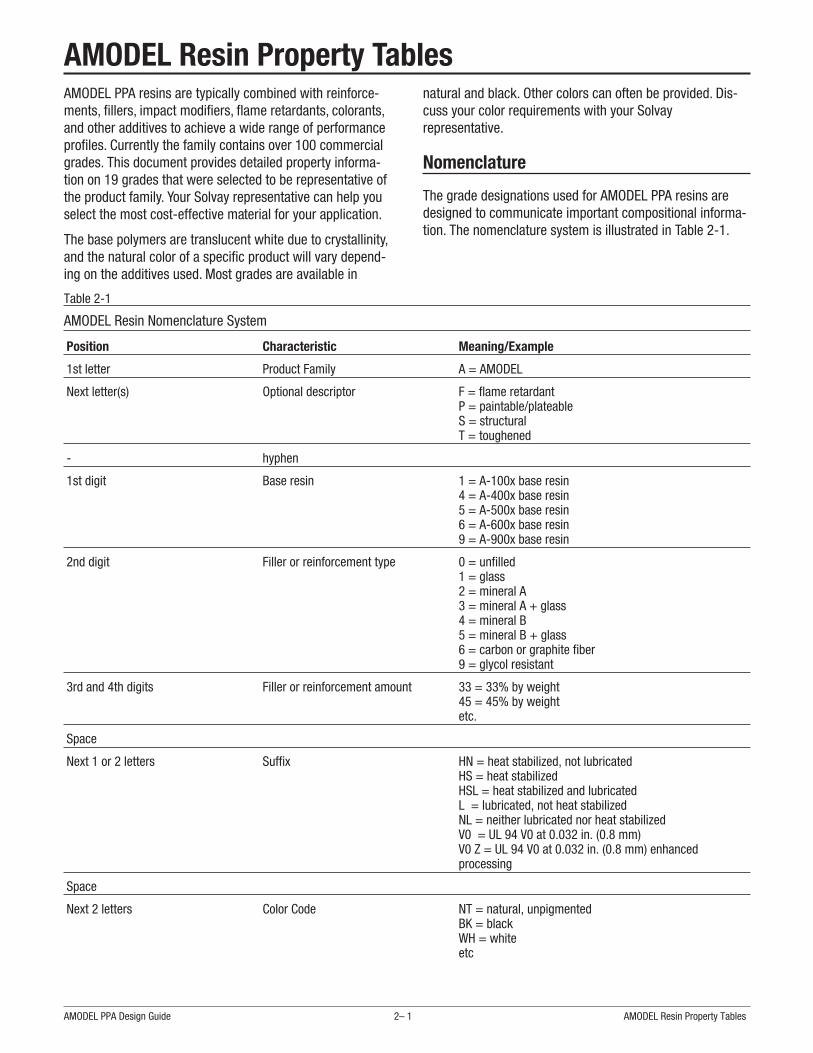
AMODEL Resin Property TablesAMODEL PPA resins are typically combined with reinforce-ments, fillers, impact modifiers, flame retardants, colorants,and other additives to achieve a wide range of performanceprofiles. Currently the family contains over 100 commercialgrades. This document provides detailed property informa-tion on 19 grades that were selected to be representative ofthe product family. Your Solvay representative can help youselect the most cost-effective material for your application.
The base polymers are translucent white due to crystallinity,and the natural color of a specific product will vary depend-ing on the additives used. Most grades are available in
natural and black. Other colors can often be provided. Dis-cuss your color requirements with your Solvayrepresentative.
Nomenclature
The grade designations used for AMODEL PPA resins aredesigned to communicate important compositional informa-tion. The nomenclature system is illustrated in Table 2-1.
AMODEL PPA Design Guide 2– 1 AMODEL Resin Property Tables
Position Characteristic Meaning/Example
1st letter Product Family A = AMODEL
Next letter(s) Optional descriptor F = flame retardantP = paintable/plateableS = structuralT = toughened
- hyphen
1st digit Base resin 1 = A-100x base resin4 = A-400x base resin5 = A-500x base resin6 = A-600x base resin9 = A-900x base resin
2nd digit Filler or reinforcement type 0 = unfilled1 = glass2 = mineral A3 = mineral A + glass4 = mineral B5 = mineral B + glass6 = carbon or graphite fiber9 = glycol resistant
3rd and 4th digits Filler or reinforcement amount 33 = 33% by weight45 = 45% by weightetc.
Space
Next 1 or 2 letters Suffix HN = heat stabilized, not lubricatedHS = heat stabilizedHSL = heat stabilized and lubricatedL = lubricated, not heat stabilizedNL = neither lubricated nor heat stabilizedV0 = UL 94 V0 at 0.032 in. (0.8 mm)V0 Z = UL 94 V0 at 0.032 in. (0.8 mm) enhancedprocessing
Space
Next 2 letters Color Code NT = natural, unpigmentedBK = blackWH = whiteetc
Table 2-1
AMODEL Resin Nomenclature System
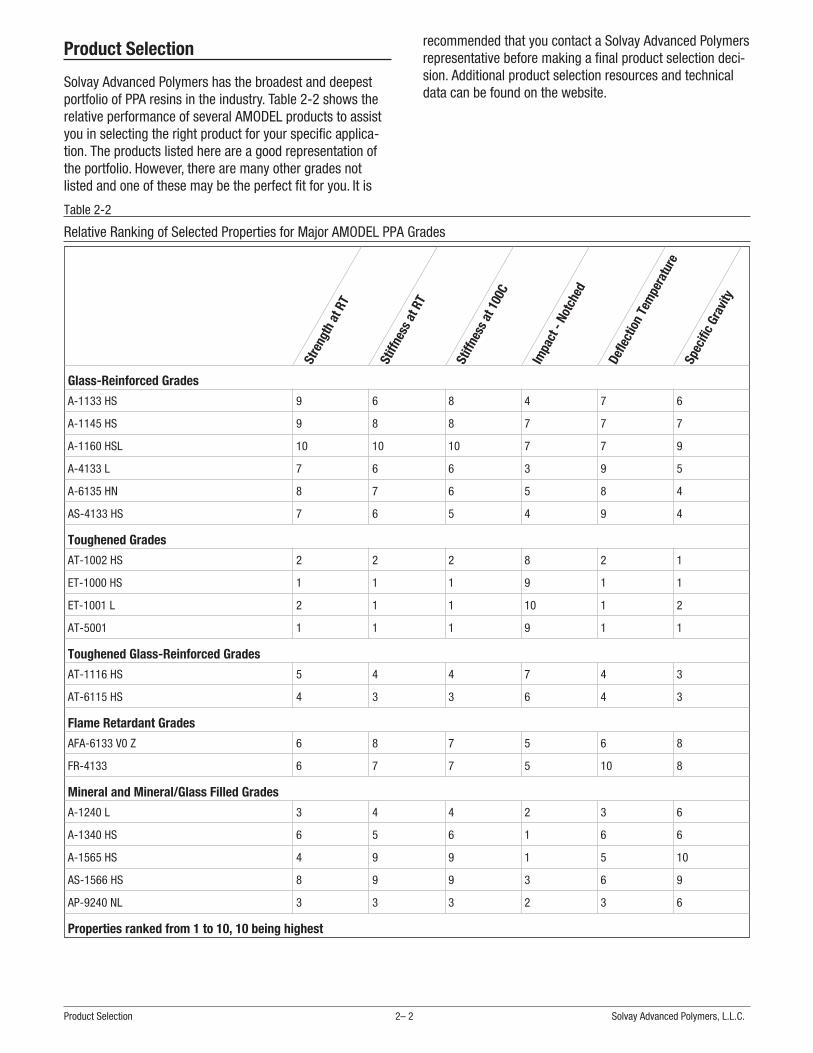
Product Selection
Solvay Advanced Polymers has the broadest and deepestportfolio of PPA resins in the industry. Table 2-2 shows therelative performance of several AMODEL products to assistyou in selecting the right product for your specific applica-tion. The products listed here are a good representation ofthe portfolio. However, there are many other grades notlisted and one of these may be the perfect fit for you. It is
recommended that you contact a Solvay Advanced Polymersrepresentative before making a final product selection deci-sion. Additional product selection resources and technicaldata can be found on the website.
Product Selection 2– 2 Solvay Advanced Polymers, L.L.C.
Stre
ngth
atRT
Stiff
ness
atRT
Stiff
ness
at10
0C
Impa
ct- N
otch
ed
Defle
ctio
nTe
mpe
ratu
reSp
ecifi
cGr
avity
Glass-Reinforced Grades
A-1133 HS 9 6 8 4 7 6
A-1145 HS 9 8 8 7 7 7
A-1160 HSL 10 10 10 7 7 9
A-4133 L 7 6 6 3 9 5
A-6135 HN 8 7 6 5 8 4
AS-4133 HS 7 6 5 4 9 4
Toughened Grades
AT-1002 HS 2 2 2 8 2 1
ET-1000 HS 1 1 1 9 1 1
ET-1001 L 2 1 1 10 1 2
AT-5001 1 1 1 9 1 1
Toughened Glass-Reinforced Grades
AT-1116 HS 5 4 4 7 4 3
AT-6115 HS 4 3 3 6 4 3
Flame Retardant Grades
AFA-6133 V0 Z 6 8 7 5 6 8
FR-4133 6 7 7 5 10 8
Mineral and Mineral/Glass Filled Grades
A-1240 L 3 4 4 2 3 6
A-1340 HS 6 5 6 1 6 6
A-1565 HS 4 9 9 1 5 10
AS-1566 HS 8 9 9 3 6 9
AP-9240 NL 3 3 3 2 3 6
Properties ranked from 1 to 10, 10 being highest
Table 2-2
Relative Ranking of Selected Properties for Major AMODEL PPA Grades
Typical Property Tables
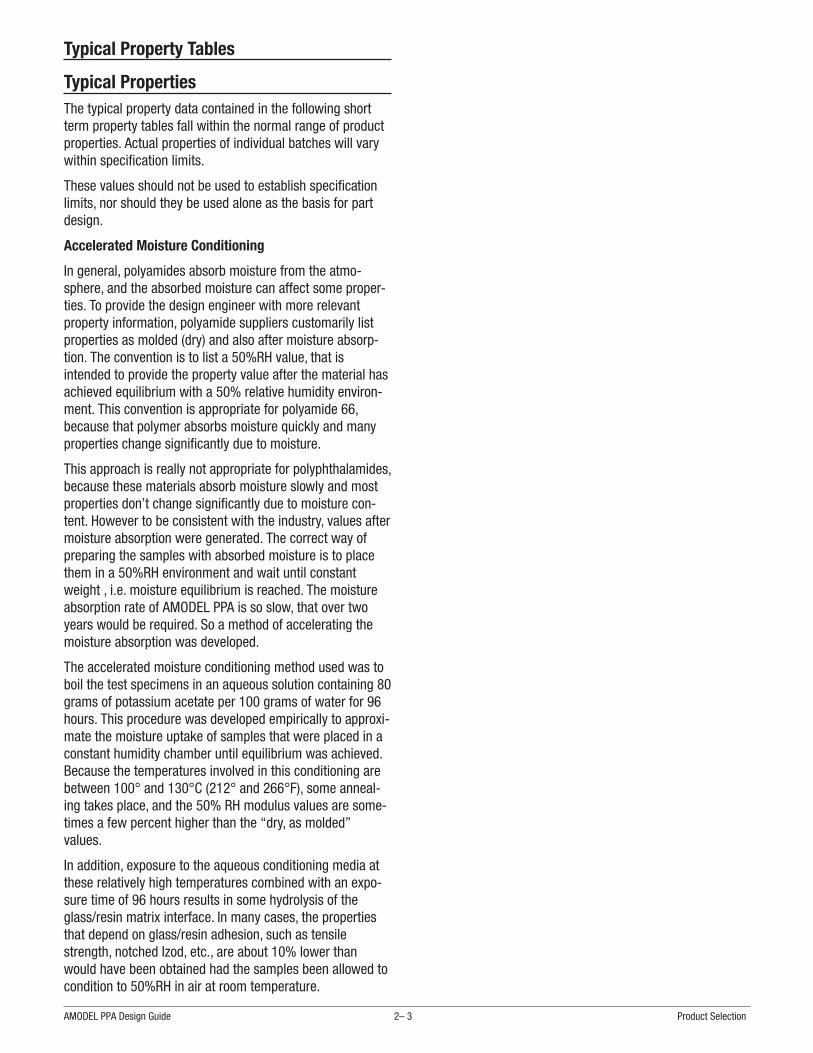
Typical PropertiesThe typical property data contained in the following shortterm property tables fall within the normal range of productproperties. Actual properties of individual batches will varywithin specification limits.
These values should not be used to establish specificationlimits, nor should they be used alone as the basis for partdesign.
Accelerated Moisture Conditioning
In general, polyamides absorb moisture from the atmo-sphere, and the absorbed moisture can affect some proper-ties. To provide the design engineer with more relevantproperty information, polyamide suppliers customarily listproperties as molded (dry) and also after moisture absorp-tion. The convention is to list a 50%RH value, that isintended to provide the property value after the material hasachieved equilibrium with a 50% relative humidity environ-ment. This convention is appropriate for polyamide 66,because that polymer absorbs moisture quickly and manyproperties change significantly due to moisture.
This approach is really not appropriate for polyphthalamides,because these materials absorb moisture slowly and mostproperties don’t change significantly due to moisture con-tent. However to be consistent with the industry, values aftermoisture absorption were generated. The correct way ofpreparing the samples with absorbed moisture is to placethem in a 50%RH environment and wait until constantweight , i.e. moisture equilibrium is reached. The moistureabsorption rate of AMODEL PPA is so slow, that over twoyears would be required. So a method of accelerating themoisture absorption was developed.
The accelerated moisture conditioning method used was toboil the test specimens in an aqueous solution containing 80grams of potassium acetate per 100 grams of water for 96hours. This procedure was developed empirically to approxi-mate the moisture uptake of samples that were placed in aconstant humidity chamber until equilibrium was achieved.Because the temperatures involved in this conditioning arebetween 100° and 130°C (212° and 266°F), some anneal-ing takes place, and the 50% RH modulus values are some-times a few percent higher than the “dry, as molded”values.
In addition, exposure to the aqueous conditioning media atthese relatively high temperatures combined with an expo-sure time of 96 hours results in some hydrolysis of theglass/resin matrix interface. In many cases, the propertiesthat depend on glass/resin adhesion, such as tensilestrength, notched Izod, etc., are about 10% lower thanwould have been obtained had the samples been allowed tocondition to 50%RH in air at room temperature.
AMODEL PPA Design Guide 2– 3 Product Selection

Typical Property Tables 2-4 SOLVAY Advanced Polymers, L.L.C.
Method A-1133 A-1145 A-1160 A-4133 A-6135 AS-4133
Property Temperature ASTM ISO Units HS HS HSL L HN HS
Tensile Strength 23°C (73°F) D 638 kpsi 32.0 37.5 39.4 29.0 29.4 29.0
Tensile Strength 50%RH* 23°C (73°F) D 638 kpsi 28.0 33.0 36.5 25.0 25.5 25.0
Tensile Strength 23°C (73°F) 527 kpsi 33.8 38.1 40.8 28.0 30.6 30.6
Tensile Strength 100°C (212°F) 527 kpsi 21.5 25.1 28.5 19.4 17.6 18.1
Tensile Strength 150°C (302°F) 527 kpsi 11.5 12.3 13.4 13.0 13.4 12.7
Tensile Strength 175°C (347°F) 527 kpsi 10.4 11.0 11.1 11.7 11.9 11.5
Tensile Elongation 23°C (73°F) D 638 % 2.5 2.6 1.5 2.5 1.9 2.5
Tensile Elongation 50%RH 23°C (73°F) D 638 % 2.1 2.1 1.5 2.2 2.1 2.2
Tensile Elongation 23°C (73°F) 527 % 2.5 2.7 1.6 1.9 2.0 2.6
Tensile Elongation 100°C (212°F) 527 % 2.9 2.5 1.8 3.3 4.3 4.3
Tensile Elongation 150°C (302°F) 527 % 8.7 7.2 3.7 3.3 4.9 6.6
Tensile Elongation 175°C (347°F) 527 % 8.5 6.5 3.2 4.0 4.7 6.6
Tensile Modulus 23°C (73°F) D 638 Mpsi 1.90 2.50 3.40 1.70 2.00 1.70
Tensile Modulus 50%RH 23°C (73°F) D 638 Mpsi 1.90 2.50 3.60 1.70 1.77 1.70
Tensile Modulus 23°C (73°F) 527 Mpsi 1.94 2.44 3.73 1.78 1.67 1.83
Tensile Modulus 100°C (212°F) 527 Mpsi 1.57 1.62 2.48 1.30 1.06 0.99
Tensile Modulus 150°C (302°F) 527 Mpsi 0.97 1.16 1.41 0.93 0.91 0.77
Tensile Modulus 175°C (347°F) 527 Mpsi 0.62 0.78 1.26 0.84 0.77 0.70
Flexural Strength 23°C (73°F) D 790 kpsi 46.0 52.6 58.0 42.0 45.0 42.0
Flexural Strength 50%RH 23°C (73°F) D 790 kpsi 36.9 42.7 54.2 35.0 36.1 35.0
Flexural Strength 23°C (73°F) 178 kpsi 46.3 54.7 58.0 39.0 43.5 42.9
Flexural Strength 100°C (212°F) 178 kpsi 33.0 38.7 44.4 27.1 24.7 25.6
Flexural Strength 150°C (302°F) 178 kpsi 13.5 16.1 20.8 18.5 17.8 16.1
Flexural Strength 175°C (347°F) 178 kpsi 11.5 13.7 17.8 16.6 16.2 14.4
Flexural Modulus 23°C (73°F) D 790 Mpsi 1.65 2.00 3.15 1.78 1.65 1.60
Flexural Modulus 50%RH 23°C (73°F) D 790 Mpsi 1.65 2.00 3.16 1.78 1.59 1.60
Flexural Modulus 23°C (73°F) 178 Mpsi 1.68 2.31 2.96 1.51 1.65 1.51
Flexural Modulus 100°C (212°F) 178 Mpsi 1.42 1.89 2.68 1.12 0.96 1.04
Flexural Modulus 150°C (302°F) 178 Mpsi 0.58 0.78 1.28 0.75 0.71 0.67
Flexural Modulus 175°C (347°F) 178 Mpsi 0.52 0.71 1.16 0.71 0.67 0.61
Shear Strength 23°C (73°F) D 732 kpsi 14.7 15.6 13.6 13.0 12.7 13.0
Shear Strength 50%RH 23°C (73°F) D 732 kpsi 12.9 13.3 14.4 11.0 10.7 11.0
Compressive Strength 23°C (73°F) D 695 kpsi 26.9 28.1 27.4 23.5 21.4 26.0
Poisson’s Ratio 23°C (73°F) 0.41 0.41 0.35 0.41 0.39 0.41
Izod Impact, Notched 23°C (73°F) D 256 ft-lb/in 1.5 2.1 2.1 1.3 1.6 1.5
Izod Impact, Notched 50%RH 23°C (73°F) D 256 ft-lb/in 1.1 1.9 2.1 1.2 1.3 1.5
Izod Impact, Unnotched 23°C (73°F) D 4812 ft-lb/in 14 21 22 15 15 19
Izod Impact, Notched 23°C (73°F) 180/1A ft-lb/in2 4.2 4.9 5.9 3.9 4.3 4.6
Izod Impact, Unnotched 23°C (73°F) 180/1U ft-lb/in2 23 29 31 26 30 28
Charpy Impact 23°C (73°F) 179/1eA ft-lb/in2 4.5 4.9 6.4 3.8 4.4 5.1
Charpy Impact, Unnotched 23°C (73°F) 179/1eU ft-lb/in2 35 44 54 41 28 32
Rockwell Hardness 23°C (73°F) D 785 R 125 125 124 125 125 124
Table 2-3
Glass-Reinforced Grades - Mechanical Properties - US units

AMODEL PPA Design Guide 2-5 Typical Property Tables
Method A-1133 A-1145 A-1160 A-4133 A-6135 AS-4133
Property Temperature ASTM ISO Units HS HS HSL L HN HS
Tensile Strength 23°C (73°F) D 638 MPa 221 259 272 200 202 200
Tensile Strength 50%RH* 23°C (73°F) D 638 MPa 193 228 252 172 178 172
Tensile Strength 23°C (73°F) 527 MPa 233 263 281 193 211 211
Tensile Strength 100°C (212°F) 527 MPa 148 173 196 134 121 125
Tensile Strength 150°C (302°F) 527 MPa 80 85 93 90 93 87
Tensile Strength 175°C (347°F) 527 MPa 72 76 77 80 82 79
Tensile Elongation 23°C (73°F) D 638 % 2.5 2.6 1.5 2.5 1.9 2.5
Tensile Elongation 50%RH 23°C (73°F) D 638 % 2.1 2.1 1.5 2.2 2.1 2.2
Tensile Elongation 23°C (73°F) 527 % 2.5 2.7 1.6 1.9 2.0 2.6
Tensile Elongation 100°C (212°F) 527 % 2.9 2.5 1.8 3.3 4.3 4.3
Tensile Elongation 150°C (302°F) 527 % 8.7 7.2 3.7 3.3 4.9 6.6
Tensile Elongation 175°C (347°F) 527 % 8.5 6.5 3.2 4.0 4.7 6.6
Tensile Modulus 23°C (73°F) D 638 GPa 13.1 17.2 23.4 11.7 13.8 11.7
Tensile Modulus 50%RH 23°C (73°F) D 638 GPa 13.1 17.2 24.8 11.7 12.2 11.7
Tensile Modulus 23°C (73°F) 527 GPa 13.4 16.8 25.7 12.3 11.5 12.6
Tensile Modulus 100°C (212°F) 527 GPa 10.8 11.2 17.1 9.0 7.3 6.8
Tensile Modulus 150°C (302°F) 527 GPa 6.7 8.0 9.7 6.4 6.3 5.3
Tensile Modulus 175°C (347°F) 527 GPa 4.3 5.4 8.7 5.8 5.3 4.8
Flexural Strength 23°C (73°F) D 790 MPa 317 363 400 290 310 290
Flexural Strength 50%RH 23°C (73°F) D 790 MPa 254 294 374 241 249 241
Flexural Strength 23°C (73°F) 178 MPa 319 377 400 269 300 296
Flexural Strength 100°C (212°F) 178 MPa 227 267 306 187 171 176
Flexural Strength 150°C (302°F) 178 MPa 93 111 144 127 123 111
Flexural Strength 175°C (347°F) 178 MPa 80 95 123 115 112 100
Flexural Modulus 23°C (73°F) D 790 GPa 11.4 13.8 21.7 12.3 11.4 11.0
Flexural Modulus 50%RH 23°C (73°F) D 790 GPa 11.4 13.8 21.8 12.3 10.9 11.0
Flexural Modulus 23°C (73°F) 178 GPa 11.6 15.9 20.4 10.4 11.4 10.4
Flexural Modulus 100°C (212°F) 178 GPa 9.8 13.0 18.5 7.7 6.6 7.2
Flexural Modulus 150°C (302°F) 178 GPa 4.0 5.4 8.8 5.2 4.9 4.6
Flexural Modulus 175°C (347°F) 178 GPa 3.6 4.9 8.0 4.9 4.6 4.2
Shear Strength 23°C (73°F) D 732 MPa 101 108 94 90 88 90
Shear Strength 50%RH 23°C (73°F) D 732 MPa 89 92 99 76 74 76
Compressive Strength 23°C (73°F) D 695 MPa 185 194 189 162 148 179
Poisson’s Ratio 23°C (73°F) 0.41 0.41 0.35 0.41 0.39 0.41
Izod Impact, Notched 23°C (73°F) D 256 J/m 80 110 110 70 85 80
Izod Impact, Notched 50%RH 23°C (73°F) D 256 J/m 60 100 110 65 70 70
Izod Impact, Unnotched 23°C (73°F) D 4812 J/m 770 1105 1170 810 780 1030
Izod Impact, Notched 23°C (73°F) 180/1A kJ/m2 8.8 10.3 12.5 8.3 9.1 9.7
Izod Impact, Unnotched 23°C (73°F)) 180/1U kJ/m2 49 61 65 54 62 59
Charpy Impact 23°C (73°F) 179/1eA kJ/m2 9.5 10.3 13.4 8.1 9.2 10.7
Charpy Impact, Unnotched 23°C (73°F) 179/1eU kJ/m2 73 93 113 86 60 68
Rockwell Hardness 23°C (73°F) D785 R scale 125 125 124 125 125 124
Table 2-4
Glass-Reinforced Grades - Mechanical Properties - SI units
Typical Property Tables 2-6 SOLVAY Advanced Polymers, L.L.C.
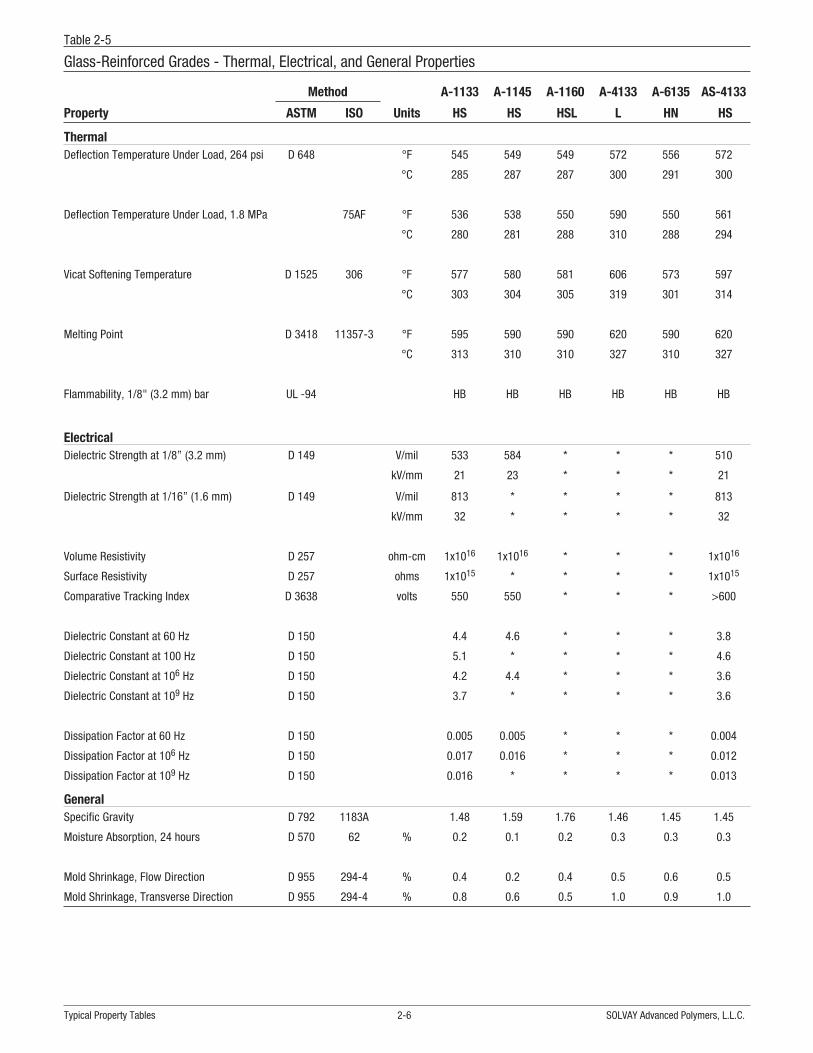
Method A-1133 A-1145 A-1160 A-4133 A-6135 AS-4133
Property ASTM ISO Units HS HS HSL L HN HS
ThermalDeflection Temperature Under Load, 264 psi D 648 °F 545 549 549 572 556 572
°C 285 287 287 300 291 300
Deflection Temperature Under Load, 1.8 MPa 75AF °F 536 538 550 590 550 561
°C 280 281 288 310 288 294
Vicat Softening Temperature D 1525 306 °F 577 580 581 606 573 597
°C 303 304 305 319 301 314
Melting Point D 3418 11357-3 °F 595 590 590 620 590 620
°C 313 310 310 327 310 327
Flammability, 1/8" (3.2 mm) bar UL -94 HB HB HB HB HB HB
ElectricalDielectric Strength at 1/8” (3.2 mm) D 149 V/mil 533 584 * * * 510
kV/mm 21 23 * * * 21
Dielectric Strength at 1/16” (1.6 mm) D 149 V/mil 813 * * * * 813
kV/mm 32 * * * * 32
Volume Resistivity D 257 ohm-cm 1x10¹⁶ 1x10¹⁶ * * * 1x10¹⁶
Surface Resistivity D 257 ohms 1x10¹⁵ * * * * 1x10¹⁵
Comparative Tracking Index D 3638 volts 550 550 * * * >600
Dielectric Constant at 60 Hz D 150 4.4 4.6 * * * 3.8
Dielectric Constant at 100 Hz D 150 5.1 * * * * 4.6
Dielectric Constant at 106 Hz D 150 4.2 4.4 * * * 3.6
Dielectric Constant at 109 Hz D 150 3.7 * * * * 3.6
Dissipation Factor at 60 Hz D 150 0.005 0.005 * * * 0.004
Dissipation Factor at 106 Hz D 150 0.017 0.016 * * * 0.012
Dissipation Factor at 109 Hz D 150 0.016 * * * * 0.013
GeneralSpecific Gravity D 792 1183A 1.48 1.59 1.76 1.46 1.45 1.45
Moisture Absorption, 24 hours D 570 62 % 0.2 0.1 0.2 0.3 0.3 0.3
Mold Shrinkage, Flow Direction D 955 294-4 % 0.4 0.2 0.4 0.5 0.6 0.5
Mold Shrinkage, Transverse Direction D 955 294-4 % 0.8 0.6 0.5 1.0 0.9 1.0
Table 2-5
Glass-Reinforced Grades - Thermal, Electrical, and General Properties

AMODEL PPA Design Guide 2-7 Typical Property Tables
Method AT-1002 ET-1000 ET-1001 AT-5001
Property Temperature ASTM ISO Units HS HS L
Tensile Strength 23°C (73°F) D 638 kpsi 12.1 10.0 11.0 8.8
Tensile Strength 50%RH* 23°C (73°F) D 638 kpsi 11.1 9.1 9.0 7.4
Tensile Stress at Yield 23°C (73°F) 527 kpsi 10.9 10.2 8.4 8.3
Tensile Stress at Break 23°C (73°F) 527 kpsi 9.9 8.7 8.0 7.7
Tensile Stress at Yield 100°C (212°F) 527 kpsi 5.6 4.9 4.6
Tensile Stress at Break 100°C (212°F) 527 kpsi 4.5
Tensile Elongation at Yield 23°C (73°F) D 638 % 5.0 6.0 6.0 5.0
Tensile Elongation at Break 23°C (73°F) D 638 % 10-12 20.0 30.0 30.0
Tensile Elongation at Break 50%RH 23°C (73°F) D 638 % 30.0 18 30.0 50.0
Tensile Strain at Yield 23°C (73°F) 527 % 5.0 5.0 6.0 5.0
Tensile Strain at Break 23°C (73°F) 527 % 10.0 7.0 15.0 15.0
Tensile Strain at Yield 100°C (212°F) 527 % 3.7 4.3 3.1 >95
Tensile Strain at Break 100°C (212°F) 527 % >95 >95 54.3
Tensile Modulus 23°C (73°F) D 638 kpsi 400 350 350 330
Tensile Modulus 50%RH 23°C (73°F) D 638 kpsi 400 350 340 360
Tensile Modulus 23°C (73°F) 527 kpsi 400 350 330 320
Tensile Modulus 100°C (212°F) 527 kpsi 305 290 260 73
Flexural Strength 23°C (73°F) D 790 kpsi 14.9 15.8 18.5 13.3
Flexural Strength 50%RH 23°C (73°F) D 790 kpsi 10.6 12.4 16.0 10.3
Flexural Strength 23°C (73°F) 178 kpsi 11.5 10.2 9.6 9.4
Flexural Strength 100°C (212°F) 178 kpsi 7.2 6.4 6.1 1.3
Flexural Modulus 23°C (73°F) D 790 kpsi 320 330 380 310
Flexural Modulus 50%RH 23°C (73°F) D 790 kpsi 330 310 380 280
Flexural Modulus 23°C (73°F) 178 kpsi 330 260 270 260
Flexural Modulus 100°C (212°F) 178 kpsi 250 190 190 60
Shear Strength 23°C (73°F) D 732 kpsi 9.3 8.5 7.7 7.7
Shear Strength 50%RH 23°C (73°F) D 732 kpsi 8.3 6.8
Poisson’s Ratio 23°C (73°F) 0.38 0.39 0.35 0.40
Izod Impact, Notched 23°C (73°F) D 256 ft-lb/in 2.4 17.0 18.0 3.0
Izod Impact, Notched 50%RH 23°C (73°F) D 256 ft-lb/in 2.6 20.0 18.0 15.0
Izod Impact, Unnotched 23°C (73°F) D 4812 ft-lb/in no break no break no break no break
Izod Impact, Notched 23°C (73°F) 180/1A ft-lb/in2 6.0 34.9 38.1 6.7
Izod Impact, Unnotched 23°C (73°F) 180/1U ft-lb/in2 84 no break no break no break
Charpy Impact 23°C (73°F) 179/1eA ft-lb/in2 6.4 36.9 no break no break
Charpy Impact, Unnotched 23°C (73°F) 179/1eU ft-lb/in2 50 no break no break no break
Rockwell Hardness 23°C (73°F) D785 R 119 120 115 116
Table 2-6
Toughened Grades - Mechanical Properties - US units

Typical Property Tables 2-8 SOLVAY Advanced Polymers, L.L.C.
Method AT-1002 ET-1000 ET-1001 AT-5001
Property Temperature ASTM ISO Units HS HS L
Tensile Strength 23°C (73°F) D 638 MPa 83 69 76 61
Tensile Strength 50%RH* 23°C (73°F) D 638 MPa 76 63 62 51
Tensile Stress at Yield 23°C (73°F) 527 MPa 75 70 58 57
Tensile Stress at Break 23°C (73°F) 527 MPa 68 60 55 53
Tensile Stress at Yield 100°C (212°F) 527 MPa 39 34 32
Tensile Stress at Break 100°C (212°F) 527 MPa 31
Tensile Elongation at Yield 23°C (73°F) D 638 % 5.0 6.0 6.0 5.0
Tensile Elongation at Break 23°C (73°F) D 638 % 10-12 20.0 30.0 30.0
Tensile Elongation at Break 50%RH 23°C (73°F) D 638 % 30.0 18.0 30.0 50.0
Tensile Strain at Yield 23°C (73°F) 527 % 5.0 5.0 6.0 5.0
Tensile Strain at Break 23°C (73°F) 527 % 10.0 7.0 15.0 15.0
Tensile Strain at Yield 100°C (212°F) 527 % 3.7 4.3 3.1 >95
Tensile Strain at Break 100°C (212°F) 527 % >95 >95 54.3
Tensile Modulus 23°C (73°F) D 638 GPa 2.8 2.4 2.4 2.3
Tensile Modulus 50%RH 23°C (73°F) D 638 GPa 2.8 2.4 2.3 2.5
Tensile Modulus 23°C (73°F) 527 GPa 2.8 2.4 2.3 2.3
Tensile Modulus 100°C (212°F) 527 GPa 2.1 2.0 1.8 0.5
Flexural Strength 23°C (73°F) D 790 MPa 103 109 128 92
Flexural Strength 50%RH 23°C (73°F) D 790 MPa 73 85 110 71
Flexural Strength 23°C (73°F) 178 MPa 80 70 66 65
Flexural Strength 100°C (212°F) 178 MPa 50 44 42 9
Flexural Modulus 23°C (73°F) D 790 GPa 2.2 2.3 2.6 2.1
Flexural Modulus 50%RH 23°C (73°F) D 790 GPa 2.3 2.2 2.6 1.9
Flexural Modulus 23°C (73°F) 178 GPa 2.3 1.8 1.9 1.8
Flexural Modulus 100°C (212°F) 178 GPa 1.8 1.3 1.3 0.4
Shear Strength 23°C (73°F) D 732 MPa 64 59 53 53
Shear Strength 50%RH 23°C (73°F) D 732 MPa 57 47
Poisson’s Ratio 23°C (73°F) 0.38 0.39 0.35 0.40
Izod Impact, Notched 23°C (73°F) D 256 J/m 130 905 960 160
Izod Impact, Notched 50%RH 23°C (73°F) D 256 J/m 140 1065 960 800
Izod Impact, Unnotched 23°C (73°F) D 4812 J/m no break no break no break no break
Izod Impact, Notched 23°C (73°F) 180/1A kJ/m2 13 74 80 14
Izod Impact, Unnotched 23°C (73°F) 180/1U kJ/m2 177 no break no break no break
Charpy Impact 23°C (73°F) 179/1eA kJ/m2 14 78 no break no break
Charpy Impact, Unnotched 23°C (73°F) 179/1eU kJ/m2 106 no break no break no break
Rockwell Hardness 23°C (73°F) D 785 119 120 115 116
Table 2-7.
Toughened Grades - Mechanical Properties - SI Units

AMODEL PPA Design Guide 2-9 Typical Property Tables
Method
Property ASTM ISO Units AT-1002 HS ET-1000 HS ET-1001 L AT-5001
ThermalDeflection Temperature Under Load, 264 psi D 648 °F 250 248 248 190
°C 121 120 120 88
Deflection Temperature Under Load, 1.8 MPa 75AF °F 244 228 235 184
°C 118 109 113 84
Vicat Softening Temperature D 1525 306 °F 547 542 557 526
°C 286 283 292 275
Melting Point D 3418 11357-3 °F 599 590 590 572
°C 315 310 310 300
Flammability, 1/8" (3.2 mm) bar UL -94 HB HB HB HB
ElectricalDielectric Strength at 1/8” (3.2 mm) D 149 V/mil 431 * * 400
kV/mm 17 * * 17
Volume Resistivity D 257 ohm-cm 1x10¹⁶ * * 4x10¹⁵
Surface Resistivity D 257 ohm 8x10¹³ 4x10¹⁵
Comparative Tracking Index D 3638 volts >600 * * >600
Dielectric Constant at 60 Hz D 150 3.3 * * 3.2
Dielectric Constant at 106 Hz D 150 3.3 * * 3.2
Dissipation Factor at 60 Hz D 150 0.004 * * 0.004
Dissipation Factor at 106 Hz D 150 0.016 * * 0.016
GeneralSpecific Gravity D 792 1183A 1.13 1.13 1.15 1.10
Moisture Absorption, 24 hours D 570 62 % 0.5 0.7 0.7 0.5
Mold Shrinkage, Flow Direction D 955 294-4 % 2.0 1.5 1.1-1.5 1.9
Mold Shrinkage, Transverse Direction D 955 294-4 % 2.1 1.5 1.5-2.0 1.9
Table 2-8
Toughened Grades - Thermal, Electrical, and General Properties

Typical Property Tables 2-10 SOLVAY Advanced Polymers, L.L.C.
Method AFA-6133
Property Temperature ASTM ISO Units AT-1116 HS AT-6115 HS V0 Z FR-4133
Tensile Strength 23°C (73°F) D 638 kpsi 23.3 17.7 28.8 28.9
Tensile Strength 50%RH 23°C (73°F) D 638 kpsi 19.0 13.9 24.1 25.8
Tensile Strength 23°C (73°F) 527 kpsi 23.2 16.5 27.0 27.7
Tensile Strength 100°C (212°F) 527 kpsi 9.5 9.9 16.5 17.3
Tensile Strength 150°C (302°F) 527 kpsi 10.9 12.9
Tensile Strength 175°C (347°F) 527 kpsi 9.2 10.4
Tensile Elongation 23°C (73°F) D 638 % 3.8 3.4 1.7 1.8
Tensile Elongation 50%RH 23°C (73°F) D 638 % 2.8 5.3 1.7 1.7
Tensile Elongation 23°C (73°F) 527 % 3.7 3.9 1.6 1.8
Tensile Elongation 100°C (212°F) 527 % 4.2 7.7 2.4 2.2
Tensile Elongation 150°C (302°F) 527 % 5.1 3.1
Tensile Elongation 175°C (347°F) 527 % 4.9 4.6
Tensile Modulus 23°C (73°F) D 638 Mpsi 0.94 0.78 2.33 2.27
Tensile Modulus 50%RH 23°C (73°F) D 638 Mpsi 1.03 0.97 1.99 2.06
Tensile Modulus 23°C (73°F) 527 Mpsi 1.00 0.78 2.10 2.13
Tensile Modulus 100°C (212°F) 527 Mpsi 0.97 0.45 1.33 1.51
Tensile Modulus 150°C (302°F) 527 Mpsi 0.86 1.02
Tensile Modulus 175°C (347°F) 527 Mpsi 0.74 0.84
Flexural Strength 23°C (73°F) D 790 kpsi 32.8 24.0 32.5 38.7
Flexural Strength 50%RH 23°C (73°F) D 790 kpsi 29.1 16.7 33.2 37.3
Flexural Strength 23°C (73°F) 178 kpsi 28.6 24.7 37.6 38.6
Flexural Strength 100°C (212°F) 178 kpsi 20.5 9.7 23.3 25.1
Flexural Strength 150°C (302°F) 178 kpsi 14.6 18.5
Flexural Strength 175°C (347°F) 178 kpsi 12.7 14.6
Flexural Modulus 23°C (73°F) D 790 Mpsi 0.87 0.64 1.90 1.86
Flexural Modulus 50%RH 23°C (73°F) D 790 Mpsi 0.90 0.50 1.93 2.05
Flexural Modulus 23°C (73°F) 178 Mpsi 0.97 0.62 1.83 1.78
Flexural Modulus 100°C (212°F) 178 Mpsi 0.72 0.34 1.17 1.36
Flexural Modulus 150°C (302°F) 178 Mpsi 0.72 0.94
Flexural Modulus 175°C (347°F) 178 Mpsi 0.67 0.72
Shear Strength 23°C (73°F) D 732 kpsi 10.1 8.2 11.6 12.0
Shear Strength 50%RH 23°C (73°F) D 732 kpsi 9.5 6.4 9.0 10.2
Compressive Strength 23°C (73°F) D 695 kpsi 18.0 14.5 21.1 22.6
Poisson’s Ratio 23°C (73°F) 0.40 0.39 0.37 0.37
Izod Impact, Notched 23°C (73°F) D 256 ft-lb/in 1.8 1.7 1.6 1.6
Izod Impact, Notched 50%RH 23°C (73°F) D 256 ft-lb/in 0.9 1.5 1.5 1.6
Izod Impact, Unnotched 23°C (73°F) D 4812 ft-lb/in 18 16 13 12
Izod Impact, Notched 23°C (73°F) 180/1A ft-lb/in2 3.8 5.5 3.9 5.2
Izod Impact, Unnotched 23°C (73°F) 180/1U ft-lb/in2 25 26 21 24
Charpy Impact 23°C (73°F) 179/1eA ft-lb/in2 4.3 5.2 6.6 6.8
Charpy Impact, Unnotched 23°C (73°F) 179/1eU ft-lb/in2 41 36 22 46
Rockwell Hardness 23°C (73°F) D785 R scale 124 116 125 124
Table 2-9
Toughened Glass-Reinforced and Flame Retardant Grades - Mechanical Properties - US units

AMODEL PPA Design Guide 2-11 Typical Property Tables
Method AFA-6133
Property Temperature ASTM ISO Units AT-1116 HS AT-6115 HS V0 Z FR-4133
Tensile Strength 23°C (73°F) D 638 MPa 161 122 199 199
Tensile Strength 50%RH* 23°C (73°F) D 638 MPa 131 96 166 178
Tensile Strength 23°C (73°F) 527 MPa 160 114 186 191
Tensile Strength 100°C (212°F) 527 MPa 66 68 114 119
Tensile Strength 150°C (302°F) 527 MPa 75 89
Tensile Strength 175°C (347°F) 527 MPa 63 72
Tensile Elongation 23°C (73°F) D 638 % 3.8 3.4 1.7 1.8
Tensile Elongation 50%RH 23°C (73°F) D 638 % 2.8 5.3 1.7 1.7
Tensile Elongation 23°C (73°F) 527 % 3.7 3.9 1.6 1.8
Tensile Elongation 100°C (212°F) 527 % 4.2 7.7 2.4 2.2
Tensile Elongation 150°C (302°F) 527 % 5.1 3.1
Tensile Elongation 175°C (347°F) 527 % 4.9 4.6
Tensile Modulus 23°C (73°F) D 638 GPa 6.5 5.4 16.1 15.7
Tensile Modulus 50%RH 23°C (73°F) D 638 GPa 7.1 6.7 13.7 14.2
Tensile Modulus 23°C (73°F) 527 GPa 6.9 5.4 14.5 14.7
Tensile Modulus 100°C (212°F) 527 GPa 6.7 3.1 9.2 10.4
Tensile Modulus 150°C (302°F) 527 GPa 5.9 7.0
Tensile Modulus 175°C (347°F) 527 GPa 5.1 5.8
Flexural Strength 23°C (73°F) D 790 MPa 226 165 224 267
Flexural Strength 50%RH 23°C (73°F) D 790 MPa 201 115 229 257
Flexural Strength 23°C (73°F) 178 MPa 197 170 259 266
Flexural Strength 100°C (212°F) 178 MPa 141 67 161 173
Flexural Strength 150°C (302°F) 178 MPa 101 127
Flexural Strength 175°C (347°F) 178 MPa 88 101
Flexural Modulus 23°C (73°F) D 790 GPa 6.0 4.4 13.1 12.8
Flexural Modulus 50%RH 23°C (73°F) D 790 GPa 6.2 3.4 13.3 14.1
Flexural Modulus 23°C (73°F) 178 GPa 6.7 4.3 12.6 12.3
Flexural Modulus 100°C (212°F) 178 GPa 5.0 2.4 8.1 9.4
Flexural Modulus 150°C (302°F) 178 GPa 5.0 6.5
Flexural Modulus 175°C (347°F) 178 GPa 4.6 5.0
Shear Strength 23°C (73°F) D 732 MPa 70 56 80 83
Shear Strength 50%RH 23°C (73°F) D 732 MPa 66 44 62 70
Compressive Strength 23°C (73°F) D 695 MPa 124 100 145 156
Poisson’s Ratio 23°C (73°F) 0.40 0.39 0.37 0.37
Izod Impact, Notched 23°C (73°F) D 256 J/m 95 90 85 85
Izod Impact, Notched 50%RH 23°C (73°F) D 256 J/m 45 80 80 85
Izod Impact, Unnotched 23°C (73°F) D 4812 J/m 945 825 710 635
Izod Impact, Notched 23°C (73°F) 180/1A kJ/m2 8.1 11.6 8 11
Izod Impact, Unnotched 23°C (73°F) 180/1U kJ/m2 53 54 44 50
Charpy Impact 23°C (73°F) 179/1eA kJ/m2 9.1 11.0 14.0 14.0
Charpy Impact, Unnotched 23°C (73°F) 179/1eU kJ/m2 85 75 47 97
Rockwell Hardness 23°C (73°F) D 785 R scale 124 116 125 124
Table 2-10
Toughened Glass-Reinforced and Flame Retardant Grades - Mechanical Properties - SI units

Typical Property Tables 2-12 SOLVAY Advanced Polymers, L.L.C.
Method AFA-6133
Property ASTM ISO Units AT-1116 HS AT-6115 HS V0 Z FR-4133
ThermalDeflection Temperature Under Load, 264 psi D 648 °F 489 519 531 574
°C 254 271 277 301
Deflection Temperature Under Load, 1.8MPa
75AF °F 497 509 540 584
°C 258 265 282 307
Vicat Softening Temperature D 1525 306 °F 563 565 556 600
°C 295 296 291 316
Melting Point D 3418 11357-3 °F 590 585 590 618
°C 310 307 310 326
Flammability, 1/8" (3.2 mm) bar UL -94 HB HB V-0 V-0
ElectricalDielectric Strength at 1/8” (3.2 mm) D 149 V/mil * 533 609 508
kV/mm * 21 24 20
Dielectric Strength at 1/16” (1.6 mm) D 149 V/mil 711 686 737
kV/mm 28 27 29
Volume Resistivity D 257 ohm-cm * 1x10¹⁶ 1x10¹⁶ 1x10¹⁶
Surface Resistivity D 257 ohm 1x10¹⁵ 1x10¹⁵ 1x10¹⁵
Comparative Tracking Index D 3638 volts * * * *
Dielectric Constant at 60 Hz D 150 * * * *
Dielectric Constant at 100 Hz D 150 * 4.0 4.8 4.8
Dielectric Constant at 106 Hz D 150 * 3.3 4.1 3.5
Dielectric Constant at 109 Hz D 150 * 3.1 3.7 3.4
Dissipation Factor at 60 Hz D 150 * * * *
Dissipation Factor at 100 Hz D 150 * 0.007 0.007 0.008
Dissipation Factor at 106 Hz D 150 * 0.013 0.011 0.014
Dissipation Factor at 109 Hz D 150 * 0.011 * 0.010
GeneralSpecific Gravity D 792 1183A 1.28 1.22 1.68 1.68
Moisture Absorption, 24 hours D 570 62 % 0.2 0.2 0.2 0.1
Mold Shrinkage, Flow Direction D 955 294-4 % 0.6 1.0 0.3 0.4
Mold Shrinkage, Transverse Direction D 955 294-4 % 0.6 1.1 0.6 0.6
Table 2-11
Toughened Glass-Reinforced and Flame Retardant Grades - Thermal, Electrical, and General Properties

AMODEL PPA Design Guide 2-13 Typical Property Tables
Method A-1240 A-1340 A-1565 AS-1566 AP-9240
Property Temperature ASTM ISO Units L HS HS HS NL
Tensile Strength 23°C (73°F) D 638 kpsi 15.0 25.2 19.0 30.0 12.3
Tensile Strength 50%RH* 23°C (73°F) D 638 kpsi 13.5 18.8 17.9 25.4 10.3
Tensile Strength 23°C (73°F) 527 kpsi 15.1 21.9 20.0 29.0 11.7
Tensile Strength 100°C (212°F) 527 kpsi 10.1 14.1 13.3 18.4 5.9
Tensile Strength 150°C (302°F) 527 kpsi 4.2 7.1 6.7 7.6 3.5
Tensile Strength 175°C (347°F) 527 kpsi 3.5 6.6 4.7 6.3 2.9
Tensile Elongation 23°C (73°F) D 638 % 1.6 2.2 1.2 1.7 2.1
Tensile Elongation 50%RH 23°C (73°F) D 638 % 1.2 1.8 1.2 1.8 2.5
Tensile Elongation 23°C (73°F) 527 % 1.6 1.8 1.0 1.4 1.9
Tensile Elongation 100°C (212°F) 527 % 1.9 2.3 1.3 1.5 8.9
Tensile Elongation 150°C (302°F) 527 % 9.1 7.4 2.4 3.4 15.0
Tensile Elongation 175°C (347°F) 527 % 7.3 7.0 1.8 3.1 12.3
Tensile Modulus 23°C (73°F) D 638 Mpsi 1.30 1.60 3.00 2.90 0.89
Tensile Modulus 50%RH 23°C (73°F) D 638 Mpsi 1.20 1.60 3.02 3.03 0.83
Tensile Modulus 23°C (73°F) 527 Mpsi 1.45 1.52 2.86 3.26 0.84
Tensile Modulus 100°C (212°F) 527 Mpsi 0.81 1.16 2.23 2.49 0.46
Tensile Modulus 150°C (302°F) 527 Mpsi 0.16 0.45 0.83 1.06 0.10
Tensile Modulus 175°C (347°F) 527 Mpsi 0.13 0.39 0.74 0.90 0.09
Flexural Strength 23°C (73°F) D 790 kpsi 30.0 38.1 30.5 42.0 21.4
Flexural Strength 50%RH 23°C (73°F) D 790 kpsi 25.6 33.7 28.4 38.1 19.6
Flexural Strength 23°C (73°F) 178 kpsi 24.9 33.9 30.6 41.2 16.0
Flexural Strength 100°C (212°F) 178 kpsi 17.6 22.5 23.6 29.7 8.8
Flexural Strength 150°C (302°F) 178 kpsi 4.0 9.2 10.1 13.9 2.7
Flexural Strength 175°C (347°F) 178 kpsi 3.2 8.0 8.1 11.0 2.2
Flexural Modulus 23°C (73°F) D 790 Mpsi 1.10 1.54 2.60 2.70 0.81
Flexural Modulus 50%RH 23°C (73°F) D 790 Mpsi 1.00 1.57 2.61 2.88 0.81
Flexural Modulus 23°C (73°F) 178 Mpsi 1.00 1.32 2.43 2.98 0.62
Flexural Modulus 100°C (212°F) 178 Mpsi 0.87 0.99 2.28 2.44 0.48
Flexural Modulus 150°C (302°F) 178 Mpsi 0.16 0.36 0.81 1.06 0.10
Flexural Modulus 175°C (347°F) 178 Mpsi 0.13 0.33 0.72 0.93 0.09
Shear Strength 23°C (73°F) D 732 kpsi 13.9 13.2 10.3 11.6 10.8
Shear Strength 50%RH 23°C (73°F) D 732 kpsi 13.5 12.3 7.2 9.1 10.0
Compressive Strength 23°C (73°F) D 695 kpsi 26.8 27.3 27.4 25.3 23.5
Poisson’s Ratio 23°C (73°F) 0.29 0.38 0.31 0.35 0.32
Izod Impact, Notched 23°C (73°F) D 256 ft-lb/in 0.9 0.8 0.7 1.2 1.0
Izod Impact, Notched 50%RH 23°C (73°F) D 256 ft-lb/in 0.6 0.8 0.6 1.0 1.2
Izod Impact, Unnotched 23°C (73°F) D 4812 ft-lb/in 7 9 7 13 13
Izod Impact, Notched 23°C (73°F) 180/1A ft-lb/in2 2.2 1.9 1.6 3.1 2.8
Izod Impact, Unnotched 23°C (73°F) 180/1U ft-lb/in2 11 15 11 21 25
Charpy Impact 23°C (73°F) 179/1eA ft-lb/in2 1.9 1.6 1.5 2.9 2.2
Charpy Impact, Unnotched 23°C (73°F) 179/1eU ft-lb/in2 14 21 12 16 23
Rockwell Hardness 23°C (73°F) D 785 R scale 125 125 124 122 121
Table 2-12
Mineral and Mineral/Glass Filled Grades - Mechanical Properties - US units
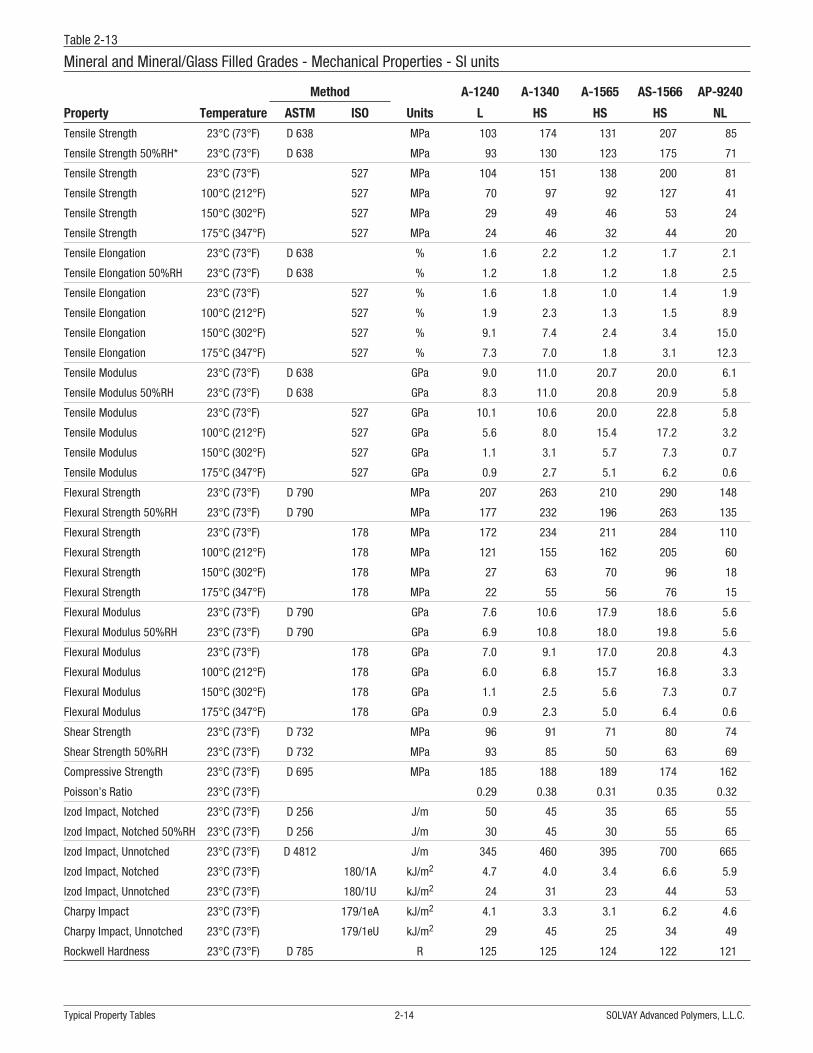
Typical Property Tables 2-14 SOLVAY Advanced Polymers, L.L.C.
Method A-1240 A-1340 A-1565 AS-1566 AP-9240
Property Temperature ASTM ISO Units L HS HS HS NL
Tensile Strength 23°C (73°F) D 638 MPa 103 174 131 207 85
Tensile Strength 50%RH* 23°C (73°F) D 638 MPa 93 130 123 175 71
Tensile Strength 23°C (73°F) 527 MPa 104 151 138 200 81
Tensile Strength 100°C (212°F) 527 MPa 70 97 92 127 41
Tensile Strength 150°C (302°F) 527 MPa 29 49 46 53 24
Tensile Strength 175°C (347°F) 527 MPa 24 46 32 44 20
Tensile Elongation 23°C (73°F) D 638 % 1.6 2.2 1.2 1.7 2.1
Tensile Elongation 50%RH 23°C (73°F) D 638 % 1.2 1.8 1.2 1.8 2.5
Tensile Elongation 23°C (73°F) 527 % 1.6 1.8 1.0 1.4 1.9
Tensile Elongation 100°C (212°F) 527 % 1.9 2.3 1.3 1.5 8.9
Tensile Elongation 150°C (302°F) 527 % 9.1 7.4 2.4 3.4 15.0
Tensile Elongation 175°C (347°F) 527 % 7.3 7.0 1.8 3.1 12.3
Tensile Modulus 23°C (73°F) D 638 GPa 9.0 11.0 20.7 20.0 6.1
Tensile Modulus 50%RH 23°C (73°F) D 638 GPa 8.3 11.0 20.8 20.9 5.8
Tensile Modulus 23°C (73°F) 527 GPa 10.1 10.6 20.0 22.8 5.8
Tensile Modulus 100°C (212°F) 527 GPa 5.6 8.0 15.4 17.2 3.2
Tensile Modulus 150°C (302°F) 527 GPa 1.1 3.1 5.7 7.3 0.7
Tensile Modulus 175°C (347°F) 527 GPa 0.9 2.7 5.1 6.2 0.6
Flexural Strength 23°C (73°F) D 790 MPa 207 263 210 290 148
Flexural Strength 50%RH 23°C (73°F) D 790 MPa 177 232 196 263 135
Flexural Strength 23°C (73°F) 178 MPa 172 234 211 284 110
Flexural Strength 100°C (212°F) 178 MPa 121 155 162 205 60
Flexural Strength 150°C (302°F) 178 MPa 27 63 70 96 18
Flexural Strength 175°C (347°F) 178 MPa 22 55 56 76 15
Flexural Modulus 23°C (73°F) D 790 GPa 7.6 10.6 17.9 18.6 5.6
Flexural Modulus 50%RH 23°C (73°F) D 790 GPa 6.9 10.8 18.0 19.8 5.6
Flexural Modulus 23°C (73°F) 178 GPa 7.0 9.1 17.0 20.8 4.3
Flexural Modulus 100°C (212°F) 178 GPa 6.0 6.8 15.7 16.8 3.3
Flexural Modulus 150°C (302°F) 178 GPa 1.1 2.5 5.6 7.3 0.7
Flexural Modulus 175°C (347°F) 178 GPa 0.9 2.3 5.0 6.4 0.6
Shear Strength 23°C (73°F) D 732 MPa 96 91 71 80 74
Shear Strength 50%RH 23°C (73°F) D 732 MPa 93 85 50 63 69
Compressive Strength 23°C (73°F) D 695 MPa 185 188 189 174 162
Poisson’s Ratio 23°C (73°F) 0.29 0.38 0.31 0.35 0.32
Izod Impact, Notched 23°C (73°F) D 256 J/m 50 45 35 65 55
Izod Impact, Notched 50%RH 23°C (73°F) D 256 J/m 30 45 30 55 65
Izod Impact, Unnotched 23°C (73°F) D 4812 J/m 345 460 395 700 665
Izod Impact, Notched 23°C (73°F) 180/1A kJ/m2 4.7 4.0 3.4 6.6 5.9
Izod Impact, Unnotched 23°C (73°F) 180/1U kJ/m2 24 31 23 44 53
Charpy Impact 23°C (73°F) 179/1eA kJ/m2 4.1 3.3 3.1 6.2 4.6
Charpy Impact, Unnotched 23°C (73°F) 179/1eU kJ/m2 29 45 25 34 49
Rockwell Hardness 23°C (73°F) D 785 R 125 125 124 122 121
Table 2-13
Mineral and Mineral/Glass Filled Grades - Mechanical Properties - SI units

AMODEL PPA Design Guide 2-15 Typical Property Tables
Method A-1240 A-1340 A-1565 AS-1566 AP-9240
Property ASTM ISO Units L HS HS HS NL
ThermalDeflection Temperature Under Load, 264 psi D 648 °F 355 527 520 532 310
°C 179 275 271 278 154
Deflection Temperature Under Load, 1.8 MPa 75AF °F 346 504 520 536 310
°C 174 262 271 280 154
Vicat Softening Temperature D 1525 306 °F 575 574 565 569 559
°C 302 301 296 298 293
Melting Point D 3418 11357-3 °F 590 595 592 592 595
°C 310 313 311 311 313
Flammability, 1/8" (3.2 mm) bar UL -94 HB HB HB HB HB
ElectricalDielectric Strength at 1/16” (1.6 mm) D 149 V/mil * 813 * 737 *
kV/mm * 32 * 29 *
Volume Resistivity D 257 ohm-cm 9x10¹⁵ 1x10¹⁶ 4x10¹⁴ 1x10¹⁶ *
Surface Resistivity D 257 ohm * * * 1x10¹⁵ *
Comparative Tracking Index D 3638 volts 550 550 >600 * *
Dielectric Constant at 60 Hz D 150 * * * * *
Dielectric Constant at 100 Hz D 150 4.2 4.5 * 5.7 *
Dielectric Constant at 106 Hz D 150 4.0 4.3 * 4.7 *
Dissipation Factor at 60 Hz D 150 * * * * *
Dissipation Factor at 100 Hz D 150 0.006 0.005 * 0.006 *
Dissipation Factor at 106 Hz D 150 0.017 0.017 * 0.011 *
GeneralSpecific Gravity D 792 1183A 1.54 1.54 1.90 1.84 1.49
Moisture Absorption, 24 hours D 570 62 % 0.1 0.2 0.1 0.1 0.2
Mold Shrinkage, Flow Direction D 955 294-4 % 1.0 0.4 0.3 0.3 1.1
Mold Shrinkage, Transverse Direction D 955 294-4 % 1.0 0.7 0.5 0.5 1.0
Table 2-14
Mineral and Mineral/Glass Filled Grades - Thermal, Electrical, and General Properties

Mechanical PropertiesThe mechanical properties of a material are of fundamentalimportance to engineers when designing a part. Thedesigner must match the mechanical properties of variouscandidate materials to the performance requirements ofeach application in order to determine which material issuitable for a given part design. Conversely, the designercan use the material property values to achieve an optimumpart design.
To assist the designer, the material properties listed in thismanual have been grouped into short-term or instantaneousand long-term or time-dependent properties. The short-termproperties generally measure strength at failure while thelong-term properties show how the material properties areaffected by temperature, continuous loading, or chemicalexposure as a function of time.
Short-term Mechanical Properties
Short-term mechanical properties typically include tensilestrength and modulus, flexural strength and modulus, sev-eral impact tests, compressive strength, shear strength, andsurface hardness. These properties are usually reported atroom temperature, and other temperatures as appropriate.Since some polymers absorb atmospheric moisture whichmay affect the properties, the moisture content may also bespecified, often using the Relative Humidity (RH) convention.
The data sheets provided by the material suppliers typicallylist short-term properties, and their primary utility is forcomparing similar materials. When using data sheets tocompare materials, it is very important to insure that thesame test methods have been used and that the data isreported in similar units
The utility of short-term mechanical properties in design islimited. Typically, the properties are measured using moldedtest specimens that have been specifically designed to yieldreproducible results, under carefully controlled environmen-tal conditions, using specified loading rates. These mea-surements often provide the highest value obtainable for anyproperty and material.
When parts are fabricated by a molding process they willlikely contain a number of features such as stress concen-trations, weld lines, corners or other aspects that mayreduce strength. The strength of a material in an actualcomponent may also be reduced, or in some casesenhanced, by reinforcing fiber orientation, relative degree ofcrystallinity, or thermal history (annealing). In addition,short-term properties do not provide any insight regardingtime-related effects or the influence of chemicalenvironments.
Tensile Properties
Test MethodsThere are two widely accepted methods of testing tensileproperties, ASTM method D 638 and ISO method 527. Thesetest methods measure the same property, but slightly differ-ent test specimens and test procedures are used. If thesame material is tested using both procedures, the resultswill be similar but not the same. Therefore, only valuesobtained using the same method should be compared. Inthis document, whenever a tensile property value is given,the test method is also given, and in many cases values byboth methods are provided.
Regardless of which test method is used, tensile propertiesare determined by clamping each end of a test specimen inthe jaws of a testing machine that applies a unidirectionalaxial force to the specimens at a specified rate The forcerequired to separate the jaws divided by the minimumcross-sectional area of the test specimen is defined as thetensile stress. The test specimen will elongate as a result ofthe stress being applied. The amount of elongation dividedby the original length of the test specimen is the strain.
When the applied stress is plotted against the resultingstrain, a curve similar to that shown in Figure 3-1 forAMODEL ET-1000 HS resin is obtained.
This is known as a “Stress - Strain” curve and is very usefulin determining the short term behavior of a material when aload is applied. The curve of a ductile metal would have asimilar shape.
PB
3– 1 Solvay Advanced Polymers, L.L.C.
Figure 3-1
Typical Stress/Strain Curve for AMODEL ET-1000
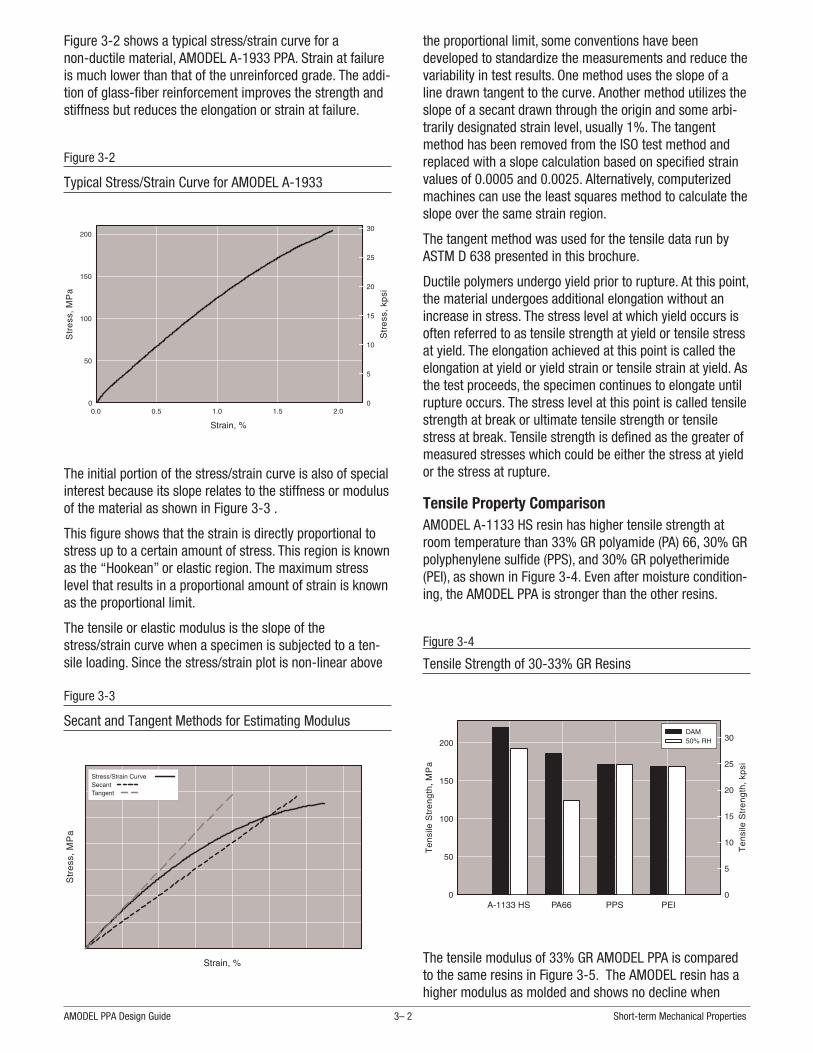
Figure 3-2 shows a typical stress/strain curve for anon-ductile material, AMODEL A-1933 PPA. Strain at failureis much lower than that of the unreinforced grade. The addi-tion of glass-fiber reinforcement improves the strength andstiffness but reduces the elongation or strain at failure.
The initial portion of the stress/strain curve is also of specialinterest because its slope relates to the stiffness or modulusof the material as shown in Figure 3-3 .
This figure shows that the strain is directly proportional tostress up to a certain amount of stress. This region is knownas the “Hookean” or elastic region. The maximum stresslevel that results in a proportional amount of strain is knownas the proportional limit.
The tensile or elastic modulus is the slope of thestress/strain curve when a specimen is subjected to a ten-sile loading. Since the stress/strain plot is non-linear above
the proportional limit, some conventions have beendeveloped to standardize the measurements and reduce thevariability in test results. One method uses the slope of aline drawn tangent to the curve. Another method utilizes theslope of a secant drawn through the origin and some arbi-trarily designated strain level, usually 1%. The tangentmethod has been removed from the ISO test method andreplaced with a slope calculation based on specified strainvalues of 0.0005 and 0.0025. Alternatively, computerizedmachines can use the least squares method to calculate theslope over the same strain region.
The tangent method was used for the tensile data run byASTM D 638 presented in this brochure.
Ductile polymers undergo yield prior to rupture. At this point,the material undergoes additional elongation without anincrease in stress. The stress level at which yield occurs isoften referred to as tensile strength at yield or tensile stressat yield. The elongation achieved at this point is called theelongation at yield or yield strain or tensile strain at yield. Asthe test proceeds, the specimen continues to elongate untilrupture occurs. The stress level at this point is called tensilestrength at break or ultimate tensile strength or tensilestress at break. Tensile strength is defined as the greater ofmeasured stresses which could be either the stress at yieldor the stress at rupture.
Tensile Property ComparisonAMODEL A-1133 HS resin has higher tensile strength atroom temperature than 33% GR polyamide (PA) 66, 30% GRpolyphenylene sulfide (PPS), and 30% GR polyetherimide(PEI), as shown in Figure 3-4. Even after moisture condition-ing, the AMODEL PPA is stronger than the other resins.
The tensile modulus of 33% GR AMODEL PPA is comparedto the same resins in Figure 3-5. The AMODEL resin has ahigher modulus as molded and shows no decline when
AMODEL PPA Design Guide 3– 2 Short-term Mechanical Properties
Figure 3-2
Typical Stress/Strain Curve for AMODEL A-1933
Figure 3-3
Secant and Tangent Methods for Estimating Modulus
Figure 3-4
Tensile Strength of 30-33% GR Resins

moisture conditioned, while the PA 66 exhibits a reduction ofover 20 percent.
This same comparison for tensile elongation is shown inFigure 3-6. The tensile elongation of the resins is low due tothe glass-fiber reinforcement. Moisture conditioning thePA 66 results in an increase in elongation due to the reduc-tion in Tg.
Tensile Properties for GR PPA vs. TemperatureFigures 3-7 through 3-9 show the tensile properties of GRgrades of AMODEL PPA based upon A-1000, A-4000, andA-6000 base resins from RT to 175°C (347°F). AMODELA-1133 HS has the highest strength and stiffness at roomtemperature, but A-4133 L and A-6135 HN have betterstrength and stiffness above 150°C (302°F).
Tensile Properties 3– 3 Solvay Advanced Polymers, L.L.C.
Figure 3-5
Tensile Modulus of 30-33% GR Resins
Figure 3-6
Tensile Elongation of 30-33% GR Resins
Figure 3-7
Tensile Strength of 33% GR PPA vs. Temperature
Figure 3-8
Tensile Modulus of 33% GR PPA vs. Temperature
Figure 3-9
Tensile Elongation of 33% GR PPA vs. Temperature

Tensile Properties of A-1000 GR Grades at ElevatedTemperaturesFigures 3-10 through 3-12 shows the tensile properties ofthree glass-reinforced grades of AMODEL PPA, based on theA-1000 base resin containing 33%, 45% and 60%glass-fiber over the temperature range of RT to 175°C(347°F). The tensile strength and modulus increase withglass fiber content, which is typical of semi-crystalline ther-moplastics. Both strength and modulus decrease as temper-atures rise. Elongation increases with increasing tempera-ture. As a semi-crystalline material, AMODEL resins show aslow but steady loss in mechanical properties from ambienttemperature up to the glass transition temperature (Tg). Atthe Tg, there is a more significant loss over a narrow tem-perature range, followed by another gradual decline. Thisbehavior is typical of all semi-crystalline thermoplastics.
AMODEL PPA Design Guide 3– 4 Short-term Mechanical Properties
Figure 3-10
Tensile Strength of GR A-1000 PPA Grades vs. Temperature
Figure 3-11
Tensile Modulus of GR A-1000 PPA Grades vs. Temperature
Figure 3-12
Tensile Elongation of GR A-1000 PPA Grades vs.Temperature
Figure 3-13
Tensile Strength of Mineral/Glass PPA Grades vs.Temperature
Figure 3-14
Tensile Modulus of Mineral/Glass PPA Grades vs.Temperature
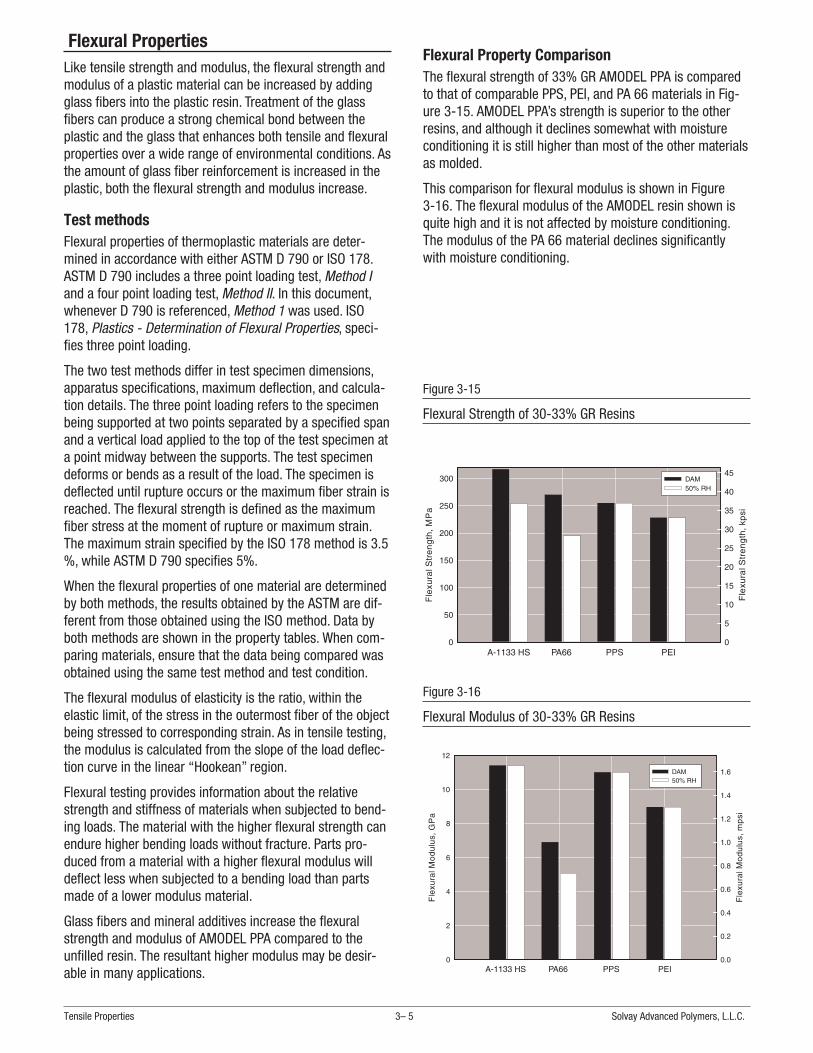
Flexural PropertiesLike tensile strength and modulus, the flexural strength andmodulus of a plastic material can be increased by addingglass fibers into the plastic resin. Treatment of the glassfibers can produce a strong chemical bond between theplastic and the glass that enhances both tensile and flexuralproperties over a wide range of environmental conditions. Asthe amount of glass fiber reinforcement is increased in theplastic, both the flexural strength and modulus increase.
Test methodsFlexural properties of thermoplastic materials are deter-mined in accordance with either ASTM D 790 or ISO 178.ASTM D 790 includes a three point loading test, Method Iand a four point loading test, Method II. In this document,whenever D 790 is referenced, Method 1 was used. ISO178, Plastics - Determination of Flexural Properties, speci-fies three point loading.
The two test methods differ in test specimen dimensions,apparatus specifications, maximum deflection, and calcula-tion details. The three point loading refers to the specimenbeing supported at two points separated by a specified spanand a vertical load applied to the top of the test specimen ata point midway between the supports. The test specimendeforms or bends as a result of the load. The specimen isdeflected until rupture occurs or the maximum fiber strain isreached. The flexural strength is defined as the maximumfiber stress at the moment of rupture or maximum strain.The maximum strain specified by the ISO 178 method is 3.5%, while ASTM D 790 specifies 5%.
When the flexural properties of one material are determinedby both methods, the results obtained by the ASTM are dif-ferent from those obtained using the ISO method. Data byboth methods are shown in the property tables. When com-paring materials, ensure that the data being compared wasobtained using the same test method and test condition.
The flexural modulus of elasticity is the ratio, within theelastic limit, of the stress in the outermost fiber of the objectbeing stressed to corresponding strain. As in tensile testing,the modulus is calculated from the slope of the load deflec-tion curve in the linear “Hookean” region.
Flexural testing provides information about the relativestrength and stiffness of materials when subjected to bend-ing loads. The material with the higher flexural strength canendure higher bending loads without fracture. Parts pro-duced from a material with a higher flexural modulus willdeflect less when subjected to a bending load than partsmade of a lower modulus material.
Glass fibers and mineral additives increase the flexuralstrength and modulus of AMODEL PPA compared to theunfilled resin. The resultant higher modulus may be desir-able in many applications.
Flexural Property ComparisonThe flexural strength of 33% GR AMODEL PPA is comparedto that of comparable PPS, PEI, and PA 66 materials in Fig-ure 3-15. AMODEL PPA’s strength is superior to the otherresins, and although it declines somewhat with moistureconditioning it is still higher than most of the other materialsas molded.
This comparison for flexural modulus is shown in Figure3-16. The flexural modulus of the AMODEL resin shown isquite high and it is not affected by moisture conditioning.The modulus of the PA 66 material declines significantlywith moisture conditioning.
Tensile Properties 3– 5 Solvay Advanced Polymers, L.L.C.
Figure 3-15
Flexural Strength of 30-33% GR Resins
Figure 3-16
Flexural Modulus of 30-33% GR Resins

Flexural Properties at Elevated TemperaturesFigures 3-17 and 3-18 shows the flexural properties ofthree glass-reinforced AMODEL grades based on A-1000,A-4000, A-6000 base resins from room temperature up to175°C. The grade based on A-1000 has higher strengthand stiffness and room temperature, but the grades basedon A-4000 and A-6000 are better at temperatures above125°C.
Figures 3-19 and 3-20 present the flexural properties ofAMODEL PPA resins based on A-1000 containing differentglass reinforcement levels. As expected, the higher glasscontent grades have the higher strength and stiffnessacross the temperature range.
AMODEL PPA Design Guide 3– 6 Short-term Mechanical Properties
Figure 3-17
Flex Strength of GR PPA Resins vs. Temperature
Figure 3-18
Flex Modulus of GR PPA Resins vs. Temperature
Figure 3-19
Flex Strength of GR A-1000 PPA Grades vs. Temperature
Figure 3-20
Flex Modulus of GR A-1000 PPA Grades vs. Temperature
Figure 3-21
Flex Strength Of Min/Glass PPA Resins vs. Temperature

Shear PropertiesShear strength is the resistance to yield or fracture of twoplanes moving relative to one another in the direction ofload. Shear strength can also be defined as the maximumload required to shear the specimen being tested in such amanner that the moving plane has completely cleared thestationary plane. Shear strength values are important indesigning structural components because in actual applica-tions the maximum stress on a component is often a shearstress.
Shear strength was determined in accordance with ASTMD 732. In this test, a plaque molded from the material to betested is placed on a plate with a circular hole in it. A circu-lar punch whose diameter is slightly smaller than the hole inthe plate is pushed through the molded plaque, punching
out a circular disc. The maximum stress is reported as theshear strength, and is calculated by dividing the loadrequired to shear the specimen by the sheared area, whichis calculated by multiplying the circumference of the hole bythe thickness of the plaque.
Figure 3-23 compares the shear strength of AMODEL PPA toPA 66, PPS, and PEI. The shear strength of AMODEL PPA iscomparable to that of PA 66 and PEI and superior to that ofPPS.
Flexural Properties 3– 7 Solvay Advanced Polymers, L.L.C.
Figure 3-22
Flex Modulus of Mineral/Glass PPA Resins vs. Temperature
Figure 3-23
Shear Strength of 30-33% GR Resins

Compressive Strength and ModulusCompressive strength and modulus are measured in accor-dance with ASTM D 695. The test specimen is molded fromthe material to be tested and then placed between parallelplates. These plates then exert a compressive force on thespecimen, while the force and the distance between theparallel plates is monitored. The compressive strain is givenby the change in the distance between the plates. Thestress at failure, calculated by dividing the force by thecross-sectional area, is the compressive strength, and theslope of the stress/strain curve is the compressive modulus.
AMODEL PPA Design Guide 3– 8 Short-term Mechanical Properties
Figure 3-24
Compressive Strength of 30-33% GR Resins
Figure 3-25
Compressive Strength of A-1000 Resins vs. Temperature
Figure 3-26
Compressive Modulus A-1000 Resins vs. Temperature
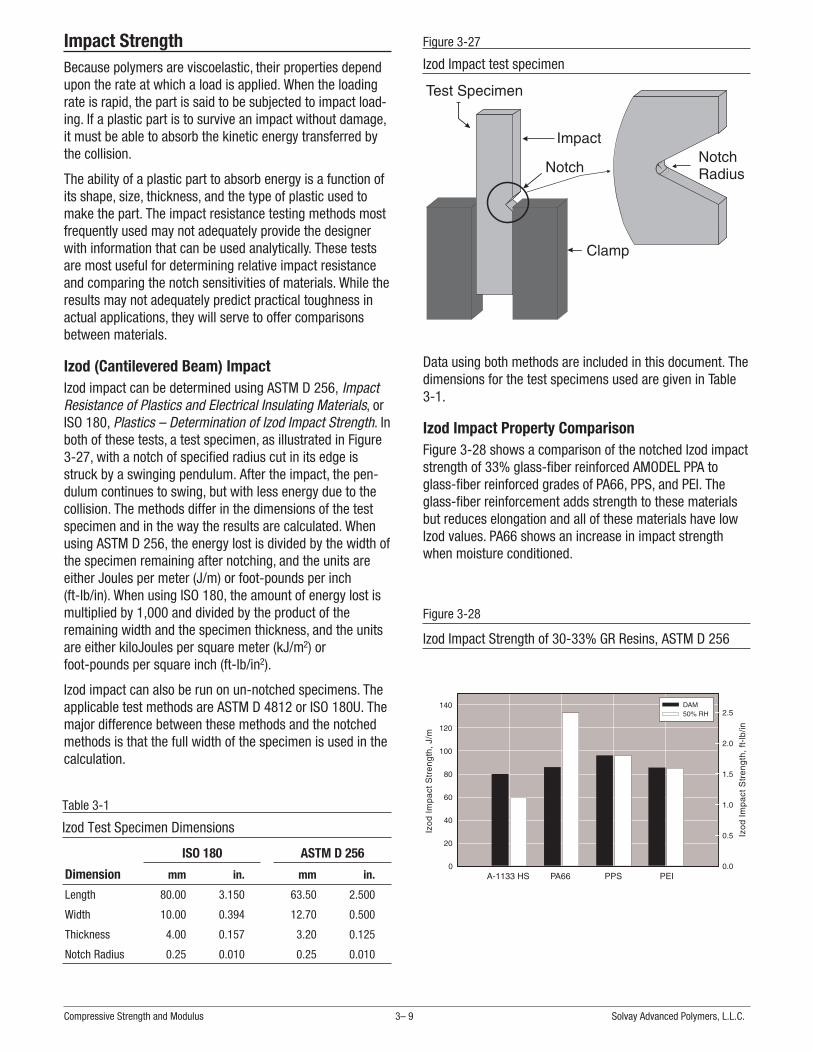
Impact StrengthBecause polymers are viscoelastic, their properties dependupon the rate at which a load is applied. When the loadingrate is rapid, the part is said to be subjected to impact load-ing. If a plastic part is to survive an impact without damage,it must be able to absorb the kinetic energy transferred bythe collision.
The ability of a plastic part to absorb energy is a function ofits shape, size, thickness, and the type of plastic used tomake the part. The impact resistance testing methods mostfrequently used may not adequately provide the designerwith information that can be used analytically. These testsare most useful for determining relative impact resistanceand comparing the notch sensitivities of materials. While theresults may not adequately predict practical toughness inactual applications, they will serve to offer comparisonsbetween materials.
Izod (Cantilevered Beam) ImpactIzod impact can be determined using ASTM D 256, ImpactResistance of Plastics and Electrical Insulating Materials, orISO 180, Plastics – Determination of Izod Impact Strength. Inboth of these tests, a test specimen, as illustrated in Figure3-27, with a notch of specified radius cut in its edge isstruck by a swinging pendulum. After the impact, the pen-dulum continues to swing, but with less energy due to thecollision. The methods differ in the dimensions of the testspecimen and in the way the results are calculated. Whenusing ASTM D 256, the energy lost is divided by the width ofthe specimen remaining after notching, and the units areeither Joules per meter (J/m) or foot-pounds per inch(ft-lb/in). When using ISO 180, the amount of energy lost ismultiplied by 1,000 and divided by the product of theremaining width and the specimen thickness, and the unitsare either kiloJoules per square meter (kJ/m2) orfoot-pounds per square inch (ft-lb/in2).
Izod impact can also be run on un-notched specimens. Theapplicable test methods are ASTM D 4812 or ISO 180U. Themajor difference between these methods and the notchedmethods is that the full width of the specimen is used in thecalculation.
Data using both methods are included in this document. Thedimensions for the test specimens used are given in Table3-1.
Izod Impact Property ComparisonFigure 3-28 shows a comparison of the notched Izod impactstrength of 33% glass-fiber reinforced AMODEL PPA toglass-fiber reinforced grades of PA66, PPS, and PEI. Theglass-fiber reinforcement adds strength to these materialsbut reduces elongation and all of these materials have lowIzod values. PA66 shows an increase in impact strengthwhen moisture conditioned.
Compressive Strength and Modulus 3– 9 Solvay Advanced Polymers, L.L.C.
Figure 3-27
Izod Impact test specimen
Figure 3-28
Izod Impact Strength of 30-33% GR Resins, ASTM D 256
ISO 180 ASTM D 256
Dimension mm in. mm in.
Length 80.00 3.150 63.50 2.500
Width 10.00 0.394 12.70 0.500
Thickness 4.00 0.157 3.20 0.125
Notch Radius 0.25 0.010 0.25 0.010
Table 3-1
Izod Test Specimen Dimensions
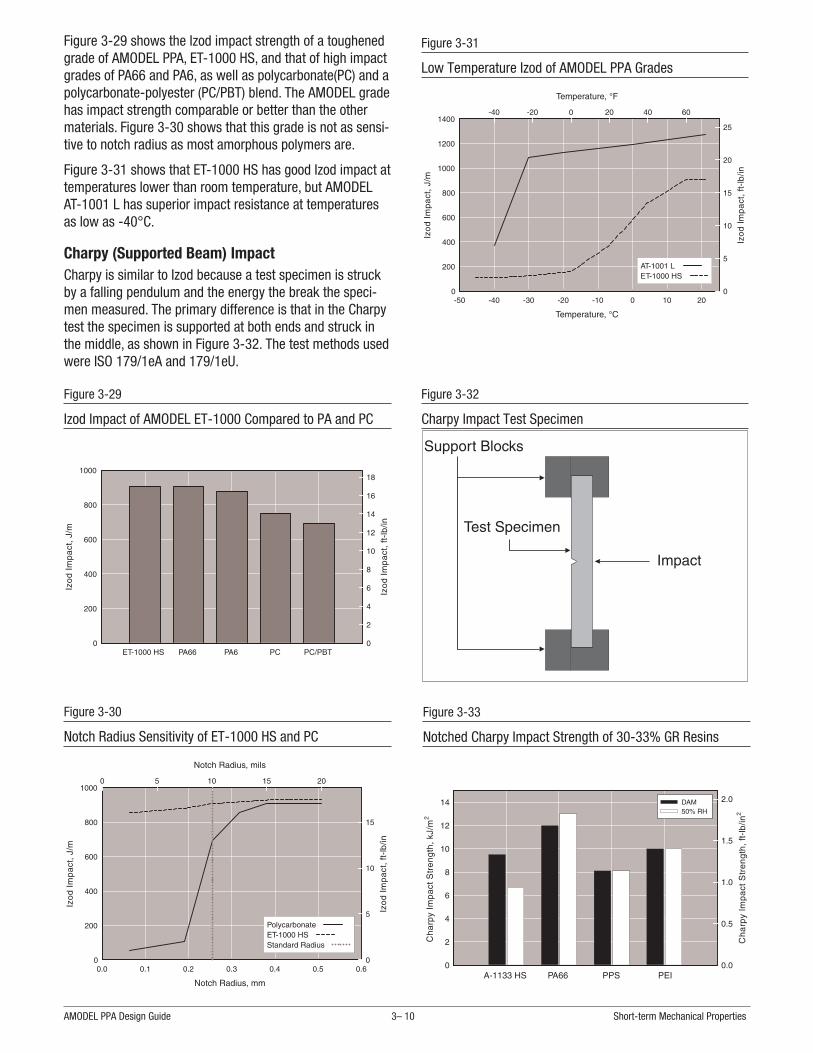
Figure 3-29 shows the Izod impact strength of a toughenedgrade of AMODEL PPA, ET-1000 HS, and that of high impactgrades of PA66 and PA6, as well as polycarbonate(PC) and apolycarbonate-polyester (PC/PBT) blend. The AMODEL gradehas impact strength comparable or better than the othermaterials. Figure 3-30 shows that this grade is not as sensi-tive to notch radius as most amorphous polymers are.
Figure 3-31 shows that ET-1000 HS has good Izod impact attemperatures lower than room temperature, but AMODELAT-1001 L has superior impact resistance at temperaturesas low as -40°C.
Charpy (Supported Beam) ImpactCharpy is similar to Izod because a test specimen is struckby a falling pendulum and the energy the break the speci-men measured. The primary difference is that in the Charpytest the specimen is supported at both ends and struck inthe middle, as shown in Figure 3-32. The test methods usedwere ISO 179/1eA and 179/1eU.
AMODEL PPA Design Guide 3– 10 Short-term Mechanical Properties
Figure 3-29
Izod Impact of AMODEL ET-1000 Compared to PA and PC
Figure 3-30
Notch Radius Sensitivity of ET-1000 HS and PC
Figure 3-31
Low Temperature Izod of AMODEL PPA Grades
Figure 3-32
Charpy Impact Test Specimen
Figure 3-33
Notched Charpy Impact Strength of 30-33% GR Resins
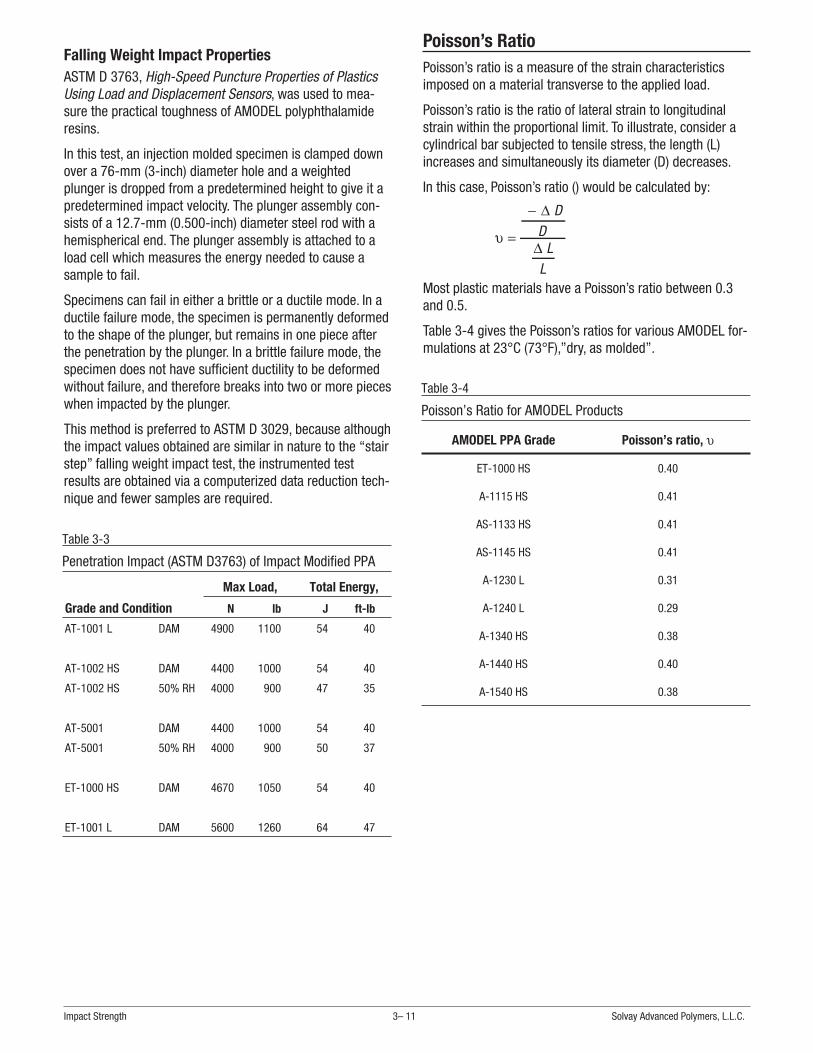
Falling Weight Impact PropertiesASTM D 3763, High-Speed Puncture Properties of PlasticsUsing Load and Displacement Sensors, was used to mea-sure the practical toughness of AMODEL polyphthalamideresins.
In this test, an injection molded specimen is clamped downover a 76-mm (3-inch) diameter hole and a weightedplunger is dropped from a predetermined height to give it apredetermined impact velocity. The plunger assembly con-sists of a 12.7-mm (0.500-inch) diameter steel rod with ahemispherical end. The plunger assembly is attached to aload cell which measures the energy needed to cause asample to fail.
Specimens can fail in either a brittle or a ductile mode. In aductile failure mode, the specimen is permanently deformedto the shape of the plunger, but remains in one piece afterthe penetration by the plunger. In a brittle failure mode, thespecimen does not have sufficient ductility to be deformedwithout failure, and therefore breaks into two or more pieceswhen impacted by the plunger.
This method is preferred to ASTM D 3029, because althoughthe impact values obtained are similar in nature to the “stairstep” falling weight impact test, the instrumented testresults are obtained via a computerized data reduction tech-nique and fewer samples are required.
Poisson’s RatioPoisson’s ratio is a measure of the strain characteristicsimposed on a material transverse to the applied load.
Poisson’s ratio is the ratio of lateral strain to longitudinalstrain within the proportional limit. To illustrate, consider acylindrical bar subjected to tensile stress, the length (L)increases and simultaneously its diameter (D) decreases.
In this case, Poisson’s ratio () would be calculated by:
υ =
− ∆
∆
DD
LL
Most plastic materials have a Poisson’s ratio between 0.3and 0.5.
Table 3-4 gives the Poisson’s ratios for various AMODEL for-mulations at 23°C (73°F),”dry, as molded”.
Impact Strength 3– 11 Solvay Advanced Polymers, L.L.C.
Max Load, Total Energy,
Grade and Condition N lb J ft-lb
AT-1001 L DAM 4900 1100 54 40
AT-1002 HS DAM 4400 1000 54 40
AT-1002 HS 50% RH 4000 900 47 35
AT-5001 DAM 4400 1000 54 40
AT-5001 50% RH 4000 900 50 37
ET-1000 HS DAM 4670 1050 54 40
ET-1001 L DAM 5600 1260 64 47
Table 3-3
Penetration Impact (ASTM D3763) of Impact Modified PPA
AMODEL PPA Grade Poisson’s ratio, υ
ET-1000 HS 0.40
A-1115 HS 0.41
AS-1133 HS 0.41
AS-1145 HS 0.41
A-1230 L 0.31
A-1240 L 0.29
A-1340 HS 0.38
A-1440 HS 0.40
A-1540 HS 0.38
Table 3-4
Poisson’s Ratio for AMODEL Products

Long-term Mechanical Properties
In order for any engineered component fabricated from apolymeric resin to perform within specified parametersthroughout its intended design life, the design engineermust consider the long term effects of a number of factors.A variety of stress loads as well as property changes due toenvironmental factors must be taken into consideration. Toassess the time related effects of stress on the behavior ofpolymeric materials, creep and fatigue properties are mea-sured. A wide variety of environmental factors can alsoaffect the performance of an engineered component andthis subject is discussed in detail in the section entitled“Environmental Resistance” starting on page 7-1. However,certain environmental factors are so pervasive that it wasdeemed appropriate to consider them in this section. Theseare the effects of moisture absorption and long-term expo-sure to high ambient temperatures.
This section will present data generated to assist the designengineer with the analysis of design life requirements. Thedata in this section includes:
* Creep modulus in tension, flexure, and compressionmodes;
* Tensile creep rupture;
* Fatigue endurance;
* Property changes due to moisture absorption;
* Dimensional changes due to moisture absorption; and
* Property changes due to long-term exposure to elevatedtemperatures.
The long term property data presented in this manual hasbeen generated to show trends and property loss for a num-ber of AMODEL PPA grades under a variety of representativeconditions. Due to the time required to generate the data,not all grades or sets of conditions can be included. Thedata are intended to show trends as a function of filler/rein-forcement systems so that the designer may make edu-cated decisions.
In some instances, attempts to generate data on long termproperties utilize “accelerated” test conditions to speed dataacquisition. Caution should be taken when evaluating datagenerated in this manner as it is often non-linear. This isespecially true when measuring property loss as a functionof elevated temperature and/or chemical exposure. Thermal“thresholds” such as the glass transition temperature (Tg)and ultimately, the melting point are the main contributors tothis non-linear behavior.
AMODEL PPA Design Guide 4– 1
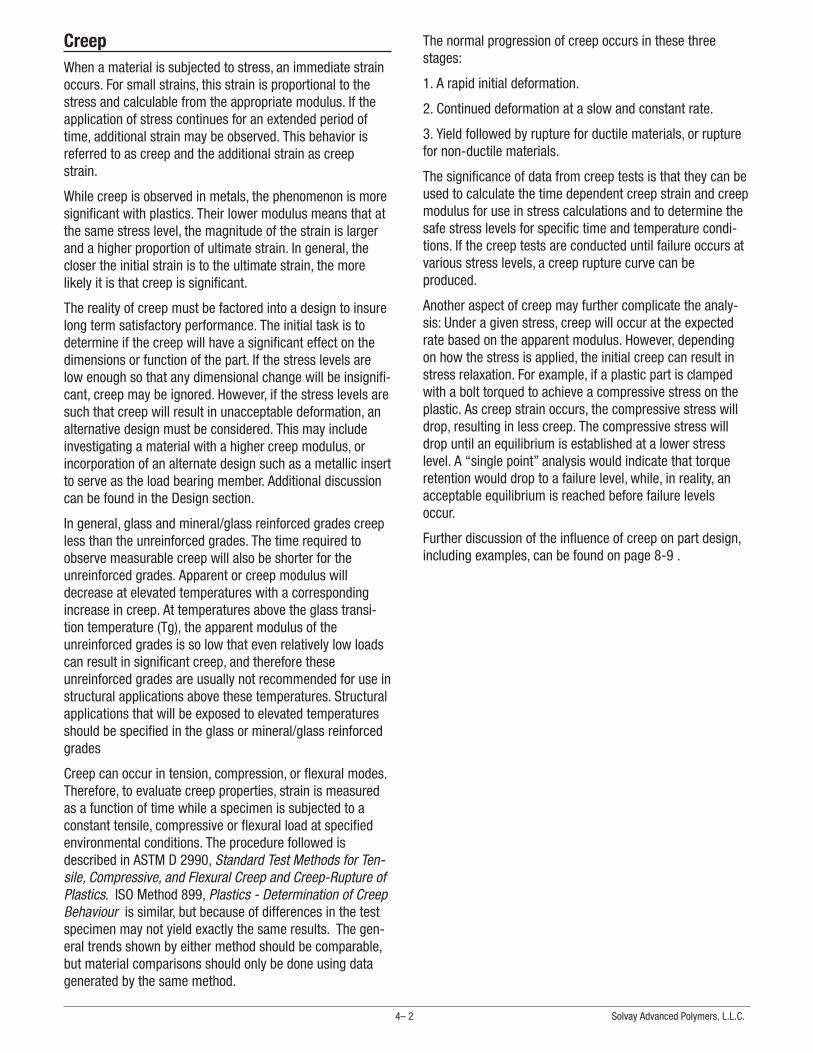
CreepWhen a material is subjected to stress, an immediate strainoccurs. For small strains, this strain is proportional to thestress and calculable from the appropriate modulus. If theapplication of stress continues for an extended period oftime, additional strain may be observed. This behavior isreferred to as creep and the additional strain as creepstrain.
While creep is observed in metals, the phenomenon is moresignificant with plastics. Their lower modulus means that atthe same stress level, the magnitude of the strain is largerand a higher proportion of ultimate strain. In general, thecloser the initial strain is to the ultimate strain, the morelikely it is that creep is significant.
The reality of creep must be factored into a design to insurelong term satisfactory performance. The initial task is todetermine if the creep will have a significant effect on thedimensions or function of the part. If the stress levels arelow enough so that any dimensional change will be insignifi-cant, creep may be ignored. However, if the stress levels aresuch that creep will result in unacceptable deformation, analternative design must be considered. This may includeinvestigating a material with a higher creep modulus, orincorporation of an alternate design such as a metallic insertto serve as the load bearing member. Additional discussioncan be found in the Design section.
In general, glass and mineral/glass reinforced grades creepless than the unreinforced grades. The time required toobserve measurable creep will also be shorter for theunreinforced grades. Apparent or creep modulus willdecrease at elevated temperatures with a correspondingincrease in creep. At temperatures above the glass transi-tion temperature (Tg), the apparent modulus of theunreinforced grades is so low that even relatively low loadscan result in significant creep, and therefore theseunreinforced grades are usually not recommended for use instructural applications above these temperatures. Structuralapplications that will be exposed to elevated temperaturesshould be specified in the glass or mineral/glass reinforcedgrades
Creep can occur in tension, compression, or flexural modes.Therefore, to evaluate creep properties, strain is measuredas a function of time while a specimen is subjected to aconstant tensile, compressive or flexural load at specifiedenvironmental conditions. The procedure followed isdescribed in ASTM D 2990, Standard Test Methods for Ten-sile, Compressive, and Flexural Creep and Creep-Rupture ofPlastics. ISO Method 899, Plastics - Determination of CreepBehaviour is similar, but because of differences in the testspecimen may not yield exactly the same results. The gen-eral trends shown by either method should be comparable,but material comparisons should only be done using datagenerated by the same method.
The normal progression of creep occurs in these threestages:
1. A rapid initial deformation.
2. Continued deformation at a slow and constant rate.
3. Yield followed by rupture for ductile materials, or rupturefor non-ductile materials.
The significance of data from creep tests is that they can beused to calculate the time dependent creep strain and creepmodulus for use in stress calculations and to determine thesafe stress levels for specific time and temperature condi-tions. If the creep tests are conducted until failure occurs atvarious stress levels, a creep rupture curve can beproduced.
Another aspect of creep may further complicate the analy-sis: Under a given stress, creep will occur at the expectedrate based on the apparent modulus. However, dependingon how the stress is applied, the initial creep can result instress relaxation. For example, if a plastic part is clampedwith a bolt torqued to achieve a compressive stress on theplastic. As creep strain occurs, the compressive stress willdrop, resulting in less creep. The compressive stress willdrop until an equilibrium is established at a lower stresslevel. A “single point” analysis would indicate that torqueretention would drop to a failure level, while, in reality, anacceptable equilibrium is reached before failure levelsoccur.
Further discussion of the influence of creep on part design,including examples, can be found on page 8-9 .
4– 2 Solvay Advanced Polymers, L.L.C.

Tensile CreepTensile creep was measured at three temperatures: 23°C(73°F); 125°C (257°F); and 175°C (347°F) and two stresslevels: 13.8 MPa (2000 psi) and 34.5 MPa (5000 psi). Testspecimens were 3.2 mm (0.125 inch) thick injection moldedASTM D-638 Type I tensile bars. Samples were placedunder test in the “dry, as molded” condition. The samplestested at the two elevated temperatures were placed in aircirculating ovens. Although the strain is measured, theresults are typically presented as the apparent modulus,which is calculated by dividing the strain by the appliedstress. The apparent modulus is the value design engineersuse in their mechanical design calculations when designingcomponents that must perform when subjected to sustainedload.
The materials tested were A-1133 HS (33% glass-fiber),A-1145 HS (45% glass-fiber), and A-1160 HSL (60%glass-fiber). The results of the room temperature testing areshown in Figures 4-1 and 4-2.
The results of the tensile creep testing at 125°C (257°F) areshown in Figures 4-3 and 4-4, and at 175°C (347°F) in Fig-ures 4-5 and 4-6.
AMODEL PPA Design Guide 4– 3 Long-term Mechanical Properties
Figure 4-1
Apparent Modulus at 23°C (73°F) and 13.8 MPa (2 kpsi)
Figure 4-2
Apparent Modulus at 23°C (73°F) and 34.5 MPa(5 kpsi)
Figure 4-3
Apparent Modulus at 125°C(257°F) and 13.8 MPa(2 kpsi)
Figure 4-4
Apparent Modulus at 125°C(257°F) and 34.5 MPa(5 kpsi)

Isochronous Stress/Strain CurvesAnother format for presenting creep data is through the useof isochronous (equal time) stress versus strain curves. Toprepare an isochronous curve, plot the stresses and theresultant strains for a single time interval and draw asmooth curve through the points. Repeat this process foreach time interval.
This method has the advantage of providing a concise sum-mary of a large amount of data. The apparent modulus atany point can be calculated by dividing the stress by theindicated strain. (Please note that the figures show strainexpressed in percent; actual strain is the plotted valuedivided by 100.)
The isochronous stress/strain curves for AMODEL A-1133HS resin at 23°C, 125°C, and 175°C are shown in Figure4-7. Figure 4-8 shows the same information for AMODELA-1145 HS and Figure 4-9 shows the data for AMODEL
Creep 4– 4 Solvay Advanced Polymers, L.L.C.
Figure 4-5
Apparent Modulus at 175°C(347°F) and 13.8 MPa(2 kpsi)
Figure 4-6
Apparent Modulus at 175°C(347°F) and 34.5 MPa(5 kpsi)
Figure 4-7
Isochronous Stress-Strain of A-1133 HS PPA
Figure 4-8
Isochronous Stress-Strain of A-1145 HS PPA
Figure 4-9
Isochronous Stress-Strain of A-1160 HSL PPA

A-1160 HSL. As expected, the more glass reinforcement inthe compound, the better the creep resistance.
Tensile Creep RuptureCreep rupture is defined as a failure or rupture that occursas a result of a sustained load. Because the stress level atwhich rupture occurs due to sustained load is lower thanthe short-term strength, creep rupture can be the limitingdesign property.
The objective of tensile creep rupture testing is to determinethe time required for a sustained load to produce a rupture.A plot of stress versus the time to rupture is commonlyknown as a “creep rupture envelope”. Because the strengthof a material varies with temperature, a “creep ruptureenvelope” can be generated for each temperature ofconcern.
Creep rupture envelopes were developed in accordance withASTM D 2990. Tensile specimens were 3.2 mm (0.125 inch)thick injection molded ASTM D 638 Type I tensile bars. Theenvironments were the same as in the tensile creep testingabove. The samples were loaded in tension using pneumati-cally actuated bellows to maintain indicated stress levels.
The tensile creep rupture envelopes for AMODEL AS-1133HS resin are shown in Figure 4-10 at 65, 100, and 150°C.
Flexural CreepFlexural creep was determined according to ASTM D 2990using the three-point bending mode with a 50.8 mm (2 inch)span. Test specimens were 127 x 12.7 x 3.2 mm (5.0 x 0.5x 0.125 inch) injection molded bars placed on test “dry, asmolded”. The environment was maintained at 50% relativehumidity and 23°C (73°F). Stress levels were predeterminedfrom flexural strength versus temperature curves and cho-sen to be 25-35% of the ultimate strength of the material atthe test temperature.
Creep resistance can be predicted to a large extent by therelationship of the service temperature to the material’sglass transition temperature. Typically, creep resistance isgood at service temperatures much lower than Tg, andbecomes poorer as service temperature approaches Tg.Therefore, it is not surprising that AMODEL resins havecreep resistance superior to many traditional semi-crystal-line thermoplastics. For example, AMODEL A-1000 resin hasa glass transition temperature of 123°C (253°F) as deter-mined by Differential Scanning Calorimetry (ASTM D 3418).The corresponding Tg for PA 66 is 65°C (149°F). At all tem-peratures up to its Tg, AMODEL resins do have superiorcreep resistance.
Figure 4-11 compares the apparent flexural modulus ofAMODEL AS-1133 HS and A-1240 L resins to a 33% glassreinforced PA 66. While the AS-1133 HS resin is clearlysuperior to the glass reinforced PA, even the mineral filled
AMODEL PPA Design Guide 4– 5 Long-term Mechanical Properties
Figure 4-10
Tensile Creep Rupture - AS-1133 HS
Figure 4-11
Apparent Flex Modulus at 69 Mpa (10 kpsi) at 23°C (73°F)
Figure 4-12
Apparent Flex Modulus at 14 Mpa (2 kpsi) at 83°C (181°F)

grade – AMODEL A-1240 resin – has an effectively highercreep modulus after 1000 hours under load.
Figure 4-12 compares the apparent flexural modulus ofAMODEL ET-1000 resin with that of unreinforced and impactmodified grades of PA66 at 83°C (181°F) and 14 MPa (2kpsi).
Compressive CreepCompressive creep was determined according to ASTMD 2990. Test specimens were 12.7 x 12.7 x 25.4 mm (0.5 x0.5 x 1.0 inch) injection molded bars. The ends of the barswere machined until they were parallel to each other within0.025 mm (0.001 inch) and perpendicular to the axis. Dis-placement was monitored with bonded strain gauges. As inthe flexural creep experiments, the stress levels were cho-sen to be less than 35% of the compressive strength at thetemperature of the test.
Figure 4-13 shows the compressive creep moduli ofAMODEL AS-1133 HS resin at 23°, 100°, and 150°C (73°,212°, and 302°F). These moduli are lower than the flexuralcreep moduli given in Figure 4-11. This is due to less fiberorientation in the direction of the induced strain.
In most applications where AMODEL resin will be loaded ina compressive manner, the load will be applied in the direc-tion transverse to flow direction and consequently the fiberorientation. Therefore, the apparent moduli presented hereare representative of the material’s performance in typicalapplications.
Fatigue ResistanceWhen a material is stressed cyclically, failure or rupture willoccur at stress levels much lower than its short-term ulti-mate strength. Examples of cyclic stress would include com-ponents subjected to severe vibration, components of
reciprocating or rotating devices where loading is cyclic, andmechanical devices such as gears where the cyclic load is afunction of position.
This phenomenon is well known in metals. Metallurgistshave defined the term “Fatigue Endurance Limit” to repre-sent the maximum cyclical stress that a material can besubjected to without failure. Normally, this stress level corre-sponds to the highest stress level that does not cause failurein 10 million (107) cycles.
While the term “Fatigue Endurance Limit” is sometimesused in design discussions involving plastic materials, theresponse of plastics to cyclic stress is more complex thanthe response of metals, and the term is not strictly applica-ble. Fatigue data is typically presented by plotting stressversus number of cycles at rupture. A smooth curve is cal-culated that represents the best fit to the data. For compo-nent design purposes, this S - N (stress - number of cycles)curve provides strength values appropriate for the compo-nents required life.
When designing a component that will be subjected to cyclicloading, the establishment of fatigue strength requirementsis desirable. However, analysis of the fatigue strengthrequirements is complicated by a large number of factorsthat may influence them. Some of these factors are: theshape of the component; stress concentration factors; therate of load application; any temperature change caused byload application; type of stress induced by load , that is, ten-sile, compressive, or shear, etc.; environmental factors, suchas, chemicals, radiation, ambient temperature; residualstresses; the duty cycle; and the desired component life.
Fatigue Strength of AMODEL resinWhen measuring and/or comparing the fatigue strength ofplastic materials, it is critical to specify the mode (tensile,
Creep 4– 6 Solvay Advanced Polymers, L.L.C.
Figure 4-13
Apparent Compressive Modulus of AS-1133 HS
Figure 4-14
Flex Fatigue of GR Resins at 23°C (73°F) and 32 Hz

compressive, or flexural), the frequency, and the stressprofile.
The fatigue strength of AMODEL resins was determined inaccordance with ASTM test method D 671. This methoduses a cantilever beam configuration with a constant deflec-tion. The results shown in Figure 4-14 were generated at afrequency of 32 Hz. Failure was defined when the stresslevel decayed to 90% of its initial value. The AMODEL resinsresist higher cyclic loads longer than PA66.
Figure 4-15 gives the fatigue behavior of AMODEL AS-1145HS resin at 110° and 170°C (230° and 338°F). As expected,raising the temperature reduces the amount of cyclic stressthat can be endured.
A good example of an application involving cyclical stress isa gear. As the driving gear causes the driven gear to rotate,each tooth is subject to stress. This is then followed by aperiod of time at low or zero stress. In designing a geartooth, the appropriate strength criteria is the fatigue endur-ance limit of the material at the operating conditions of thegear.
After all of the calculations have been made, the part designcan be modified to best utilize the properties of the selectedmaterial. Conversely, the material grade can be modified tobest suit the application requirements. An extremely usefultool to verify a design is to perform Finite Element Analysis(FEA). In FEA, the part is electronically modeled and a com-puter program is used to simulate the anticipated loads andstresses. The resulting strain levels can be evaluated and, ifnecessary, part design or material changes can be made. Itis much easier to make changes to the FEA model than to afabricated part or tooling.
Even after calculations and FEA’s have been performed, thebest way of evaluating a material for a component subject todynamic stresses is actual prototype testing. Prototype parts
can be machined from available stock shapes and subject toperformance testing under the requirements of the applica-tion. Stock shapes are usually available as extruded slabs orrods and generally exhibit slightly lower mechanical proper-ties than the injection molded part. Additionally, the machin-ing operations usually induce stresses that would not nor-mally be present in an injection molded part. As a result ofthis, a successful prototype test imparts an extremely highconfidence level in the reliability of the design.
AMODEL PPA Design Guide 4– 7 Long-term Mechanical Properties
Figure 4-15
Flex Fatigue of AS-1145 Resin at Elevated Temperature

Moisture EffectsAs with most thermoplastic resins, parts made fromAMODEL resins can absorb moisture from the atmosphere.This absorption is a physical, not a chemical change and istherefore reversible, in that parts can be “dried out” underproper conditions. AMODEL polyphthalamide resins havesignificant amounts of aromatic character in the polymeric“backbone” and this causes them to absorb much lessmoisture than aliphatic polyamides such as PA 66 and PA 6.As a result, the dimensions, strength, and stiffness ofAMODEL parts will be significantly less affected by theabsorption of moisture than traditional aliphatic PA parts.Since moisture is ubiquitous, knowledge of the effects ofmoisture on the properties of a material is critical to thedesign engineer trying to meet end use requirements.
Significance of Moisture AbsorptionWhen a polymer absorbs atmospheric moisture, a number ofchanges may occur. Obviously, the part weight will increaseand this weight increase is typically used to measure theamount of moisture absorbed. Additionally, there may besome dimensional changes, generally an increase; parts willbecome larger. The presence of reinforcing fillers such asfiberglass may result in anisotropic dimensional change dueto the fact that the fibers align themselves in the direction ofpolymer flow as the resin fills the tool. Similar to moldshrinkage values, dimensional changes due to moistureabsorption are often reported in flow and transversedirections.
Mechanical properties may also be affected by moistureabsorption. Generally, a slight decrease in physical proper-ties such as tensile and flexural strength are seen. Therespective moduli also decrease slightly. Impact strengthvalues tend to increase slightly since the presence of mois-ture can tend to plasticize the polymer. Since water is a con-ductor, absorbed moisture can have a negative effect on thedielectric properties of a molded part.
Manufacturers of polymers that absorb moisture usuallypublish two sets of data, one listing test results on testspecimens that have no absorbed moisture, commonlyreferred to as “Dry – As Molded” (DAM), and a second set ofdata that is generated on test specimens that have beenallowed to come to an equilibrium weight in a 50% RelativeHumidity environment, known as “50% RH”. Polymers likePA 6 and PA 66 absorb moisture relatively quickly and reachequilibrium in a 50% Relative Humidity environment quickly.Providing 50% RH data for these materials is fairly easy andextremely relevant to design, as will be understood in thesubsequent discussion. On the other hand, polymers likeAMODEL PPA absorb moisture very slowly and can takeyears to reach an equilibrium at 50% RH. In order to provide50% RH data, a method was developed to accelerate theconditioning of test specimens. This involves boiling the testspecimens in an aqueous solution of potassium acetate until
constant specimen weight is obtained, typically for severaldays. As would be expected, this accelerated procedure hassome side effects which influence the test values. In theaccelerated procedure, the test specimens are annealed andstress relieved, which may actually cause in an improve-ment in the property test results. Conversely, exposure toboiling water can cause some hydrolysis of the polymer,yielding a loss in properties. Additionally, exposure to theboiling salt solution has been shown to degrade the bondbetween the polymer and a reinforcing media, such as fiber-glass, resulting in a loss of mechanical properties such astensile, flexural and impact. Nonetheless, the effect ofabsorbed moisture on Amodel resins is minimal.
Moisture Absorption and Glass TransitionTemperature (Tg)Perhaps much more significant than the effect of moistureabsorption on room temperature properties is the effect ofmoisture absorption on the Glass Transition Temperature(Tg) of a polymer. By definition, the Tg of a polymer is thetemperature above which, the crystalline region of the poly-mer matrix is no longer dominant over the amorphousregion. Above the Tg, the amorphous region is dominant andthere is a noticeable loss in mechanical properties as seenin the discussion on mechanical properties vs. temperature.In unreinforced grades, this is very significant in that theproperties drop to levels which are essentially useless froma mechanical design perspective. In the reinforced grades,while the properties above Tg are still useful from a designperspective, the loss of mechanical properties is significantenough to make major design considerations.
The effect of absorbed moisture on semi-crystalline poly-mers is to lower the glass transition temperature. The sever-ity of reduction is dependent on the specific polymer and theamount of moisture absorbed.
This phenomenon becomes of significant concern whendesigning with a polymer that has a Tg near or below 100°C(212°F). For example, a polymer with a Tg of 80°C (Dry asmolded) might exhibit a Tg of only 60°C after absorbingmoisture. The designer must consider the significant loss inproperties above 60°C due to the reduction in Tg whenmaking decisions. Polymers with even lower dry Tg’s canhave a Tg reduction to at or near room temperature withmoisture absorption. This can create a significant designconsideration.
Alternatively, consider the AMODEL A-1000 series polymers,which have a dry Tg of 123°C. Absorption of moisture atroom temperature can reduce this Tg to 84°C and have aslight reduction in “room temperature” properties. However,since moisture absorption is a reversible phenomenon(moisture absorption is a physical, not a chemical reaction),at temperatures above 100°C, the polymer actually driesout, returning the Tg to the original 123°C value. Therefore,the Tg reduction due to moisture absorption is essentially
Fatigue Resistance 4– 8 Solvay Advanced Polymers, L.L.C.
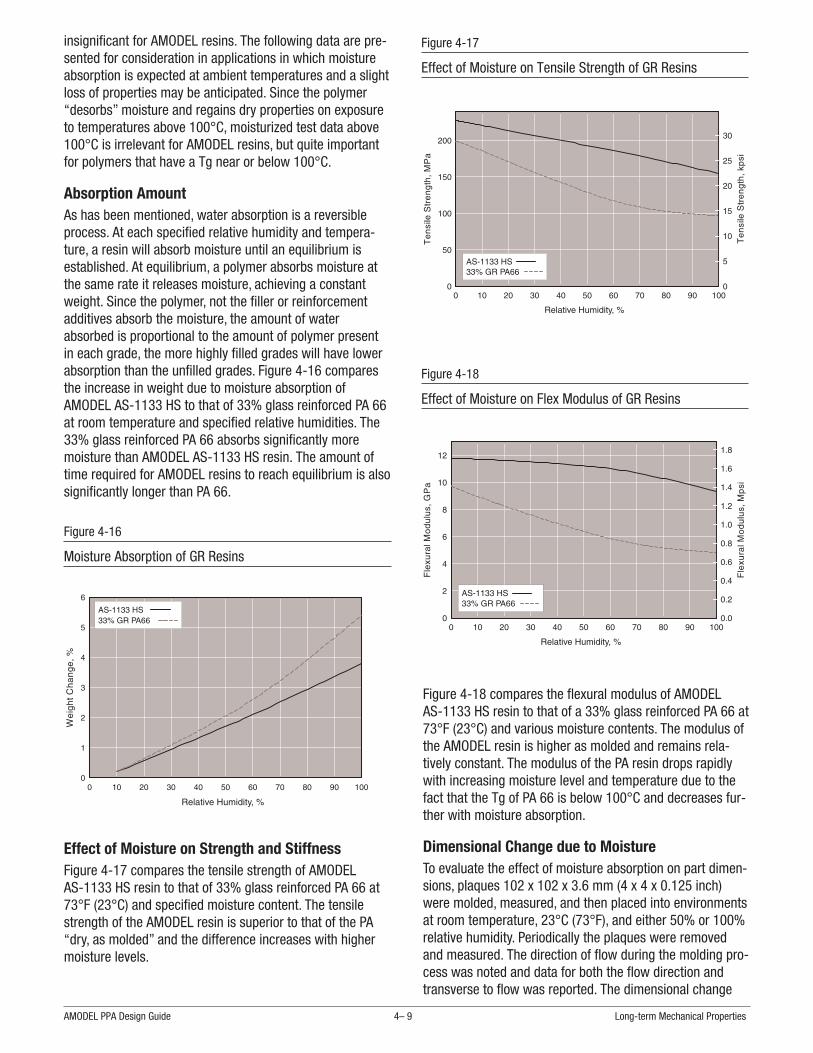
insignificant for AMODEL resins. The following data are pre-sented for consideration in applications in which moistureabsorption is expected at ambient temperatures and a slightloss of properties may be anticipated. Since the polymer“desorbs” moisture and regains dry properties on exposureto temperatures above 100°C, moisturized test data above100°C is irrelevant for AMODEL resins, but quite importantfor polymers that have a Tg near or below 100°C.
Absorption AmountAs has been mentioned, water absorption is a reversibleprocess. At each specified relative humidity and tempera-ture, a resin will absorb moisture until an equilibrium isestablished. At equilibrium, a polymer absorbs moisture atthe same rate it releases moisture, achieving a constantweight. Since the polymer, not the filler or reinforcementadditives absorb the moisture, the amount of waterabsorbed is proportional to the amount of polymer presentin each grade, the more highly filled grades will have lowerabsorption than the unfilled grades. Figure 4-16 comparesthe increase in weight due to moisture absorption ofAMODEL AS-1133 HS to that of 33% glass reinforced PA 66at room temperature and specified relative humidities. The33% glass reinforced PA 66 absorbs significantly moremoisture than AMODEL AS-1133 HS resin. The amount oftime required for AMODEL resins to reach equilibrium is alsosignificantly longer than PA 66.
Effect of Moisture on Strength and StiffnessFigure 4-17 compares the tensile strength of AMODELAS-1133 HS resin to that of 33% glass reinforced PA 66 at73°F (23°C) and specified moisture content. The tensilestrength of the AMODEL resin is superior to that of the PA“dry, as molded” and the difference increases with highermoisture levels.
Figure 4-18 compares the flexural modulus of AMODELAS-1133 HS resin to that of a 33% glass reinforced PA 66 at73°F (23°C) and various moisture contents. The modulus ofthe AMODEL resin is higher as molded and remains rela-tively constant. The modulus of the PA resin drops rapidlywith increasing moisture level and temperature due to thefact that the Tg of PA 66 is below 100°C and decreases fur-ther with moisture absorption.
Dimensional Change due to MoistureTo evaluate the effect of moisture absorption on part dimen-sions, plaques 102 x 102 x 3.6 mm (4 x 4 x 0.125 inch)were molded, measured, and then placed into environmentsat room temperature, 23°C (73°F), and either 50% or 100%relative humidity. Periodically the plaques were removedand measured. The direction of flow during the molding pro-cess was noted and data for both the flow direction andtransverse to flow was reported. The dimensional change
AMODEL PPA Design Guide 4– 9 Long-term Mechanical Properties
Figure 4-16
Moisture Absorption of GR Resins
Figure 4-17
Effect of Moisture on Tensile Strength of GR Resins
Figure 4-18
Effect of Moisture on Flex Modulus of GR Resins
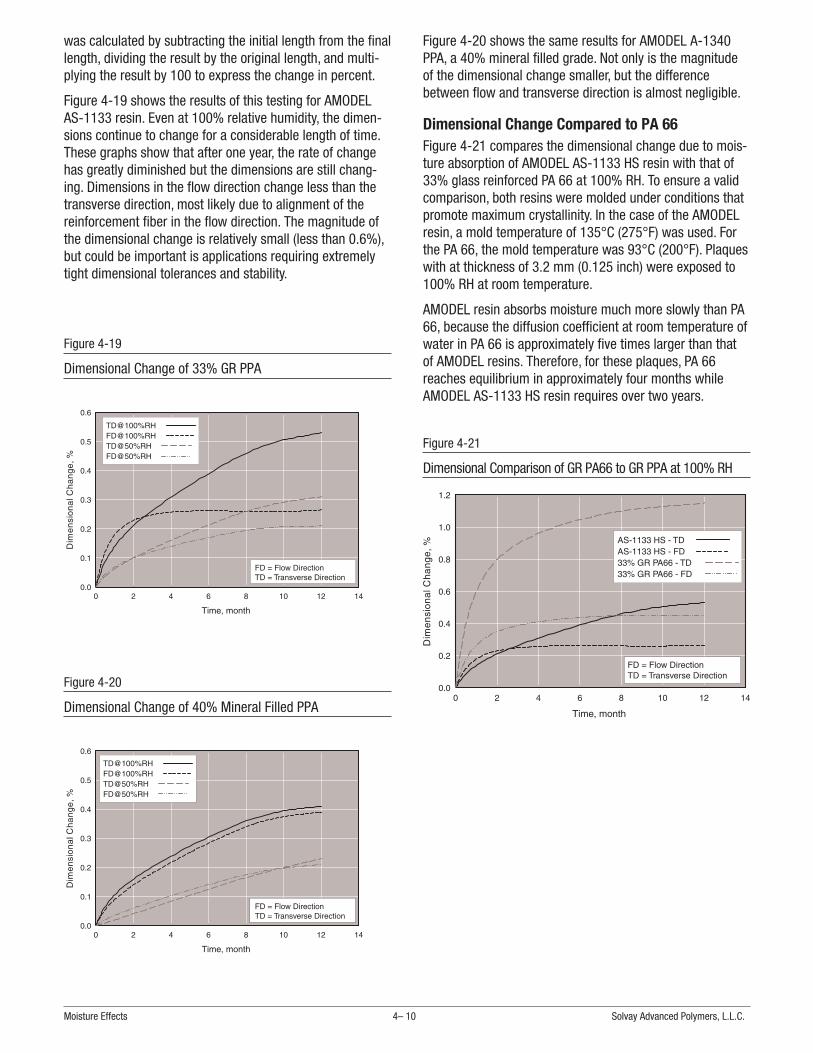
was calculated by subtracting the initial length from the finallength, dividing the result by the original length, and multi-plying the result by 100 to express the change in percent.
Figure 4-19 shows the results of this testing for AMODELAS-1133 resin. Even at 100% relative humidity, the dimen-sions continue to change for a considerable length of time.These graphs show that after one year, the rate of changehas greatly diminished but the dimensions are still chang-ing. Dimensions in the flow direction change less than thetransverse direction, most likely due to alignment of thereinforcement fiber in the flow direction. The magnitude ofthe dimensional change is relatively small (less than 0.6%),but could be important is applications requiring extremelytight dimensional tolerances and stability.
Figure 4-20 shows the same results for AMODEL A-1340PPA, a 40% mineral filled grade. Not only is the magnitudeof the dimensional change smaller, but the differencebetween flow and transverse direction is almost negligible.
Dimensional Change Compared to PA 66Figure 4-21 compares the dimensional change due to mois-ture absorption of AMODEL AS-1133 HS resin with that of33% glass reinforced PA 66 at 100% RH. To ensure a validcomparison, both resins were molded under conditions thatpromote maximum crystallinity. In the case of the AMODELresin, a mold temperature of 135°C (275°F) was used. Forthe PA 66, the mold temperature was 93°C (200°F). Plaqueswith at thickness of 3.2 mm (0.125 inch) were exposed to100% RH at room temperature.
AMODEL resin absorbs moisture much more slowly than PA66, because the diffusion coefficient at room temperature ofwater in PA 66 is approximately five times larger than thatof AMODEL resins. Therefore, for these plaques, PA 66reaches equilibrium in approximately four months whileAMODEL AS-1133 HS resin requires over two years.
Moisture Effects 4– 10 Solvay Advanced Polymers, L.L.C.
Figure 4-19
Dimensional Change of 33% GR PPA
Figure 4-20
Dimensional Change of 40% Mineral Filled PPA
Figure 4-21
Dimensional Comparison of GR PA66 to GR PPA at 100% RH

Thermal PropertiesIn general, the thermal properties characterize the way a inmaterial responds to changing temperatures, both in theshort and long term . Thermal properties include the effectsof temperature on:
• 1. Strength and stiffness,
• 2. Dimensions,
• 3. Chemical changes in the polymer itself due to ther-mal or oxidative degradation,
• 4. Softening, melting, or distortion, and
• 5. Morphology.
The properties of the material in the molten state are dis-cussed in the AMODEL PPA Processing literature. Thebehavior of the material while burning is discussed in thesection on combustion properties.
Heat Deflection Temperature - HDT
The tests most commonly used by the plastics industry tomeasure short-term thermal capability are ASTM D 648,Standard Test Method for Deflection Temperature of PlasticsUnder Flexural Load and ISO 75. Plastics - Determination ofTemperature of Deflection under Load. These tests are com-monly referred to as Heat Distortion Temperature or HDT orDeflection Temperature under Load (DTUL). Both tests aresimilar in that the test specimen is supported at two pointswhile a load is applied to the center. The temperature isincreased at a constant rate until the specimen deflects aspecified amount as indicated by a dial micrometer.
Although details such as specimen geometry, deflectionendpoint, specimen orientation, and distance between thesupports are different for these methods, the desired stresslevels for both methods includes a loading of 1.8 MPa (264psi) and 0.45 MPa (66 psi). When comparing data from mul-tiple sources, it is important to verify that the same testmethod was used for all the data being compared. In theproduct property tables starting on page 2-3, data collectedusing both methods is listed. Examination of the data willreveal a considerable amount of difference between the val-ues for some grades.
Certain test parameters can have a significant influenceupon the results obtained in this test. The designer shouldbe certain that data from multiple sources are comparable.The most common and critical error is to compare theresults from testing performed at 1.8 MPa (264 psi) withresults obtained from testing at 0.45 MPa (66 psi). AllAMODEL resins are tested at 1.8 MPa, unless otherwisespecified. The other test parameters that should be consid-ered are specimen thickness and thermal history. The testmay be performed as molded or after heat treating or
“annealing” for several hours at a temperature slightlyabove the glass transition temperature, or about 160°C(320°F) for AMODEL PPA.
In general, annealing reduces the variability in deflectiontemperature measurements, in addition to raising the valueslightly. Figure 5-1 shows the effects of mold temperatureand annealing on deflection temperature at 1.8 MPa (264psi) for AMODEL AS-1133 HS resin. As can be seen, moldtemperature and/or annealing effects can cause the deflec-tion temperature to vary by as much as 17°C (30°F). Thedeflection temperature data in this manual were generatedon specimens annealed at 160°C (320°F) for 2 hours.
Deflection Temperature is a modulus at temperature mea-surement. Classical stress/strain analysis indicates that theASTM D 648 test actually measures the temperature atwhich the flexural modulus is 240 MPa (35,000 psi) whenthe applied stress is 0.45 MPa (66 psi), or 965 MPa(140,000 psi) when the applied stress is 1.8 MPa (264 psi).Because the test method directs that the indicator bere-zeroed after five minutes, any creep strain that occurs inthe first five minutes is effectively subtracted from the end-point strain lowering the actual modulus at the end point ofthe test. The initial modulus can be related to the creepstrain.
In summary, deflection temperature does not measure ther-mal capability, it simply provides one point on the modulusversus temperature curve.
In general, HDT can only be used as a general indicator ofshort-term thermal capability. It is useful for comparing sim-ilar materials but can be misleading if, for example, anamorphous material is compared to a semi-crystallinematerial. It doesn’t provide any information about long-termthermal stability. The actual loads and performance require-ments will dictate the suitability of the material. Many
AMODEL PPA Design Guide 5– 1 Thermal Properties
Figure 5-1
Mold Temperature and Annealing Effects on HDT ofAMODEL AS-1133 HS
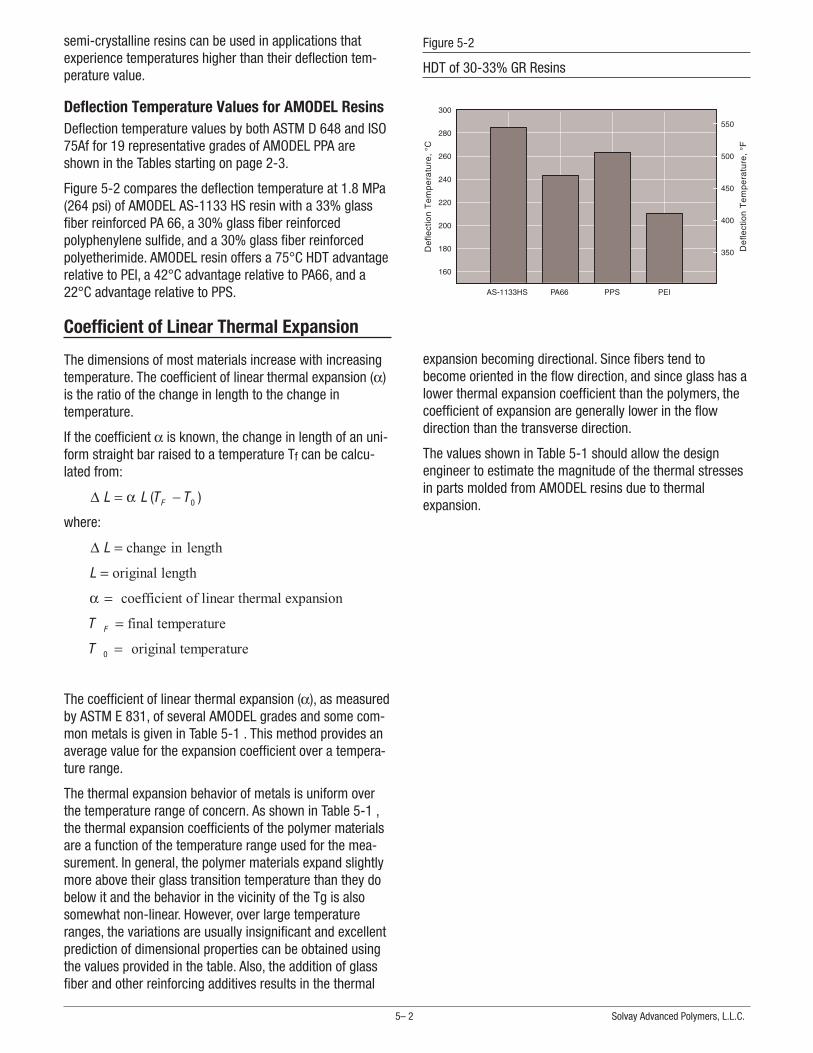
semi-crystalline resins can be used in applications thatexperience temperatures higher than their deflection tem-perature value.
Deflection Temperature Values for AMODEL ResinsDeflection temperature values by both ASTM D 648 and ISO75Af for 19 representative grades of AMODEL PPA areshown in the Tables starting on page 2-3.
Figure 5-2 compares the deflection temperature at 1.8 MPa(264 psi) of AMODEL AS-1133 HS resin with a 33% glassfiber reinforced PA 66, a 30% glass fiber reinforcedpolyphenylene sulfide, and a 30% glass fiber reinforcedpolyetherimide. AMODEL resin offers a 75°C HDT advantagerelative to PEI, a 42°C advantage relative to PA66, and a22°C advantage relative to PPS.
Coefficient of Linear Thermal Expansion
The dimensions of most materials increase with increasingtemperature. The coefficient of linear thermal expansion (α)is the ratio of the change in length to the change intemperature.
If the coefficient α is known, the change in length of an uni-form straight bar raised to a temperature Tf can be calcu-lated from:
∆ L L T TF= −α ( )0
where:
∆ L = change in length
L = original length
α = coefficient of linear thermal expansion
T F = final temperature
T 0 = original temperature
The coefficient of linear thermal expansion (α), as measuredby ASTM E 831, of several AMODEL grades and some com-mon metals is given in Table 5-1 . This method provides anaverage value for the expansion coefficient over a tempera-ture range.
The thermal expansion behavior of metals is uniform overthe temperature range of concern. As shown in Table 5-1 ,the thermal expansion coefficients of the polymer materialsare a function of the temperature range used for the mea-surement. In general, the polymer materials expand slightlymore above their glass transition temperature than they dobelow it and the behavior in the vicinity of the Tg is alsosomewhat non-linear. However, over large temperatureranges, the variations are usually insignificant and excellentprediction of dimensional properties can be obtained usingthe values provided in the table. Also, the addition of glassfiber and other reinforcing additives results in the thermal
expansion becoming directional. Since fibers tend tobecome oriented in the flow direction, and since glass has alower thermal expansion coefficient than the polymers, thecoefficient of expansion are generally lower in the flowdirection than the transverse direction.
The values shown in Table 5-1 should allow the designengineer to estimate the magnitude of the thermal stressesin parts molded from AMODEL resins due to thermalexpansion.
5– 2 Solvay Advanced Polymers, L.L.C.
Figure 5-2
HDT of 30-33% GR Resins

AMODEL PPA Design Guide 5– 3 Coefficient of Linear Thermal Expansion
Values are 10-6 L/L per degree where L is Length
Temperature 0 - 50°C (32 - 122°F) 50 - 100°C (122 - 212°F) 100 - 150°C (212 - 302°F) 150 - 200°C (302 - 392°F)
Direction FD* TD** FD* TD** FD* TD** FD* TD**
Units /°C /°F /°C /°F /°C /°F /°C /°F /°C /°F /°C /°F /°C /°F /°C /°F
Glass-Reinforced GradesA-1133 HS 24 13 50 28 24 13 60 33 27 15 99 55 27 15 130 72
A-1145 HS 22 12 49 27 21 12 58 32 27 15 88 49 15 8 122 68
A-1160 HSL 18 10 40 22 18 10 49 27 12 7 89 49 9 5 106 59
A-4133 L 22 12 66 37 20 11 88 49 17 9 119 66 5 3 152 84
A-6135 HN 23 13 59 33 21 12 63 35 16 9 96 53 15 8 109 61
AS-4133 HS 20 11 64 36 20 11 87 48 20 11 114 63 9 5 126 70
Toughened GradesAT-1002 HS 70 39 84 47 85 47 101 56 145 81 126 70 112 62 153 85
ET-1000HS 68 38 80 44 85 47 81 45 147 82 97 54 142 79 113 63
ET-1001 L 71 39 69 38 94 52 80 44 167 93 88 49 170 94 118 66
AT-5001 93 52 106 59 136 76 144 80 184 102 184 102 153 85 142 79
Toughened Glass-Reinforced GradesAT-1116 HS 20 11 72 40 23 13 77 43 16 9 116 64 16 9 133 74
AT-6115 HS 23 13 83 46 21 12 97 54 34 19 116 64 26 14 121 67
Flame Retardant GradesAFA-6133 V0 Z 18 10 56 31 16 9 72 40 11 6 93 52 3 2 120 67
FR-4133 21 12 56 31 18 10 73 41 10 6 102 57 5 3 113 63
Mineral and Mineral/Glass Filled GradesA-1240 L 26 14 68 38 19 11 91 51 18 10 117 65 15 8 121 67
A-1340 HS 34 19 50 28 42 23 60 33 51 28 103 57 19 11 103 57
A-1565 HS 20 11 34 19 20 11 39 22 20 11 72 40 14 8 89 49
AS-1566 HS 17 9 36 20 17 9 44 24 17 9 59 33 16 9 85 47
AP-9240NL 54 30 48 27 87 48 61 34 110 61 81 45 87 48 110 61
Common MetalsZinc Alloy 27 15 27 15 27 15 27 15 27 15 27 15 27 15 27 15
Aluminum Alloy A-360 21 12 21 12 21 12 21 12 21 12 21 12 23 13 23 13
Stainless Steel 17 9 17 9 17 9 17 9 17 9 17 9 18 10 18 10
Carbon Steel 11 6 11 6 11 6 11 6 11 6 11 6 12 7 12 7
* FD = Flow Direction ** TD = Tranverse Direction or Perendicular to Flow Direction.
Table 5-1
Coefficients of Linear Thermal Expansion
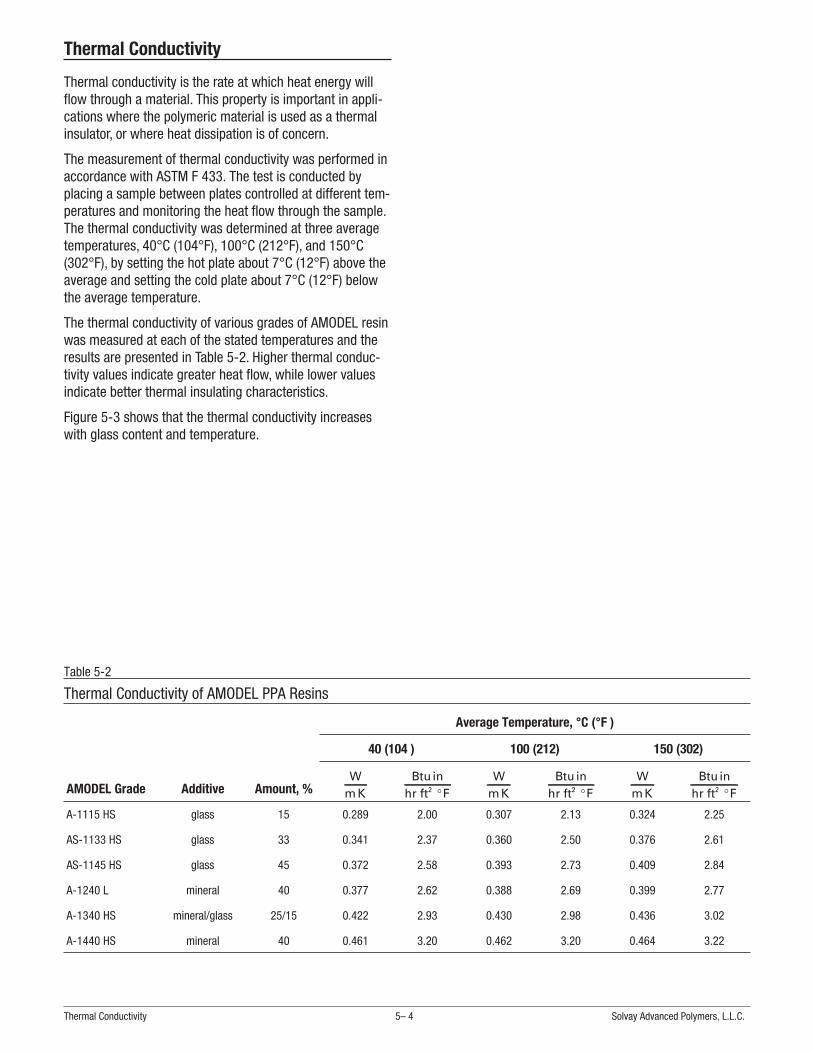
Thermal Conductivity
Thermal conductivity is the rate at which heat energy willflow through a material. This property is important in appli-cations where the polymeric material is used as a thermalinsulator, or where heat dissipation is of concern.
The measurement of thermal conductivity was performed inaccordance with ASTM F 433. The test is conducted byplacing a sample between plates controlled at different tem-peratures and monitoring the heat flow through the sample.The thermal conductivity was determined at three averagetemperatures, 40°C (104°F), 100°C (212°F), and 150°C(302°F), by setting the hot plate about 7°C (12°F) above theaverage and setting the cold plate about 7°C (12°F) belowthe average temperature.
The thermal conductivity of various grades of AMODEL resinwas measured at each of the stated temperatures and theresults are presented in Table 5-2. Higher thermal conduc-tivity values indicate greater heat flow, while lower valuesindicate better thermal insulating characteristics.
Figure 5-3 shows that the thermal conductivity increaseswith glass content and temperature.
Thermal Conductivity 5– 4 Solvay Advanced Polymers, L.L.C.
AMODEL Grade Additive Amount, %
Average Temperature, °C (°F )
40 (104 ) 100 (212) 150 (302)
Wm K
Btu inhr ft F2 °
Wm K
Btu inhr ft F2 °
Wm K
Btu inhr ft F2 °
A-1115 HS glass 15 0.289 2.00 0.307 2.13 0.324 2.25
AS-1133 HS glass 33 0.341 2.37 0.360 2.50 0.376 2.61
AS-1145 HS glass 45 0.372 2.58 0.393 2.73 0.409 2.84
A-1240 L mineral 40 0.377 2.62 0.388 2.69 0.399 2.77
A-1340 HS mineral/glass 25/15 0.422 2.93 0.430 2.98 0.436 3.02
A-1440 HS mineral 40 0.461 3.20 0.462 3.20 0.464 3.22
Table 5-2
Thermal Conductivity of AMODEL PPA Resins

Specific Heat
Specific heat is defined as the amount of heat required tochange the temperature of a unit mass one degree. Figures5-5 through 5-7 show the specific heat as a function oftemperature for the AMODEL base resins. Notice that thespecific heat changes significantly at the melting point. Thisbehavior is typical of semi-crystalline thermoplastics.
This information can be used by process engineers to calcu-late the heat input needed to process AMODEL resins onequipment such as extruders or injection molding machines.
AMODEL PPA Design Guide 5– 5 Thermal Conductivity
Figure 5-4
AMODEL A-4000 - Specific Heat vs. Temperature
Figure 5-5
AMODEL A-1000 PPA - Specific Heat vs. Temperature
Figure 5-6
AMODEL A-5000 - Specific Heat vs. Temperature
Figure 5-7
AMODEL A-6000 - Specific Heat vs. Temperature

Thermal Stability
The general term, thermal stability, is used to describe theability of a material to resist loss of properties due to heat.Various methods are used to evaluate this tendency. In thenext section, we will discuss several of these methods,including thermogravimetric analysis, and long-term heataging.
Thermogravimetric Analysis (TGA)Thermogravimetric analysis is performed by increasing thetemperature of a small sample of the test material at a con-stant rate while monitoring its weight. The atmosphere iscontrolled and the test can be performed using air or aninert atmosphere, such as nitrogen. Figure 5-8 shows theweight loss of AMODEL A-1000 resin as a function of tem-perature in air at a heating rate of 10°C/min (18°F/min). Thegraph shows that AMODEL PPA resins are thermally stablebeyond the recommended upper processing temperaturelimit of 350°C (662°F).
Thermal AgingNearly all polymeric materials exhibit some loss of perfor-mance properties after long-term exposure to elevated tem-peratures. While some polymers are more stable than oth-ers, the property loss is typically a function of both exposuretime and temperature. Because the property losses resultfrom both oxidative attack and thermal degradation, theterm “thermal oxidative stability” is frequently used.
Thermal oxidative stability limits the acceptable long-termuse temperature of some polymers. To evaluate theselong-term effects on the properties of AMODELpolyphthalamide, molded test specimens of AMODEL resinswere placed in circulating air ovens at several elevated tem-peratures. Specimens were removed from the oven at
regular intervals, then tested at room temperature for tensilestrength and impact resistance.
Typically, these aging tests are run until the property beingmonitored has been reduced to one-half its starting value.The aging tests are conducted at several aging tempera-tures and an “Arrhenius Plot” is prepared. An “Arrheniusplot” plots the heat aging time required to reduce a propertyto one-half of its starting value, sometimes referred to as itshalf-life, against the reciprocal of the aging temperature indegrees Kelvin. The advantage of analyzing the data in thismanner is that the plot is theoretically a straight line and,therefore, easily extrapolated.
Figure 5-9 shows the plot of tensile strength half lives ofAMODEL AS-1133 HS resin and GR PA66 versus the agingtemperature. Amodel PPA maintains its tensile strength lon-ger than PA66 does.
Thermal Stability 5– 6 Solvay Advanced Polymers, L.L.C.
Figure 5-8
Thermogravimetric Analysis of A-1000 in Air
Figure 5-9
Thermal Aging Comparison - Tensile Strength
Figure 5-10
Thermal Aging Comparison - Izod Impact

Figure 5-10 shows the thermal aging curves for notchedIzod half lives of AMODEL AS-1133 HS resin and GR PA66versus aging temperature. AMODEL PPA also requires longeraging times before loss of impact resistance occurs thanthe PA66 resin.
Thermal aging tests like this are used to compare plasticmaterials and to estimate their service life. The service lifeof a material at a particular end use temperature will belargely dependent upon the requirements of the applicationand should be judged on the basis of its heat aging data andactual or simulated end use testing.
Relative Thermal Index (UL)A primary function of Underwriters Laboratories Inc is toassist in the assessment of the risk of fire associated withelectrical devices. Because insulating materials may deteri-orate over time some method of evaluating this tendencyand providing guidance to designers and users of electricaldevices was required. Underwriters Laboratories (UL) hasdeveloped a method and rating system for this purpose. Thismethod is UL Standard 746B, Polymeric Materials,Long-Term Property Evaluation. A similar method is ASTMD 3045, Standard Practice for Heat Aging of Plastics WithoutLoad.
Based on the results of aging tests as described in the pre-vious section, Underwriters Laboratories assigns a ratingcalled the “Relative Thermal Index” to insulating materials.Because all material properties do not decay at the samerate, a material may have different Relative Thermal Indicesfor electrical properties, mechanical properties withoutimpact, and mechanical properties with impact.
The Relative Thermal Index or RTI is determined by a statis-tical analysis of thermal aging data for the properties beingevaluated. The RTI predicts the aging temperature that amaterial can endure for 10,000 hours and still retain at leastfifty percent of the initial property or properties beingmeasured.
Because the rate of decay is greater for thinner specimens,UL gives RTI ratings for each thickness tested.
To obtain a UL RTI rating, a long-term heat aging program isperformed. Sets of test specimens molded from the materialto be tested are put into ovens at preset temperatures. Peri-odically specimens are removed and tested. The results foreach aging temperature are plotted on a time versus prop-erty graph, until the property being measured has declinedto 50 percent or less of its initial value. This combination oftime and aging temperature can be referred to as the“half-life” for that property, material, and thickness.
The half-lives (time to 50% or less) for a particular property,which were experimentally determined at four aging tem-peratures, are plotted against the reciprocal of the absoluteaging temperature. The points should establish a straightline which can be extrapolated to predict the half-life of the
material for the particular property at other temperatures.This is called an “Arrhenius plot”.
To estimate the RTI for the material, the best fit straight lineis drawn through the four half-life points for tensile strengthand extended to 10,000 hours. The temperature at whichthis line crosses the 10,000 hours line is an estimate of theRTI for the material. If only three half-life points are avail-able, such as when the data for the fourth temperature isstill under test, then a provisional RTI can be granted. TheRTI assigned by UL may be somewhat lower as statisticalmethods are used to compensate for experimentalvariability.
Testing of AMODEL resins for the establishment of UL Rela-tive Thermal Indices is a continuing long-term activity. TheUL ratings of some AMODEL resins when this manual wasprinted is shown in Table 5-3. Because this testing is ongo-ing, the Underwriters’ Laboratories website(http://data.ul.com/ULiQ_Link/index.asp) should be con-sulted for the latest RTI’s.
AMODEL PPA Design Guide 5– 7 Thermal Stability
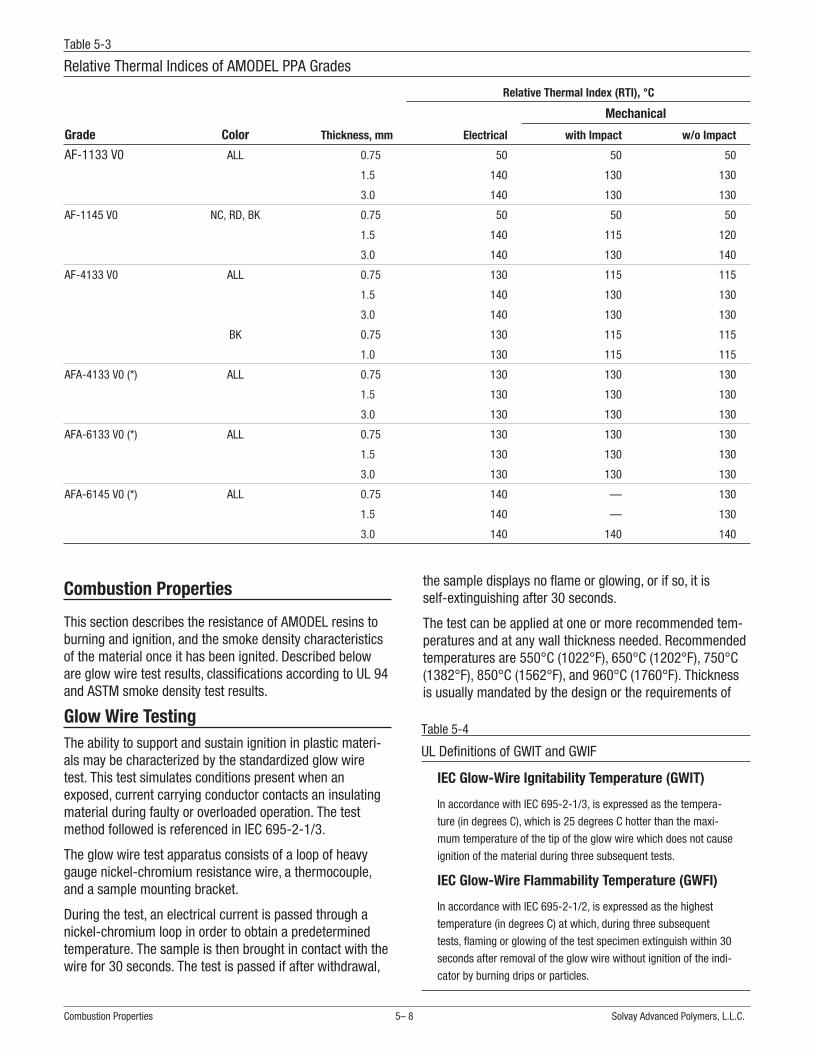
Combustion Properties
This section describes the resistance of AMODEL resins toburning and ignition, and the smoke density characteristicsof the material once it has been ignited. Described beloware glow wire test results, classifications according to UL 94and ASTM smoke density test results.
Glow Wire TestingThe ability to support and sustain ignition in plastic materi-als may be characterized by the standardized glow wiretest. This test simulates conditions present when anexposed, current carrying conductor contacts an insulatingmaterial during faulty or overloaded operation. The testmethod followed is referenced in IEC 695-2-1/3.
The glow wire test apparatus consists of a loop of heavygauge nickel-chromium resistance wire, a thermocouple,and a sample mounting bracket.
During the test, an electrical current is passed through anickel-chromium loop in order to obtain a predeterminedtemperature. The sample is then brought in contact with thewire for 30 seconds. The test is passed if after withdrawal,
the sample displays no flame or glowing, or if so, it isself-extinguishing after 30 seconds.
The test can be applied at one or more recommended tem-peratures and at any wall thickness needed. Recommendedtemperatures are 550°C (1022°F), 650°C (1202°F), 750°C(1382°F), 850°C (1562°F), and 960°C (1760°F). Thicknessis usually mandated by the design or the requirements of
Combustion Properties 5– 8 Solvay Advanced Polymers, L.L.C.
Relative Thermal Index (RTI), °C
Mechanical
Grade Color Thickness, mm Electrical with Impact w/o Impact
AF-1133 V0 ALL 0.75 50 50 50
1.5 140 130 130
3.0 140 130 130
AF-1145 V0 NC, RD, BK 0.75 50 50 50
1.5 140 115 120
3.0 140 130 140
AF-4133 V0 ALL 0.75 130 115 115
1.5 140 130 130
3.0 140 130 130
BK 0.75 130 115 115
1.0 130 115 115
AFA-4133 V0 (*) ALL 0.75 130 130 130
1.5 130 130 130
3.0 130 130 130
AFA-6133 V0 (*) ALL 0.75 130 130 130
1.5 130 130 130
3.0 130 130 130
AFA-6145 V0 (*) ALL 0.75 140 — 130
1.5 140 — 130
3.0 140 140 140
Table 5-3
Relative Thermal Indices of AMODEL PPA Grades
IEC Glow-Wire Ignitability Temperature (GWIT)
In accordance with IEC 695-2-1/3, is expressed as the tempera-
ture (in degrees C), which is 25 degrees C hotter than the maxi-
mum temperature of the tip of the glow wire which does not cause
ignition of the material during three subsequent tests.
IEC Glow-Wire Flammability Temperature (GWFI)
In accordance with IEC 695-2-1/2, is expressed as the highest
temperature (in degrees C) at which, during three subsequent
tests, flaming or glowing of the test specimen extinguish within 30
seconds after removal of the glow wire without ignition of the indi-
cator by burning drips or particles.
Table 5-4
UL Definitions of GWIT and GWIF
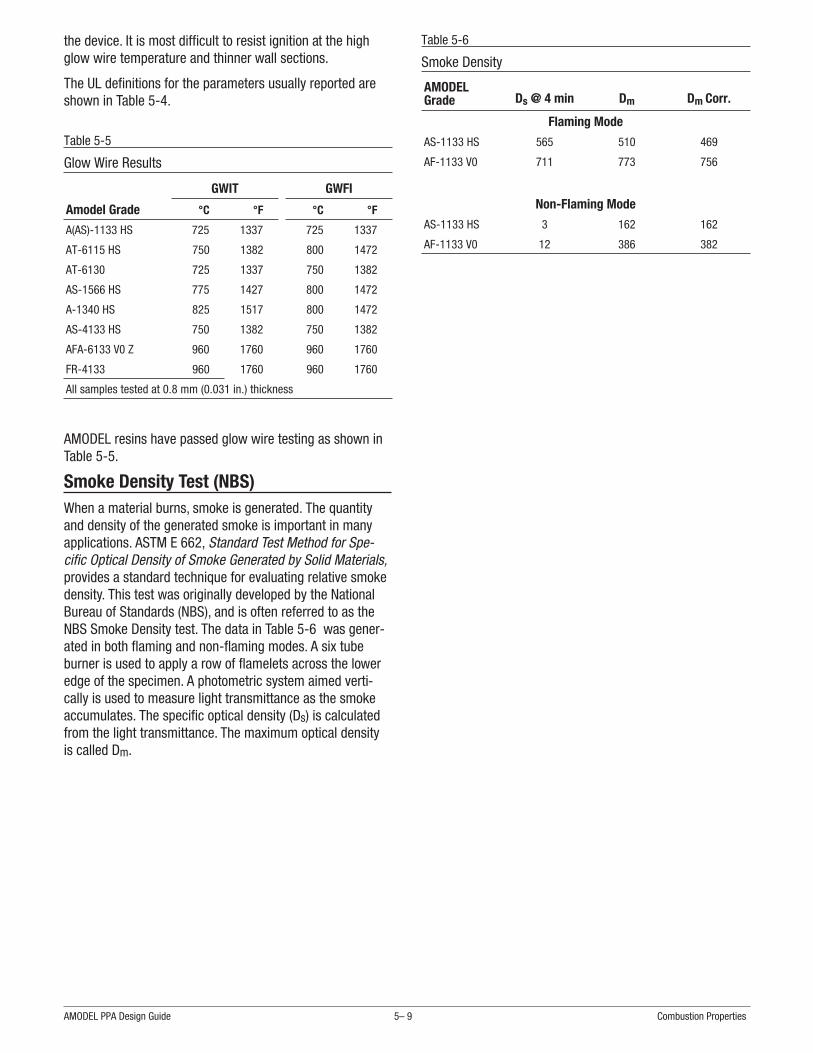
the device. It is most difficult to resist ignition at the highglow wire temperature and thinner wall sections.
The UL definitions for the parameters usually reported areshown in Table 5-4.
AMODEL resins have passed glow wire testing as shown inTable 5-5.
Smoke Density Test (NBS)When a material burns, smoke is generated. The quantityand density of the generated smoke is important in manyapplications. ASTM E 662, Standard Test Method for Spe-cific Optical Density of Smoke Generated by Solid Materials,provides a standard technique for evaluating relative smokedensity. This test was originally developed by the NationalBureau of Standards (NBS), and is often referred to as theNBS Smoke Density test. The data in Table 5-6 was gener-ated in both flaming and non-flaming modes. A six tubeburner is used to apply a row of flamelets across the loweredge of the specimen. A photometric system aimed verti-cally is used to measure light transmittance as the smokeaccumulates. The specific optical density (Ds) is calculatedfrom the light transmittance. The maximum optical densityis called Dm.
AMODEL PPA Design Guide 5– 9 Combustion Properties
GWIT GWFI
Amodel Grade °C °F °C °F
A(AS)-1133 HS 725 1337 725 1337
AT-6115 HS 750 1382 800 1472
AT-6130 725 1337 750 1382
AS-1566 HS 775 1427 800 1472
A-1340 HS 825 1517 800 1472
AS-4133 HS 750 1382 750 1382
AFA-6133 V0 Z 960 1760 960 1760
FR-4133 960 1760 960 1760
All samples tested at 0.8 mm (0.031 in.) thickness
Table 5-5
Glow Wire Results
AMODELGrade Ds @ 4 min Dm Dm Corr.
Flaming Mode
AS-1133 HS 565 510 469
AF-1133 V0 711 773 756
Non-Flaming Mode
AS-1133 HS 3 162 162
AF-1133 V0 12 386 382
Table 5-6
Smoke Density

Vertical Flammability per UL 94The UL 94 flammability standard established by Underwrit-ers’ Laboratories is a system by which plastic materials canbe classified with respect to their ability to withstand com-bustion. The flammability rating given to a plastic material isdependent upon the response of the material to heat andflame under controlled laboratory conditions and serves as apreliminary indicator of its acceptability with respect toflammability for a particular application. The actual responseto heat and flame of a thermoplastic depends on other fac-tors such as the size, form, and end-use of the productusing the material. Additionally, characteristics in end-useapplication such as ease of ignition, burning rate, flamespread, fuel contribution, intensity of burning, and productsof combustion will affect the combustion response of thematerial.
Three primary test methods comprise the UL 94 standard.They are the Horizontal Burning Test, the 20 MM VerticalBurning Test, and the 500 MW Vertical Burning Test.
Horizontal Burning TestFor a 94HB classification rating, injection molded test speci-mens are limited to a 125 mm (5.0 inch) length, 13 mm (0.5inch) width and the minimum thickness for which the ratingis desired. The samples are clamped in a horizontal positionwith a 20 mm blue flame applied to the unclamped edge ofthe specimen at a 45 degree angle for 30 seconds or so assoon as the combustion front reaches a premarked line 25mm from the edge of the bar. After the flame is removed,the rate of burn for the combustion front to travel from the25 mm line to a premarked 100 mm line is calculated. Atleast three specimens are tested in this manner. A plasticobtains a 94HB rating by not exceeding a burn rate of 40mm/min for specimens having a thickness greater than 3mm or 75 mm/min for bars less than 3 mm thick. The ratingis also extended to products that do not support combustionto the 100 mm reference mark.
AMODEL AS-1133 HS resin has obtained a 94HB rating inthe Horizontal Burning Test, at thicknesses down to 0.8 mmin a black color.
20 MM Vertical Burn TestMaterials can be classified 94V-0, 94V-1, or 94V-2 on thebasis of results obtained from the combustion of samplesclamped in a vertical position. The 20 MM Vertical Burn Testis more aggressive than the 94HB test and is done on sam-ples that measure 125 mm in length, 13 mm in width, andthe minimum thickness at which the rating is desired (typi-cally 0.8 mm or 1.57 mm). The samples are clamped in avertical position with a 20 mm high blue flame applied tothe lower edge of the clamped specimen. The flame isapplied for 10 seconds and removed. When the specimenstops burning, the flame is reapplied for an additional 10seconds and then removed. A total of five bars are tested in
this manner. Table 5-7 lists the criteria by which a materialis classified in this test.
In the 20 MM Vertical Burning Test, AMODEL resins AF-1115V0, AF-1133 V0, and AF-1145 V0 have been recognized byUL with a 94V-0 rating at specimen thicknesses down to0.032 inch (0.8 mm) in black and natural colors.
500 W Vertical Burning TestA material which passes the flammability requirementsestablished by the 500 W Vertical Burning Test earns eithera 94-5VA or 94-5VB rating. This particular test is the mostsevere of the three described. The dimensions of the moldedbars used in this test are identical to those used for the 20MM Vertical Burning Test. Additionally, plaques are requiredthat measure 150 mm (5.9 in.) by 150 mm (5.9 in.) by theminimum and maximum thicknesses required for the appli-cation. The bars are clamped in a vertical position with a125 mm high flame applied five times for five seconds eachtime with a five second interval between each application.The plaques are clamped in a horizontal, flat position with a125 mm high flame applied to the bottom surface at a 20degree angle using the same burn times described for thebars. Table 5-8 lists the criteria that must be met to obtain a94-5VA or 94-5VB rating.
Smoke Density Test (NBS) 5– 10 Solvay Advanced Polymers, L.L.C.
Criteria Conditions 94V-0 94V-1 94V-2
Afterflame time for each individualspecimen,(t1 or t2)
≤ 10s ≤ 30s ≤ 30s
Total afterflame time for anycondition set (t1 + t2 for the 5specimens)
≤ 50s ≤ 250s ≤ 250s
Afterflame plus afterglow time foreach individual specimen after thesecond flame application (t2 + t3)
≤ 30s ≤ 60s ≤ 60s
Afterflame or afterglow of anyspecimen up to the holding clamp
No No No
Cotton indicator ignited by flamingparticles or drops
No No Yes
Table 5-7
UL Criteria for Classifying Materials V-0, V-1, or V-2
Criteria Conditions 94-5VA 94-5VB
Afterflame time plus afterglow time after fifthflame application for each individual barspecimen
≤ 60s ≤ 60s
Cotton indicator ignited by flaming particles ordrops from any bar specimen
No No
Burn-through (hole) of any plaque specimen No Yes
Table 5-8
UL Criteria for Classifying Materials 5VA or 5VB
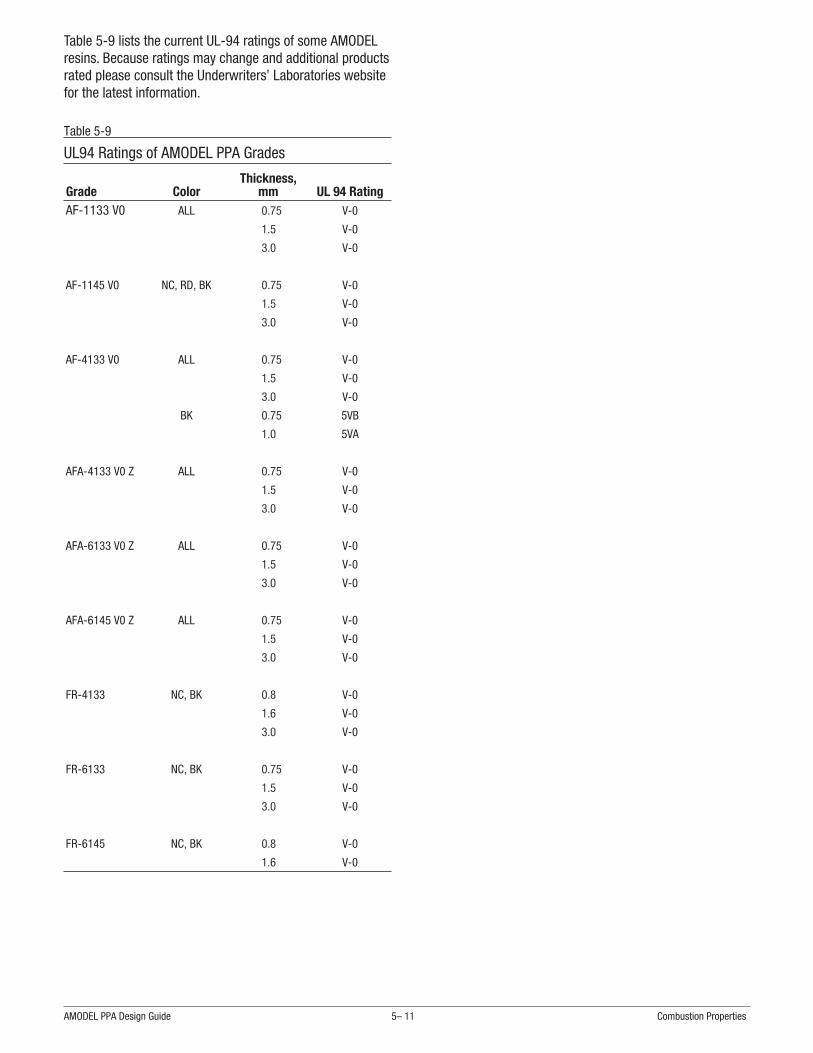
Table 5-9 lists the current UL-94 ratings of some AMODELresins. Because ratings may change and additional productsrated please consult the Underwriters’ Laboratories websitefor the latest information.
AMODEL PPA Design Guide 5– 11 Combustion Properties
Grade ColorThickness,
mm UL 94 RatingAF-1133 V0 ALL 0.75 V-0
1.5 V-0
3.0 V-0
AF-1145 V0 NC, RD, BK 0.75 V-0
1.5 V-0
3.0 V-0
AF-4133 V0 ALL 0.75 V-0
1.5 V-0
3.0 V-0
BK 0.75 5VB
1.0 5VA
AFA-4133 V0 Z ALL 0.75 V-0
1.5 V-0
3.0 V-0
AFA-6133 V0 Z ALL 0.75 V-0
1.5 V-0
3.0 V-0
AFA-6145 V0 Z ALL 0.75 V-0
1.5 V-0
3.0 V-0
FR-4133 NC, BK 0.8 V-0
1.6 V-0
3.0 V-0
FR-6133 NC, BK 0.75 V-0
1.5 V-0
3.0 V-0
FR-6145 NC, BK 0.8 V-0
1.6 V-0
Table 5-9
UL94 Ratings of AMODEL PPA Grades

Electrical PropertiesMany applications for thermoplastic resins depend upontheir ability to function as electrical insulators. A wide vari-ety of tests have been developed to measure specificaspects of material performance in electrical applications. Abrief description of some of the more common tests follows:
Dielectric Breakdown Voltage and Strength- ASTM D 149Dielectric strength is a measure of the ability of a material toresist high voltage without dielectric breakdown. It is mea-sured by placing a specimen between two electrodes andincreasing the applied voltage until dielectric breakdownoccurs. The dielectric strength is reported at the highestvoltage prior to failure. Of the various methods included inASTM D 149, UL 746A specifies the short-time test using auniform rate of voltage increase of 500 volts per second.
Although the results are reported in units of kV/mm(volts/mil), the dielectric strength is a function of thickness,moisture content, and temperature. Therefore, data on dif-ferent materials are comparable only for equivalent samplethickness, moisture content, and test temperature.
Table 6-1 shows the dielectric strengths of several AMODELgrades. The dielectric strength of samples conditioned to50% RH are the same as the dry as molded samples.
Volume Resistivity - ASTM D 257The volume resistivity of a material is defined as the electri-cal resistance of a unit cube of material. The material issubjected to 500 volts DC for 1 minute, and the currentthrough the material is measured. Materials with higher vol-ume resistivity are more effective at electrically isolatingcomponents.
UL 746A specifies that the test be run on two sets of speci-mens: one set conditioned for 48 hours at 73°F (23°C) and50% relative humidity; and the other conditioned for 96hours at 95°F (35°C) and 90% relative humidity.
Volume resistivity is particularly sensitive to temperaturechanges as well as changes in humidity. Data on differentmaterials are comparable only for equivalent moisture con-tent and temperatures. Materials with resistivities above 108
ohm-cm are considered insulators, while those with valuesof 103 to 108 ohm-cm are partial conductors.
Surface Resistivity - ASTM D 257The surface resistivity of a material is the electrical resis-tance between two electrodes on the surface of the speci-men. The material is subjected to 500 volts DC for 1 minute,and the current along the surface of the material is mea-sured. Although some finite thickness of material is actuallycarrying the current, this thickness is not measurable, there-fore, this property is an approximate measure. Surfaceresistivity is affected by surface contamination and is not
AMODEL PPA Design Guide 6– 1 Electrical Properties
Thickness3.2 mm (1/8”) 1.6 mm (1/16”)
Grade Cond.* kV/mm V/mil kV/mm V/milA-1133 HS dry 21 533 32 813
A-1133 HS 50%RH 21 533
A-1145 HS dry 23 584
A-1145 HS 50%RH 23 584
AS-4133 HS dry 21 533 32 813
AS-4133 HS 50%RH 21 533
AT-1002 HS dry 17 432
AT-1002 HS 50%RH 17 432
AT-5001 dry 17 432
AT-5001 50%RH 17 432
AT-6115 HS dry 28 711
AFA-6133 V0 Z dry 24 610 27 686
FR-4133 dry 20 508 29 737
A-1340 HS dry 32 813
AS-1566 HS dry 29 737
*Condition, dry is dry as molded, 50%RH is moisture conditioned asdescribed on page 2-3.
Table 6-1
Dielectric Strength of Selected AMODEL GradesGrade Cond.*
VolumeResistivity,
ohm-cm
SurfaceResistivity,
ohmA-1133 HS dry 1 x 10¹⁶ 1 x 10¹⁵
A-1133 HS 50%RH 2 x 10¹⁵
A-1145 HS dry 1 x 10¹⁶
A-1145 HS 50%RH 2 x 10¹⁵
AS-4133 HS dry 1 x 10¹⁶ 1 x 10¹⁵
AS-4133 HS 50%RH 5 x 10¹⁴
AT-1002 HS dry 1 x 10¹⁶ 8 x 10¹³
AT-1002 HS 50%RH 7 x 10¹⁴ 2 x 10¹³
AT-5001 dry 4 x 10¹⁵ 4 x 10¹⁵
AT-5001 50%RH 2 x 10¹⁵ 2 x 10¹⁵
AT-6115 HS dry 1 x 10¹⁶ 1 x 10¹⁵
AFA-6133 V0 Z dry 1 x 10¹⁶ 1 x 10¹⁵
FR-4133 dry 1 x 10¹⁶ 1 x 10¹⁵
A-1240 L dry 9 x 10¹⁵
A-1240 L 50%RH 2 x 10¹⁵
A-1340 HS dry 1 x 10¹⁶
A-1340 HS 50%RH 1 x 10¹⁶ 1 x 10¹⁵
A-1565 HS dry 4 x 10¹⁴
AS-1566 HS dry 1 x 10¹⁶ 1 x 10¹⁵
*Condition, dry is dry as molded, 50%RH is moisture conditioned asdescribed on page 2-3.
Table 6-2
Volume and Surface Resistivity of AMODEL Resins
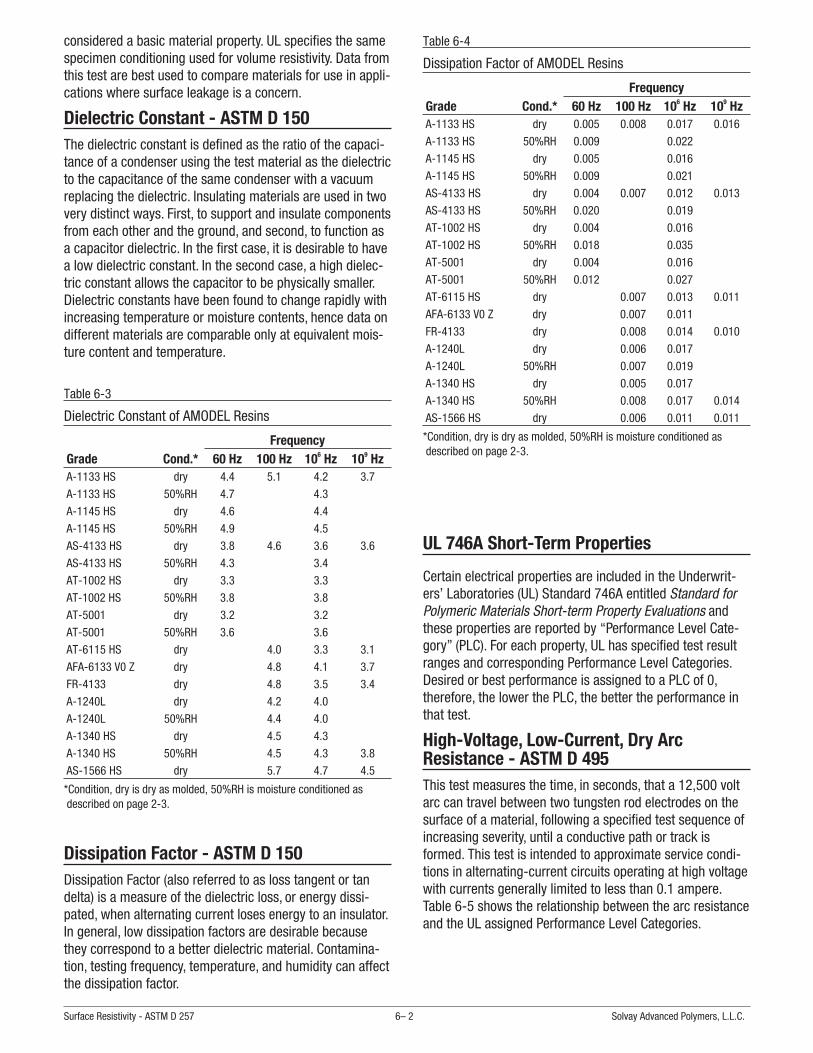
considered a basic material property. UL specifies the samespecimen conditioning used for volume resistivity. Data fromthis test are best used to compare materials for use in appli-cations where surface leakage is a concern.
Dielectric Constant - ASTM D 150The dielectric constant is defined as the ratio of the capaci-tance of a condenser using the test material as the dielectricto the capacitance of the same condenser with a vacuumreplacing the dielectric. Insulating materials are used in twovery distinct ways. First, to support and insulate componentsfrom each other and the ground, and second, to function asa capacitor dielectric. In the first case, it is desirable to havea low dielectric constant. In the second case, a high dielec-tric constant allows the capacitor to be physically smaller.Dielectric constants have been found to change rapidly withincreasing temperature or moisture contents, hence data ondifferent materials are comparable only at equivalent mois-ture content and temperature.
Dissipation Factor - ASTM D 150Dissipation Factor (also referred to as loss tangent or tandelta) is a measure of the dielectric loss, or energy dissi-pated, when alternating current loses energy to an insulator.In general, low dissipation factors are desirable becausethey correspond to a better dielectric material. Contamina-tion, testing frequency, temperature, and humidity can affectthe dissipation factor.
UL 746A Short-Term Properties
Certain electrical properties are included in the Underwrit-ers’ Laboratories (UL) Standard 746A entitled Standard forPolymeric Materials Short-term Property Evaluations andthese properties are reported by “Performance Level Cate-gory” (PLC). For each property, UL has specified test resultranges and corresponding Performance Level Categories.Desired or best performance is assigned to a PLC of 0,therefore, the lower the PLC, the better the performance inthat test.
High-Voltage, Low-Current, Dry ArcResistance - ASTM D 495This test measures the time, in seconds, that a 12,500 voltarc can travel between two tungsten rod electrodes on thesurface of a material, following a specified test sequence ofincreasing severity, until a conductive path or track isformed. This test is intended to approximate service condi-tions in alternating-current circuits operating at high voltagewith currents generally limited to less than 0.1 ampere.Table 6-5 shows the relationship between the arc resistanceand the UL assigned Performance Level Categories.
Surface Resistivity - ASTM D 257 6– 2 Solvay Advanced Polymers, L.L.C.
FrequencyGrade Cond.* 60 Hz 100 Hz 106 Hz 109 HzA-1133 HS dry 4.4 5.1 4.2 3.7
A-1133 HS 50%RH 4.7 4.3
A-1145 HS dry 4.6 4.4
A-1145 HS 50%RH 4.9 4.5
AS-4133 HS dry 3.8 4.6 3.6 3.6
AS-4133 HS 50%RH 4.3 3.4
AT-1002 HS dry 3.3 3.3
AT-1002 HS 50%RH 3.8 3.8
AT-5001 dry 3.2 3.2
AT-5001 50%RH 3.6 3.6
AT-6115 HS dry 4.0 3.3 3.1
AFA-6133 V0 Z dry 4.8 4.1 3.7
FR-4133 dry 4.8 3.5 3.4
A-1240L dry 4.2 4.0
A-1240L 50%RH 4.4 4.0
A-1340 HS dry 4.5 4.3
A-1340 HS 50%RH 4.5 4.3 3.8
AS-1566 HS dry 5.7 4.7 4.5
*Condition, dry is dry as molded, 50%RH is moisture conditioned asdescribed on page 2-3.
Table 6-3
Dielectric Constant of AMODEL Resins
FrequencyGrade Cond.* 60 Hz 100 Hz 106 Hz 109 HzA-1133 HS dry 0.005 0.008 0.017 0.016
A-1133 HS 50%RH 0.009 0.022
A-1145 HS dry 0.005 0.016
A-1145 HS 50%RH 0.009 0.021
AS-4133 HS dry 0.004 0.007 0.012 0.013
AS-4133 HS 50%RH 0.020 0.019
AT-1002 HS dry 0.004 0.016
AT-1002 HS 50%RH 0.018 0.035
AT-5001 dry 0.004 0.016
AT-5001 50%RH 0.012 0.027
AT-6115 HS dry 0.007 0.013 0.011
AFA-6133 V0 Z dry 0.007 0.011
FR-4133 dry 0.008 0.014 0.010
A-1240L dry 0.006 0.017
A-1240L 50%RH 0.007 0.019
A-1340 HS dry 0.005 0.017
A-1340 HS 50%RH 0.008 0.017 0.014
AS-1566 HS dry 0.006 0.011 0.011
*Condition, dry is dry as molded, 50%RH is moisture conditioned asdescribed on page 2-3.
Table 6-4
Dissipation Factor of AMODEL Resins

Comparative Tracking Index (CTI) -ASTM D 3638The Comparative Tracking Index is defined as the voltagethat causes the formation of a permanent electrically con-ductive carbon path when 50 drops of electrolyte areapplied at a rate of 1 drop every 30 seconds. This test mea-sures the susceptibility of an insulating material to tracking.Table 6-6 shows the relationship between the voltageobtained and the PLC.
High-Voltage Arc-Tracking-Rate (HVTR)This test measures the susceptibility of an insulating mate-rial to form a visible carbonized conducting path (track) overits surface when subjected to repeated high-voltage,low-current arcing. The high-voltage arc-tracking-rate valueis the rate, in mm/minute, at which a conducting path isproduced on the surface of a material under standardized
test conditions. This test simulates a malfunctioninghigh-voltage power supply with lower values indicatingbetter performance.
Table 6-7 shows the HVTR values and the correspondingPLC.
Hot Wire Ignition (HWI) - ASTM D 3874This test measures the relative resistance of plastic materi-als to ignition by an electrically heated wire. A portion of atest specimen is wrapped with a heater wire under specifiedconditions and a current is passed through the wire at a lin-ear power density of 6.5 0.26 W/mm (W/in.). The currentflow is maintained until ignition occurs, and the time to igni-tion is recorded.
Under certain operational or malfunction conditions, compo-nents become abnormally hot. If these overheated compo-nents are in intimate contact with the insulating materials,the insulating material may ignite. The intention of this testis to determine relative resistance of insulating materials toignition under these conditions. Table 6-8 shows the hotwire ignition times and the assigned PLC.
High-Current Arc Ignition (HAI)This test measures the relative resistance of insulatingmaterials to ignition from arcing electrical sources. Under
AMODEL PPA Design Guide 6– 3 UL 746A Short-Term Properties
Value Range, sec.
> < Assigned PLC
420 0
360 420 1
300 360 2
240 300 3
180 240 4
120 180 5
60 120 6
0 60 7
Table 6-5
High-Voltage, Low-Current, Dry Arc ResistancePerformance Level Categories (PLC)
Value Range, volts
> < Assigned PLC
600 0
400 600 1
250 400 2
175 250 3
100 175 4
0 100 5
Table 6-6
Comparative Tracking IndexPerformance Level Categories
Value Range, mm/min
> < Assigned PLC
0 10 0
10 25.4 1
25.4 80 2
80 150 3
150 4
Table 6-7
High-Voltage Arc-Tracking-RatePerformance Level Categories
Value Range, sec
< > Assigned PLC
120 0
120 60 1
60 30 2
30 15 3
15 7 4
7 0 5
Table 6-8
Hot Wire Ignition Performance Level Categories

certain conditions, insulating materials may be in proximityto arcing. If the intensity and duration of the arcing aresevere, the insulating material can ignite. This test mea-sures the number of 240-volt 32.5-ampere arcs on the sur-face of a material required to cause ignition or a hole. Thedistance between the electrodes in increased at a rate of254 mm (10 in.) per second. The maximum number of arcsto be used is 200.
This test measures the performance of an insulating mate-
rial in close proximity to arcing.
Table 6-9 shows the relationship between the High-CurrentArc Ignition value and the UL assigned Performance LevelCategories.
High-Voltage Arc Resistance to IgnitionThis test measures the susceptibility of a material to resistignition or form a visible carbonized conducting path whensubjected to high-voltage, low-current arcing. The applica-tion of the high-voltage arc is continued until ignition, a holeis burned through the specimen, or 5 minutes. If ignitionoccurs, the time to ignition is reported. If ignition does notoccur the value >300 is reported.
The relationship between the mean time to ignition and thePerformance Level Categories is given in Table 6-10.
UL 746A Properties of AMODEL ResinsSelected UL 746A properties for selected AMODEL gradesare shown in Table 6-11. The grades selected are the onesmost often used for electrically insulating applications.
UL Relative Thermal IndicesThe UL Relative Thermal Indices are the result of thermalaging tests and, therefore, appear in the Thermal Stabilitysection on page 5-8.
High-Current Arc Ignition (HAI) 6– 4 Solvay Advanced Polymers, L.L.C.
Value Range, sec
< > Assigned PLC
120 0
120 60 1
60 30 2
30 15 3
15 7 4
7 0 5
Table 6-9
High-Current Arc Ignition Performance Level Categories
HVAR - Mean Time to Ignition, sec
< > Assigned PLC
300 0
300 120 1
120 30 2
30 0 3
Table 6-10
High Voltage Arc Resistance to Ignition Performance LevelCategories
Grade mm(1) HWI HAI HVTR CTI
A(AS)-1133 HS 0.80 0 0 4 0
AT-6115 HS 0.80 0(2) 0 1 0
AT-6130 0.80 4 0 1 0
AS-1566 HS 0.80 — 0 0 0
A-1340 HS 0.80 0(2) 0 1 1
AS-4133 HS 0.80 0(2) 0 1 0
AF-1133 V0 0.75 0 0 1 1
AF-1145 V0 0.75 0 — 1 1
AFA-4133 V0 Z 0.75 0 0 1 1
AFA-6133 V0 Z 0.75 0 0 1 1
AFA-6145 V0 Z 0.75 0 1 — 1
FR-4133 0.80 0 0 2 0
FR-6133 0.75 0 0 2 0
FR-6145 0.80 0 0 1 0(1) Minimum Thickness, mm(2) This value measured at 1.5 mm thickness.
Table 6-11
UL 746A Property PLC for AMODEL PPA Grades
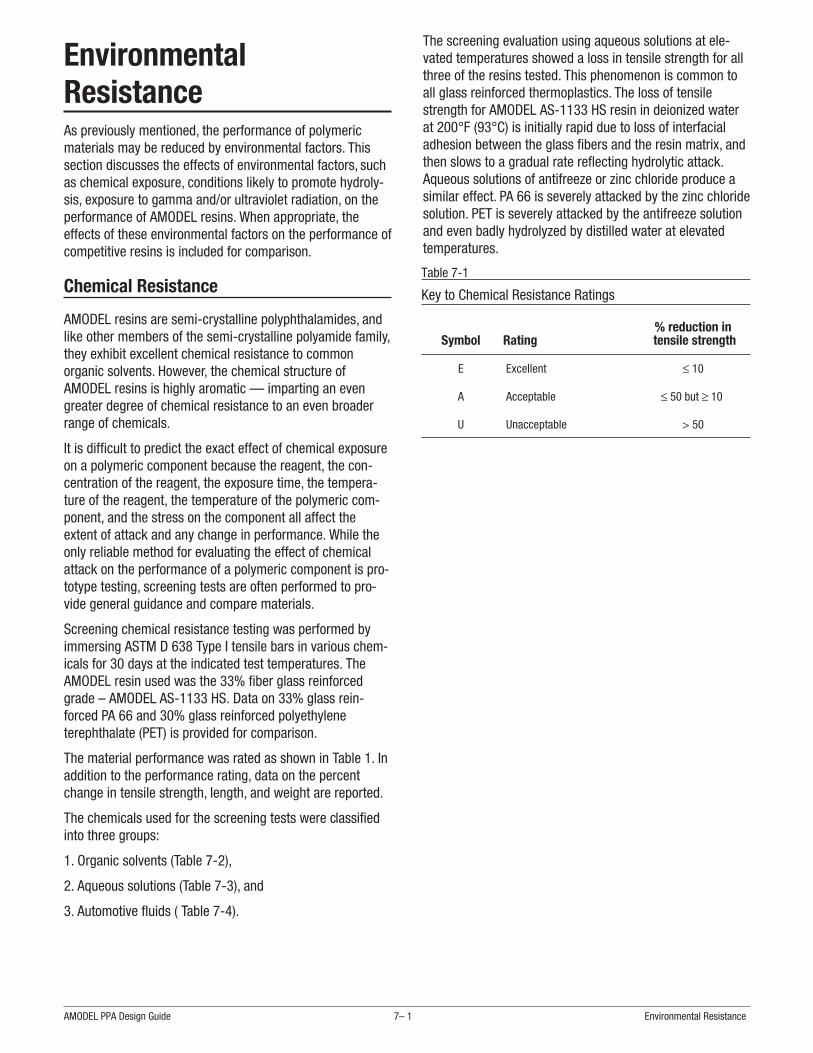
EnvironmentalResistanceAs previously mentioned, the performance of polymericmaterials may be reduced by environmental factors. Thissection discusses the effects of environmental factors, suchas chemical exposure, conditions likely to promote hydroly-sis, exposure to gamma and/or ultraviolet radiation, on theperformance of AMODEL resins. When appropriate, theeffects of these environmental factors on the performance ofcompetitive resins is included for comparison.
Chemical Resistance
AMODEL resins are semi-crystalline polyphthalamides, andlike other members of the semi-crystalline polyamide family,they exhibit excellent chemical resistance to commonorganic solvents. However, the chemical structure ofAMODEL resins is highly aromatic — imparting an evengreater degree of chemical resistance to an even broaderrange of chemicals.
It is difficult to predict the exact effect of chemical exposureon a polymeric component because the reagent, the con-centration of the reagent, the exposure time, the tempera-ture of the reagent, the temperature of the polymeric com-ponent, and the stress on the component all affect theextent of attack and any change in performance. While theonly reliable method for evaluating the effect of chemicalattack on the performance of a polymeric component is pro-totype testing, screening tests are often performed to pro-vide general guidance and compare materials.
Screening chemical resistance testing was performed byimmersing ASTM D 638 Type I tensile bars in various chem-icals for 30 days at the indicated test temperatures. TheAMODEL resin used was the 33% fiber glass reinforcedgrade – AMODEL AS-1133 HS. Data on 33% glass rein-forced PA 66 and 30% glass reinforced polyethyleneterephthalate (PET) is provided for comparison.
The material performance was rated as shown in Table 1. Inaddition to the performance rating, data on the percentchange in tensile strength, length, and weight are reported.
The chemicals used for the screening tests were classifiedinto three groups:
1. Organic solvents (Table 7-2),
2. Aqueous solutions (Table 7-3), and
3. Automotive fluids ( Table 7-4).
The screening evaluation using aqueous solutions at ele-vated temperatures showed a loss in tensile strength for allthree of the resins tested. This phenomenon is common toall glass reinforced thermoplastics. The loss of tensilestrength for AMODEL AS-1133 HS resin in deionized waterat 200°F (93°C) is initially rapid due to loss of interfacialadhesion between the glass fibers and the resin matrix, andthen slows to a gradual rate reflecting hydrolytic attack.Aqueous solutions of antifreeze or zinc chloride produce asimilar effect. PA 66 is severely attacked by the zinc chloridesolution. PET is severely attacked by the antifreeze solutionand even badly hydrolyzed by distilled water at elevatedtemperatures.
AMODEL PPA Design Guide 7– 1 Environmental Resistance
Symbol Rating% reduction intensile strength
E Excellent ≤ 10
A Acceptable ≤ 50 but ≥ 10
U Unacceptable > 50
Table 7-1
Key to Chemical Resistance Ratings

Organic Chemicals
7– 2 Solvay Advanced Polymers, L.L.C.
30 day immersion at 23°C (73°F)
Reagent Resin Rating
TensileStrength, %
RetainedChange inLength, %
Change inWeight, %
Acetone AMODEL AS-1133 HS E 97 0.1 0.2
33% glass PA 66 E 99 0.2 0.2
30% glass PET A 72 0.3 3.2
Isopropanol AMODEL AS-1133 HS E 99 0.0 0.2
33% glass PA 66 E 112 0.0 0.3
30% glass PET E 109 0.0 0.3
Methanol AMODEL AS-1133 HS A 83 0.1 2.9
33% glass PA 66 A 68 0.5 5.6
30% glass PET E 96 0.1 0.5
Methylene Chloride AMODEL AS-1133 HS E 94 0.0 1.1
33% glass PA 66 E 90 0.1 2.4
30% glass PET A 71 2.0 9.5
Methyl Ethyl Ketone AMODEL AS-1133 HS E 103 0.0 0.1
33% glass PA 66 A 113 0.0 0.1
30% glass PET A 72 0.1 3.0
Toluene AMODEL AS-1133 HS E 101 0.0 0.1
33% glass PA 66 E 109 0.1 0.2
30% glass PET E 91 0.1 1.6
1,1,1 trichloroethane AMODEL AS-1133 HS E 99 0.0 0.2
33% glass PA 66 E 110 0.0 0.2
30% glass PET E 100 0.0 2.3
Trichloroethylene AMODEL AS-1133 HS E 102 0.0 0.3
33% glass PA 66 E 97 0.0 0.4
Freon® 113 AMODEL AS-1133 HS E 96 0.0 0.1
33% glass PA 66 E 99 0.0 0.2
n-Heptane AMODEL AS-1133 HS E 104 0.0 0.1
33% glass PA 66 E 96 0.0 0.2
Freon is a registered trademark of E. I. duPont de Nemours and Company.
Table 7-2
Screening Chemical Resistance Tests — Organic Chemicals

Aqueous Chemicals
AMODEL PPA Design Guide 7– 3 Chemical Resistance
30 day immersion at indicated temperature
TemperatureTensile
Strength,
Reagent Conc. °C °F Resin Rating% Re-tained
Change inLength, %
Change inWeight, %
Ammonium Hydroxide 10% 23 73 AMODEL AS-1133 HS E 96 0.1 0.8
33% glass PA 66 A 61 0.2 4.5
30% glass PET E 95 0.2 0.4
Deionized Water 100% 93 200 AMODEL AS-1133 HS A 69 0.2 3.4
33% glass PA 66 A 62 0.2 5.0
30% glass PET U 19 0.0 2.4
Sodium Chloride 10% 23 73 AMODEL AS-1133 HS E 97 0.1 2.1
33% glass PA 66 A 67 0.2 3.3
30% glass PET E 98 0.0 0.3
Zinc Chloride 50% 93 200 AMODEL AS-1133 HS A 66 0.1 4.8
33% glass PA 66 U 0 * *
30% glass PET A 54 -0.1 0.6
Sulfuric Acid 36% 23 73 AMODEL AS-1133 HS E 92 0.0 1.8
33% glass PA 66 U 0 * *
30% glass PET E 94 0.0 0.3
Sodium Hydroxide 10% 23 73 AMODEL AS-1133 HS E 93 0.0 1.6
33% glass PA 66 A 62 0.0 3.1
30% glass PET A 70 0.0 -4.2
Sodium Hypochlorite 5% 23 73 AMODEL A-1133 HS E 94 0.0 1.4
33% glass PA 66 A 57 0.0 -1.5
30% glass PET E 94 0.0 0.4
* = Attacked
Table 7-3
Screening Chemical Resistance Tests — Aqueous Chemical Solutions
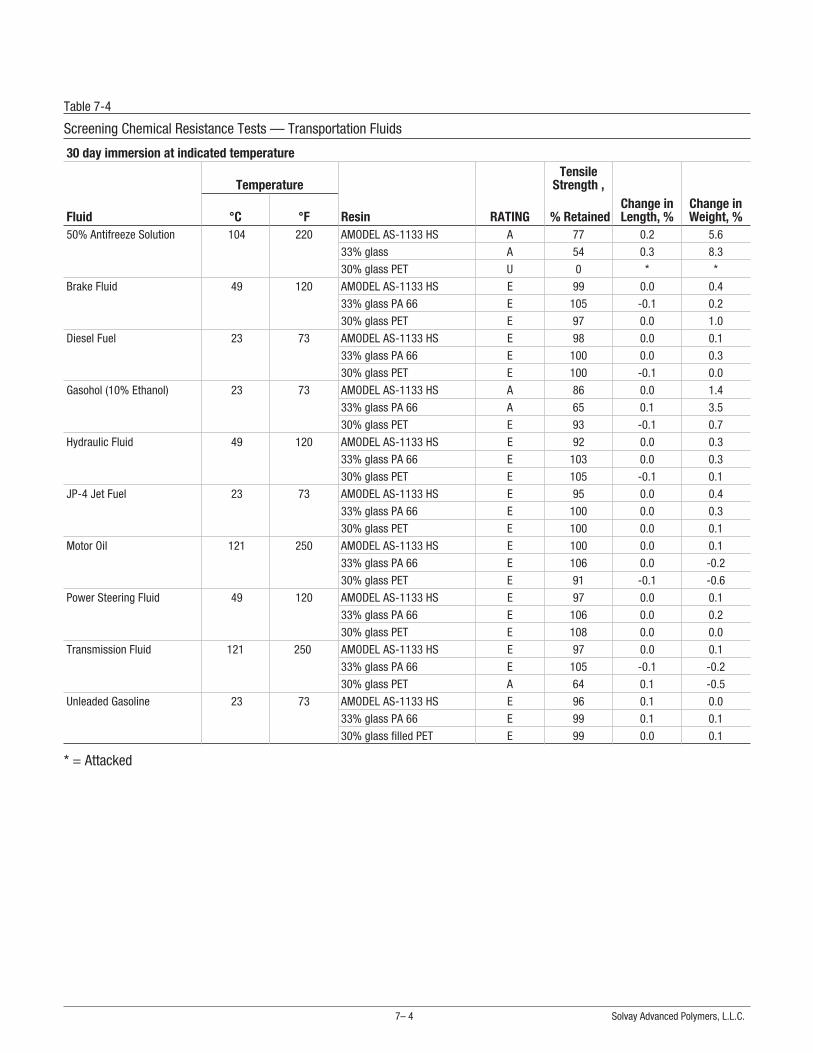
Transportation Fluids
7– 4 Solvay Advanced Polymers, L.L.C.
30 day immersion at indicated temperature
TemperatureTensile
Strength ,
Fluid °C °F Resin RATING % RetainedChange inLength, %
Change inWeight, %
50% Antifreeze Solution 104 220 AMODEL AS-1133 HS A 77 0.2 5.6
33% glass A 54 0.3 8.3
30% glass PET U 0 * *
Brake Fluid 49 120 AMODEL AS-1133 HS E 99 0.0 0.4
33% glass PA 66 E 105 -0.1 0.2
30% glass PET E 97 0.0 1.0
Diesel Fuel 23 73 AMODEL AS-1133 HS E 98 0.0 0.1
33% glass PA 66 E 100 0.0 0.3
30% glass PET E 100 -0.1 0.0
Gasohol (10% Ethanol) 23 73 AMODEL AS-1133 HS A 86 0.0 1.4
33% glass PA 66 A 65 0.1 3.5
30% glass PET E 93 -0.1 0.7
Hydraulic Fluid 49 120 AMODEL AS-1133 HS E 92 0.0 0.3
33% glass PA 66 E 103 0.0 0.3
30% glass PET E 105 -0.1 0.1
JP-4 Jet Fuel 23 73 AMODEL AS-1133 HS E 95 0.0 0.4
33% glass PA 66 E 100 0.0 0.3
30% glass PET E 100 0.0 0.1
Motor Oil 121 250 AMODEL AS-1133 HS E 100 0.0 0.1
33% glass PA 66 E 106 0.0 -0.2
30% glass PET E 91 -0.1 -0.6
Power Steering Fluid 49 120 AMODEL AS-1133 HS E 97 0.0 0.1
33% glass PA 66 E 106 0.0 0.2
30% glass PET E 108 0.0 0.0
Transmission Fluid 121 250 AMODEL AS-1133 HS E 97 0.0 0.1
33% glass PA 66 E 105 -0.1 -0.2
30% glass PET A 64 0.1 -0.5
Unleaded Gasoline 23 73 AMODEL AS-1133 HS E 96 0.1 0.0
33% glass PA 66 E 99 0.1 0.1
30% glass filled PET E 99 0.0 0.1
* = Attacked
Table 7-4
Screening Chemical Resistance Tests — Transportation Fluids
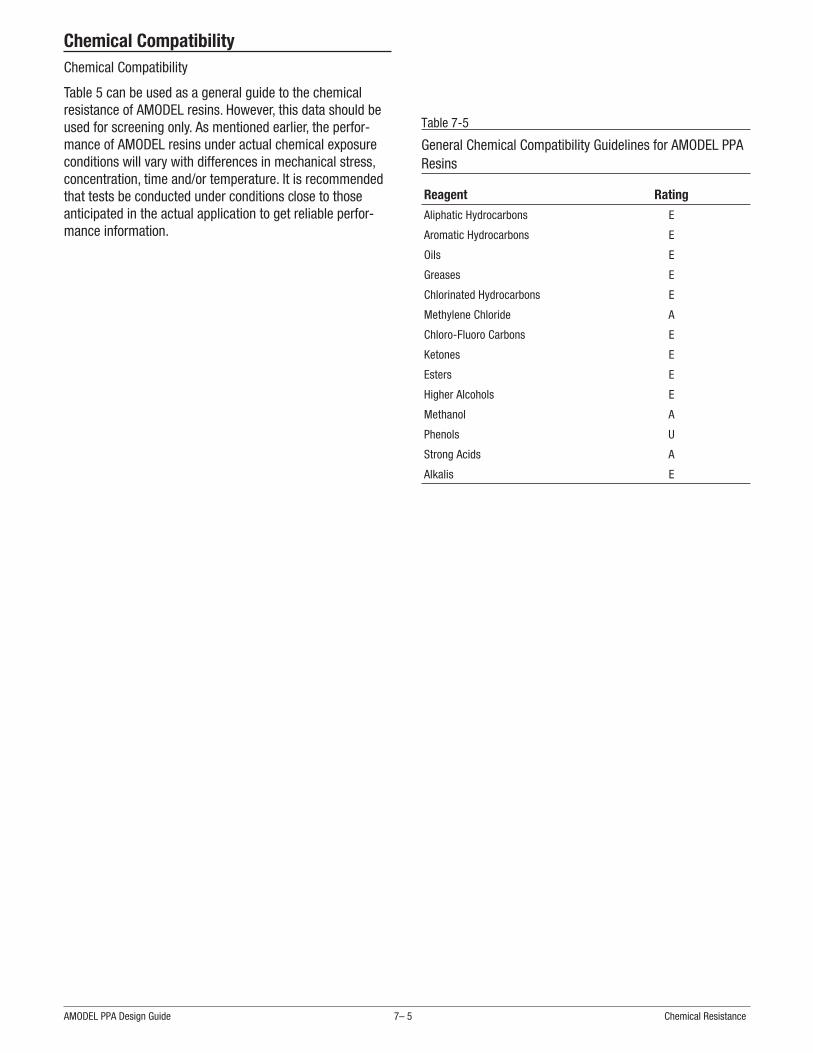
Chemical CompatibilityChemical Compatibility
Table 5 can be used as a general guide to the chemicalresistance of AMODEL resins. However, this data should beused for screening only. As mentioned earlier, the perfor-mance of AMODEL resins under actual chemical exposureconditions will vary with differences in mechanical stress,concentration, time and/or temperature. It is recommendedthat tests be conducted under conditions close to thoseanticipated in the actual application to get reliable perfor-mance information.
AMODEL PPA Design Guide 7– 5 Chemical Resistance
Reagent Rating
Aliphatic Hydrocarbons E
Aromatic Hydrocarbons E
Oils E
Greases E
Chlorinated Hydrocarbons E
Methylene Chloride A
Chloro-Fluoro Carbons E
Ketones E
Esters E
Higher Alcohols E
Methanol A
Phenols U
Strong Acids A
Alkalis E
Table 7-5
General Chemical Compatibility Guidelines for AMODEL PPAResins
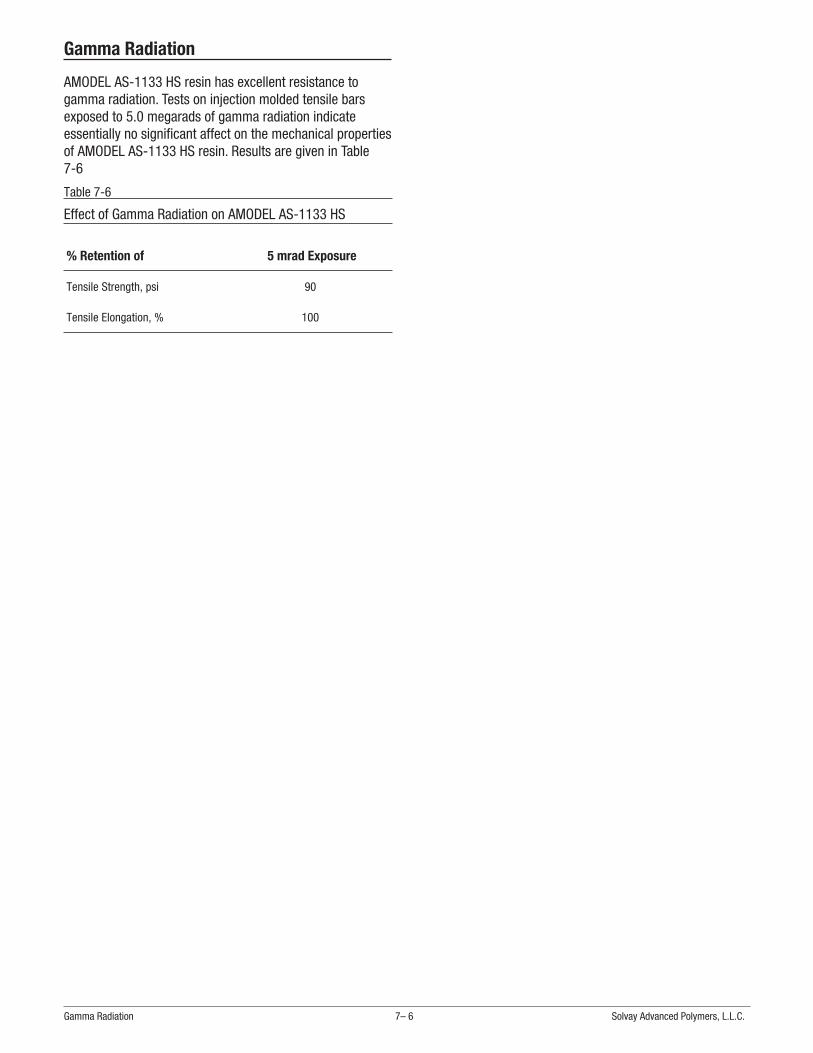
Gamma Radiation
AMODEL AS-1133 HS resin has excellent resistance togamma radiation. Tests on injection molded tensile barsexposed to 5.0 megarads of gamma radiation indicateessentially no significant affect on the mechanical propertiesof AMODEL AS-1133 HS resin. Results are given in Table7-6
Gamma Radiation 7– 6 Solvay Advanced Polymers, L.L.C.
% Retention of 5 mrad Exposure
Tensile Strength, psi 90
Tensile Elongation, % 100
Table 7-6
Effect of Gamma Radiation on AMODEL AS-1133 HS

Design InformationIn this section, basic design principles and general recom-mendations are presented to assist the design engineer indesigning plastic components that meet the cost/perfor-mance requirements of their applications. Guidelines aregiven on the effects of stresses caused by assembly, tem-perature changes, environmental factors, and time as itrelates to creep.
Of the various materials available to a design engineer, ther-moplastics offer the greatest variety, versatility and freedomof design. Plastics can be translucent or opaque, rigid orflexible, hard or soft. Plastic materials are available that pro-vide a wide range of chemical resistance, from chemicallyinert to selective solubility in certain environments. Broadversatility is also available for other properties like strength,stiffness and impact resistance, lubricity and thermal capa-bility. Blends and alloys are possible that further increasethe material choices for a particular application.
At times, designing with plastics may appear more compli-cated than with metals. But the diversity of products, con-version processes, and secondary operations (welding,inserts, printing, painting, metallizing) available with plasticsgives the designer unprecedented freedom as shown inTable 8-1.
A designer may be tempted to make a plastic part thatmerely duplicates the dimensions of a metal part withouttaking advantage of the versatility of the plastic material orthe design freedom offered. This approach can lead to inef-ficient designs or parts that are difficult to produce, orwhose performance is less than optimal.
The following sections discuss those areas of mechanicaldesign and stress analysis that relate to designing withplastics, comparing metal to plastics and discussing factorsthat are specific to plastics alone.
AMODEL PPA Design Guide 8– 1 Design Information
AMODEL ResinCharacteristics
Benefit in Design
AMODEL resins are fabri-cated by the injectionmolding process, whichallows substantial designfreedom.
Ribs, bosses, or cored sec-tions can be readilyincorporated.
Snap fits can be molded in,simplifying assembly.
Eliminate many secondaryoperations such as drilling,tapping, boring, deburring,and grinding.
Metal inserts can be easilyused where necessary tooptimize part strength.
Features from severalmetal parts of an assemblymay be combined into asingle part, simplifyingassembly and reducingcost.
AMODEL resins arethermoplastic.
Parts may be joined withultrasonic or vibrationwelding rather thanfasteners.
Color may be molded-inrather than added after-ward as paint.
AMODEL resins resistchemicals.
Parts will not rust, andresist corrosion.
Table 8-1.
Design Benefits of AMODEL Resin over Metals

Mechanical Design
The use of classical stress and deflection equations providestarting points for part design. Mechanical design calcula-tions for AMODEL resins will be similar to those used withany engineering material. As with all plastics, however, theanalysis used must reflect the viscoelastic nature of thematerial. In addition, the material properties can vary withstrain rate, temperature, and chemical environment or withfiber orientation for fiber reinforced plastics. Therefore, theanalysis must be appropriate for all anticipated serviceconditions.
For example, if the service condition involves enduring loadfor a long period of time, then the apparent or creepmodulus should be used instead of the short-term elasticmodulus. Or if the loading is cyclical and long term, thefatigue strength at the design life will be the limiting factor.
The initial step in any part design analysis is the determina-tion of the loads the part will be subjected to, and calcula-tion of the resultant stress and deformation or strain. Theloads may be externally applied or result from stresses dueto temperature changes or assembly.
An example of an externally applied load is the weight ofmedical instruments on a sterilizer tray. Examples of assem-bly loads are the loads on a housing flange when it is boltedto an engine or the load on the hub of a pulley when a bear-ing is pressed into it. Thermally induced stresses can arisewhen the temperature of the assembly increases and thedimensions of the plastic part change more or less than themetal part to which it is attached.
Mechanical Design 8– 2 Solvay Advanced Polymers, L.L.C.
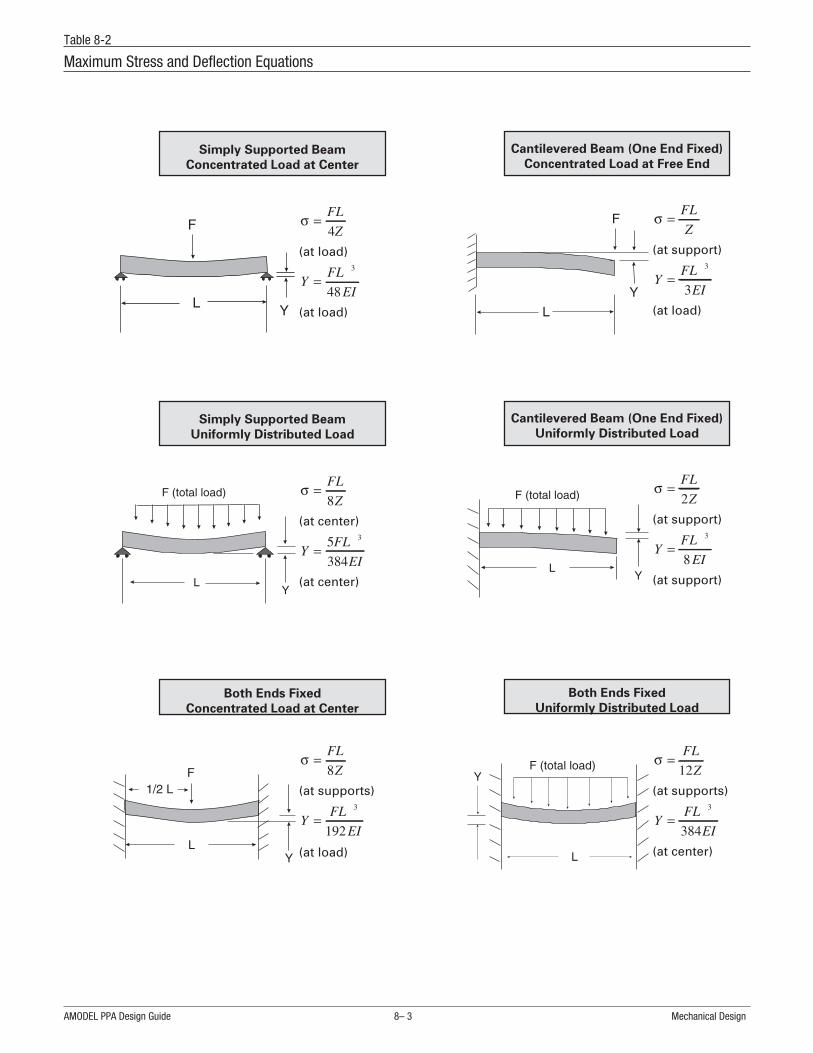
AMODEL PPA Design Guide 8– 3 Mechanical Design
σ =FL
Z4
(at load)
YFL
EI=
3
48
(at load)
Simply Supported Beam
Concentrated Load at Center
Both Ends Fixed
Uniformly Distributed Load
σ =FL
Z12
(at supports)
YFL
EI=
3
384
(at center)
Cantilevered Beam (One End Fixed)
Uniformly Distributed Load
σ =FL
Z2
(at support)
YFL
EI=
3
8
(at support)
Both Ends Fixed
Concentrated Load at Center
σ =FL
Z8
(at supports)
YFL
EI=
3
192
(at load)
Simply Supported Beam
Uniformly Distributed Load
σ =FL
Z8
(at center)
YFL
EI=
5
384
3
(at center)
Cantilevered Beam (One End Fixed)
Concentrated Load at Free End
σ =FL
Z
(at support)
YFL
EI=
3
3
(at load)
Table 8-2
Maximum Stress and Deflection Equations

8– 4 Solvay Advanced Polymers, L.L.C.
Table 8-3
Area and Moment Equations for Selected Cross-Sections

Using Classical Stress/Strain EquationsTo use the classical equations, the following simplifyingassumptions are necessary:
1. the part can be analyzed as one or more simplestructures;
2. the material can be considered linearly elastic andisotropic;
3. the load is a single concentrated or distributed staticload gradually applied for a short time; and
4. the part has low residual or molded-in stresses.
While all of these assumptions may not be strictly valid for aparticular situation, the classical equations can provide astarting point for analysis. The design engineer can thenmodify the analysis to take into consideration the effects ofthe simplifying assumptions.
A variety of parts can be analyzed using a beam bendingmodel. Table 8-2 lists the equations for maximum stressand deflection for some selected beams.
The maximum stress (σ) occurs at the surface of the beamfurthest from the neutral surface, and is given by:
Table 8-3 gives the cross sectional area (A), the moment ofinertia (I), the distance from the neutral axis (c), and thesection modulus (Z) for some common cross sections.
For other crosssections and/or geometries, the design engi-neer can consult stress analysis handbooks or employ finiteelement analysis.
AMODEL PPA Design Guide 8– 5 Mechanical Design
Limitations of Design Calculations
The designs given by the application of the classical mechanicaldesign equations are useful as starting points, but some criticalfactors are simply not adequately considered by these analyses.The viscoelastic behavior of polymeric materials limits applica-tion of some of the design equations to, for example, low deflec-tion cases. Often the calculation of maximum stress contains anumber of simplifying assumptions which can diminish the cred-ibility of the results, or the expected failure mode is buckling orshear, where the appropriate property data is lacking.
Also, the impact resistance of a design is directly related to itsability to absorb impact energy without fracture. It is difficult topredict the ability of a design to absorb energy. In addition, evenarmed with the energy absorption requirements, practical tough-ness constants for engineering resins don’t exist. The results oflaboratory testing vary with the type and speed of the impacttest, even for fixed geometries. Therefore, the ability of the de-sign to withstand impact must be checked by impact testing ofprototype parts.
Similarly, fatigue test results will vary depending on the cyclicrate chosen for the test, the dynamics of the test, and the testspecimen used. Therefore, they should only be used as a roughindication of a material’s ability to perform in a fatigueapplication.
σ = =M c
IMZ
where:
M bending moment= ⋅, N m (inlb)
c distance from neutral axis= , m (in)
I moment of inertia= , m (in )4 4
ZIc
section modulus= = , m (in )3 3

Deflection Calculations
To determine the deflection of a proposed part design usingclassical equations, a modulus of elasticity value is required.It is important that the appropriate value be used. The valuemust represent the modulus of the material at or near thetemperature and humidity expected in the application. Roomand elevated temperature values can be found in the prop-erty tables on pages 2-4 to -. If the load is sustained, thenthe apparent or creep modulus should be used. Values aregiven in the isochronous stress/strain curves, Figures 4-7through 4-9 on page 4-4.
Stress calculationsAfter the designer has calculated the maximum stress,those values are then compared to the appropriate materialproperty, i.e., tensile, compressive, or shear strength. Thecomparison should be appropriate in terms of temperatureand humidity to the requirements of the application.
Reinforcing FiberOrientation Considerations
When designing with plastics, especially filled plastics, thedesigner must be cognizant of the effects of the fillers andreinforcing fibers on the mechanical properties of the plas-tic. The processing of filled plastics tends to cause orienta-tion of fibers or high-aspect-ratio fillers parallel to the direc-tion of flow. Throughout this manual, properties have beengiven both with and across flow direction wheneverpractical.
Since the design of the part and the processing are interre-lated, the designer should consider what portions of the partare likely to be oriented and how the properties will beaffected. Shrinkage, strength, stiffness, and coefficient ofthermal expansion will differ depending on the aspect ratioof the fiber (the ratio of its length to its diameter) and thedegree of fiber orientation. Perpendicular to the fiber orien-tation, the fibers act more as fillers than as reinforcingagents.
When molding polymers, there are instances where meltfronts meet (commonly known as weld lines) such as whenthe plastic melt flows around a core pin. However, the rein-forcement in the plastic, if present, does not cross the weldline. Thus the weld line does not have the strength of thereinforced polymer and at times can even be less than thematrix polymer itself. These factors must be taken intoaccount when designing parts with reinforced plastics.
Using Classical Stress/Strain Equations 8– 6 Solvay Advanced Polymers, L.L.C.
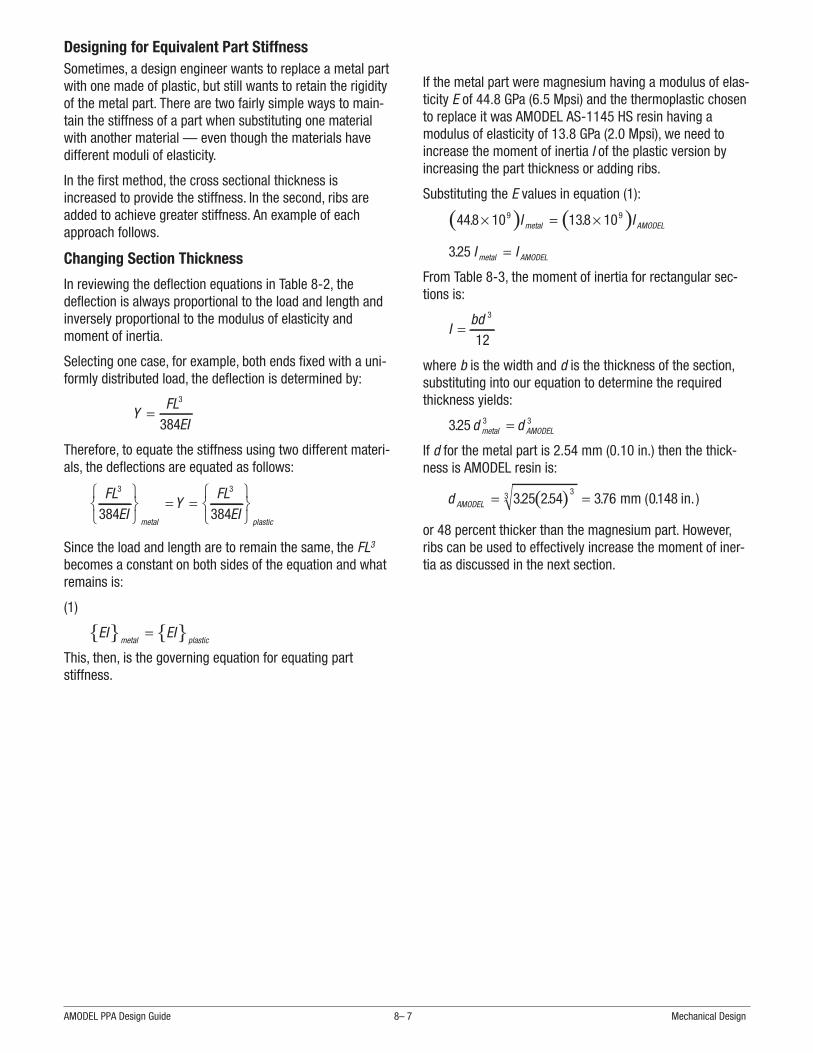
Designing for Equivalent Part StiffnessSometimes, a design engineer wants to replace a metal partwith one made of plastic, but still wants to retain the rigidityof the metal part. There are two fairly simple ways to main-tain the stiffness of a part when substituting one materialwith another material — even though the materials havedifferent moduli of elasticity.
In the first method, the cross sectional thickness isincreased to provide the stiffness. In the second, ribs areadded to achieve greater stiffness. An example of eachapproach follows.
Changing Section Thickness
In reviewing the deflection equations in Table 8-2, thedeflection is always proportional to the load and length andinversely proportional to the modulus of elasticity andmoment of inertia.
Selecting one case, for example, both ends fixed with a uni-formly distributed load, the deflection is determined by:
YFL
EI=
3
384
Therefore, to equate the stiffness using two different materi-als, the deflections are equated as follows:
FLEI
YFL
EImetal plastic
3 3
384 384
⎧⎨⎩
⎫⎬⎭
= =⎧⎨⎩
⎫⎬⎭
Since the load and length are to remain the same, the FL3
becomes a constant on both sides of the equation and whatremains is:
(1)
{ } { }EI EImetal plastic
=
This, then, is the governing equation for equating partstiffness.
If the metal part were magnesium having a modulus of elas-ticity E of 44.8 GPa (6.5 Mpsi) and the thermoplastic chosento replace it was AMODEL AS-1145 HS resin having amodulus of elasticity of 13.8 GPa (2.0 Mpsi), we need toincrease the moment of inertia I of the plastic version byincreasing the part thickness or adding ribs.
Substituting the E values in equation (1):
( ) ( )448 10 138 109 9. .× = ×I Imetal AMODEL
325. I Imetal AMODEL=
From Table 8-3, the moment of inertia for rectangular sec-tions is:
Ibd
=3
12
where b is the width and d is the thickness of the section,substituting into our equation to determine the requiredthickness yields:
325 3 3. d dmetal AMODEL=
If d for the metal part is 2.54 mm (0.10 in.) then the thick-ness is AMODEL resin is:
( )d AMODEL = =325 254 376 014833 . . . ( .mm in. )
or 48 percent thicker than the magnesium part. However,ribs can be used to effectively increase the moment of iner-tia as discussed in the next section.
AMODEL PPA Design Guide 8– 7 Mechanical Design

Adding Ribs to Maintain Stiffness
In the last section, it was determined that if a metal partwere to be replaced with a part molded of AMODELAS-1145 HS resin, a part thickness of 3.7 mm (0.148 in.)would be required to equal the stiffness of a 2.5 mm (0.100in.) thick magnesium part.
By incorporating ribs into the AMODEL design, the wallthickness and weight can be reduced very efficiently and yetbe as stiff as the magnesium part.
To demonstrate this, the moment of inertia (I) of the new ribdesign can be equated with that of the 3.7 mm (0.148 in.)thick plate design. Selecting the same material, AMODELAS-1145 HS, the modulus of elasticity remains 13.8 GPa(2.0 Mpsi) in both cases; therefore, if the moment of inertiaof the ribbed design is equal to the plate design, the partswill have equivalent deflection and/or stiffness.
From Table 8-3, the I for a ribbed section is selected. Byassuming that the section width “b” is the same for both,the Irib has to be equal or greater than the Iplate. Assigning asection width “b“ = 25.4 mm (1.0 in.), the moment of inertiaof a ribbed construction that will satisfy that condition canbe calculated.
The moment of inertia for the plate design is:
( )I
bhplate = =
×= × −
3 3
4 4
12
25 4 376
121125 270 10
. .. ( . )mm in.4
By choosing the arbitrary rib design shown in Figure 8-1,and working through the calculations, the moment of inertiais found to be:
I rib = × −1379 3319 104 4 4mm in.( . )
Therefore, the ribbed design will be 9.5 times stiffer thanthe AMODEL plate design or the original magnesium partthat was 2.5 mm (0.100 in.) thick.
The same rib having half the height would still produce apart twice as stiff as the magnesium part. The ribbed designshown requires placing a rib every 25 mm (1 in.) of sectionwidth.
Using Classical Stress/Strain Equations 8– 8 Solvay Advanced Polymers, L.L.C.
Figure 8-1
Adding Ribs to Increase Stiffness

Designing for Sustained LoadUp to this point, the stress strain calculations and exampleshave dealt with immediate stress/strain response and there-fore short-term properties. If the part in question must sus-tain loads for long periods of time or at elevated tempera-tures, apparent (creep) modulus values must be used toaccount for the additional strain and part deflection that mayoccur. An example showing how the calculations are modi-fied for sustained load follows.
Calculating DeflectionIf a cantilever beam with a rectangular cross-section, asshown in Figure 8-2, is loaded with a 10 kg (22.0 lb) forceat the free end, what is the deflection after 1,000 hours?
From Table 8-2 on page 8-3, the deflection of a cantileverbeam is given by:
YFLEI
=3
3
where I, the moment of inertia, as shown in Table 8-3 is:
Ibd
=3
12
and E is the flexural modulus of the material.
Calculating the moment of inertia for this example gives:
( )( )I = = ×
25 6
12450 1081 10
3
4 3 4mm in.( . )
The data sheet for AMODEL A-1133 HS resin gives 11.6 GPa(1.68 Mpsi) for the flexural modulus. Using this value andthe equation previously cited, the short-term room tempera-ture deflection can be calculated by:
( )( )( )( )Y =
×
× × −
10 9 8066 1
3 116 10 45 10
3
9 10 4
kg m
Pa m
. .
. .
Y = 6 3. mm (0.25 in. )
If the application requires that the load be sustained for along time, we would expect the deflection to be greater thanthis because of creep. To calculate the deflection consider-ing the creep, we would use the apparent modulus insteadof the short-term flexural modulus. The value of apparentmodulus shown for AMODEL A-1133 HS resin at 1000 hoursin Figure is 7.58 GPa (1.10 Mpsi). Therefore the calculateddeflection is:
( )( )( )( )Y =
×
× × −
10 9 8066 1
3 7 58 10 45 10
3
9 10 4
kg m
Pa m
. .
. .
Y = 9 6 038. ( . )mm in.
The deflection is about fifty percent greater when a sus-tained load is considered.
AMODEL PPA Design Guide 8– 9 Mechanical Design
Figure 8-2
Cantilever Beam, Bending load Example
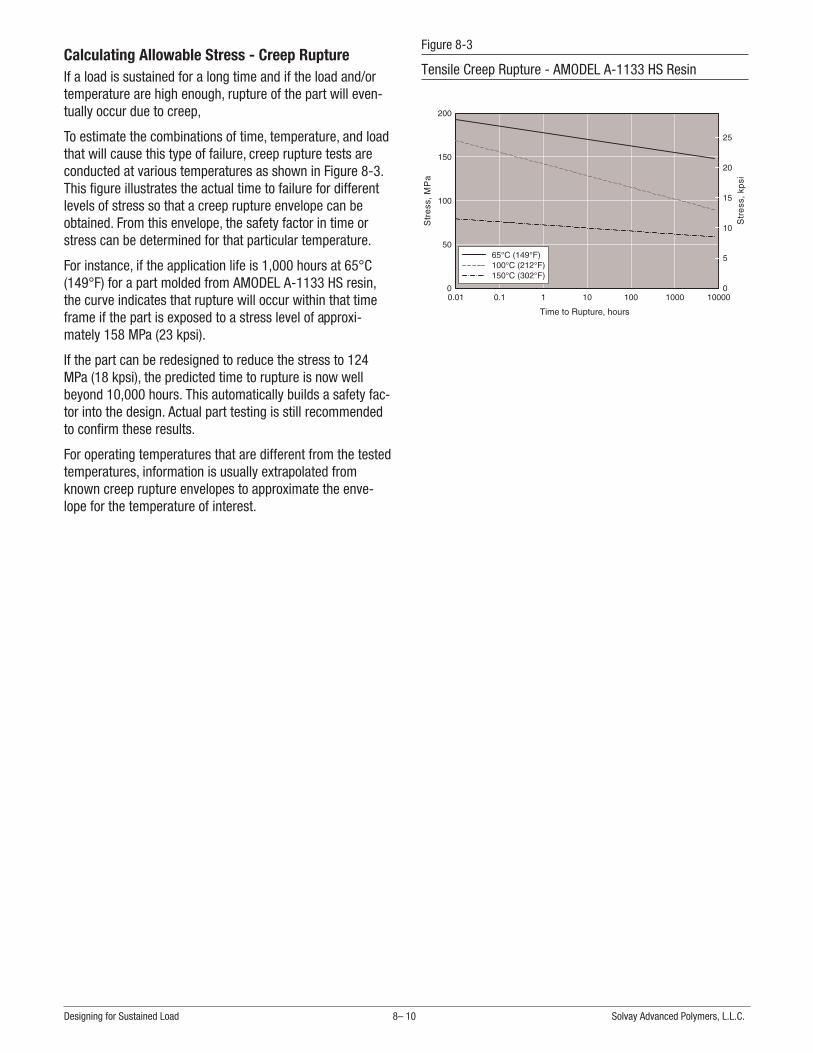
Calculating Allowable Stress - Creep RuptureIf a load is sustained for a long time and if the load and/ortemperature are high enough, rupture of the part will even-tually occur due to creep,
To estimate the combinations of time, temperature, and loadthat will cause this type of failure, creep rupture tests areconducted at various temperatures as shown in Figure 8-3.This figure illustrates the actual time to failure for differentlevels of stress so that a creep rupture envelope can beobtained. From this envelope, the safety factor in time orstress can be determined for that particular temperature.
For instance, if the application life is 1,000 hours at 65°C(149°F) for a part molded from AMODEL A-1133 HS resin,the curve indicates that rupture will occur within that timeframe if the part is exposed to a stress level of approxi-mately 158 MPa (23 kpsi).
If the part can be redesigned to reduce the stress to 124MPa (18 kpsi), the predicted time to rupture is now wellbeyond 10,000 hours. This automatically builds a safety fac-tor into the design. Actual part testing is still recommendedto confirm these results.
For operating temperatures that are different from the testedtemperatures, information is usually extrapolated fromknown creep rupture envelopes to approximate the enve-lope for the temperature of interest.
Designing for Sustained Load 8– 10 Solvay Advanced Polymers, L.L.C.
Figure 8-3
Tensile Creep Rupture - AMODEL A-1133 HS Resin
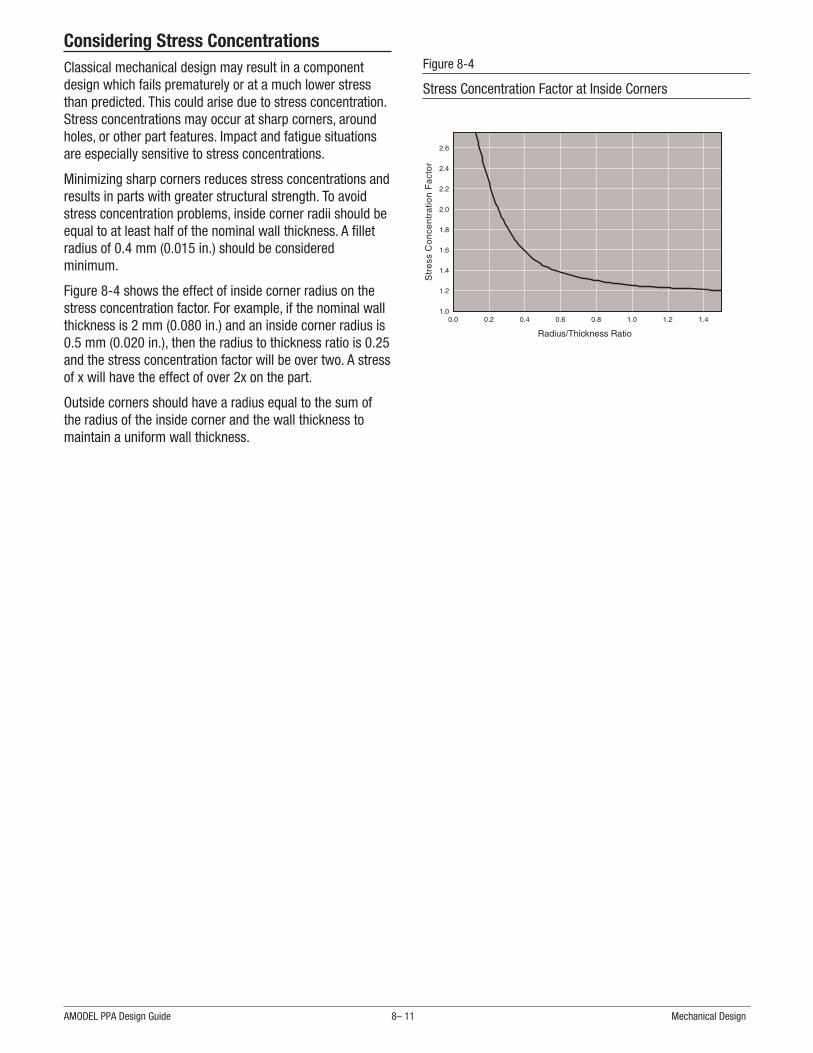
Considering Stress ConcentrationsClassical mechanical design may result in a componentdesign which fails prematurely or at a much lower stressthan predicted. This could arise due to stress concentration.Stress concentrations may occur at sharp corners, aroundholes, or other part features. Impact and fatigue situationsare especially sensitive to stress concentrations.
Minimizing sharp corners reduces stress concentrations andresults in parts with greater structural strength. To avoidstress concentration problems, inside corner radii should beequal to at least half of the nominal wall thickness. A filletradius of 0.4 mm (0.015 in.) should be consideredminimum.
Figure 8-4 shows the effect of inside corner radius on thestress concentration factor. For example, if the nominal wallthickness is 2 mm (0.080 in.) and an inside corner radius is0.5 mm (0.020 in.), then the radius to thickness ratio is 0.25and the stress concentration factor will be over two. A stressof x will have the effect of over 2x on the part.
Outside corners should have a radius equal to the sum ofthe radius of the inside corner and the wall thickness tomaintain a uniform wall thickness.
AMODEL PPA Design Guide 8– 11 Mechanical Design
Figure 8-4
Stress Concentration Factor at Inside Corners

Considering Thermal StressesWhen a plastic part attached to metal undergoes tempera-ture changes, stresses may be induced that should be con-sidered by the designer in the development of the partdesign.
Figure 8-5 illustrates a typical plastic flange fastened by asteel bolt to a steel frame. Because the thermal expansion ofthe plastic is significantly greater than that of the steel, anincrease in temperature will produce an increase in com-pressive stresses in the plastic and tension in the bolt. It isthe increase in compressive stress under the washer thatmust be considered if creep and loss of torque load on thebolt is of concern.
For example, the change in length of a material whenexposed to a change in temperature is given by:
∆L L T TF= −( )0 α
where:
∆L
L
=
=
change in length
original length
= coefficient of thα ermal expansion
final temperature
T original temper0
TF =
= ature
Since the plastic is constrained, the unit elongation, combin-ing both thermal expansion and strain, of both the steel boltand the plastic, will be as follows:
( ) ( )α αs Fs s
p Fp p
T TF
A ET T
FA E
− + = − −0 0
where:
A
A
s
p
=
=
cross sectional area of the bolt
cross sectional area of the washer
modulus of steel
modulus of plastic
s
E
E
s
p
=
=
α =
=
coefficient of thermal expansion of steel
coefficienpα t of thermal expansion of plastic
= increase in the tensileF force of the bolt
Solving for F
( )( )F
T T A E
A EA E
p s F s s
s s
p p
=− −
+
α α 0
1
and the increase in compressive stress on the plastic willbe:
σ =FA p
Considering Stress Concentrations 8– 12 Solvay Advanced Polymers, L.L.C.
Figure 8-5
Thermal Stress Example
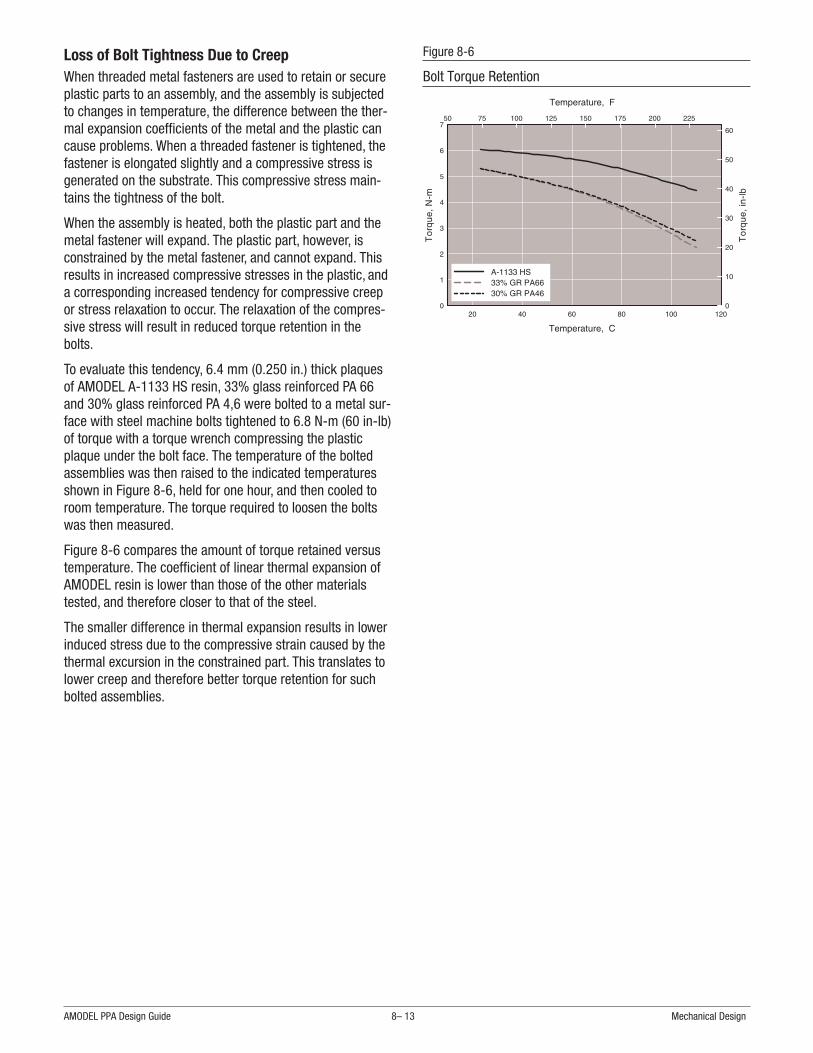
Loss of Bolt Tightness Due to CreepWhen threaded metal fasteners are used to retain or secureplastic parts to an assembly, and the assembly is subjectedto changes in temperature, the difference between the ther-mal expansion coefficients of the metal and the plastic cancause problems. When a threaded fastener is tightened, thefastener is elongated slightly and a compressive stress isgenerated on the substrate. This compressive stress main-tains the tightness of the bolt.
When the assembly is heated, both the plastic part and themetal fastener will expand. The plastic part, however, isconstrained by the metal fastener, and cannot expand. Thisresults in increased compressive stresses in the plastic, anda corresponding increased tendency for compressive creepor stress relaxation to occur. The relaxation of the compres-sive stress will result in reduced torque retention in thebolts.
To evaluate this tendency, 6.4 mm (0.250 in.) thick plaquesof AMODEL A-1133 HS resin, 33% glass reinforced PA 66and 30% glass reinforced PA 4,6 were bolted to a metal sur-face with steel machine bolts tightened to 6.8 N-m (60 in-lb)of torque with a torque wrench compressing the plasticplaque under the bolt face. The temperature of the boltedassemblies was then raised to the indicated temperaturesshown in Figure 8-6, held for one hour, and then cooled toroom temperature. The torque required to loosen the boltswas then measured.
Figure 8-6 compares the amount of torque retained versustemperature. The coefficient of linear thermal expansion ofAMODEL resin is lower than those of the other materialstested, and therefore closer to that of the steel.
The smaller difference in thermal expansion results in lowerinduced stress due to the compressive strain caused by thethermal excursion in the constrained part. This translates tolower creep and therefore better torque retention for suchbolted assemblies.
AMODEL PPA Design Guide 8– 13 Mechanical Design
Temperature, C
20 40 60 80 100 120
To
rqu
e, N
-m
0
1
2
3
4
5
6
7
Temperature, F
50 75 100 125 150 175 200 225
To
rqu
e, i
n-l
b
0
10
20
30
40
50
60
A-1133 HS33% GR PA6630% GR PA46
Figure 8-6
Bolt Torque Retention
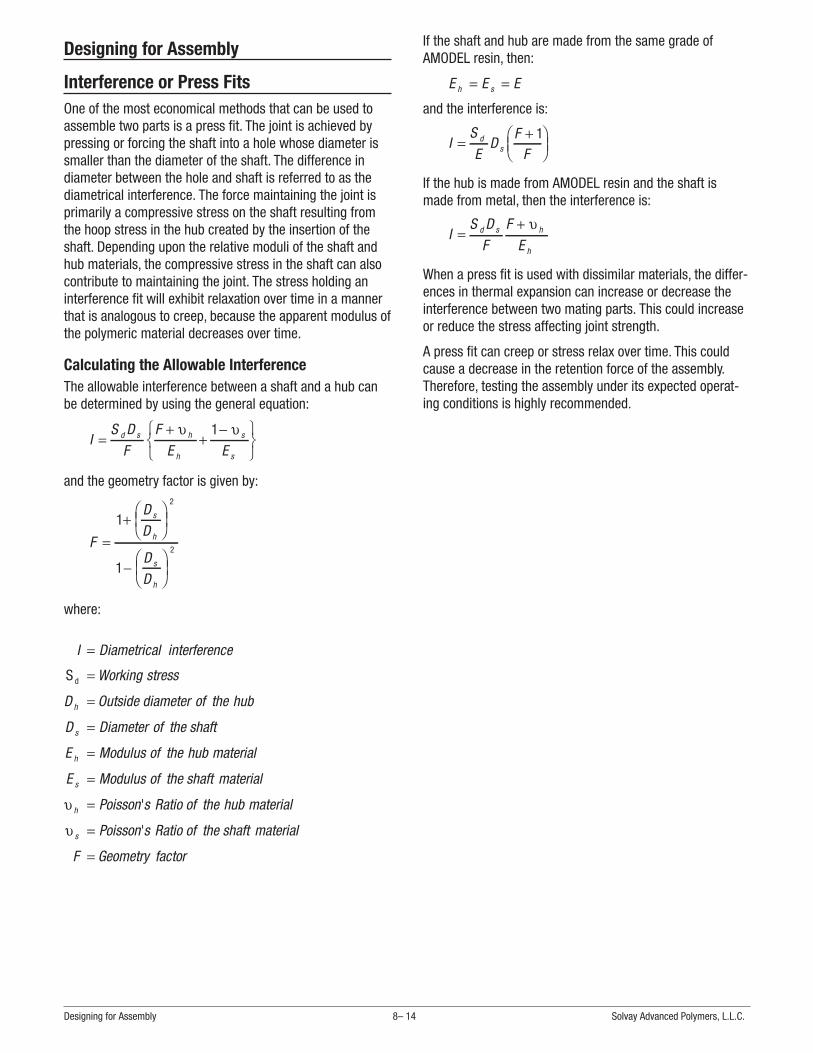
Designing for Assembly
Interference or Press FitsOne of the most economical methods that can be used toassemble two parts is a press fit. The joint is achieved bypressing or forcing the shaft into a hole whose diameter issmaller than the diameter of the shaft. The difference indiameter between the hole and shaft is referred to as thediametrical interference. The force maintaining the joint isprimarily a compressive stress on the shaft resulting fromthe hoop stress in the hub created by the insertion of theshaft. Depending upon the relative moduli of the shaft andhub materials, the compressive stress in the shaft can alsocontribute to maintaining the joint. The stress holding aninterference fit will exhibit relaxation over time in a mannerthat is analogous to creep, because the apparent modulus ofthe polymeric material decreases over time.
Calculating the Allowable InterferenceThe allowable interference between a shaft and a hub canbe determined by using the general equation:
IS D
FF
E Ed s h
h
s
s
=+
+−⎧
⎨⎩
⎫⎬⎭
υ υ1
and the geometry factor is given by:
F
DD
DD
s
h
s
h
=+
⎛⎝⎜
⎞⎠⎟
−⎛⎝⎜
⎞⎠⎟
1
1
2
2
where:
I Diametrical erference
Working stress
D Outsh
=
=
=
int
S d
ide diameter of the hub
D Diameter of the shaft
E Modulus
s
h
=
= of the hub material
E Modulus of the shaft material
Poi
s
h
=
=υ sson s Ratio of the hub material
Poisson s Ratio of the ss
'
'υ = haft material
F Geometry factor=
If the shaft and hub are made from the same grade ofAMODEL resin, then:
E E Eh s= =
and the interference is:
ISE
DF
Fd
s=+⎛
⎝⎜⎞⎠⎟
1
If the hub is made from AMODEL resin and the shaft ismade from metal, then the interference is:
IS D
FF
Ed s h
h
=+ υ
When a press fit is used with dissimilar materials, the differ-ences in thermal expansion can increase or decrease theinterference between two mating parts. This could increaseor reduce the stress affecting joint strength.
A press fit can creep or stress relax over time. This couldcause a decrease in the retention force of the assembly.Therefore, testing the assembly under its expected operat-ing conditions is highly recommended.
Designing for Assembly 8– 14 Solvay Advanced Polymers, L.L.C.

Mechanical FastenersMechanical fasteners provide an economical method of join-ing dissimilar materials together. Fasteners frequently usedwith injection molded plastic parts include screws, bolts,nuts, lock washers and lock nuts. When using metalmechanical fasteners, good design practice should be usedto prevent the plastic parts being assembled from becomingoverstressed.
The most obvious procedure for preventing a highly stressedassembly is to control the tightening of the mechanical fas-teners with torque limiting drivers. When torque cannot becontrolled, as might be the case with field assembly, shoul-der screws will limit compression on the plastic part. Otheralternatives may be to use flange-head screws, large wash-ers or shoulder washers. Figure 8-7 presents some pre-ferred designs when using mechanical fasteners.
Repeated assembling and disassembling should be avoidedwhen using self-tapping screws. If repeated assembly isrequired, thread-forming screws are recommended.
Self-tapping ScrewsA common type of mechanical fastener used with plastics isa self-tapping screw. A self-tapping screw cuts or formsthreads as it is inserted into the plastic and eliminates theneed for molding internal threads or the secondary opera-tion of tapping the thread form by machining. The majortypes are thread-forming and thread-cutting.
The modulus of elasticity of the plastic material plays animportant role in deciding what type of self-tapping screw ismost suitable for the application. For plastic materials with amodulus less than 3.0 GPa (440 kpsi), such as mostunreinforced resins, thread-forming screws are best sincethe plastic is ductile enough to be deformed without crack-ing or shearing. For glass and mineral filled grades,thread-cutting screws are preferred.
For optimum strip-out torque, the hole diameter of the bossshould be equal to the pitch diameter of the screw. Theouter diameter of the boss should be equal to two or threetimes the hole diameter and the boss height should be morethan twice the thickness of the boss.
Figure 8-8 illustrates the basic boss design for use withself-tapping screws.
To avoid stripping or high stress assemblies, torque con-trolled drivers should be used on assembly lines.
AMODEL PPA Design Guide 8– 15 Designing for Assembly
Figure 8-7
Designing for Mechanical Fasteners
Figure 8-8
Boss Design for Self-Tapping Screws
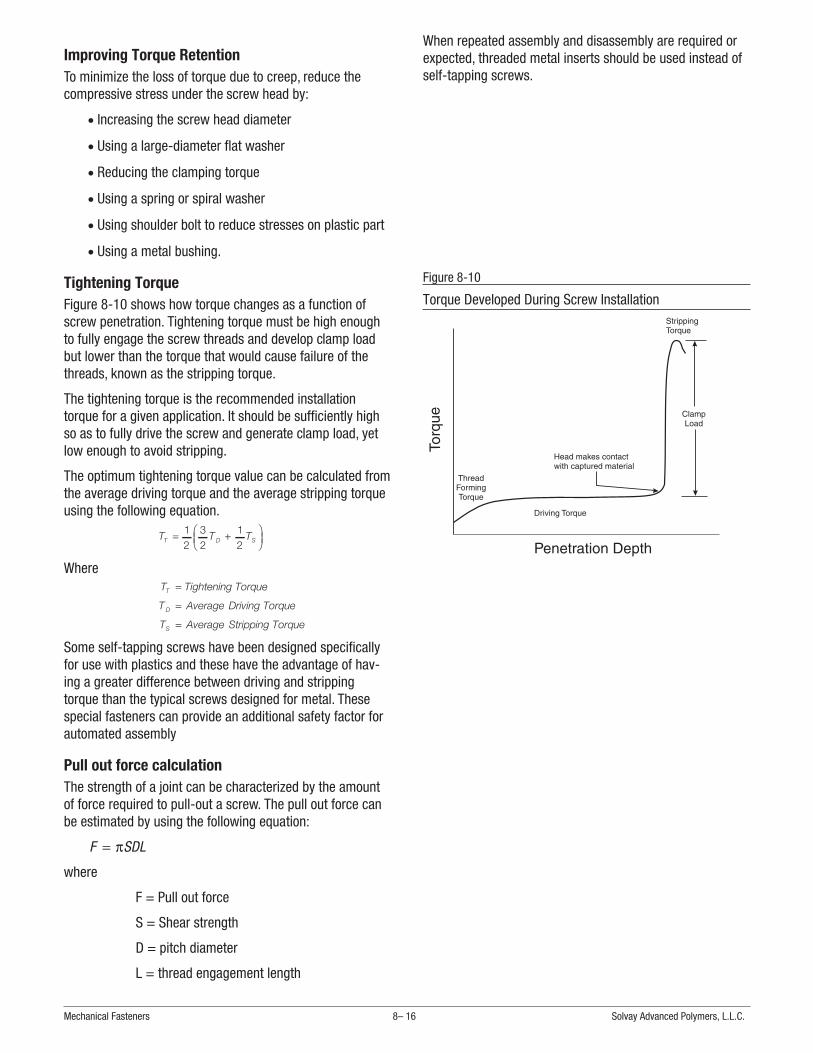
Improving Torque RetentionTo minimize the loss of torque due to creep, reduce thecompressive stress under the screw head by:
• Increasing the screw head diameter
• Using a large-diameter flat washer
• Reducing the clamping torque
• Using a spring or spiral washer
• Using shoulder bolt to reduce stresses on plastic part
• Using a metal bushing.
Tightening TorqueFigure 8-10 shows how torque changes as a function ofscrew penetration. Tightening torque must be high enoughto fully engage the screw threads and develop clamp loadbut lower than the torque that would cause failure of thethreads, known as the stripping torque.
The tightening torque is the recommended installationtorque for a given application. It should be sufficiently highso as to fully drive the screw and generate clamp load, yetlow enough to avoid stripping.
The optimum tightening torque value can be calculated fromthe average driving torque and the average stripping torqueusing the following equation.
T T TT D S= +⎛⎝⎜
⎞⎠⎟
12
32
12
WhereT Tightening Torque
T Average Driving Torque
T Avera
T
D
S
=
=
= ge Stripping Torque
Some self-tapping screws have been designed specificallyfor use with plastics and these have the advantage of hav-ing a greater difference between driving and strippingtorque than the typical screws designed for metal. Thesespecial fasteners can provide an additional safety factor forautomated assembly
Pull out force calculationThe strength of a joint can be characterized by the amountof force required to pull-out a screw. The pull out force canbe estimated by using the following equation:
F SDL= π
where
F = Pull out force
S = Shear strength
D = pitch diameter
L = thread engagement length
When repeated assembly and disassembly are required orexpected, threaded metal inserts should be used instead ofself-tapping screws.
Mechanical Fasteners 8– 16 Solvay Advanced Polymers, L.L.C.
Figure 8-10
Torque Developed During Screw Installation

Threaded InsertsThreaded metal inserts can be used to provide permanentmetal threads in a plastic part; a wide variety of sizes andtypes are available. Inserts are usually installed in moldedbosses whose internal diameter is designed for the insert.The most commonly used metal inserts are either molded-inor ultrasonically placed in the part as a secondary operation.In the case of the molded-in insert, the insert is placed inthe mold and the plastic is injected around it. Stress willdevelop when the plastic cools around the insert. To reducethis stress, heat the inserts to the temperature of the mold.
The ultrasonic insert is pressed into the plastic by meltingthe plastic with high frequency vibrations, generated by anultrasonic welding machine. The ultrasonic welding meltsmaterial around the metal insert as it is being installed,forming a bond between the insert and the plastic that isusually strong and relatively free of stress.
Figure 8-11 depicts the recommended insert and bossdesigns for use with AMODEL PPA resin.
AMODEL PPA Design Guide 8– 17 Designing for Assembly
Figure 8-11
Boss Design for Ultrasonic Inserts
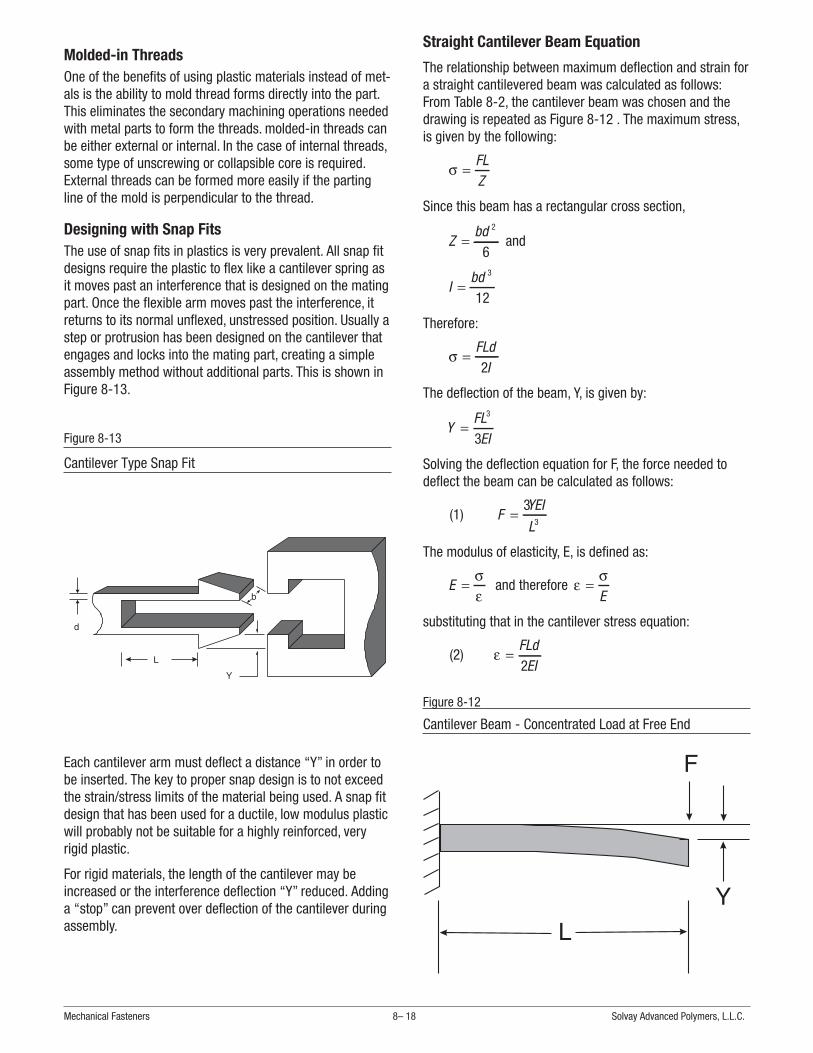
Molded-in ThreadsOne of the benefits of using plastic materials instead of met-als is the ability to mold thread forms directly into the part.This eliminates the secondary machining operations neededwith metal parts to form the threads. molded-in threads canbe either external or internal. In the case of internal threads,some type of unscrewing or collapsible core is required.External threads can be formed more easily if the partingline of the mold is perpendicular to the thread.
Designing with Snap FitsThe use of snap fits in plastics is very prevalent. All snap fitdesigns require the plastic to flex like a cantilever spring asit moves past an interference that is designed on the matingpart. Once the flexible arm moves past the interference, itreturns to its normal unflexed, unstressed position. Usually astep or protrusion has been designed on the cantilever thatengages and locks into the mating part, creating a simpleassembly method without additional parts. This is shown inFigure 8-13.
Each cantilever arm must deflect a distance “Y” in order tobe inserted. The key to proper snap design is to not exceedthe strain/stress limits of the material being used. A snap fitdesign that has been used for a ductile, low modulus plasticwill probably not be suitable for a highly reinforced, veryrigid plastic.
For rigid materials, the length of the cantilever may beincreased or the interference deflection “Y” reduced. Addinga “stop” can prevent over deflection of the cantilever duringassembly.
Straight Cantilever Beam Equation
The relationship between maximum deflection and strain fora straight cantilevered beam was calculated as follows:From Table 8-2, the cantilever beam was chosen and thedrawing is repeated as Figure 8-12 . The maximum stress,is given by the following:
σ =FLZ
Since this beam has a rectangular cross section,
Zbd
=2
6and
Ibd
=3
12
Therefore:
σ =FLd
I2
The deflection of the beam, Y, is given by:
YFLEI
=3
3
Solving the deflection equation for F, the force needed todeflect the beam can be calculated as follows:
(1) FYEI
L=
33
The modulus of elasticity, E, is defined as:
E =σε
and therefore εσ
=E
substituting that in the cantilever stress equation:
(2) ε =FLd
EI2
Mechanical Fasteners 8– 18 Solvay Advanced Polymers, L.L.C.
Figure 8-12
Cantilever Beam - Concentrated Load at Free End
Figure 8-13
Cantilever Type Snap Fit

Using the relationship of equation (1) and substituting for F
in equation (2) the relationship between strain and deflec-tion is derived:
(3) ε =3
2 2
Yd
L
This equation allows the designer to calculate the strainrequired from the maximum deflection of a design. Table8-4 summarizes maximum strain recommendations for sev-eral grades of AMODEL resins.
Once a suitable grade of AMODEL resin has been selected,the basic equations can be used to find the load, F, neededto deflect the cantilever the required amount.
In a cantilever snap fit, the stress and strain are maximumat the base of the cantilever and become proportionatelylower toward the tip where the load is applied. In fact thestress and strain at any point can be calculated by substitut-ing a different L, the distance from the load toward the fixedend. Therefore, if the cantilever thickness was graduallyreduced from fixed end to tip, the beam will be able todeflect more than in the fixed thickness cantilever withoutincurring higher maximum stresses. In this way, the capabil-ity of the material can be maximized.
Tapered Cantilever Beam Equation
For the tapered design shown in Figure 8-15, hL is the thick-ness at the free end. The value of the proportionality con-stant, , for a tapered beam design can be found in Figure8-14. The maximum strain can be calculated from equation(4).
(4) ε =3
20
2
Yh
L K
For example, if the beam thickness has been graduallyreduced to half its fixed end thickness; the ratio of hL to h0
would be 0.5 and K (from Figure 8-14) would be 1.6. There-fore, the maximum strain and the corresponding stresswould be multiplied the reciprocal of K, 0.625. The strainwill be reduced by about 40% of the strain of a constantthickness cantilever beam design with equal deflection.
AMODEL PPA Design Guide 8– 19 Designing for Assembly
AMODEL PPA Grade Maximum Strain, %
ET-1000 HS 1.0
A-1230 L 0.5
AS-1133 HS 1.0
Table 8-4
Strain Recommendations for Cantilever Snap-Fits
Ratio of h L to ho
0.3 0.4 0.5 0.6 0.7 0.8 0.9 1.0
Pro
po
rtio
na
lity
Co
nst
an
t, K
1.0
1.2
1.4
1.6
1.8
2.0
2.2
2.4
Figure 8-14
Proportionality Constant (K) for Tapered Beam
Figure 8-15
Snap Fit Design Using Tapered Beam
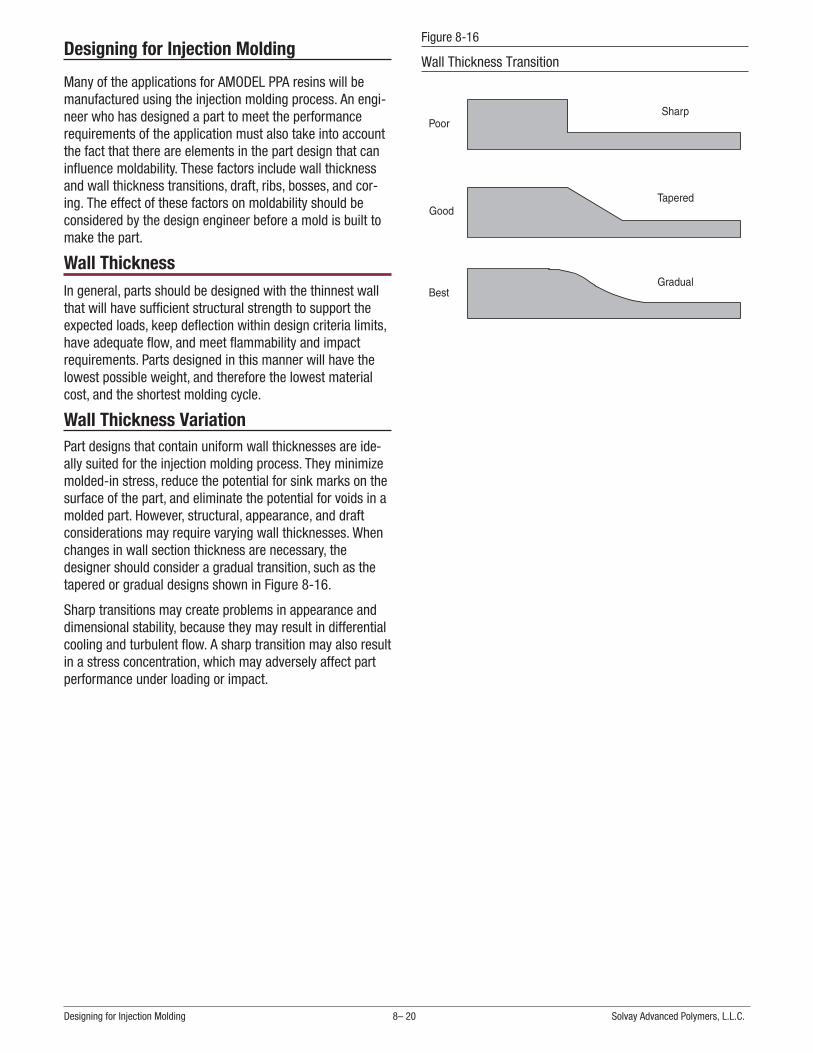
Designing for Injection Molding
Many of the applications for AMODEL PPA resins will bemanufactured using the injection molding process. An engi-neer who has designed a part to meet the performancerequirements of the application must also take into accountthe fact that there are elements in the part design that caninfluence moldability. These factors include wall thicknessand wall thickness transitions, draft, ribs, bosses, and cor-ing. The effect of these factors on moldability should beconsidered by the design engineer before a mold is built tomake the part.
Wall ThicknessIn general, parts should be designed with the thinnest wallthat will have sufficient structural strength to support theexpected loads, keep deflection within design criteria limits,have adequate flow, and meet flammability and impactrequirements. Parts designed in this manner will have thelowest possible weight, and therefore the lowest materialcost, and the shortest molding cycle.
Wall Thickness VariationPart designs that contain uniform wall thicknesses are ide-ally suited for the injection molding process. They minimizemolded-in stress, reduce the potential for sink marks on thesurface of the part, and eliminate the potential for voids in amolded part. However, structural, appearance, and draftconsiderations may require varying wall thicknesses. Whenchanges in wall section thickness are necessary, thedesigner should consider a gradual transition, such as thetapered or gradual designs shown in Figure 8-16.
Sharp transitions may create problems in appearance anddimensional stability, because they may result in differentialcooling and turbulent flow. A sharp transition may also resultin a stress concentration, which may adversely affect partperformance under loading or impact.
Designing for Injection Molding 8– 20 Solvay Advanced Polymers, L.L.C.
Figure 8-16
Wall Thickness Transition

Draft AngleTo aid in the release of the part from the mold, parts areusually designed with a taper. The taper creates a clearanceas soon as the mold begins to move, allowing the part tobreak free from its mold cavity. The taper is commonlyreferred to as draft, and the amount of taper as draft angle,as shown in Figure 8-17.
Adequate draft angle should be provided to allow easy partremoval from the mold. Generally, the designer should allowa draft angle of 0.5° to 1° per side for both inside and out-side walls for AMODEL resins. However, in some specialcases, smaller draft angles, as low as 1/8° to ¼°, have beenused with draw polish on the mold surface.
More draft should be used for deep draws or when coresare used. Textured finishes increase draft requirements by aminimum of 1° per side for each 0.001 inch (0.025 mm) oftexture depth.
RibsThe stiffness of a part design can be increased with properlydesigned and located ribs, without creating thick walls asillustrated in the Design Section entitled “Using Ribs toMaintain Stiffness” on page 8-8. Proper rib design will allowfor decreased wall thickness. This will save material andweight, and shorten molding cycles. It will also eliminatethick walls, which can cause molding problems like sinkmarks on the surface of parts or voids on the inside of parts.Ribs that are correctly positioned may also function as inter-nal runners, assisting plastic melt flow during molding.
In general, the following guidelines should be used whendesigning with ribs. The thickness at the rib base should beno greater than 60% of the adjacent wall thickness. Whenribs are opposite appearance areas, the width should bekept as thin as possible. If there are areas in the moldedpart where structure is more important than appearance,then ribs are often 75%, or even 100%, of the outside wallthickness. Whenever possible, ribs should be smoothly con-nected to other structural features such as side walls,bosses, and mounting pads. If there are several ribs in apart, they need not be constant in height or width, and areoften matched to the stress distribution in the part. All ribsshould have a minimum of ½° of draft per side and shouldhave a minimum radius of 0.8 mm (0.03 in.) at the base toreduce stress concentrations and sink marks.
Figure 8-18 shows the recommended rib size relationships.
AMODEL PPA Design Guide 8– 21 Designing for Injection Molding
Figure 8-17
Draft - Designing for Mold Release
Figure 8-18
Recommended Rib Design

CoringProper design practice should include uniform wall thick-ness throughout a part. Heavy sections in a part can extendcycle time, cause sink marks on the part surface, causevoids within the part and increase molded-in stresses.
Heavy sections should be cored to provide uniform wallthickness. For simplicity and economy in injection molds,cores should be parallel to the line of draw of the mold.Cores placed in any other direction usually create the needfor some type of side action or manually loaded andremoved loose cores.
Cores which extend into the cavity will be subject to highpressure. For blind cores (cores that are unsupported) thathave diameters greater than 1.5 mm (0.060 in.) the corelengths should not exceed three times the diameter, whileblind cores with diameters less than 1.5 mm (0.060 in.)should not exceed twice their diameter in length. These rec-ommendations may be doubled for through cores (coresthat telescope into or shut off with the opposite side of themold). Draft should be added to all cores, and all toolingdraw polished for best ejection.
BossesBosses are projections from the nominal wall of a part thatwill eventually be used as mounting or fastening points. Thedesign of bosses is largely dependent upon their role in agiven part. Cored bosses can be used for press fits, self-tap-ping screws, and ultrasonic inserts. Each of these will exertstress on the wall of the boss.
As a general guideline, the outside diameter of a bossshould be twice the inside diameter of the hole, and the wallthickness at the base of the boss should not exceed 60% ofthe part wall thickness unless structural concerns overrideappearance requirements. Figure 8-19 illustrates theseguidelines.
Additional forces imposed on bosses may tend to be trans-mitted down the boss and into the nominal wall. For thisreason, a minimum radius of 25% of the wall thickness isrequired at the base of the boss to provide strength andreduce stress concentration. A boss can be further strength-ened by using gusset-plate supports around the boss, orattaching it to a nearby wall with a properly designed rib.Bosses should be designed in the same manner as ribs.Heavy sections should be avoided to prevent the occurrenceof sink marks on the surface and voids in the interior of thepart.
Ribs 8– 22 Solvay Advanced Polymers, L.L.C.
Figure 8-19
Boss Design - General Guidelines

UndercutsSome design features, depending on orientation, can placeportions of the mold in the way of ejecting the part. Thesefeatures are called undercuts and can require special moldconfigurations, such as slides or cams, to move prior toejection. In some cases, the material being molded will haveenough flexibility than the part can be pushed off the under-cut without damage.
For example, the typical automotive thermostat housing, asshown in Figure 8-21, has beads to provide for leak-proofhose connections. To provide a smooth surface for the hoseconnection, the designer has specified that the parting linecannot be in this area. This results in an undercut at eachbead.
Under some circumstances, it may be possible to eject apart with an undercut if the core can be pulled first and theundercut ratio is 8 or less.
Undercut Ratio RBead diameter A Tube OD B
Tube( )
( ) ( )=
−×100 ID C( )
If the part must be molded without side pulls and the under-cut ratio calculated is greater than 8, the design should bemodified. One possible modification is to taper the tubeinside diameter effectively reducing the wall thicknessunder the bead. For tubes with inside diameters less than25 mm (1 in.), it may be necessary to modify the beadgeometry to get an undercut ratio of 8 or less.
The success of this approach is based upon removing thepart from the mold while the part is still hot and thereforemore flexible than it will be a room temperature.
AMODEL PPA Design Guide 8– 23 Designing for Injection Molding
Figure 8-20
Undercut Diagram
Figure 8-21
Thermostat Housing Showing Beads

Secondary OperationsWelding
Components produced from AMODEL resins can be readilyjoined using hot-plate, vibration, spin, or ultrasonic welding.
In this section, each welding method is described, and theapparatus and the conditions that produced acceptablewelds with AMODEL AS-1133 HS resin are discussed. Theseconditions are the suggested starting points for determiningwelding conditions for actual applications. Other AMODELgrades may require refinement of the noted process condi-tions. In some instances, additional information will be pro-vided, such as sensitivity to welding conditions, samplegeometry, or moisture content.
Because AMODEL resins absorb moisture, tests were per-formed on specimens conditioned to three different mois-ture levels; 0%, 1.8% and 3.8% moisture. These moisturecontents were selected to represent the moisture levels forparts molded from AMODEL AS-1133 HS resin that hadreached equilibrium in air with relative humidity levels of 0,50, and 100% respectively. To simplify the discussion ofresults, the term dry will be used for the dry, as moldedspecimens, normal for those containing 1.8 percent mois-ture, and saturated for those containing 3.8 percentmoisture.
In summary, acceptable welds can be achieved using all ofthe welding techniques evaluated and described in this sec-tion. Ultrasonic welding does require near-field energy appli-cation for strong welds. In general, absorbed moisture doesnot interfere with welding, but best results are obtainedusing samples that contain normal amounts of moisture(1.8%) or less.
Hot Plate WeldingIn hot plate welding, the thermoplastic samples are pressedagainst a heated element causing the contact surface tomelt. The element is then removed and the samples areforced together under pressure. This welding method typi-cally requires a longer cycle time than other methods, but itallows for the joining of parts that have a much larger sur-face area. With care, a strong and hermetic bond may beobtained using this method with AMODEL resins.
The hot plate welding machine used was a Bielomatic HV4806 welding machine manufactured in 1986 by LeuzeGMBH. The specimens used were bars 102 mm (4 in.) long,25 mm (1 in.) wide, and 6 mm (0.250 in.) thick. The weldingmachine was set up to provide a nominal lap shear weld of13 by 25 mm (0.5 by 1 in.). A diagram of the weld joint isshown in Figure 9-1.
Best results were obtained using a hot plate temperature of330°C (626°F), a clamping pressure of 207 KPa (30 psi).The optimum heating time for the test samples proved to be40 seconds, with a holding time of 20 seconds. The strengthof the bond produced was comparable to the strength of thematerial itself, i.e., the majority of the specimens failed atpoints other than the joint during mechanical testing.
Test plaques occasionally stuck to the hot plate unless a sili-cone mold release was applied and the hot plate wasallowed to reach thermal equilibrium. Tests showed that theuse of mold release did not reduce the weld strength.Absorbed moisture did not significantly affect weld strengthat dry (0%) and normal (1.8%) levels, but it did reduce weldstrength at the saturated (3.8%) condition.
Vibrational WeldingIn vibrational welding, friction is used to generate heat atthe weld joint. One of the parts to be assembled is held sta-tionary while the mating part vibrates ~0.8 to 1.5 mm(0.030 to 0.060 in.) in a linear fashion at 100 to 400 Hz.Vibrational welding is limited to flat parts, but has a rela-tively fast cycle time and a low tooling cost.
The machine used for these experiments was a VintonHydroweld Vibration welding machine. This machine oper-ates at a nominal frequency of 240 Hz. The specimens usedwere 102 mm (4 in.) long, by 25 mm (1 in.) wide, by 6 mm(0.25 in.) thick, and they were welded in a 25 by 13 mm (1by 0.5 in.) lap shear configuration as shown in Figure 9-2.
This method was very effective and welds as strong as theparent material were easily obtained. This technique provedrelatively insensitive to welding conditions, giving goodresults at weld times as short as 0.60 seconds and pres-sures as low as 2.20 MPa (320 psig). Best results wereobtained using specimens containing a normal (1.8%)amount of moisture.
9– 1 Solvay Advanced Polymers, L.L.C.
Figure 9-1
Joint Design for Hot Plate Welding

Spin WeldingThe spin welding method uses frictional heat to join twocylindrical or spherical mating parts. While one half is heldstationary in a nest fixture, the mating part is spun rapidlyagainst it. Friction at the interface raises the temperature ofthe material until melting occurs. When the spinning actionis stopped, the parts are held under pressure until cooled.Obviously, this welding method is limited to parts with circu-lar geometry at the joint. The advantage obtained throughspin welding is the increased dispersion of material at thejoint compared to other techniques. This allows for thedevelopment of hermetic seals and reduces the tolerancerequirements on the joint geometry.
Spin welded joints using AMODEL PPA should incorporate adesign known as a shear joint like that shown in Figure 9-3.Details known as flash traps may be incorporated to chan-nel the localized flow of the material to one side of the partdepending on requirements.
The spin welding machine used for these experiments wasa Mechasonic KLN Omega machine, model SPN-063. Typi-cally the important parameters for this welding method areangular speed, in revolutions per minute, normal force, andwelding time. Because this specific machine was an iner-tia-type, the energy available for spinning the sample waslimited to that stored in the flywheel. Instead of adjustmentsper se to speed, the energy stored in the flywheel was con-trolled. More modern spin welding machines allow for thecontrol of speed, force, time, and in some cases, angularlocation.
The specimens used for the spin weld testing were injectionmolded cups with an interference joint design. Excellentweld strength was obtained using this method.
Because the welding condition settings were machine-spe-cific, they are not generally useful in setting a starting point.Rather, it was observed that as forge pressure and angularvelocity were increased, weld strength increased up to amaximum and then decreased when an excessive amountof either pressure or velocity were applied. The values forthese parameters are strictly dependent on the part geome-try and therefore they are not noted here. The explanation ofthe observed phenomena is that when a weld was madewith too high a forge pressure, the spinning motion wasstopped too rapidly and not enough polymer melted andflowed to create a sound joint. In the other extreme, a highangular velocity and a low forge pressure, the top partessentially sat on top of the bottom part and freely rotatedwithout being forced into the interference fit. Thus, to assurea good joint, a welding condition must be found so bothmelting and forging occurs.
Moisture content did not significantly affect weld strength.
Ultrasonic WeldingIn the ultrasonic welding of thermoplastic materials, highfrequency (10 to 40 KHz) mechanical vibrations are trans-mitted through one of the mating parts to the joint interfacewhile the other half of the assembly is held stationary. Thecombination of friction and an applied force causes the tem-perature at the joint interface to increase to the meltingtemperature of the material. Normal force is held after theultrasonic energy input is removed to achieve a mechanicalbond or weld.
Ultrasonic welding has the advantage of being very highspeed and is well suited to high volume production. Weldconsistency and quality are high using this method; evenhermetic seals may be obtained with close tolerance parts.
AMODEL PPA Design Guide 9– 2 Welding
Figure 9-2
Lap Shear Joint Configuration
Figure 9-3
Shear Joint Configuration

Aside from the ultrasonic weld equipment, a customizedhorn must be employed for each assembly to focus theultrasonic energy for the given part configuration.
An energy-directing joint design is recommended for usewith AMODEL materials to ensure that there is localizedmelting at the joint. A typical joint design is shown in Figure9-6. The recommended interference using a shear jointdesign is a minimum of 0.2 mm (0.008 in.).
The ultrasonic welding machine used for this testing was aBranson Model 910 M microprocessor-controlled machine.With this unit it is possible to adjust the amount of ultrasonicenergy that is applied to the sample. For testing, the outputfrom the booster was fed to near and far field horns. Thesamples used were similar to the injection molded cup usedfor the spin welding evaluation. Aluminum fixtures held theparts in place and a butt weld joint configuration wasemployed.
Welds produced using a near field horn [defined as 6 mm(0.25 in.) or less measured from the horn to the weld joint]were excellent. Welds made using the far field horn positionwere weak (one-third of the strength achieved with nearfield) and are probably not useful. The conditions that gaveacceptable weld strength were: weld energy of 750 J andpressure of 4.3 MPa (617 psi).
Adhesive Bonding
Injection molded samples of AMODEL A-1133 HS resin werebonded with both an epoxy and a urethane adhesive. Bothadhesives were supplied by Lord Corporation. The epoxywas a two part adhesive sold under the trade name Lord®
305-1/-2 and the urethane was a two part system known asLord® 7500 A©.
To prepare the test specimens for the Lord 305-1/-2, a curecycle of 30 minutes at 120°C (250°F) followed by condition-ing at room temperature for 72 hours was employed. Thecure cycle for the Lord 7500 A© adhesive was 10 minutesat 90°C (200°F) followed by a 72-hour room temperatureconditioning step.
The bond strength for both materials was tested at low tem-perature, room temperature, and an elevated temperature.To evaluate the effect of humid aging, specimens were con-ditioned for 14 days at 38°C (100°F) and 100% relativehumidity. Some specimens were tested immediately afterconditioning; others were tested 24 hours after conditioning.
Impact performance was determined with a side impacttester according to GM specification #9751P. Lap shear val-ues were measured on an Instron testing machine using apull rate of 13 mm/min (0.5 in./min) according to ASTMD1002.
Ultrasonic Welding 9– 3 Solvay Advanced Polymers, L.L.C.
Figure 9-4
Lap Shear Bond Strength
Figure 9-5
Side Impact Bond Strength
Figure 9-6
Typical Energy-Directing Joint Configuration

The results are shown in Figures 9-4 and 9-5. In general,the epoxy adhesive performed slightly better than the ure-thane. Acrylic adhesives are not recommended for use withAMODEL resins.
Coatings and Surface Finishes
Vacuum MetallizingVacuum metallization involves the evaporation, and subse-quent condensation, of a metal onto a substrate in a vacuumchamber. The metal used in most industrial applications isaluminum. When the end use requirement is primarily deco-rative, the substrate is usually processed with two organiccoatings called the basecoat and the topcoat with the metallayer deposited in between. The primary function of thebasecoat is to produce a smooth surface on molded plasticparts so that the metal layer will have maximum luster. Asecondary function of the basecoat is to maximize adhesionof the metal layer to the substrate. On substrates that tendto outgas in a vacuum, the basecoat also provides a barrierlayer. The function of the topcoat is to protect the metallayer from physical, oxidative, or chemical deterioration.
Basecoats that are compatible with AMODEL resins include#VB-4315, #VB-4774, and #VB-4836-1 from Pearl Paints,http://www.pearlpaints.com/index.html. Topcoats that arecompatible with AMODEL resin include #VT 4316-2, alsofrom Pearl Paints.
Because of the need to vaporize the metal materials duringthis process, an elevated temperature may be expected inthe vacuum chamber. The rate at which parts may becoated is controlled by the thermal characteristics of thesubstrate material. For this reason, AMODEL resin, with itshigh heat deflection temperature, is an excellent candidatematerial when metallization is required as comparativelyrapid cycle times may be obtained.
Laser MarkingIt is possible to obtain a durable, high contrast mark onAMODEL resins using commercially available laser markingsystems. Depending upon the wavelength and intensity ofthe laser system used, the appearance of the mark canrange from a bleached surface to an engraved mark.
No one set of conditions can be specified for laser markingall AMODEL PPA resins. Operating parameters must beadjusted depending upon the particular application and partbeing marked.
The manufacturers in Table 9-2 have equipment that shouldbe suitable for marking AMODEL PPA resins.
Inkjet PrintingInkjet printing can be used to provide a highly visible markon AMODEL PPA resin substrates of any color. The durabilityof marks made using an inkjet system depends upon theenvironment to which the marked part will be exposed andthe type of ink used to make the mark. In many cases thedurability of the mark will be satisfactory.
Equipment needs vary depending upon the type of ink used,the speed at which the mark is made, and size of thedesired mark. A wide variety of equipment and inks arecommercially available. Two sources are shown in Table9-3.
PaintingSeveral grades of AMODEL PPA resin were evaluated fortheir compatibility with various automotive paint systems.Representative glass-reinforced, mineral-reinforced, andmineral/glass-reinforced compounds were evaluated.
As with all plastic substrates, the primer system is critical.The test specimens were cleaned with isopropyl alcoholthen coated with primers and cured as per the manufac-turer’s instructions. The plaques were tested for tape adhe-sion (GM9071P, method A) and cross-hatch adhesion
AMODEL PPA Design Guide 9– 4 Adhesive Bonding
Supplier Primer DescriptionBASF U04KD004 solvent, flexible
U04AD041 solvent, rigid
U36AD001 water based
PPG RPP9870 solvent, high solids
AHAP9470R solvent, one coat
Red Spot AE146 solvent, lacquer
Siebert-Oxidermo UBP9604 solvent, high solids
BP2024 solvent
Sherwin-Williams E75BC2301 solvent
E75AC6 solvent
Table 9-1
Suitable Automotive Primers
Company Website
Videojet Systems International,Inc.
www.videojet.com
Aromat Corporation www.sunxlasermarkers.com
ID Technology www.idtechnology.com
Table 9-2
Suppliers of Laser Marking Equipment
Company Website
Videojet Systems International,Inc.
www.videojet.com
ID Technology www.idtechnology.com
Table 9-3
Suppliers of InkJet Printing Equipment
(GM9071P, method B) and gravelometer chip resistance(GM9508P and SAEJ400) as coated and after conditioningfor 96 hours with water/fog/humidity per GM4465P specifi-cation. Table 9-1 lists primers that meet or exceed all testrequirements and represent adequate coating performancefor most painted automotive applications.
OvermoldingA process developed by the Bryant Rubber Corporationallows for the overmolding of AMODEL materials with softtouch silicone rubber. The silicone rubber materials are idealfor the creation of sealing surfaces, tactile grips, andsound/noise dampening details. While overmolding with sili-cone rubber is not a new idea, these design details are typi-cally characterized as having poor adhesion to the rigid sub-strates even if primers, or priming processes, are employed.The adhesion and peel strength achieved through the use ofBryant’s Select Primerless Adhesion Polymer System(SPAPS™ Technology) is uniquely better than anything thathas previously been achieved. In fact, cohesive failure of thesilicone rubber is typical of the SPAPS™ Technologyprocess.
AMODEL resins are particularly well suited for use in con-junction with SPAPS™ silicone rubbers due to their excel-lent properties at high temperatures. This allows for reducedcycle times for the silicone cure process, improving overalleconomics. The silicone materials match the long-termthermal stability of AMODEL resin, more so than otherelastomeric materials, ensuring long-term performance indifficult environments.
The SPAPS™ silicone rubbers are offered in the full range ofproperty options available in other common silicon rubbers.The materials are naturally transparent and colorable usingliquid colorants during the molding process, with excellentcolor fastness, even with prolonged ultraviolet light expo-sure. They are available with durometer ratings of 10-85 onthe Shore A scale. Their chemical resistance is similar tothat of other silicone rubber materials. The unreactive char-acter of the materials will allow for agency approvals, suchas NSF, FDA, and U.S.P., of the finished parts.
Further information regarding the overmolding process maybe obtained from the Bryant Rubber Corporation athttp://www.bryantrubber.com/.
Painting 9– 5 Solvay Advanced Polymers, L.L.C.
IndexAAdhesive Bonding 9-3AMODEL PPA base resins 1-1Amorphous 1-1Assembly
Designing for 8-14, 8-15, 8-17, 8-19ASTM D 149 6-1ASTM D 257 6-1ASTM D 2990 4-5ASTM D 3763 3-11ASTM D 638 3-1ASTM D 648 5-1ASTM D 671 4-7ASTM D 256 3-9ASTM D 3045 5-6ASTM D 695 3-8ASTM D 732 3-7ASTM D 790 3-5ASTM E 662 5-9ASTM E 831 5-2ASTM F 433 5-4
BBase resins 1-1Beam Bending Model 8-5Bolt Tightness
Design Example 8-13Bosses
Use in Part Design 8-22Bryant Rubber 9-5
CCalculations
Press Fit 8-14Charpy 3-10Chemical Compatibility
General 7-5Chemical Resistance 7-1, 7-3, 7-5
Aqueous Chemical Solutions 7-3Effect of Chemical Structure 7-1Organic Chemicals 7-2Screening Tests 7-1Transportation Fluids 7-4
Chemistry 1-1Coefficient of linear thermal expansion 5-2Combustion Properties 5-8Comparative Tracking Index 6-3Compressive strength 3-8Coring
Use in Part Design 8-22Creep
Compressive 4-6Flexural 4-5Tensile 4-5
Creep DesignDeflection Calculations 8-9
Creep- Sustained LoadDesigning for 8-9
Crystallinity 1-1Comparative Tracking Index 6-3
DDeflection Calculations 8-6Deflection Temperature 5-1Design 8-1Dielectric Constant 6-2Dielectric strength 6-1Dissipation Factor 6-2Draft Angle 8-21
EElastic modulus 3-2Electrical Properties 6-1, 6-3
Test Methods 6-1Environmental Resistance 7-1Example Design
Equivalent Stiffness 8-7Examples
Design 8-7
FFasteners
Designing for Mechanical 8-15Fatigue Resistance 4-6Fatigue Strength 4-6Fiber Orientation 8-1Flammability
UL 94 5-10Flexural modulus 3-5Flexural strength 3-5, 4-5, 4-8
GGlow Wire 5-8Glow Wire Test 5-8
HHigh-Current Arc Ignition 6-4Heat Deflection Temperature 5-1High-Voltage Arc Resistance to Ignition 6-4High-Voltage Arc-Tracking-Rate 6-3High-Voltage, Low-Current, Dry Arc Resistance 6-2Horizontal Burning Test 5-10Hot Plate Welding 9-1Hot Wire Ignition 6-3High-Voltage Arc-Tracking-Rate 6-3Hot Wire Ignition 6-3
IIEC 695-2-1/3 5-8Impact Resistance Testing 3-9Impact Strength 3-9
Charpy 3-10Izod 3-9
InsertsThreaded 8-17Ultrasonic 8-17
Interference Fits 8-14Introduction 1-1ISO 527 3-1ISO 178 3-5ISO 179/1eA 3-10ISO 180 3-9
10-1
ISO 75 5-1ISO 899 4-2Isochronous 4-4Izod impact 3-9
MMarking
Laser 9-4Material Strength in Design 8-6Mechanical Design 8-1Mechanical Properties
Long-term 4-1Short Term 3-1
Moisture Absorption 4-8Moisture Effects 1-3, 4-8
Dimensions 4-9Strength and Stiffness 4-9
Mold Release 8-21Designing for 8-21
MoldingDesigning for 8-20
NNomenclature 2-1Notched Izod Impact 3-9
OOvermolding 9-5
PPA66 3-9, 3-10, 4-6Painting 9-4Poisson’s ratio 3-11Polyamide 1-1Polyphthalamide 1-1PPA base resins 1-1PPA property tables 2-1Press Fits 8-14Printing
Inkjet 9-4Property Tables 2-1
RRadiation
Gamma 7-6Reinforcing Fiber Orientation
Effect on Mechanical Performance 8-6Relative Thermal Index 5-6Ribs
Influence on Stiffness 8-8Molding Recommendations 8-21
RTI 5-6
SScrew
Torque Retention 8-16Screws
Self-tapping 8-15Secondary Operations 9-1
Section ThicknessInfluence on Stiffness 8-7
Semi-crystalline 1-1, 1-2Shear strength 3-7Silicone Rubber 9-5Smoke Density 5-9Snap Fits
Calculation Straight Beam 8-18Calculation Tapered Beam 8-19Designing 8-18
Specific heat 5-5Spin Welding 9-2Stress - Strain curve 3-1Stress Concentrations 8-11Stress Max Allowable 8-10Stress/Strain Calculations 8-5Stress/strain curve 3-2Surface Resistivity 6-1Sustained Load
Designing for 8-9
TTensile modulus 3-2Tensile properties 3-1Tensile strength 3-2, 3-4, 4-9, 5-6, 7-1TGA 5-6Thermal aging 5-6Thermal conductivity 5-4Thermal Expansion 5-2Thermal properties 5-1Thermal stability 5-6Thermal Stresses
Designing for 8-12Thermogravimetric analysis 5-6Threaded inserts 8-17Threads
Molded in 8-18
UUL 746A 6-1UL 746B 5-6UL 94 5-10
Horizontal Burning Test 5-10Vertical Burn Test 20MM 5-10Vertical Burn Test 500 MW 5-10
Ultrasonic Welding 9-3
VVacuum Metalizing 9-4Vertical Flammability 5-10Volume Resistivity 6-1
WWall Thickness 8-20Welding 9-1
Hot Plate 9-1Spin 9-2Ultrasonic 9-2Vibrational 9-1
Wire 6-3
10-2
Index-continued

Solvay Advanced Polymers, L.L.C.4500 McGinnis Ferry RoadAlpharetta, GA 30005-3914USAPhone: +1.770.772.8200
+1.800.621.4557 (U.S. only)Fax: +1.770.772.8454
Solvay Advanced Polymers has offices in the Americas, Europe, and
Asia. Please visit our website at www.solvayadvancedpolymers.com
to locate the office nearest to you.
Product and Technical LiteratureTo our actual knowledge, the information contained herein is accurate
as of the date of this document. However, neither Solvay Advanced
Polymers, L.L.C. nor any of its affiliates makes any warranty, express
or implied, or accepts any liability in connection with this information
or its use. This information is for use by technically skilled persons at
their own discretion and risk and does not relate to the use of this
product in combination with any other substance or any other
process. This is not a license under any patent or other proprietary
right. The user alone must finally determine suitability of any informa-
tion or material for any contemplated use, the manner of use and
whether any patents are infringed.
Health and Safety Information Material Safety Data Sheets (MSDS) for products of Solvay Advanced
Polymers are available upon request from your sales representative or
by writing to the address shown on this document. The appropriate
MSDS should be consulted before using any of our products
AMODEL is a registered trademark of Solvay Advanced Polymers, L.L.C.
AM - 50477 © 2002 Solvay Advanced Polym ers, L.L.C. All rights reserved. D 06/06


![AModel-BasedAircraftCertificationFrameworkforNormal … · 2020. 11. 13. · Table1 RepresentativecomponentsindifferentASTMacceptedMoCfor14CFRPart23SubpartE[3,21–23] F3062-PowerplantInstallation](https://img.dokumen.tips/doc/110x75/60c8d87eb03ff85833798f56/amodel-basedaircraftcertiicationframeworkfornormal-2020-11-13-table1-representativecomponentsindiierentastmacceptedmocfor14cfrpart23subparte321a23.jpg)