Embed Size (px)
Citation preview

Vol. 56, No. 2APPLIED AND ENVIRONMENTAL MICROBIOLOGY, Feb. 1990, p. 451-4620099-2240/90/020451-12$02.00/0Copyright C) 1990, American Society for Microbiology
Ammonia-Oxidizing Bacteria in a Chloraminated DistributionSystem: Seasonal Occurrence, Distribution,
and Disinfection ResistanceROY L. WOLFE,* NANCY I. LIEU, GEORGE IZAGUIRRE, AND EDWARD G. MEANS
Metropolitan Water District of Southern California, 700 Moreno Avenue, La Verne, California 91750
Received 8 September 1989/Accepted 17 November 1989
Nitrification in chloraminated drinking water can have a number of adverse effects on water quality,including a loss of total chlorine and ammonia-N and an increase in the concentration of heterotrophic platecount bacteria and nitrite. To understand how nitrification develops, a study was conducted to examine thefactors that influence the occurrence of ammonia-oxidizing bacteria (AOB) in a chloraminated distributionsystem. Samples were collected over an 18-month period from a raw-water source, a conventional treatmentplant effluent, and two covered, finished-water reservoirs that previously experienced nitrification episodes.Sediment and biofilm samples were collected from the interior wall surfaces of two finished-water pipelines andone of the covered reservoirs. The AOB were enumerated by a most-probable-number technique, and isolateswere isolated and identified. The resistance of naturally occurring AOB to chloramines and free chlorine was
also examined. The results of the monitoring program indicated that the levels of AOB, identified as membersof the genus Nitrosomonas, were seasonally dependent in both source and finished waters, with the highestlevels observed in the warm summer months. The concentrations of AOB in the two reservoirs, both of whichhave floating covers made of synthetic rubber (Hypalon; E. I. du Pont de Nemours & Co., Inc., Wilmington,Del.), had most probable numbers that ranged from <0.2 to >300/ml and correlated significantly withtemperature and levels of heterotrophic plate count bacteria. No AOB were detected in the chloraminatedreservoirs when the water temperature was below 16 to 18°C. The study indicated that nitrifiers occur
throughout the chloraminated distribution system. Higher concentrations of AOB were found in the reservoirand pipe sediment materials than in the pipe biofilm samples. The AOB were approximately 13 times more
resistant to monochloramine than to free chlorine. After 33 min of exposure to 1.0 mg of monochloramine per
liter (pH 8.2, 23°C), 99% of an AOB culture was inactivated. The amounts of this disinfectant that are
currently used (1.5 mg/liter at a 3:1 ratio of chlorine to ammonia-N) may be inadequate to control the growthof these organisms in the distribution system.
Nitrification is an important microbiological process in theoxidation of ammonia in terrestrial and aquatic environ-ments. Ammonia is converted sequentially to nitrite andnitrate by two groups of chemolithotrophic nitrifying organ-isms, the ammonia-oxidizing bacteria (AOB) and the nitrite-oxidizing bacteria. Nitrification has been well recognized asa beneficial treatment for the removal of ammonia in munic-ipal sewage. In addition, research at several European watertreatment facilities has shown that controlled nitrificationprovides an effective means of removing ammonia from theraw water (16, 26). Elimination of ammonia produces morebacteriologically stable drinking water and reduces the costsassociated with additional disinfectant requirements (12). Incontrolled or complete nitrification, ammonia is converted tonitrate in the filter beds, where high levels of nitrifyingbacteria are allowed to grow. This growth is achieved bydelaying the disinfection process until after the water haspassed through the filters.
In contrast to the benefits of complete nitrification, incom-plete or partial nitrification in chloraminated distributionsystems can adversely affect water quality. Incompletenitrification results in the buildup of nitrite from the growthof AOB (36). Nitrite is problematic because it rapidly re-duces free chlorine (26), accelerates the decomposition ofchloramines (32), and can interfere with the measurement of
* Corresponding author.
free chlorine (18, 35). In 1939, Larson (20) reported thatincomplete nitrification in a distribution system containing1.8 mg of monochloramine residual per liter resulted incorrosion of the pipelines, increased heterotrophic platecounts (HPCs), and anaerobic conditions. Similar effectshave also been reported for other systems that use chlora-mines, but sufficient details have not been provided toclearly determine whether the causative agents were AOB(9, 14, 21, 28). Most recently, Wolfe et al. (36) have reportednitrification episodes in two covered finished-water reser-voirs in a Southern California system with a 1.5-mg/litermonochloramine residual. During the course of the episodes,the total chlorine and ammonia concentrations in the reser-voirs declined rapidly, and the HPC level in one of thereservoirs exceeded 90,000 CFU/ml. Elevated levels of AOBand nitrite in the reservoirs, as compared with those in thereservoir influents, indicated that incomplete nitrificationwas occurring. Furthermore, the presence of AOB in thechloraminated water suggested that these bacteria werehighly resistant to this disinfectant.An understanding of how incomplete nitrification occurs
in chloraminated waters is of increasing importance as manyutilities convert to chloramine disinfection to comply withcurrent and future regulations on disinfection by-products.Unfortunately, very little information is available on theoccurrence or disinfection resistance of AOB in potablewater. Tuovinen et al. (31) detected AOB in several tubercle
451
on July 5, 2020 by guesthttp://aem
.asm.org/
Dow
nloaded from

APPL. ENVIRON. MICROBIOL.
deposits in finished-water pipelines. In their study, thepresence of nitrifying bacteria was demonstrated only bymeasuring the pH and turbidity of cultures. No biochemicalidentification or enumeration of the AOB was reported. In1935, Feben (14) reportedly isolated Nitrosococcus spp.from filter beds and tap water samples in a chloraminateddistribution system. A number of other reports have alsoalluded to the presence of nitrifying bacteria in water sup-plies but have provided no data-or only anecdotal data-ontheir occurrence and identity (17, 21, 24). The lack ofinformation on nitrifiers in water arises, in part, from meth-odological difficulties in isolating and enumerating theseorganisms. Recovery efficiencies are typically low, incuba-tion times of several weeks or more are required, and resultsmay be confounded by the presence of heterotrophic bacte-rial contaminants (4).The purpose of this study was to examine the occurrence
of AOB in a chloraminated distribution system. Emphasiswas placed on monitoring AOB levels in two coveredfinished-water reservoirs in which previous nitrification ep-isodes had occurred (36). Secondary objectives were toidentify AOB isolated from the reservoirs, assess relation-ships between the numbers of AOB and selected waterquality parameters, and determine the resistance of thesebacteria to chloramines and free chlorine. Collectively, thefindings of these studies may be helpful in developingtechniques for preventing nitrification in chloraminated sys-tems.
MATERIALS AND METHODS
System description. The Metropolitan Water District ofSouthern California is a public, municipal agency that whole-sales supplemental water through 27 member agencies (citiesand water districts), serving approximately 14 million peoplein a 5,200-mi2 (13,200-kM2) service area. Water is importedfrom the Colorado River via the Colorado River Aqueductand from Northern California through the California StateWater Project. Water deliveries currently average approxi-mately 2 million acre-ft (2.47 x 10⁹ m3) per year. The systemincludes five water filtration plants and four finished-waterreservoirs.Two of the reservoirs of the Metropolitan Water District,
Garvey and Orange County reservoirs, have floating, syn-thetic rubber (Hypalon; E. I. du Pont de Nemours & Co.,Inc., Wilmington, Del.) covers. Garvey Reservoir and Or-ange County Reservoir have, respectively, capacities of1,600 and 200 acre-ft (19.74 x 10⁵ m3 and 2.47 x 10⁵ m3),maximum depths of 51 and 46 ft (15.5 and 14.0 m), andmaximum surface areas of 38 and 7.3 acres (15.4 and 3.0 ha).The water in these reservoirs was treated at the F. E.Weymouth Filtration Plant, located in La Verne, Calif.Treatment processes at all the filtration plants include coag-ulation, flocculation, sedimentation, filtration, and disinfec-tion. Chlorine is added to the plant influent, and ammonia isadded after the filters to obtain a 3:1 weight ratio of chlorineto ammonia-N (C12/N). The chloramine residual of waterentering the distribution system is approximately 1.5 mg/liter. The water leaving the plant is adjusted to approxi-mately pH 8.2 for corrosion control. The temperature ofwater in the distribution system ranges seasonally from 12 to270C.
Typically, additional free chlorine (0.1 to 0.2 mg/liter) isapplied at the effluent of the reservoirs to maintain the1.5-mg/liter chloramine residual downstream from the reser-
voirs. Because of the previous nitrification episode inGarvey Reservoir, the Cl1/N weight ratio at this reservoir isincreased to 4:1 by adding chlorine at the inlet to decreasethe amount of free ammonia from May to October each year.The retention time of water in Orange County Reservoiraverages 4 days and ranges from 2 to 9 days, whereas themean retention time in Garvey Reservoir is 9 days, with arange of 4 to 16 days.Sample collection. Samples were collected from the follow-
ing locations: Weymouth plant (influent and effluent),Garvey Reservoir (influent, effluent, and at a 5-ft [1.5-m]depth in the reservoir water column), and Orange CountyReservoir (effluent and at a 5-ft [1.5-m] depth in the reservoirwater column). With the exception of Orange County Res-ervoir, samples were collected every 2 weeks from January1986 to December 1987. Orange County Reservoir sampleswere collected from October 1986 to December 1987. Onseveral occasions, samples were also obtained from theinterior surfaces and sediment material of two finished-waterpipelines, Palos Verdes Feeder (inner diameter, 72 in [1.83m]) and Middle Feeder (inner diameter, 50 in [1.27 m]), andfrom the sediment on the bottom and sides of Orange CountyReservoir.Water samples were collected in sterile bottles containing
10% sodium thiosulfate (J. T. Baker Chemical Co., Phillips-burg, N.J.) to neutralize the chloramines. Samples weretransported to the laboratory on ice at 4°C and analyzedwithin 4 h of arrival. Sampling personnel entered the pipe-lines and collected samples immediately after the line wasdewatered to minimize the impact of desiccation. Areasmeasuring 12 by 10 cm2 were aseptically scraped at severalrepresentative sites on the Palos Verdes Feeder. For sam-ples from the Middle Feeder, an area measuring 250 by 350cm2 was scraped. All scrapings were placed into sterile testtubes containing Standard Methods (SM) buffer (3). Also,approximately 1 ml of the sediment slurry from the bottom ofthe Palos Verdes Feeder was placed into 100 ml of the SMbuffer. Sediment samples from the bottom and sides ofOrange County Reservoir were collected by scuba divers.Approximately 4 cm2 of the sediment material from each sitewas scooped with a sterile spatula into a sterile bottlecontaining 10% sodium thiosulfate (J. T. Baker) in SMbuffer. Water samples were analyzed for the followingconstituents: coliforms, temperature, free and total residualchlorine, pH, nitrite-N, and free and total ammonia-N.Biofilm and sediment samples were also analyzed for dryweight, as described in Standard Methods (3).
Analyses. Chlorine and nitrite were measured with acolorimeter (model DR/1A; Hach Co., Loveland, Colo.).The reliability of the chlorine measurements was checkedagainst the ferrous ammonium sulfate diethyl-p-phenylene-diamine (FAS-DPD) procedures described in StandardMethods (3) with an amperometric titrator (Hach Co.). Thereliability of the nitrite measurements was checked againstthe diazotized sulfanilic acid-N-(1-naphthyl)-ethylenedi-amine dihydrochloride method described in Standard Meth-ods (3) with a continuous-flow analyzer (model AC 200;Scientific Instruments Corp., Pleasantville, N.Y.). Ammo-nia-N concentrations were determined with an ammonia-specific electrode (model 95-12; Orion Research, Inc., Cam-bridge, Mass.). Dry weight determinations of biofilm andsediment samples were made by drying the material for 30min, or until it was completely dry, at 103°C in a convectionoven (Thelco model 15; GCA/Precision Scientific Co., Chi-cago, Ill.) and then weighing it on an electrobalance (model29; Cahn Instruments, Cerritos, Calif.). The HPCs were
452 WOLFE ET AL.
on July 5, 2020 by guesthttp://aem
.asm.org/
Dow
nloaded from

AMMONIA-OXIDIZING BACTERIA IN A DISTRIBUTION SYSTEM 453
enumerated in duplicate by both the pour plate procedure,with tryptone glucose extract agar (Difco Laboratories,Detroit, Mich.) incubated for 48 h at 35°C, and the mem-brane filtration technique, with R2A medium (Difco) incu-bated for 7 days at 28°C.The AOB were enumerated by a five-tube most-probable-
number (MPN) technique (1, 13, 36). Tenfold serial dilutionsof samples were placed in 2-ml cell well plates (CorningGlass Works, Corning, N.Y.) containing medium formulatedby Soriano and Walker (29). However, the medium wasslightly modified by increasing the phenol red concentrationto improve the sensitivity for detection of growth. Themodified Soriano and Walker (MSW) medium is composedof the following ingredients per liter of distilled water:(NH4)2SO4, 0.5 g; MgSO4 7H2O, 0.04 g; CaCl2. 2H2O,0.04 g; KH2PO4, 0.2 g; chelated iron (Sequestrene 138 Fe;CIBA-GEIGY Corp., Greensboro, N.C.), 0.00016 g; andphenol red, 0.002 g. The medium was adjusted to pH 8.0 withNaOH (10 N). The trays were sealed in plastic bags toprevent desiccation and incubated in the dark for 21 days at28°C. Each cell well was tested for the presence of nitrite byadding several drops of sulfanilic acid and N,N-dimethyl-c-naphthylamine (23). Wells that exhibited a red color within1 min after addition of the reagents were scored positive fornitrite. Wells that developed a slight pink color after 1 min orthat were colorless were scored negative. Controls consist-ing of distilled water supplemented with MSW medium wereincubated under the same conditions as the water samples.Positive controls consisted of spiking selected wells with anactively growing culture of Nitrosomonas europaea ATCC19718 (American Type Culture Collection, Rockville, Md.).Because volumes of 10, 1, and 0.1 ml were being assayed,the detection limit for AOB with this system was an MPN of0.2/ml. The AOB values presented in this report representthe mean of duplicate MPN analyses.
Isolation and identification of AOB. Nitrite-positive cul-tures from Orange County and Garvey reservoir sampleswere enriched in MSW medium. Enrichment cultures werefirst spread plated onto MSW medium containing 1% agarand incubated in the dark at 28°C inside plastic bags.Colonies that developed within the first 5 to 7 days werepresumed to be heterotrophic bacterial contaminants, asammonia oxidizers are relatively slow growers. Small,round, tan-colored colonies that developed after 7 days wereselected for further analysis as potential nitrifiers. Colonieswere picked from the agar with sterile 25-,ul micropipettes(Drummond Scientific Co., Broomall, Pa.) and ejected intotest tubes containing 4.0 ml of sterile MSW medium withphenol red. The tube cultures were incubated in the dark at28°C for up to 6 weeks. Cultures that turned yellow weretested for nitrite in a spot plate. Positive tubes were trans-ferred to Erlenmeyer flasks containing 30 ml of sterile MSWmedium buffered to pH 8.0 with 0.05 M N-2-hydroxyeth-ylpiperazine-N'-2-ethanesulfonic acid (HEPES; SigmaChemical Co., St. Louis, Mo.). After turbid growth haddeveloped, small amounts of it were plated onto agar con-taining MSW medium. Colonies appearing after 7 days ofincubation were transferred into tubes containing MSWmedium. Cultures that tested positive for nitrite were testedfor the presence of heterotrophic bacterial contaminants byadding 0.5 ml of the culture to small vials containing approx-imately 3.5 ml of sterile R2A broth. The absence of growth inthese R2A tubes after 7 days of incubation at 28°C providedpresumptive evidence of pure cultures of AOB.
Actively growing cultures of AOB were identified by lightand transmission electron microscopy. Pure cultures iso-
lated from Garvey and Orange County reservoirs weregrown for 2 weeks in 250-ml Erlenmeyer flasks containingMSW medium. Cells were concentrated in a centrifuge(model B20A; International Equipment Co. [IEC], NeedhamHeights, Mass.) at 2,500 rpm for 10 min at 4°C and sus-pended in sterile phosphate buffer (pH 7.2). The cells werefixed and embedded by a modification of the proceduredescribed by Ryter and Kjellenberger (27). The bacterialsuspension was fixed in 4% glutaraldehyde containing 0.1 Mcacodylate buffer (pH 7.2) for 1 h at 4°C and then washed bycentrifugation (model B20A, IEC) three times at 2,500 rpmfor 10 min in the cacodylate buffer. The cells were fixed in1% osmium tetroxide containing the buffer of Ryter andKjellenberger (27) for 16 h at 23°C, washed three times bycentrifugation in distilled water, and prestained in 0.5%uranyl acetate for 2 h at 23°C. The bacteria were washedtwice in distilled water and suspended in a centrifuge tubewith 1% warm agar. The agar-cell suspension was dehy-drated with a graded series of ethanol solutions (30, 50, 70,95, and 100%, three times each, with 10 min at each step).Excess agar was removed at the 50% ethanol step. Theagar-cell suspension was dispensed in vials and rotatedduring infiltration with Spurr plastic embedding medium (30)at increasing gradients (30, 50, 75, and 100%, three timeseach, with 1.5 h of contact time at each gradient) mixed withethanol. The vials were placed in a desiccator under housevacuum when the plastic content reached 100%. The sam-ples were then embedded in BEEM capsules (Better Equip-ment for Electron Microscopy, Inc., New York, N.Y.) andcured at 60°C for 2 days. The samples were sectioned on anultramicrotome (Ultrotome III; LKB Instruments, Inc.,Stockholm, Sweden) and placed on grids (with 1-by-2-mmholes) with Formvar (Ted Pella, Inc., Redding, Calif.) andcarbon support. The grids were stained with 10% uranylacetate in methanol for 20 min and Reynolds (25) lead citrate(Ted Pella) for 5 min and studied with a transmissionelectron microscope (model 100C; Japan Electron OpticsLaboratory, Tokyo, Japan).
Inactivation assay. A pure culture of ammonium-oxidizingbacteria, obtained through enrichment of cultures fromGarvey Reservoir, was inoculated into 500 ml of either MSWmedium or filter-sterilized, chlorine-neutralized tap watersupplemented with 0.5 g of (NH4)2SO4 and incubated in thedark at 28°C for 3 to 5 weeks. The bacterial suspension wasfiltered through a 0.2-,um-pore-size polycarbonate mem-brane (Nuclepore Corp., Pleasanton, Calif.) to concentratethe cells and was then rinsed three times with 50 ml of sterileSM buffer to remove chlorine-demand compounds. Themembrane was placed into a sterile 50-ml centrifuge tubecontaining 10 ml of sterile SM buffer and gently vortexed toremove the attached bacteria.
Inactivation studies were conducted at 23°C in oven-baked, 600-ml glass beakers that were loosely wrapped withaluminum foil to shield the cultures from direct ambientlight. The washed AOB cells were seeded into 200 ml ofsterile, deionized-distilled potassium phosphate-bufferedwater (10 mM, pH 8.0) at an MPN of approximately 105 to107/ml before the addition of the disinfectant solution. Im-mediately before and after each inactivation experiment, thedisinfectant solutions were measured for free and totalresidual chlorine by the FAS-DPD titrimetric procedure (3).The experiments were initiated by adding 200 ml of double-strength (2.0-mg/liter), preformed chloramine or free chlo-rine to the seeded water to achieve a final disinfectantconcentration of approximately 1.0 mg/liter. All test solu-tions were continuously mixed at 100 rpm with a paddle
VOL. 56, 1990
on July 5, 2020 by guesthttp://aem
.asm.org/
Dow
nloaded from

454 WOLFE ET AL.
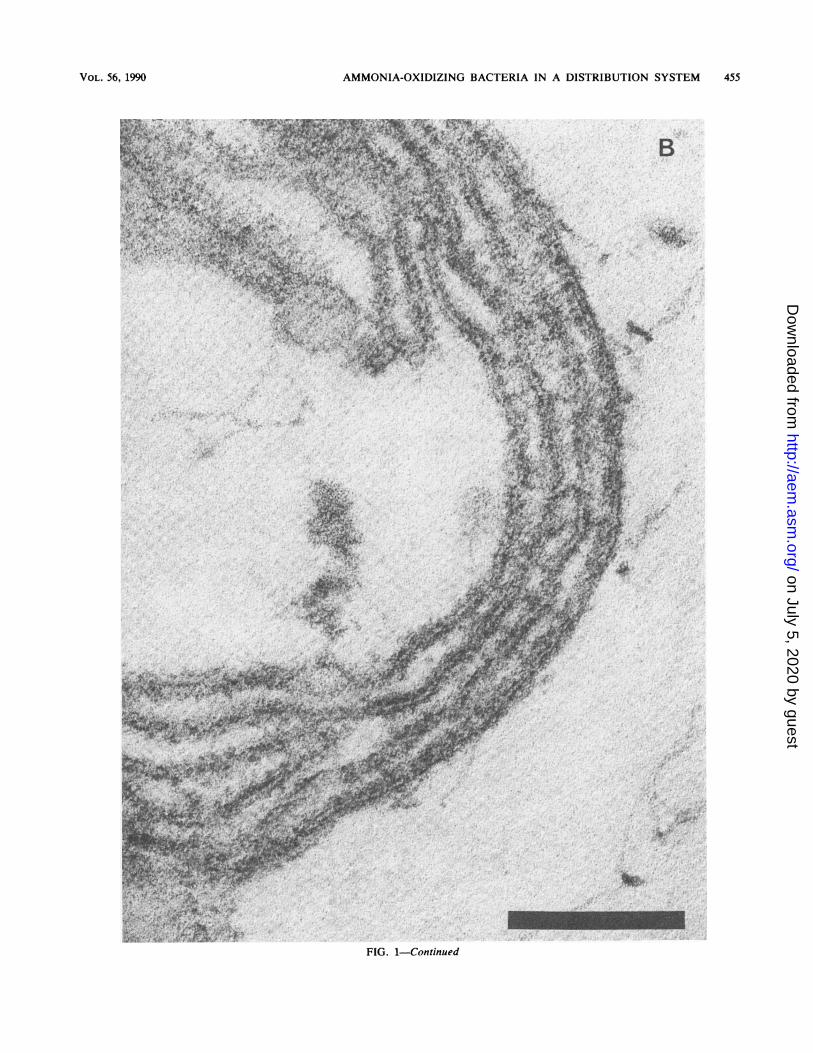
FIG. 1. (A) Transmission electron micrograph of a transverse section of an ammonia-oxidizing bacterium isolated from Garvey Reservoir.(B) Increased magnification of the electron micrograph in panel A demonstrating the presence of several layers of intracytoplasmicmembranes in the peripheral region of the cell. Bars, 0.1 p.m.
stirrer (Phipps & Bird., Inc., Richmond, Va.) during theassay. At preselected contact times, 10-ml portions wereremoved and added to sterile test tubes containing 0.10 ml of3.0% sodium thiosulfate, vortexed, and placed into the MPNtiter wells. The wells were incubated at 28°C in the dark for21 days and then tested for the presence of nitrite.
Statistical analyses. Statistical analyses were performedwith a statistical software program (RS/1, version 3.0; BBNSoftware Products Corp., Cambridge, Mass.) contained on a
minicomputer (VAX 8200; Digital Equipment Corp., Marl-boro, Mass.).
RESULTS
Identification of AOB. The AOB isolated from Garvey andOrange County reservoirs had the same morphologies andsizes. Both isolates were gram-negative, rod-shaped bacte-ria, 0.8 by 1.2 pLm in size. Although the cells appeared
APPL. ENVIRON. MICROBIOL.
on July 5, 2020 by guesthttp://aem
.asm.org/
Dow
nloaded from
AMMONIA-OXIDIZING BACTERIA IN A DISTRIBUTION SYSTEM 455~~~~~~~~~~~~~~- > X , *e- 1 8, -
FIG. 1-Continued
VOL. 56, 1990
on July 5, 2020 by guesthttp://aem
.asm.org/
Dow
nloaded from

APPL. ENVIRON. MICROBIOL.
TABLE 1. Distribution of AOB counts from monitoring sites
% Distribution of AOB counts from the following locations:
Treatment plant ReservoirsMPN/ml
Weymouth Weymouth Garvey Garvey water Garvey Orange Orange Orangeinfluent effluent influent column effluent influent County water effluent
.0.2a 9.1 48.8 37.2 39.1 27.6 66.7 27.3 18.20.2 to <5 59.1 41.5 62.8 41.3 51.1 33.3 45.5 48.55 to <20 13.6 9.8 0 10.9 17.0 0 15.2 18.220 to <50 9.1 0 0 6.5 4.3 0 9.1 12.1>50 9.1 0 0 2.2 0 0 3.0 3.0
Total no. of samples 44 41 43 46 47 26 33 33
a Detection limit.
nonmotile in a wet-mount examination, flagellar stainingrevealed the presence of a polar flagellum of approximately5 ,um in length. Cells usually occurred singly or in smallclumps. Transmission electron microscopy revealed thepresence of extensive layers of stacked intracytoplasmicmembranes in the peripheral region of the cytoplasm (Fig.lA and B). These morphologic features are indicative ofmembers of the genus Nitrosomonas.
Occurrence of AOB. AOB were detected in water samplescollected from all locations over an 18-month period (Table1), with the highest levels observed in the Weymouth plantinfluent and in the water column of the covered finished-water reservoirs. The majority of samples (greater thanapproximately 70%) at all sites contained AOB at an MPN of<5/ml. The percentages of samples containing AOB at anMPN of 25/ml in the plant influent and the water columnsites in Garvey and Orange County reservoirs were 31.8,19.6, and 27.3%, respectively. The lowest AOB counts weredetected in the plant effluent (routinely at an MPN of<20/ml) and reservoir influent sites (routinely at an MPN of<5/ml). The concentrations ofAOB in the effluents from thecovered reservoirs were comparable to those in reservoirwater column sites.The seasonal occurrence of AOB in the Weymouth plant
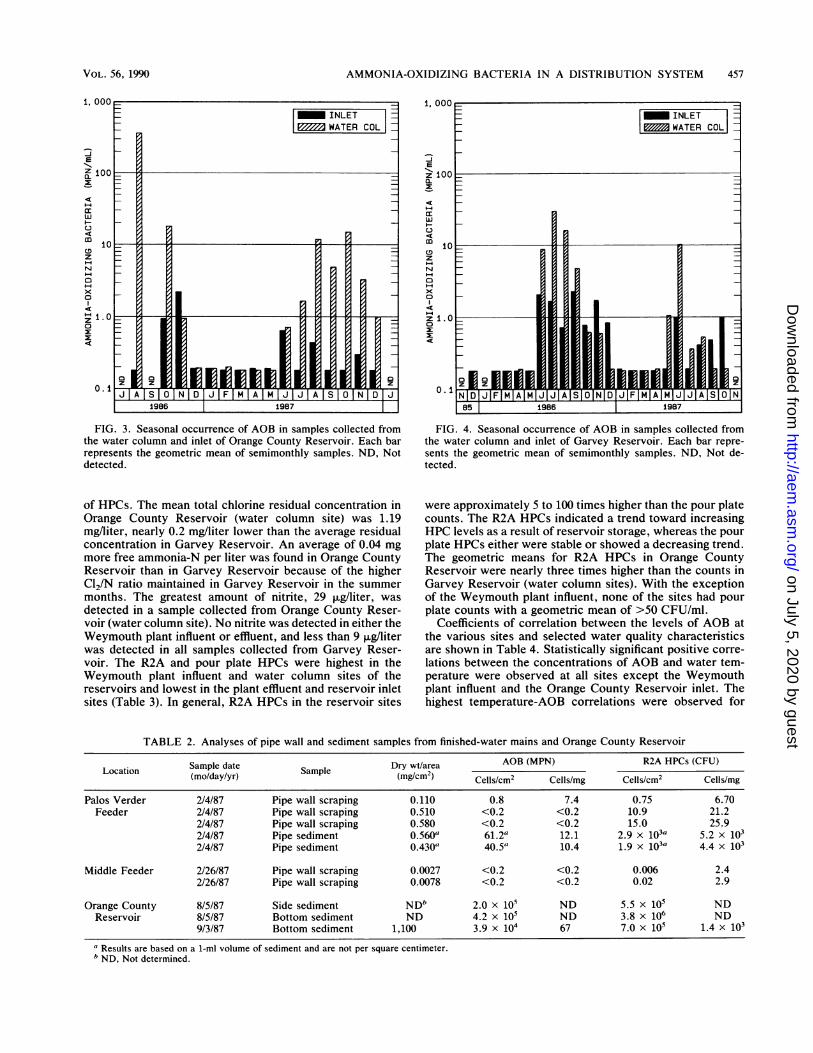
influent and effluent between December 1985 and October1987 is depicted in Fig. 2. The numbers of AOB in the plantinfluent ranged from an MPN of <0.2/ml in the wintermonths to an MPN of >70/ml in the summer months of June,July, and August. The numbers of AOB entering the distri-bution system (plant effluent samples) were generally low,with MPNs ranging from <0.2 to 15/ml. On a few occasionsin the fall of 1986 and the summer of 1987, the numbers ofAOB were higher in the plant effluent than in the influentsamples. The concentrations of AOB in the water columnsand inlet sites for both reservoirs were also highest in thesummer months and were typically below the detection limitin the winter months (Fig. 3 and 4). During the summermonths, AOB numbers in both reservoirs were approxi-mately 1 log1o unit higher than they were in the influents tothe reservoirs. The highest concentration observed was at anMPN of 380/ml in Orange County Reservoir in August 1986during a nitrification episode; the reservoir was temporarilyremoved from service and the water was chlorinated past thebreakpoint. In both reservoirs, the numbers of AOB in thewater column sites generally were higher in the summer of1986 than in the summer of 1987.Sediment samples collected from the bottom of Orange
County Reservoir (reservoir sediment) and sediment andpipe wall scrapings collected from one of two finished-water
pipelines also contained AOB. The Orange County Reser-voir sediment had a floclike consistency and a dry weight of1,100 mg/cm2 (Table 2). The concentration of AOB in thissediment sample was at an MPN of 67/mg (dry weight). Incomparison, less material was found in the finished-waterpipelines. The dry weight of the pipe wall scrapings rangedfrom 0.0027 to 0.58 mg/cm2, whereas the pipe sediment dryweights ranged from 0.43 to 0.56 mg/cm2. The AOB levelswere higher in the pipe sediment (MPNs, 10.4 to 12.1/mg)than in the pipe wall scrapings (MPNs, <0.2 to 7.4/mg). Thepipe sediment was different from the reservoir sediment inthat it had a sandlike texture. The R2A HPCs were typically1 to 2 log1o units higher than the AOB levels in all sedimentand pipe wall scraping samples (Table 2).
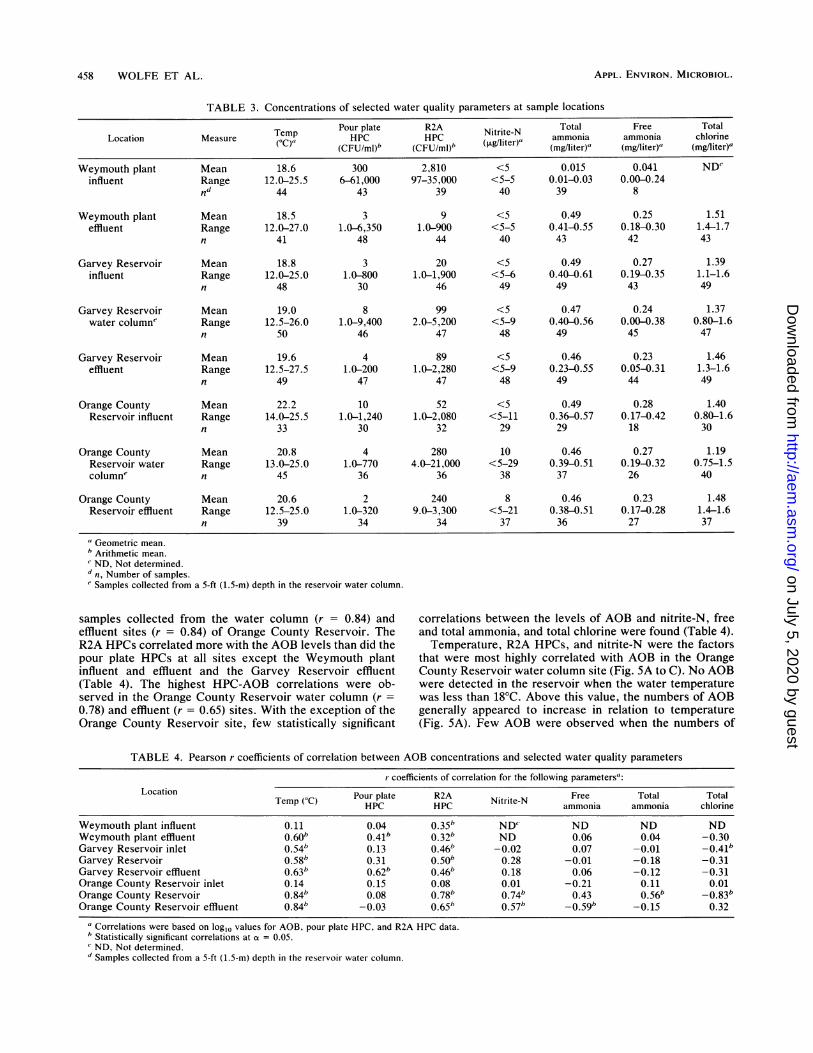
Relationship of AOB counts to selected water quality pa-rameters. The means and ranges of selected water qualityparameters are shown in Table 3. Throughout the studyperiod, there was little variability in the concentrations oftotal chlorine, free and total ammonia-N, and nitrite-Ncompared with the variability in the temperature and levels
1.
I Ia5 1986 1987
FIG. 2. Seasonal occurrence of AOB in samples collected fromWeymouth plant influent and effluent. Each bar represents thegeometric mean of semimonthly samples. ND, Not detected.
I
456 WOLFE ET AL.
on July 5, 2020 by guesthttp://aem
.asm.org/
Dow
nloaded from
AMMONIA-OXIDIZING BACTERIA IN A DISTRIBUTION SYSTEM 457
1. 000 1,_
| ~~~~~~~~INLET _WATER COL
E EZ 100 z
a:__LLI _ _F-
4 4)m io co2CD E~~~~~~~~~~~~~~~~~~~~~~~~Dz z
C ON No 0
z ~~~~~~~~~~~~z.
O.Iz z z
1986 1987
FIG. 3. Seasonal occurrence of AOB in samples collected fromthe water column and inlet of Orange County Reservoir. Each barrepresents the geometric mean of semimonthly samples. ND, Notdetected.
of HPCs. The mean total chlorine residual concentration inOrange County Reservoir (water column site) was 1.19mg/liter, nearly 0.2 mg/liter lower than the average residualconcentration in Garvey Reservoir. An average of 0.04 mgmore free ammonia-N per liter was found in Orange CountyReservoir than in Garvey Reservoir because of the higherC12/N ratio maintained in Garvey Reservoir in the summermonths. The greatest amount of nitrite, 29 ,ug/liter, wasdetected in a sample collected from Orange County Reser-voir (water column site). No nitrite was detected in either theWeymouth plant influent or effluent, and less than 9 ,ug/literwas detected in all samples collected from Garvey Reser-voir. The R2A and pour plate HPCs were highest in theWeymouth plant influent and water column sites of thereservoirs and lowest in the plant effluent and reservoir inletsites (Table 3). In general, R2A HPCs in the reservoir sites
000 ooo~~~~~hiF -_ |M WATER CO _
ioL
I4I1,
N D J IMIAIMIJIJIAISIOINID JIF|M|A|M|J|J|A|S|O1N15 1986 1987
COM 'I'll
FIG. 4. Seasonal occurrence of AOB in samples collected fromthe water column and inlet of Garvey Reservoir. Each bar repre-sents the geometric mean of semimonthly samples. ND, Not de-tected.
were approximately 5 to 100 times higher than the pour platecounts. The R2A HPCs indicated a trend toward increasingHPC levels as a result of reservoir storage, whereas the pourplate HPCs either were stable or showed a decreasing trend.The geometric means for R2A HPCs in Orange CountyReservoir were nearly three times higher than the counts inGarvey Reservoir (water column sites). With the exceptionof the Weymouth plant influent, none of the sites had pourplate counts with a geometric mean of >50 CFU/ml.
Coefficients of correlation between the levels of AOB atthe various sites and selected water quality characteristicsare shown in Table 4. Statistically significant positive corre-lations between the concentrations of AOB and water tem-perature were observed at all sites except the Weymouthplant influent and the Orange County Reservoir inlet. Thehighest temperature-AOB correlations were observed for
TABLE 2. Analyses of pipe wall and sediment samples from finished-water mains and Orange County Reservoir
Sample date Dry wt/area AOB (MPN) R2A HPCs (CFU)(mo/day/yr) (mg/cm2) Cells/cm2 Cells/mg Cells/cm2 Cells/mg
Palos Verder 2/4/87 Pipe wall scraping 0.110 0.8 7.4 0.75 6.70Feeder 2/4/87 Pipe wall scraping 0.510 <0.2 <0.2 10.9 21.2
2/4/87 Pipe wall scraping 0.580 <0.2 <0.2 15.0 25.92/4/87 Pipe sediment 0.560a 61.2a 12.1 2.9 x i03a 5.2 x 1032/4/87 Pipe sediment 0.430a 40.Sa 10.4 1.9 x 10³a 4.4 x 10³
Middle Feeder 2/26/87 Pipe wall scraping 0.0027 <0.2 <0.2 0.006 2.42/26/87 Pipe wall scraping 0.0078 <0.2 <0.2 0.02 2.9
Orange County 8/5/87 Side sediment NDb 2.0 x 10⁵ ND 5.5 x 10⁵ NDReservoir 8/5/87 Bottom sediment ND 4.2 x 10⁵ ND 3.8 x 10⁶ ND
9/3/87 Bottom sediment 1,100 3.9 x 10⁴ 67 7.0 x 10⁵ 1.4 x 10³
aResults are based on a 1-ml volume of sediment and are not per square centimeter.b ND, Not determined.
n _r_ _r__ [_II Il
VOL. 56, 1990
.Am
on July 5, 2020 by guesthttp://aem
.asm.org/
Dow
nloaded from
APPL. ENVIRON. MICROBIOL.
TABLE 3. Concentrations of selected water quality parameters at sample locations
Location Measure T(oemp HPC HC2A Nitrite-N Total Free TotalLocation easure 0c('C) HP(brPiIb4g/liter)" ammonia ammonia chlorine(CFU/ml)b (CFU/ml)" (mg/liter)a (mg/liter)a (mg/liter)a
Weymouth plant Mean 18.6 300 2,810 <5 0.015 0.041 NDCinfluent Range 12.0-25.5 6-61,000 97-35,000 <5-5 0.01-0.03 0.00-0.24
nd 44 43 39 40 39 8
Weymouth plant Mean 18.5 3 9 <5 0.49 0.25 1.51effluent Range 12.0-27.0 1.0-6,350 1.0-900 <5-5 0.41-0.55 0.18-0.30 1.4-1.7
n 41 48 44 40 43 42 43
Garvey Reservoir Mean 18.8 3 20 <5 0.49 0.27 1.39influent Range 12.0-25.0 1.0-800 1.0-1,900 <5-6 0.40-0.61 0.19-0.35 1.1-1.6
n 48 30 46 49 49 43 49
Garvey Reservoir Mean 19.0 8 99 <5 0.47 0.24 1.37water columne Range 12.5-26.0 1.0-9,400 2.0-5,200 <5-9 0.40-0.56 0.00-0.38 0.80-1.6
n 50 46 47 48 49 45 47
Garvey Reservoir Mean 19.6 4 89 <5 0.46 0.23 1.46effluent Range 12.5-27.5 1.0-200 1.0-2,280 <5-9 0.23-0.55 0.05-0.31 1.3-1.6
n 49 47 47 48 49 44 49
Orange County Mean 22.2 10 52 <5 0.49 0.28 1.40Reservoir influent Range 14.0-25.5 1.0-1,240 1.0-2,080 <5-11 0.36-0.57 0.17-0.42 0.80-1.6
n 33 30 32 29 29 18 30
Orange County Mean 20.8 4 280 10 0.46 0.27 1.19Reservoir water Range 13.0-25.0 1.0-770 4.0-21,000 <5-29 0.39-0.51 0.19-0.32 0.75-1.5columne n 45 36 36 38 37 26 40
Orange County Mean 20.6 2 240 8 0.46 0.23 1.48Reservoir effluent Range 12.5-25.0 1.0-320 9.0-3,300 <5-21 0.38-0.51 0.17-0.28 1.4-1.6
n 39 34 34 37 36 27 37
"Geometric mean.bArithmetic mean.c ND, Not determined.d n, Number of samples.e Samples collected from a 5-ft (1.5-m) depth in the reservoir water column.
samples collected from the water column (r = 0.84) and correlations between the levels of AOB and nitrite-N, freeeffluent sites (r = 0.84) of Orange County Reservoir. The and total ammonia, and total chlorine were found (Table 4).R2A HPCs correlated more with the AOB levels than did the Temperature, R2A HPCs, and nitrite-N were the factorspour plate HPCs at all sites except the Weymouth plant that were most highly correlated with AOB in the Orangeinfluent and effluent and the Garvey Reservoir effluent County Reservoir water column site (Fig. 5A to C). No AOB(Table 4). The highest HPC-AOB correlations were ob- were detected in the reservoir when the water temperatureserved in the Orange County Reservoir water column (r = was less than 18°C. Above this value, the numbers of AOB0.78) and effluent (r = 0.65) sites. With the exception of the generally appeared to increase in relation to temperatureOrange County Reservoir site, few statistically significant (Fig. 5A). Few AOB were observed when the numbers of
TABLE 4. Pearson r coefficients of correlation between AOB concentrations and selected water quality parameters
r coefficients of correlation for the following parameters':Location Pour plate R2A Free Total Total
Temp ('C) HPC HPC Nitrite-N ammonia ammonia chlorine
Weymouth plant influent 0.11 0.04 0.35b NDC ND ND NDWeymouth plant effluent 0.60b 0.41b 0.32b ND 0.06 0.04 -0.30Garvey Reservoir inlet 0.54b 0.13 0.46b -0.02 0.07 -0.01 -0.41bGarvey Reservoir 0.58b 0.31 0.50b 0.28 -0.01 -0.18 -0.31Garvey Reservoir effluent 0.63b 0.62" 0.46b 0.18 0.06 -0.12 -0.31Orange County Reservoir inlet 0.14 0.15 0.08 0.01 -0.21 0.11 0.01Orange County Reservoir 0.84" 0.08 0.78b 0.74b 0.43 0.56b -0.83bOrange County Reservoir effluent 0.84b -0.03 0.65b 0.57b _o.59b -0.15 0.32
a Correlations were based on log1o values for AOB, pour plate HPC, and R2A HPC data.b Statistically significant correlations at cx = 0.05.' ND, Not determined.d Samples collected from a 5-ft (1.5-m) depth in the reservoir water column.
458 WOLFE ET AL.
on July 5, 2020 by guesthttp://aem
.asm.org/
Dow
nloaded from

AMMONIA-OXIDIZING BACTERIA IN A DISTRIBUTION SYSTEM 459
1. 000
A
Z 100
wSo
H
IC10_CDz
0~~~~~~~~~~~~~
~1.C00
Z S.O*@0
12 13 14 15 16 17 18 19 20 21 22 23 24 25 26TEMPERATURE (°C)
1.000C
E
Z 100 _ _
m 10 * *
CD
z
OC
a-I"I.4
wH
N 0-
0.02 0.04 0.06 0.08 0.10 0.12NITRITE-NITROGEN (mg/L)
R2A HPCs were less than approximately 350 CFU/ml.Above this level, the number of AOB also increased linearlyin relation to HPC increments (Fig. SB). In general, thelevels of R2A HPCs in Orange County Reservoir were 100times higher than the AOB levels. A threshold relationshipexisted between AOB and nitrite-N levels in Orange CountyReservoir samples (water column site), whereby nitritelevels generally remained below 0.01 mg/liter until the de-tected numbers of AOB exceeded an MPN of approximately10/ml (Fig. 5C).
Similar threshold relationships between AOB and temper-ature and between AOB and HPCs were also observed inGarvey Reservoir (Fig. 6A and B). However, no relationshipappeared to exist between AOB and nitrite in GarveyReservoir, as AOB concentrations ranged from MPNs of<0.2 to 200/ml at nitrite concentrations of 0.005 mg/liter(Fig. 6C).
1uu'-B
0
Z100~~~~~~~~~~
* i 10 100 1000 10, 000 100, 000mP
S
Z4W
ci
4 0~0
mICAHTEOT-HI0----OUT(CU/L
FIG. 5. Relationship between the numbers of AOB in OrangeCounty Reservoir and temperature (A), HPC bacteria (B), andnitrite-N (C).
Inactivation of AOB. The results of disinfection experi-ments with AOB isolated from Garvey Reservoir indicatedthat resistance to chloramines, but not to free chlorine, wasgreatly dependent on antecedent growth conditions. AOBgrown in chlorine-neutralized tap water and exposed to 1.0mg of monochloramine per liter (pH 8.2, 23°C) were approx-imately 11 times more resistant (99% inactivation in 33 min)than AOB grown in MSW medium (99% inactivation in 3min) (Fig. 7A and B). Regardless of culture conditions, 99%oof the cells were inactivated within 2 to 3 min of exposure to1.0 mg of free chlorine per liter (pH 8.2, 23°C) (Fig. 7A andB).
DISCUSSION
The lack of information on nitrifying bacteria in drinkingwater is not a result of the rarity of nitrification in distribu-tion systems; it can be attributed, in part, to cumbersomeenumeration and identification methods. Although the MPNtechnique is the most commonly used procedure for quanti-fying AOB, membrane filtration (15) and immunofluores-cence techniques have been used on a limited basis (6). TheMPN technique requires varied incubation times, rangingfrom 20 to 55 days, depending on the recovery medium thatis used and the temperature of incubation. In addition, thebacteria must be incubated in the dark, as sunlight-or evenambient fluorescent light-inhibits the growth of these bac-teria (2). This study used MSW medium, with incubation for3 weeks at 28°C, as these conditions have been found toproduce the most rapid growth ofAOB (4, 22). The recoveryefficiency of this technique has been reported to range from0.1 to 5% (5). Therefore, concentrations of AOB presentedin this and other studies that use the MPN procedure shouldbe evaluated on a relative rather than an absolute scale.
Biochemical and microscopic analyses of cultures isolatedfrom the reservoirs indicated that these bacteria had mor-phologic features characteristic of the genus Nitrosomonas.Members of this genus typically have ellipsoidal or rod-
VOL. 56, 1990
I
- A 0
on July 5, 2020 by guesthttp://aem
.asm.org/
Dow
nloaded from

460 WOLFE ET AL. APPL. ENVIRON. MICROBIOL.
1, _ A _
E
Z 10a-,
_ _0
N
10II 0~~~~~~~
40~~~~~~~~~~~
0.112 13 14 15 16 17 18 19 20 21 22 23 24 25 26
TEMPERATURE (°C)
1, 000 _C
E
Z 100
a-I
m 10
10z
S.L
0II
n I1V..0 0.005 0.010 0.015 0.020 0.025 0.030
NITRITE-NITROGEN (mg/Ll
shaped cells with rounded or pointed ends. Most strains aremotile, with polar flagella, and possess stacked intracyto-plasmic membranes in the peripheral region of the cytoplasm(8, 34). Nitrosomonas spp. are commonly found in soil andaquatic environments. However, the media and incubationconditions used in this study may have been selective for therecovery of Nitrosomonas spp. and no other AOB (7).
Results of the monitoring program indicated that althoughconventional water treatment processes generally reducedthe numbers of AOB, some organisms were able to surviveand enter the distribution system. On occasion, the numbersin the filter effluent were higher than those in the sourcewater, suggesting that favorable growth conditions periodi-cally existed in the treatment plant. The numbers ofAOB inthe reservoirs were generally much higher in the watercolumn than in the influent and approximately 100 to 1,000times higher in the summer than in the winter months,
1000
E
Z 100a-
a:
ILw
C-)4m 10
z
N
0
X
0I
TZ4
A 4 LSE4
11111
=B
S S
0 0= 0~~~~~~~~~
0
S
n~~ ~~~ 111_ LW
10 100 1000 10. 000 100. 000m-R2A HETEROTROPHIC PLATE COUNT (CFU/mL)
FIG. 6. Relationship between the numbers of AOB in GarveyReservoir and temperature (A), HPC bacteria (B), and nitrite-N (C).
indicating that these organisms were not only able to survivein the presence of 1.2 to 1.5 mg of monochloramine residualper liter but were also capable of growing in the presence ofthese disinfectant levels.The elevated levels of AOB in the reservoirs undoubtedly
resulted from favorable growth conditions in this environ-ment. These bacteria grow best under conditions of mildalkalinity (pH values of 7.5 to 8.5), warm water temperatures(25 to 28°C), darkness, extended detention times, and thepresence of free ammonia (34). At times, all of these condi-tions occur in Garvey and Orange County reservoirs. Theresults of this study suggested that the most significant factorfor the proliferation of AOB was temperature. AOB weredetected only when the water temperature was above 16 to18°C. Similar temperature thresholds have been observed forother aquatic bacteria, including Legionella spp. (11). An-other important factor that may have contributed to thesurvival of AOB in the distribution system and reservoirswas their presence in the sediment and biofilm material.These environments typically contain higher numbers ofAOB, presumably because of the larger amounts of essentialnutrients there (13), and provide protection from disinfec-tion.Although it was not examined in this study, another factor
contributing to the proliferation of AOB in the reservoirs isretention time (36). Because AOB grow relatively slowly, anincrease in the reservoir retention time would allow theorganisms to proliferate, especially in the warm summermonths. However, it is difficult to quantify the effect ofdetention time on the growth ofAOB in a distribution systembecause detention time fluctuates dramatically in relation todownstream water demands and operational conditions.Moreover, reservoir volume and circulation efficiency mayalso influence AOB growth patterns.
In general, AOB concentrations correlated poorly withlevels of nitrite, ammonia, and chlorine at all locationsexcept Orange County Reservoir. This was presumablybecause of the small amount of variability in the concentra-
. V S -1 11111 1111
S
a
I. 0I i
A
1111
on July 5, 2020 by guesthttp://aem
.asm.org/
Dow
nloaded from

AMMONIA-OXIDIZING BACTERIA IN A DISTRIBUTION SYSTEM 461
>
UAC-
zw
ccw
a.
0.01
CONTACT TIME (min)FIG. 7. Inactivation of a strain of AOB isolated from Garvey
Reservoir. Cells were cultured in MSW medium (A) and tap watersupplemented with ammonium sulfate (B); they were then exposedto 1.0 mg of monochloramine or free chlorine per liter at 23°C andpH 8.2.
tions of these compounds throughout the sampling period.The correlations are likely to be higher during severe nitri-fication episodes, when there is a wide range of nitrite andAOB levels. At Garvey Reservoir, AOB were recoveredeven when the concentration of nitrite was below detectablelevels. This suggests that the measurement for AOB is a
more sensitive indicator of nitrification than nitrite analysisand that the nitrite had already been converted to nitrate.The AOB levels correlated highly with the R2A HPCs in one
of the reservoirs, suggesting that these heterotrophs may begood indicators of nitrifiers in some chloraminated systems.A surrogate measurement would be useful because of thelengthy incubations for enumerating these bacteria.The results of disinfection experiments with AOB isolated
from Garvey Reservoir indicated that these bacteria wereconsiderably more resistant to chloramines than to freechlorine, but this was dependent on antecedent growthconditions. Cells that were grown in the chlorine-neutralizedtap water were approximately 11 times more resistant tomonochloramine than were cells grown in MSW medium.This increase in the disinfection resistance of bacteria grownin tap water has been shown for a number of bacteria (10, 19,37) and may be a result of biochemical changes in the cellularenvelope that prevent penetration by the disinfectant. Theresistance of these bacteria to chloramines was not appre-ciably greater than that reported for a number of otherbacteria, including Escherichia coli (33, 38). Consequently,the levels of chloramines typically used for potable waterdisinfection (1.0 to 2.0 mg/liter) should be sufficient toeliminate these organisms. However, the fact that AOB werefound to proliferate in the chloraminated reservoirs suggeststhat the experimental protocol used to evaluate the disinfec-tion resistance of AOB in our study may not have accuratelyreflected disinfection in the reservoirs.
Also, the AOB cells were well mixed prior to exposure tothe disinfectants in our study. This exposure condition maynot have accounted for in situ resistance mechanisms result-ing from the association of the bacteria within the sedimentmatrix of the reservoirs and pipelines. Additional studiesinvestigating the nature and sources of the sediment materialand its role in providing resistance to disinfection are neededto determine effective chloramine concentrations. In con-trast to the results described here, earlier work by Feben (14)showed that a strain of AOB isolated from tap water andgrown on synthetic medium was 60 times more resistant thanE. coli to free chlorine. However, the Feben study (14) didnot measure the final chlorine residuals or wash the cells toremove nitrite and other chlorine demand compo4nds.Another measure for controlling the growth of AOB would
be to reduce the amount of free ammonia in chloraminatedwaters. This could be achieved by increasing the Cl2/N ratio.The Metropolitan Water District of Southern Californiamaintains a 3:1 ratio in the distribution system. At a 1.5-mg/liter total chlorine concentration, this ratio results inapproximately 0.2 mg of free ammonia per liter. The freeammonia could be completely eliminated by increasing theratio to 5:1. The higher C12/N ratio maintained in GarveyReservoir during the summer of 1987 may have accountedfor the fact that the AOB level in the reservoir was lower in1987 than in 1986. Further experiments in which the C12/Nratio is adjusted should be performed to determine theeffects of free ammonia on the growth of AOB.
In summary, the results of this study indicate that AOBoccur throughout the chloraminated distribution system,with the highest levels detected in the covered reservoirsduring the warm summer months. The persistence andgrowth of these bacteria in the reservoirs may result fromtheir association with sediment material in the reservoirs andbiofilms in the distribution pipelines. These results suggestthat chloraminated systems with nitrification problems mayhave to increase their residuals substantially above 1.5mg/liter to control nitrifier growth. Alternatively, utilitiesmay be able to control the development of AOB populationsby increasing the C12/N ratio to reduce the amount of freeammonia-N. Temperature appears to be an important vari-
VOL. 56, 1990
on July 5, 2020 by guesthttp://aem
.asm.org/
Dow
nloaded from

APPL. ENVIRON. MICROBIOL.
able for the growth of AOB in the reservoirs. The study alsosuggests that HPCs can be useful as indicators of thepresence of AOB. The current enumeration techniques forAOB are lengthy and cumbersome and have a low recoveryefficiency; an improved enumeration method is needed.
ACKNOWLEDGMENTS
The technical assistance of Dennis J. Otsuka, Robert M. Jones,Allan E. Preston, David J. Crocker, Randy D. Whitney, and SylviaE. Barrett is gratefully acknowledged. We thank Mic H. Stewart andPeggy Kimball for reviewing and editing the manuscript and RobertLa Londe for excellent graphics services.
LITERATURE CITED1. Alexander, M., and F. E. Clark. 1965. Nitrifying bacteria, p.
1027-1042. In C. A. Black (ed.), Methods of soil analysis.American Society of Agronomy, Madison, Wis.
2. Alleman, J. E., V. Keromida, and L. Pontea-Kiser. 1987. Light-induced Nitrosomonas inhibition. Water Res. 21:499-501.
3. American Public Health Association. 1985. Standard methods forthe examination of water and wastewater, 16th ed. AmericanPublic Health Association, Washington, D.C.
4. Belser, L. W. 1979. Population ecology of nitrifying bacteria.Annu. Rev. Microbiol. 33:309-333.
5. Belser, L. W., and E. L. Mays. 1982. Use of nitrifier activitymeasurements to estimate the efficiency of viable nitrifier countsin soils and sediments. Appl. Environ. Microbiol. 43:945-948.
6. Belser, L. W., and E. L. Schmidt. 1978. Diversity in theammonia-oxidizing nitrifier population of a soil. Appl. Environ.Microbiol. 36:584-588.
7. Belser, L. W., and E. L. Schmidt. 1978. Serological diversitywithin a terrestrial ammonia-oxidizing population. Appl. Envi-ron. Microbiol. 33:589-593.
8. Bock, E., H. P. Koops, and H. Harms. 1986. Cell biology ofnitrifying bacteria, p. 17-38. In J. I. Prosser (ed.), Nitrification.IRL Press, Washington, D.C.
9. Burlingame, G. A., and G. L. Brock. 1985. Water qualitydeterioration in treated-water storage tanks, p. 351-370. Pro-ceedings of the American Water Works Association AnnualConference. American Water Works Association, Denver.
10. Carson, L. A., M. S. Farera, W. W. Bond, and N. J. Peterson.1972. Factors affecting comparative resistance of naturallyoccurring and subcultured Pseudomonas aeruginosa to disin-fectants. Appl. Microbiol. 23:863-867.
11. Colbourne, J. S., and R. M. Trew. 1988. Presence of Legionellain London's water supplies. Isr. J. Med. Sci. 22:633-638.
12. Crooks, J. K., V. L. Snoeyink, M. D. Curry, and M. L.Reynolds. 1986. Technical note: biological removal of ammoniaat Roxana, Illinois. J. Am. Water Works Assoc. 78(5):94-95.
13. Curtis, E. J. C., K. Durrant, and M. M. I. Harmon. 1975.Nitrification in rivers in the Trent Basin. Water Res. 9:255-268.
14. Feben, D. 1935. Nitrifying bacteria in water supplies. J. Am.Water Works Assoc. 27:439-447.
15. Finstein, M. S., and M. R. Bitzky. 1972. Relationships ofautotrophic ammonia-oxidizing bacteria to marine salts. WaterRes. 6:31-30.
16. Goodall, J. B. 1979. Biological removal of ammonia, p. 586-596.In H. Sontheimer and W. Kuhn (ed.), Oxidation techniques indrinking water treatment. Report EPA 57/19-79-020. U.S. En-vironmental Protection Agency, Cincinnati, Ohio.
17. Hill, J. C. 1946. Bacterial oxidation of ammonia in circulatingwater. J. Am. Water Works Assoc. 38:980-982.
18. Hulbert, R. 1933. Ammonia-chlorine treatment yields nitrite ineffluent. Eng. News-Record 111:315-318.
19. Kutcha, J. M., S. J. Stotes, J. E. McGlaughlin, J. H. Overmeyer,
R. M. Wadowsky, A. M. McNamara, R. S. Wolford, and R. B.Yee. 1983. Enhanced chlorine resistance of tapwater-adaptedLegionella pneumophila as compared with agar-medium-pas-saged strains. Appl. Environ. Microbiol. 50:21-26.
20. Larson, T. E. 1939. Bacteria, corrosion and red water. J. Am.Water Works Assoc. 31:1186-1196.
21. Larson, T. E. 1966. Deterioration of water quality in distributionsystems. J. Am. Water Works Assoc. 58:1307-1316.
22. Matulewich, V. A., P. F. Strom, and M. S. Finstein. 1975.Length of incubation for enumerating nitrifying bacteria presentin various environments. Appl. Microbiol. 29:265-268.
23. McFadden, J. F. 1980. Biochemical tests for the identification ofmedical bacteria, 2nd ed. The Williams & Wilkins Co., Balti-more, Md.
24. National Research Council. 1982. Drinking water and health, vol.4. National Academy Press, Washington, D.C.
25. Reynolds, E. S. 1963. The use of lead citrate at high pH as anelectron-opaque stain in electron microscopy. J. Cell Biol.17:208-212.
26. Rittman, B. E., and V. L. Snoeyink. 1984. Achieving biologicallystable drinking water. J. Am. Water Works Assoc. 76(10):106-114.
27. Ryter, A., and E. Kjellenberger. 1958. Etude au microscopeelectronique de plasmas contenant de l'acide desoxyribonu-cleic. Z. Naturforsch. 13:597.
28. Singer, P. C. 1986. THM control using alternative oxidant anddisinfectant strategies: an evaluation, p. 999-1017. Proceedingsof the American Water Works Association Annual Conference.American Water Works Association, Denver.
29. Soriano, S., and N. Walker. 1968. Isolation of ammonia-oxi-dizing autotrotrophic bacteria. J. Appl. Bacteriol. 31:493-497.
30. Spurr, A. R. 1969. A low-viscosity epoxy resin embeddingmedium for electron microscopy. J. Ultrastruct. Res. 26:31-43.
31. Tuovinen, 0. H., K. S. Button, A. Vuorinen, L. Carlson, D. M.Mair, and L. A. Yut. 1980. Bacterial, chemical, and mineralog-ical characteristics of tubercles in distribution pipelines. J. Am.Water Works Assoc. 72:626-635.
32. Valentine, R. L. 1985. Disappearance of monochloramine in thepresence of nitrite, p. 975-984. In R. L. Jolley, R. J. Bull, W. P.Davis, S. Katz, M. H. Roberts, and V. A. Jacobs (ed.), Waterchlorination: chemistry, environmental impact and health ef-fects, vol. 5. Lewis Publishers, Inc., Chelsea, Mich.
33. Ward, N. R., R. L. Wolfe, and B. H. Olson. 1984. Effect of pH,application technique, and chlorine-to-nitrogen ratio on disin-fectant activity of inorganic chloramines with pure culturebacteria. Appl. Environ. Microbiol. 48:508-514.
34. Watson, S. W., F. W. Valois, and J. B. Waterbury. 1981. Thefamily Nitrobacteraceae, p. 1005-1022. In M. P. Starr, H. Stolp,H. G. Truper, A. Balows, and H. G. Schlegel (ed.), Theprokaryotes. Springer-Verlag, Berlin.
35. White, G. C. 1986. Handbook of chlorination. Van NostrandReinhold Co., New York.
36. Wolfe, R. L., E. G. Means III, M. K. Davis, and S. E. Barrett.1988. Biological nitrification in covered reservoirs containingchloraminated water. J. Am. Water Works Assoc. 80(9):109-114.
37. Wolfe, R. L., and B. H. Olson. 1985. Inability of laboratorymodels to accurately predict field performance of disinfectants,p. 555-573. In R. L. Jolley, R. J. Bull, W. P. Davis, S. Katz,M. H. Roberts, and V. A. Jacobs (ed.), Water chlorination:environmental impact and health effects, vol. 5. Lewis Publish-ers, Inc., Chelsea, Mich.
38. Wolfe, R. L., N. R. Ward, and B. H. Olson. 1984. Inorganicchloramines as drinking water disinfectants: a review. J. Am.Water Works Assoc. 76(5):74-88.
462 WOLFE ET AL.
on July 5, 2020 by guesthttp://aem
.asm.org/
Dow
nloaded from