Embed Size (px)
Citation preview
Lecture 1aIntroduction to Protein Structures -
Molecular Graphics Tool
Ubiquitin BPTI
amino acid tyrosine
LH2
energetics
enzymatic controltraficking
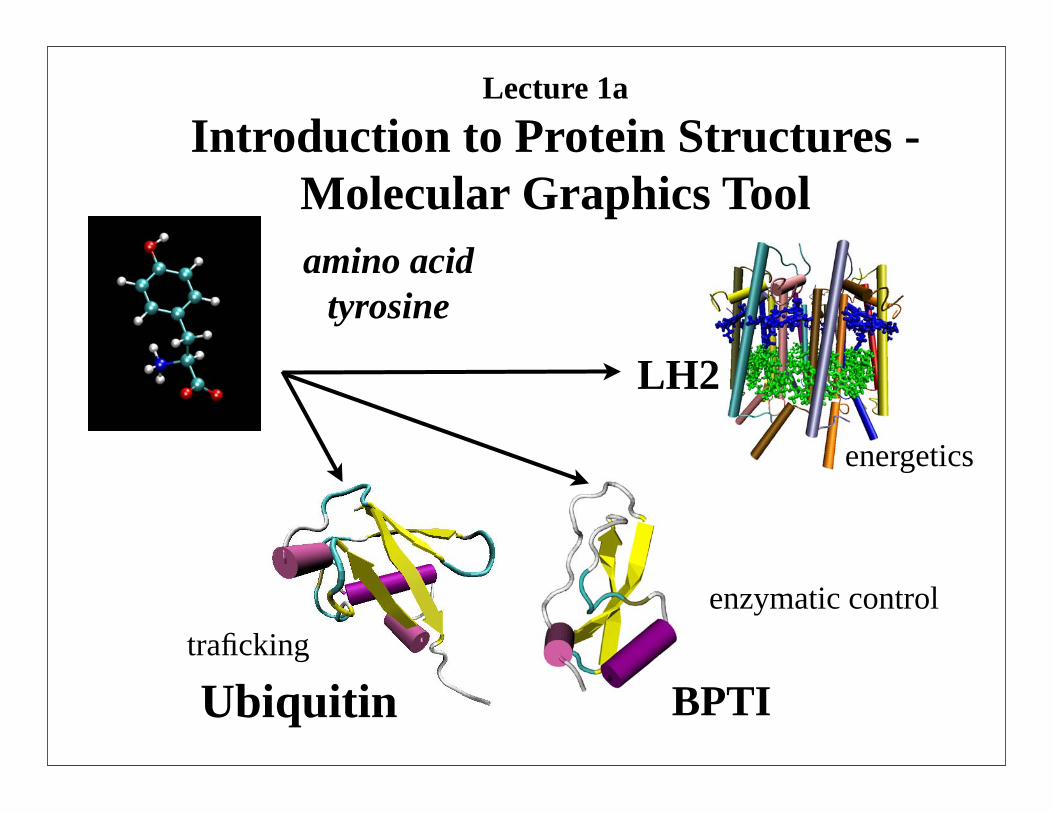
• > 120,000 registered users• Platforms:
– Unix / Linux– Windows– MacOS X
• Display of large biomolecules and simulation trajectories
• Sequence browsing and structure highlighting
• Multiple sequence - structure analysis
• User-extensible scripting interfaces for analysis and customization
Highlights of the VMD Molecular Graphics Program
The program is used today more for preparation and analysis of modeling than for graphics
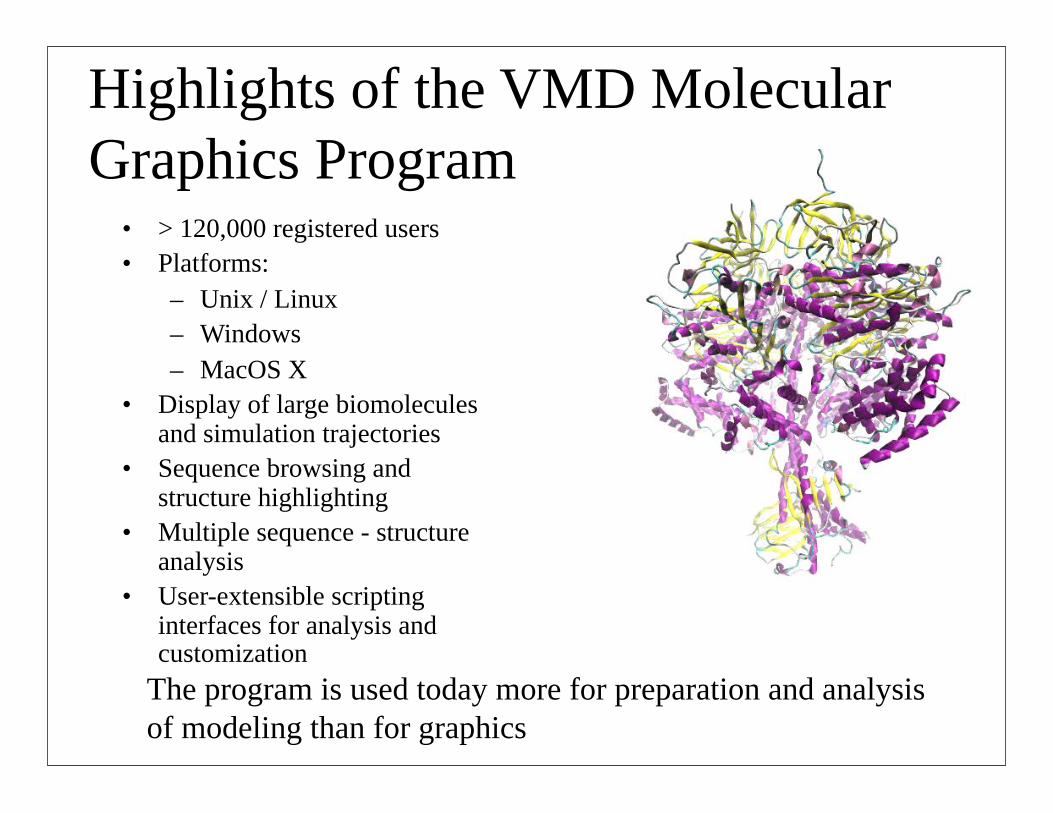
VMD
Volumetric Data:Density maps,
Electron orbitals,Electrostatic potential,
Time-averaged occupancy, …
Atomic Data:Coordinates,Trajectories,
Energies, Forces, …
Sequence Data:Multiple Alignments,Phylogenetic Trees
Annotations
VMD – A Tool to Think23,000 Users
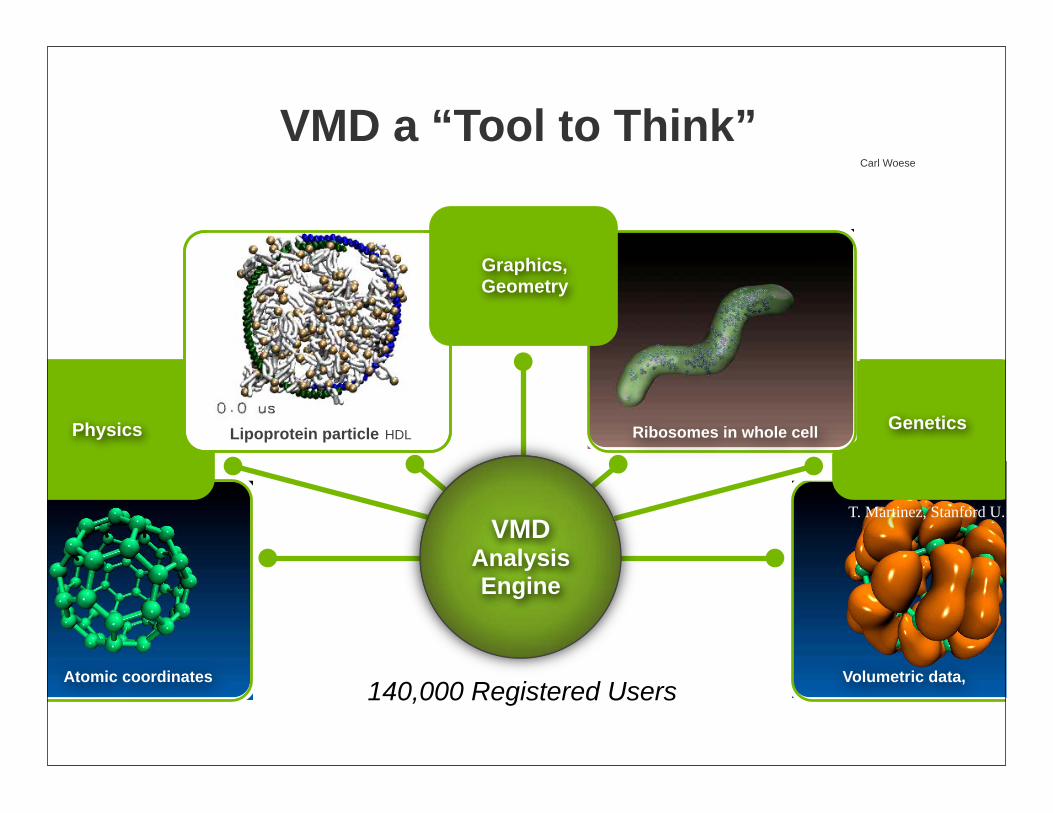
VMD a “Tool to Think”
140,000 Registered UsersAtomic coordinates Volumetric data,
C60 electrons
T. Martinez, Stanford U.
Carl Woese
Lipoprotein particle HDLPhysics
Graphics,Geometry
Ribosomes in whole cell Genetics
VMDAnalysisEngine
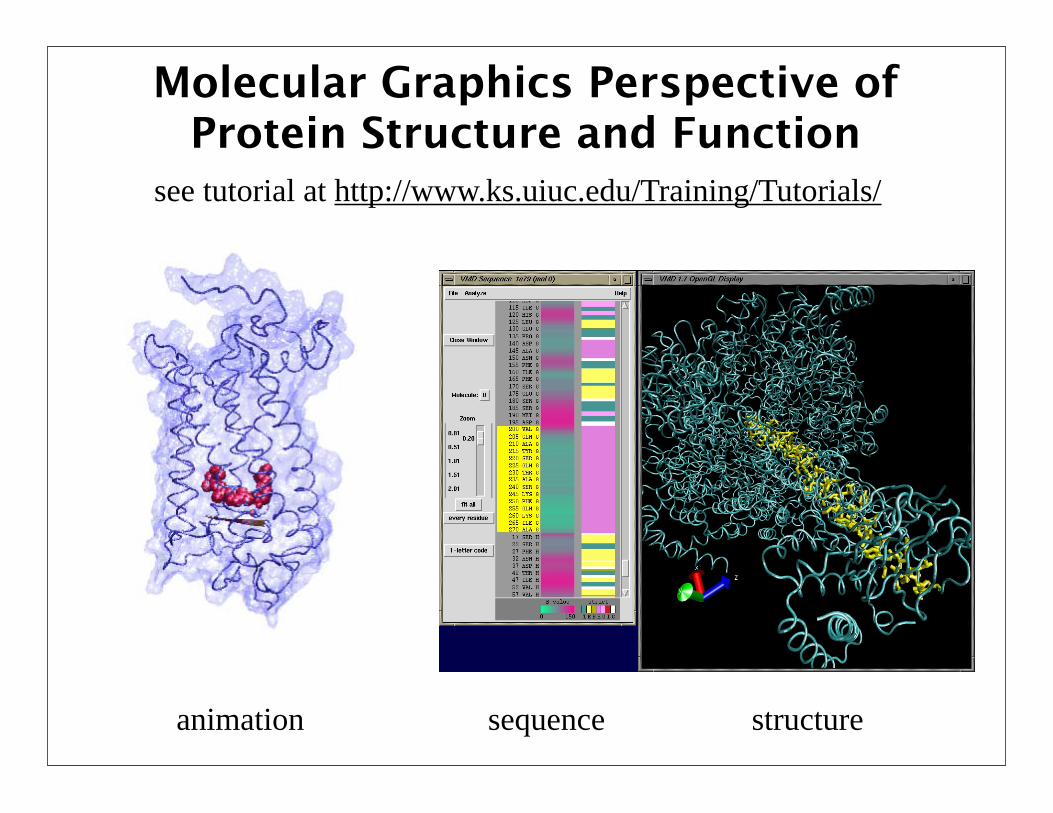
Molecular Graphics Perspective of Protein Structure and Function
structuresequenceanimation
see tutorial at http://www.ks.uiuc.edu/Training/Tutorials/
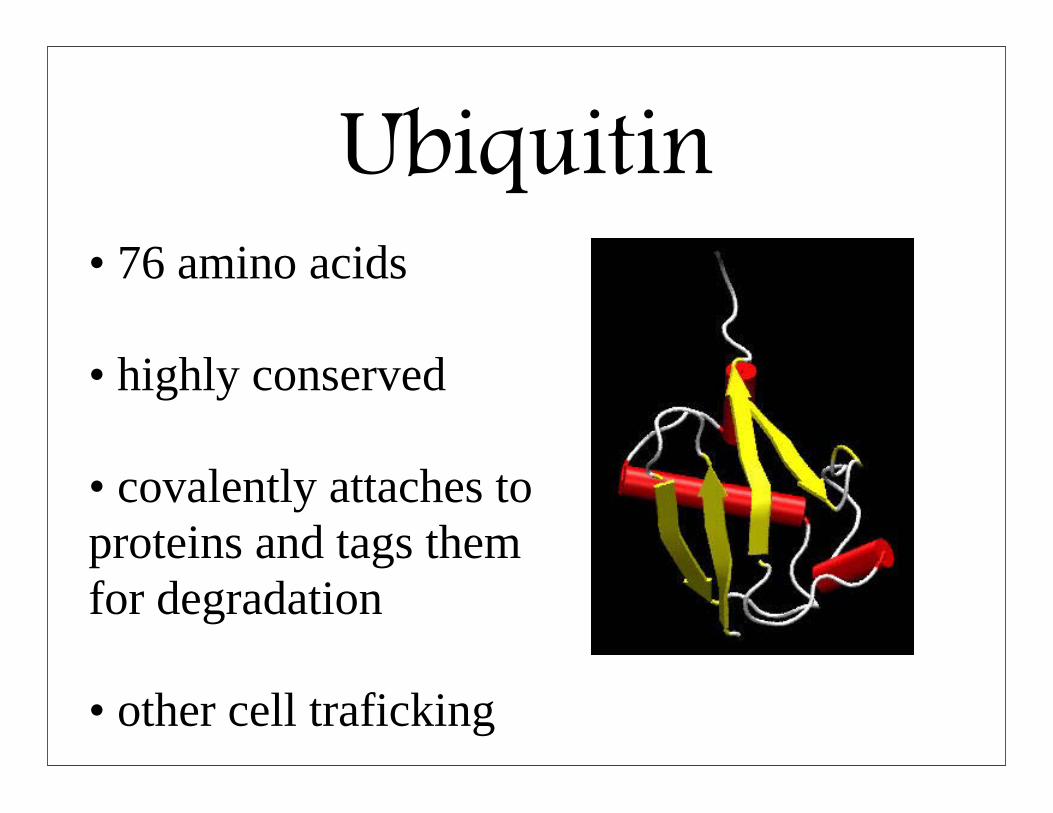
Ubiquitin• 76 amino acids
• highly conserved
• covalently attaches to proteins and tags them for degradation
• other cell traficking
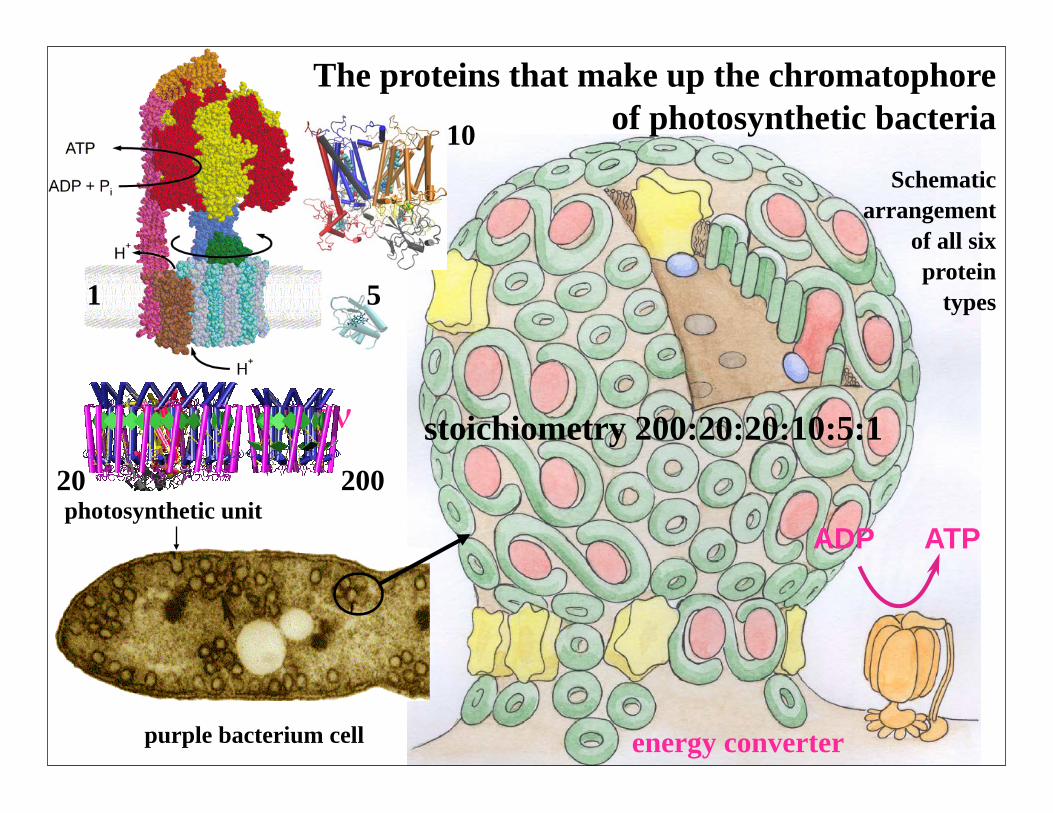
hν
ADP ATP
purple bacterium cell
photosynthetic unit
energy converter
Schematic arrangement
of all six protein
types
The proteins that make up the chromatophore of photosynthetic bacteria
20020
1
10
5
stoichiometry 200:20:20:10:5:1
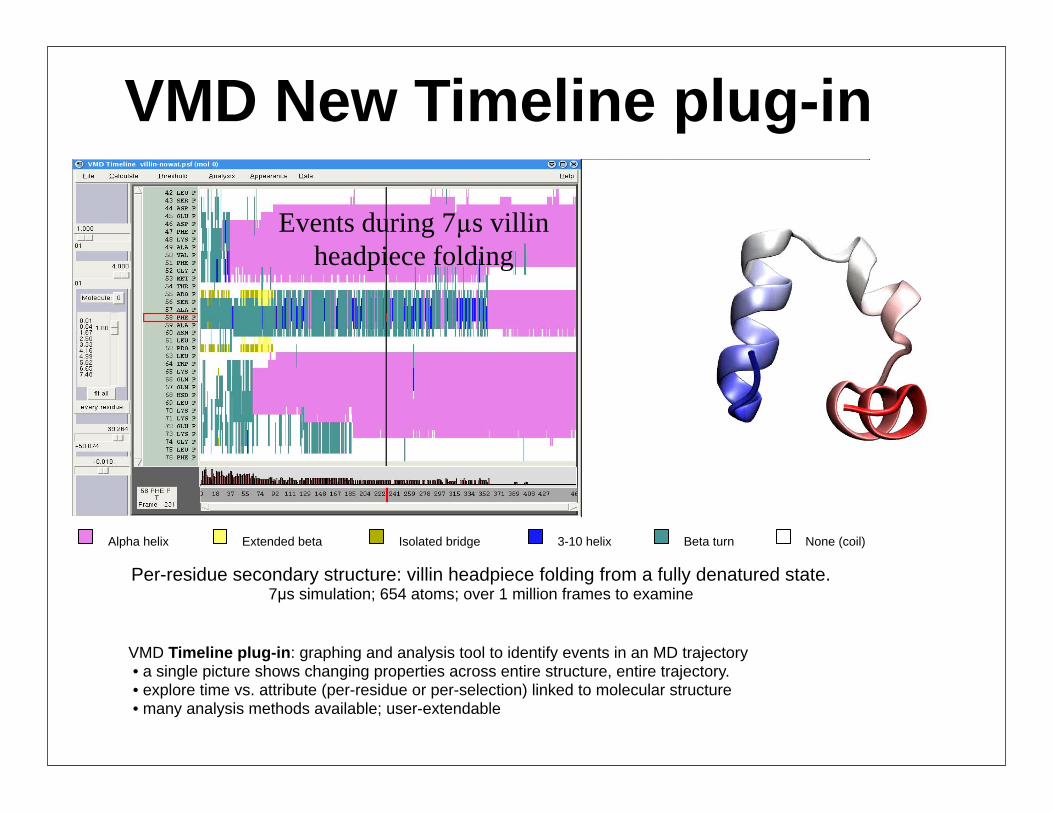
Alpha helix Extended beta Isolated bridge 3-10 helix Beta turn None (coil)
VMD Timeline plug-in: graphing and analysis tool to identify events in an MD trajectory • a single picture shows changing properties across entire structure, entire trajectory. • explore time vs. attribute (per-residue or per-selection) linked to molecular structure • many analysis methods available; user-extendable
Per-residue secondary structure: villin headpiece folding from a fully denatured state.7µs simulation; 654 atoms; over 1 million frames to examine
Events during 7 µs villin headpiece folding
VMD New Timeline plug-in
NIH Resource for Macromolecular Modeling and Bioinformaticshttp://www.ks.uiuc.edu/
Beckman Institute, UIUC
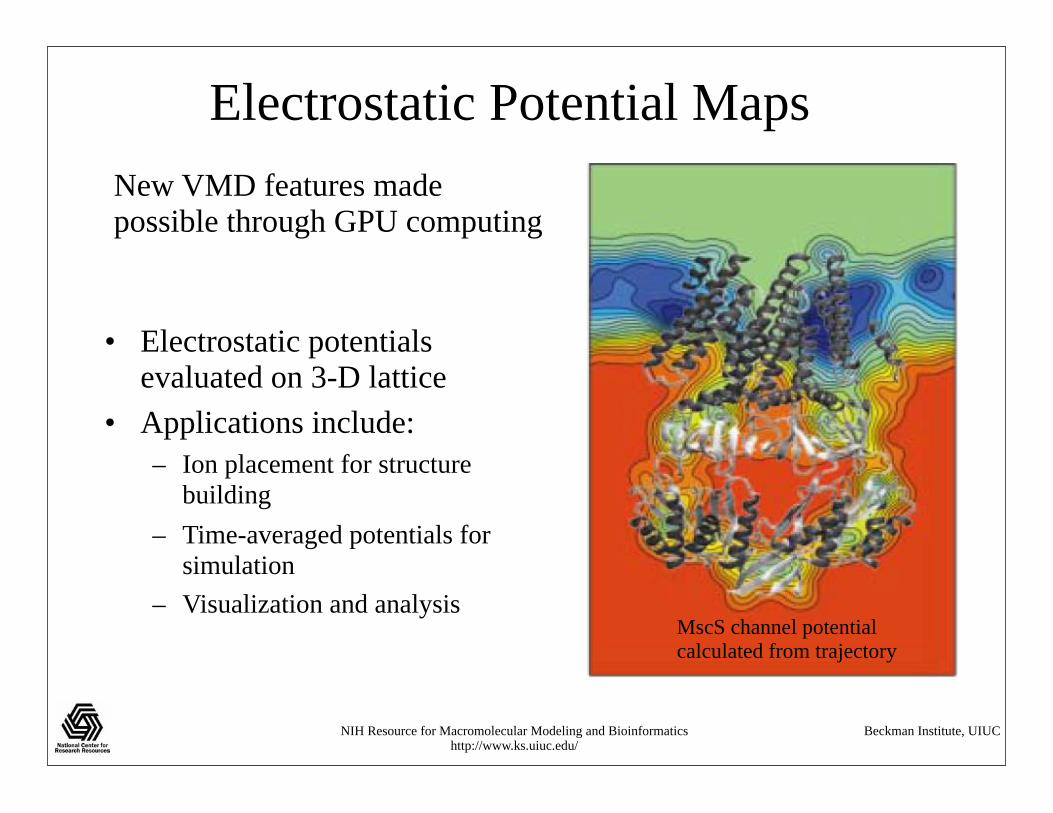
• Electrostatic potentials evaluated on 3-D lattice
• Applications include:– Ion placement for structure
building– Time-averaged potentials for
simulation– Visualization and analysis
MscS channel potential calculated from trajectory
Electrostatic Potential MapsNew VMD features made possible through GPU computing
NIH Resource for Macromolecular Modeling and Bioinformaticshttp://www.ks.uiuc.edu/
Beckman Institute, UIUC
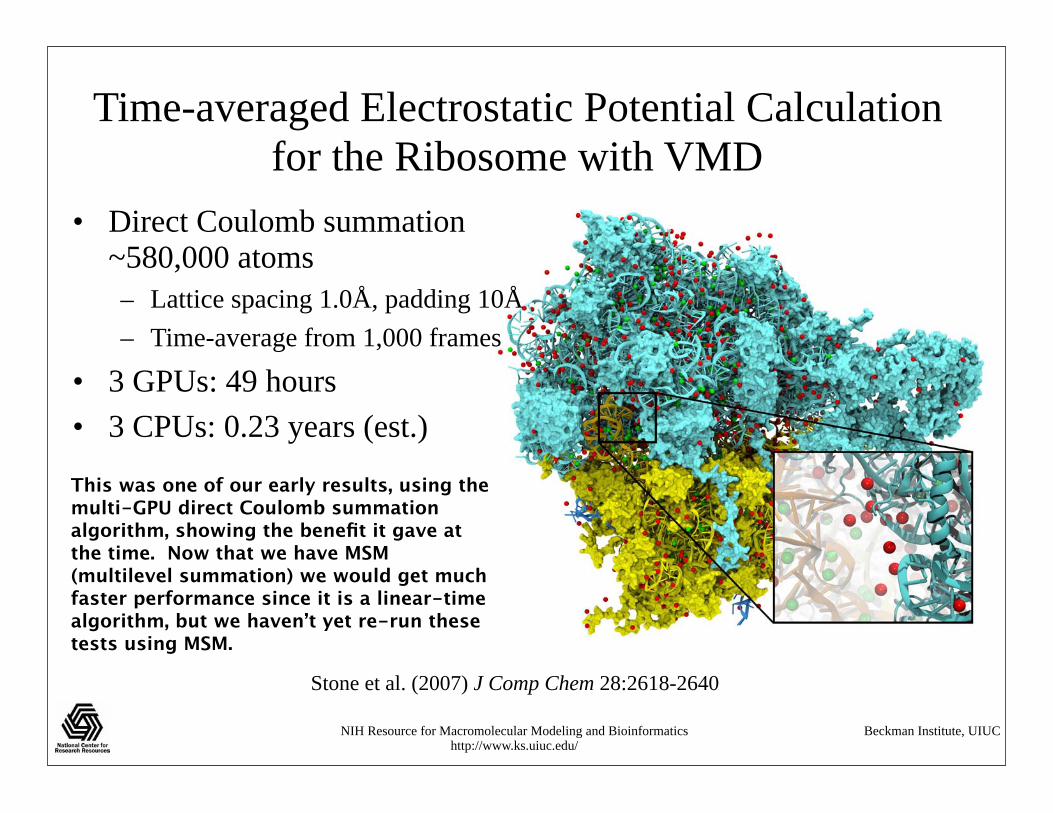
Time-averaged Electrostatic Potential Calculationfor the Ribosome with VMD
• Direct Coulomb summation ~580,000 atoms– Lattice spacing 1.0Å, padding 10Å– Time-average from 1,000 frames
• 3 GPUs: 49 hours• 3 CPUs: 0.23 years (est.)
Stone et al. (2007) J Comp Chem 28:2618-2640
This was one of our early results, using the multi-GPU direct Coulomb summation algorithm, showing the benefit it gave at the time. Now that we have MSM (multilevel summation) we would get much faster performance since it is a linear-time algorithm, but we haven’t yet re-run these tests using MSM.
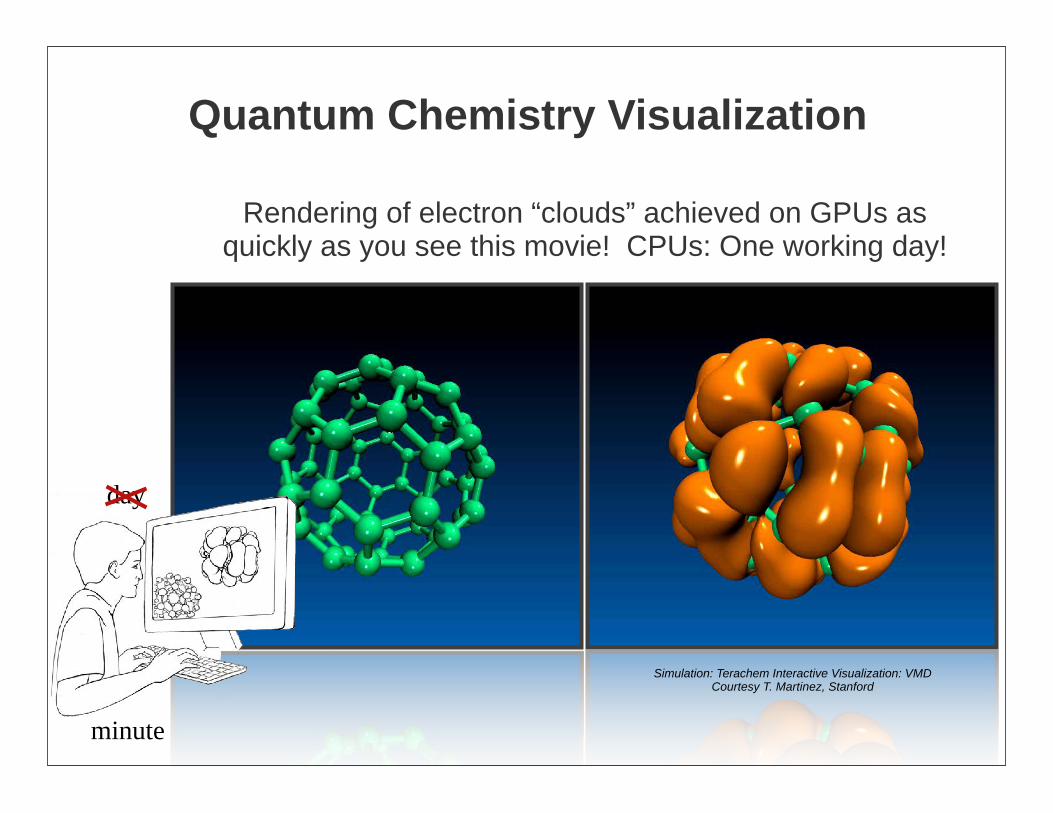
Quantum Chemistry Visualization
Rendering of electron “clouds” achieved on GPUs as quickly as you see this movie! CPUs: One working day!
Simulation: Terachem Interactive Visualization: VMDCourtesy T. Martinez, Stanford
minute
day
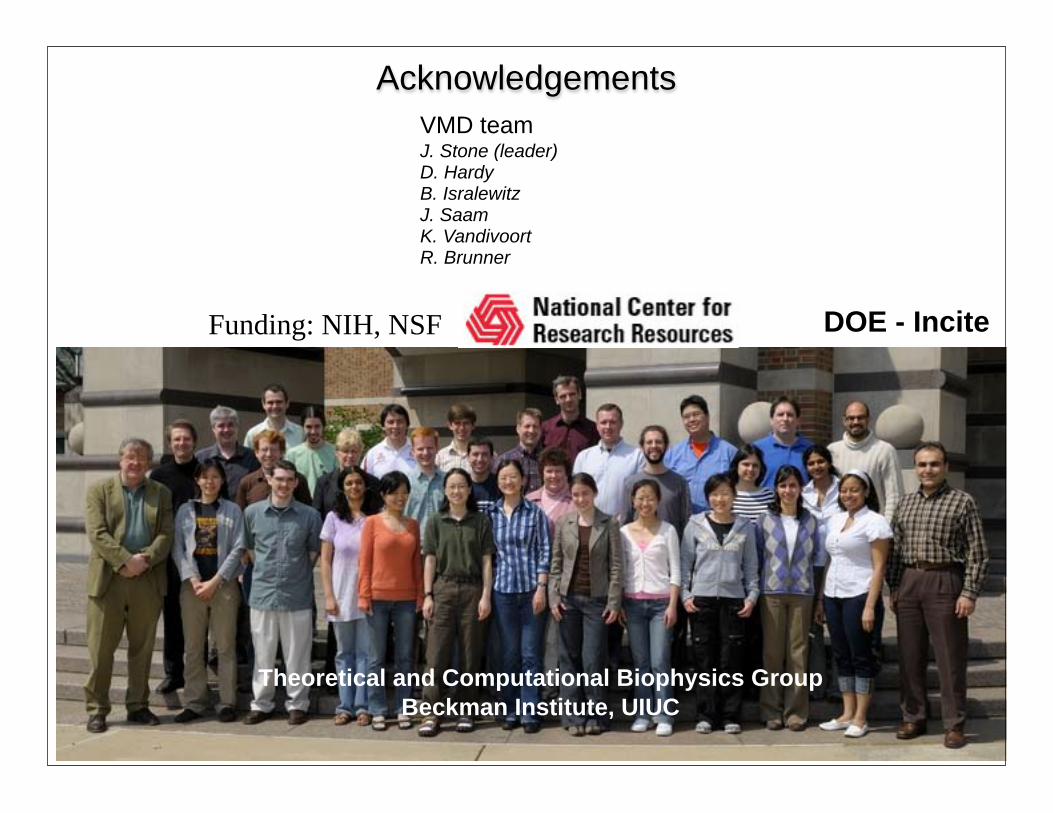
Acknowledgements
Theoretical and Computational Biophysics GroupBeckman Institute, UIUC
Funding: NIH, NSF DOE - Incite
VMD teamJ. Stone (leader)D. HardyB. IsralewitzJ. SaamK. VandivoortR. Brunner