Embed Size (px)
Citation preview

American Society for Dermatologic Surgery
Report of 2014 Procedures
May 2015

Survey Work Group Susan Weinkle, MD, Chair Thomas Rohrer, MD, Co-Chair Mathew Avram, MD, JD Whitney Hovenic, MD William Coleman III, MD Keith LeBlanc, MD Diane Berson, MD Jwala Karnik, Suneva

2014 Procedures Methodology Conducted by Perception Solutions Survey active Jan. 2 to Feb. 6, 2015 Survey link emailed to 3,980 practicing members;
faxed to members with no valid email; sent by mail to those without fax or emails on file
826 physicians reporting – 21% response rate Data were collected for the 2014 experience and
generalized to represent all ASDS members

Executive Summary
Members performed an estimated 3.08M Skin Cancer Treatments, 1.74M Neuromodulators, 2.06M Laser/Light/Energy-Based Procedures and 1.01M Soft-tissue Fillers
94% of members performed Skin Cancer Treatments; the majority – about 2.87M – were Non-melanoma; 207,000 were Melanoma
About 8 in 10 members performed Injectable Neuromodulator procedures using Botox, Dysport and Xeomin
About 75% of ASDS members performed Laser/Light/Energy-based Procedures estimated at more than 2.06M cases (down from 2013 but still substantially higher than 2012)
Copyright © 2015

Executive Summary
Body Sculpting procedures (19 percent) and Laser Hair Removal procedures (36 percent) saw substantial increases over 2013 totals
More men are seeking Injectable Neuromodulator treatments – increasing from 11 to 13 percent of the total patients
Members used Laser/Light/Energy-based Procedures to remove about 109,641 tattoos (higher compared to 2013)
About 7 in 10 members perform a total of about 1.01 million Soft-Tissue Filler Procedures – up from 995,000 in 2013
Copyright © 2015

Breakdown of Procedures Overall % Members Performing Procedures Overall 2011–2014
Copyright © 2015
Hair Transplants
Body Sculpting
Laser Hair Removal
Veins/Sclerotherapy
Chemical Peels
Laser/Light/Energy-based
Soft-tissue Fillers
Neuromodulators
Skin Cancer
7%
28%
64%
67%
72%
75%
77%
82%
94%
5%
27%
61%
64%
66%
76%
79%
82%
94%
6%
24%
54%
57%
63%
63%
67%
79%
87%
8%
35%
60%
59%
70%
60%
74%
83%
94%
2014
2013
2012
2011

Breakdown of Procedures Overall
ProcedureTotal
proceduresProduct, Method or Type used in greatest quantity
Skin Cancer Treatments 3,079,569 Non-melanoma (2,872,642)
Neuromodulators 1,747,650 Botox (1,191,813)
Laser/Light/Energy-based Procedures 2,060,809 Facial redness (427,805)
Soft-tissue Fillers 1,010,653 Juvederm (331,578)
Laser Hair Removal 632,738 N/A
Chemical Peels 563,848 N/A
Vein Treatments/Sclerotherapy 162,738 N/A
Body Sculpting 207,757 Cryolipolysis (79,016)
Hair Transplants 4,581 N/A
Total Estimated # of Procedures Performed by Members in 2014
Copyright © 2015

Skin Cancer Treatments
% Members Performing Skin Cancer Procedures
Members performed an estimated 3.08 Million Skin Cancer procedures in 2014 (compared to 3.04M in 2013
and 2.6M in 2012)
Copyright © 2015
94% Per-form
6%Don’t Per-form
Series1
93%
7%Melanoma207,000
Non-melanoma2.87 million

Injectable Neuromodulators
% Members Performing Neuromodulator Procedures
Members performed an estimated 1.75 Million Injectable Neuromodulator
procedures in 2014 (compared to 1.8M in 2013 and 1.5M in 2012)
Copyright © 2015
Average # of procedures per physician in 2014 (& total)83%Perform
17%Don’tPerform Xeomin(174,499)
Dysport(381,338)
Botox(1,191,813)
88
181
410

Injectable Neuromodulators
87%Female
13%Mal
e
Copyright © 2015
>55
51-55
46-50
41-45
36-40
31-35
<30
17%
18%
19%
18%
15%
9%
4%
Patient Age RangeGender Breakdown
Soft-tissue Fillers
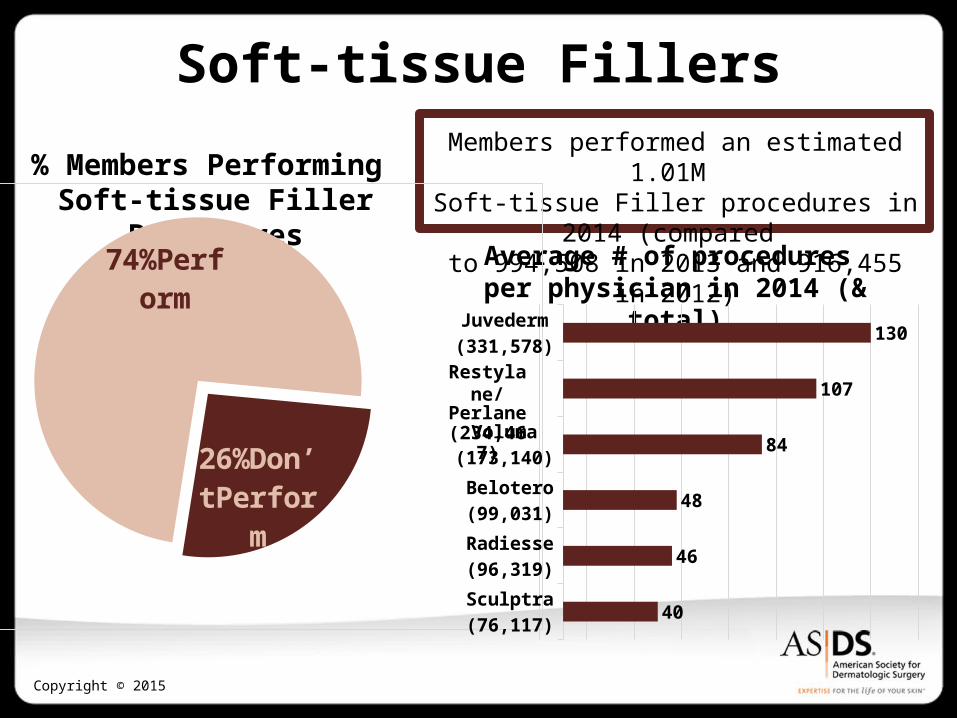
% Members Performing Soft-tissue Filler Procedures
Members performed an estimated 1.01M Soft-tissue Filler procedures in 2014 (compared
to 994,508 in 2013 and 916,455 in 2012)
Copyright © 2015
Average # of procedures per physician in 2014 (& total)
74%Perform
26%Don’tPerform
Sculptra(76,117)
Radiesse(96,319)
Belotero(99,031)
Voluma(173,140)
Juvederm(331,578)
40
46
48
84
107
130
Restylane/Perlane
(234,467)

Soft-tissue Fillers
91%Female
9%Mal
e
Copyright © 2015
>55
51-55
46-50
41-45
36-40
31-35
<30
23%
20%
19%
18%
11%
6%
3%
Patient Age RangeGender Breakdown

Chemical Peels% Members Performing
Chemical Peel Procedures
Copyright © 2015
70%Perform
30%Don’tPerform
Members performed about 563,848 Chemical Peel procedures in 2014 (compared to 517,415
in 2013 and 413,922 in 2012)

Laser/Light/Energy-based Procedures
% Members PerformingLaser/Light/Energy-based
Procedures
Average # of procedures per physician in 2014 (& total)Members performed an
estimated 2.06 Million Laser/Light/Energy-based
procedures in 2014 (compared to 2.25M in 2013 and 1.7M in 2012)
Copyright © 2015
75%Perform
25%Don’tPerf
ormBirthmarks
Surgical Scars
Acne Scars
Tattoo Remov...
Laser Resurfa...
Lentigenes
Tissue Tighte...
Photodynamic...
Photo Rejuven...
53
63
63
69
82
112
115
166
169(329,930)
(311,051)
(192,147)
(224,315)
(152,713)
(109,641)
(117,457)
(115,658)
(80,092)

Laser Hair Removal
% Members Performing Laser Hair Removal Procedures
Copyright © 2014
60%Perform
40%Don’tPerform
Members performed 632,738 Laser Hair
Removal procedures in 2014 (compared to 464,164 in 2013 and
318,485 in 2012)

Body Sculpting
% Members Performing Body Sculpting
Procedures
Members performed an estimated 207,757 Body Sculpting procedures in 2014 (compared to 175,256 in 2013 and 143,553 in 2012)
Copyright © 2015
Average # of procedures per physician in 2014 (& total)
35%Per-
form
65%Don’tP
er-form
Laserlipolysis(14,521)
Tumescent liposuction(32,684)
Radiofrequency(49,568)
Other (31,969)
Cryolipolysis(79,016)
41
55
69
73
124

Vein Treatment/Sclerotherapy
% Members Performing Vein Treatments/Sclerotherapy
Copyright © 2015
Members performed about 162,738 Vein Treatment/ Sclerotherapy procedures
in 2014 (compared to 223,764 in 2013 and
145,495 in 2012)59%Perform
41%Don’tPer-form

Hair Transplantation% Members Performing
Hair Transplants
Copyright © 2015
8%Perform
92%Don’t Per-form
Members performed an estimated 4,581
Hair Transplantation procedures in 2014
(compared to 4,743 in 2013 and 3,772 in 2012)