Embed Size (px)
Citation preview
Applied Psycholinguistics 29 (2008), 367–388Printed in the United States of Americadoi:10.1017/S014271640808017X
American Sign Language syntacticand narrative comprehension inskilled and less skilled readers:Bilingual and bimodal evidencefor the linguistic basis of reading
CHARLENE CHAMBERLAINMcGill University
RACHEL I. MAYBERRYUniversity of California, San Diego
Received: July 6, 2006 Accepted for publication: January 22, 2008
ADDRESS FOR CORRESPONDENCECharlene Chamberlain, 12028 62 Street, Edmonton, Alberta T5W 4C8, Canada. E-mail: [email protected]
ABSTRACTWe tested the hypothesis that syntactic and narrative comprehension of a natural sign language canserve as the linguistic basis for skilled reading. Thirty-one adults who were deaf from birth and usedAmerican Sign Language (ASL) were classified as skilled or less skilled readers using an eighth-gradecriterion. Proficiency with ASL syntax, and narrative comprehension of ASL and Manually CodedEnglish (MCE) were measured in conjunction with variables including exposure to print, nonverbal IQ,and hearing and speech ability. Skilled readers showed high levels of ASL syntatic ability and narrativecomprehension whereas less skilled readers did not. Regression analyses showed ASL syntactic abilityto contribute unique variance in English reading performance when the effects of nonverbal IQ,exposure to print, and MCE comprehension were controlled. A reciprocal relationship between printexposure and sign language proficiency was further found. The results indicate that the linguistic basisof reading, and the reciprocal relationship between print exposure and “through the air” language, canbe bimodal, as in being a sign language or a spoken language, and bilingual, as in being ASL andEnglish.
Language skills contribute substantial and unique variance to reading development,in addition to phonological processing skills (Catts, Fey, Zhang, & Tomblin, 1999;Nation & Snowling, 2004). Several large-scale studies measuring language andphonological processing skills in students who hear normally have found thatlanguage development plays an enduring and central role in reading development(Dickinson & McCabe, 2001). Over and above phonological awareness skills infirst and second grade, language difficulties are strongly associated with reading
© 2008 Cambridge University Press 0142-7164/08 $15.00
Applied Psycholinguistics 29:3 368Chamberlain & Mayberry: ASL and reading
problems in middle childhood (Catts, Fey, Tomblin, & Zhang, 2002; Dickinson,McCabe, Anastasopoulos, Peisner-Feinberg, & Poe, 2003; Roth, Spence, &Cooper, 2002). Moreover, students who exhibit reading problems beyond theprimary grades have been found to have language problems (Leach, Scarborough,& Rescorla, 2003; Scarborough, 1990). These findings converge to indicate thatreading development has a linguistic basis that extends beyond the associationbetween spoken phonology and orthographic patterning.
We know little about the relation of linguistic ability and reading developmentin individuals who are born deaf and whose language is signed. The medianreading level for deaf students, regardless of whether they speak or sign, indicatesa low level of achievement. Approximately 60% of students leaving high schoolread at or below fourth grade (Allen, 1986, 1994). About 10% of deaf studentsread beyond a Grade 8 level (Traxler, 2000). One factor proposed to impedereading development in deaf students is difficulty with spoken language, consis-tent with the above-cited research indicating that linguistic ability is the basis ofreading development for hearing students (Allen, 1986; LaSasso & Davey, 1987;Quigley & Paul, 1989; Waters & Doehring, 1990). Spoken language develop-ment is well documented to be problematic when severe (70–90 dB) to profound(>90 dB) hearing loss is present at birth (Geers & Moog, 1987; Wolk & Schildroth,1986).
The crucial question is whether sign language can function as the linguistic basisof reading development. Although demographic studies of deaf students’ readingachievement include background information such as socioeconomic status (SES),ethnicity, and hearing level, information about sign language ability is unavailable.There are no standardized tests of sign language, so the sign language abilities ofdeaf students who read successfully or not are unknown.
Most adults who are deaf use some form of sign as their primary language(Karchmer & Mitchell, 2003). Psycholinguistic research has accumulated de-tailed evidence that sign languages are natural languages with respect to gram-matical structure (see Sandler & Lillo-Martin, 2006). Research indicates thatsign languages serve all the psychological functions of spoken language, includ-ing the ability to comprehend, remember, and produce words and sentences (seeEmmorey, 2002), engage in extended discourse on abstract topics, and create puns,metaphors, poetry, and drama (Perlmutter, 2008). Sign languages are processed inbrain areas that also process spoken languages, specifically the classic languageareas of the superior temporal and inferior frontal areas of the left hemisphere(MacSweeney et al., 2002; Petitto et al., 2000; Poizner, Klima, & Bellugi, 1987).
Two clear differences between signed and spoken languages are the sensory–motor modality through which they are sent and received and the particular lin-guistic structures that make up their grammars. These two factors have beenhypothesized separately or together to preclude sign language from functioning asthe linguistic basis for reading. With respect to modality differences, some readingmodels posit that written word recognition requires phonological mediation of anarticulatory, and perhaps acoustic, nature (Perfetti & Sandak, 2000). Within thisframework the ability to speak is necessary for reading development but the abil-ity to sign is tangential. However, deaf college students who use American SignLanguage (ASL) have been found to use phonological coding for some reading
Applied Psycholinguistics 29:3 369Chamberlain & Mayberry: ASL and reading
tasks (Hanson & Fowler, 1987), indicating that phonological analysis of writtenwords is compatible with using sign language.
The focus of the present study is on the second difference between signed andspoken languages hypothesized to impede reading development in deaf readers,namely, that the grammatical differences between signed and spoken language aretoo great for sign language to function as the linguistic basis of reading (Mayer &Wells, 1996). In this framework, reading is conceived of as a process wherebymeaning is extracted from print by matching the grammatical structures of thewritten language to the grammatical structures in the reader’s mind, which areassumed to be identical to the structures of the reader’s through the air language.A mismatch between the syntactic representations of written and through the airlanguage are thus argued to impede reading development in deaf readers who sign.
Educators have long realized that written English grammar differs from thatof ASL. Such recognition motivated attempts to change ASL grammatical struc-ture into something more akin to written English, despite the fact that doing soyielded sign forms that were ungrammatical and phonologically impossible in anynatural sign language.1 ASL content signs are interspersed with invented signs torepresent English grammatical and derivational morphology and word order. Theresulting mix of invented and natural sign is produced simultaneously with speechto communicate with deaf students; the goal is to facilitate English acquisition,albeit in a signed form. This pedagogical signing is commonly referred to asManually Coded English (MCE), and various versions of it have been used inNorth American classrooms.2 Some students educated in a version of MCE (i.e.,see Anthony, 1971) have been found to develop reading skills at or near-gradelevel when their parents used it at home as well (Schick & Moeller, 1992). Owingto its artificial nature, however, ASL signers who also know English report thatMCE is difficult to parse and understand.
Research has begun to investigate the relation between ASL knowledge andEnglish reading ability (Chamberlain & Mayberry, 2000). Proficiency with ASLplural markers and knowledge of synonyms and antonyms correlated positivelywith reading achievement in a small sample of students educated in MCE(Hoffmeister, 2000). For students educated in ASL, a composite score of fourcomprehension and two production tasks in ASL predicted a composite scorefor English reading and writing tasks (Strong & Prinz, 1997). Recognition andmemory of fingerspelled and initialized signs within ASL sentences correlatedpositively with reading achievement in a small sample of students educated inMCE or ASL (Padden & Ramsey, 2000).3 One study found no relation betweenASL and reading achievement in a college-age sample, but the null result may havebeen due to ceiling effects for the ASL measure, which was a 4-point proficiencyrating scale (Moores & Sweet, 1990). These findings suggest that a variety ofASL skills relate positively to reading development. A direct test of ASL syntacticproficiency and English reading achievement is lacking, however.
In previous work, we found narrative comprehension of MCE and ASL toaccount for 48% of variance in reading achievement after the effects of age wereremoved. The sample included 48 deaf students ranging from 6 to 15 years old;half of the students had deaf parents who used sign language. Both ASL andMCE narrative comprehension better predicted reading achievement than other
Applied Psycholinguistics 29:3 370Chamberlain & Mayberry: ASL and reading
psycholinguistic measures of signed and written language including: short-termmemory for signs, fingerspelling, and written words; working memory for sen-tences in ASL, MCE, and written English; and background measures includingnonverbal IQ, hearing level, and speech sound production (Chamberlain & May-berry, 2000). Some students showed greater ASL than MCE comprehension butnonetheless read at grade level. Narrative comprehension may better predict read-ing ability than working memory tasks because it entails discourse comprehension,which may be more akin to reading comprehension (Hoover & Gough, 1990;Strich & James, 1984).
The present study extends previous work by making a direct comparison be-tween ASL proficiency and reading comprehension in a sample of adults whosereading development is presumably complete. We test the hypothesis that signlanguage can serve as the linguistic basis of reading by testing adults who self-identify as using sign language for interpersonal communication, that is, membersof the deaf community. We also adopt a research paradigm commonly used inreading research, namely, a comparison of skilled readers (SR) and less skilledreaders (LSR). If the grammatical structure of the reader’s through the air languagemust match that of the written language for skilled reading to develop, then deafsigners who have high levels of ASL syntactic and narrative skills should moreoften be identified as LSR than those with low ASL syntactic and narrative skills.Alternatively, if the linguistic basis of reading is abstract and transcends languagemodality and grammatical form, as does the nature of language itself, then thereverse outcome should be observed. Skilled deaf readers should show high levelsof ASL proficiency but less skilled deaf readers should not.
To test the hypothesis, we measured the reading and sign language abilities ofa sample of adults. All the adults were born deaf and reported relying on ASLas their primary language. We measured ASL and MCE narrative comprehensionin addition to ASL syntactic proficiency. We took additional measures includinga nonverbal IQ screening, education, hearing level, self-report of speech use andcomprehension, and print exposure. To the best of our knowledge, this is the firstreading study with a nonschool age sample of deaf adults and the first to assessprint exposure in this population as well.
We did not know in advance what the reading levels of the sample wouldbe. We categorized the participants as being SR or LSR, based on performanceon a reading test widely used in educational programs for deaf students. Wethen compared their ASL syntactic, and ASL and MCE narrative skills alongwith background information including nonverbal IQ, hearing and speech ability,and exposure to print. Last, we analyzed the data with regressions to isolate thecontribution of ASL syntactic proficiency to English reading ability.
METHODS
Background measures
Nonverbal IQ screening. Three subtests of the performance scale of the WechslerAdult Intelligence Scale—Revised (WAIS-R; Wechsler, 1981) were administered.Although no language response was required, the tasks were given in ASL to ensure
Applied Psycholinguistics 29:3 371Chamberlain & Mayberry: ASL and reading
that they were understood. The subtests served both to screen for below averagecognitive ability and as a background measure and were: picture completion,picture arrangement, and block design. Participants were excluded if they scoredmore than 1 standard deviation below the mean on each of the three subtests (i.e.,a summed scaled score of 21 or less).
Hearing status. An audiometric screening (pure tone thresholds for the frequen-cies of 250–4000 Hz at 70–95 dB) was conducted with a portable audiometer.
Speech use and comprehension. Speech use and comprehension was collectedby means of a self-report measure adapted from a bilingual questionnaire (Weber-Fox & Neville, 1996). Participants reported how often they used speech. Theyrated their speech-use frequency on a scale from 0 (never use speech) to 10 (usespeech daily). They also rated their ability to comprehend speech on a scale from0 (not at all) to 10 (perfect).
Reading measures
Stanford reading comprehension. The Stanford 9 (Psychological Corporation,1995), normed for deaf students, was administered and used to categorize partic-ipants into the SR and LSR groups. Participants were first given a screening testto ensure that the appropriate test level was given. The reading comprehensionsubtest had 10 short passages with 4–6 multiple choice questions after each for atotal of 54 questions.
Gates–MacGinitie reading tests. Two reading tests in addition to the one usedto categorize the participants were also administered. The reading comprehensionand vocabulary subtests of the Gates–MacGinitie Reading Tests, Second CanadianEdition (MacGinitie & MacGinitie, 1992) were given to all participants. This testis widely used with deaf students. The reading comprehension subtest had 10 shortpassages with 4–6 multiple choice questions after each, for a total of 48 questionsand a 35-min time limit. The reading vocabulary test had a total of 45 questionsand a 20-min time limit. For the latter task, the reader matched a word underlinedin a carrier phrase with one of four choices of synonyms. Although the Gates–MacGinitie does not have norms for deaf readers, it was standardized on 40,000Canadian students and, as such, reflected Canadian curricula content.
Sign language measures
ASL syntactic proficiency. ASL syntactic ability was measured with an exper-imental grammatical judgment task used in a previous study (Boudreault &Mayberry, 2006). The task assessed grammatical knowledge of 6 ASL sentencestructures: simple, negative, inflecting verb, wh-questions, relative clauses, andclassifier sentences. Although the simple sentences used subject–verb–object(SVO) word order, and thus were similar to English SVO structures, the remainingstructures used morphosyntactic forms not found in English and used space andnonmanual (i.e., facial) markers grammatically. (See Appendix A for a description
Applied Psycholinguistics 29:3 372Chamberlain & Mayberry: ASL and reading
of the ASL structures.) Mastery of each of the 6 ASL structures was assessed with24 stimuli (12 grammatical sentences and 12 ungrammatical counterparts, eachcontaining the same syntactic violation), for a total of 144 stimuli. Stimuli wererandomized and presented in movie files on a laptop computer, which also recordedaccuracy. Participants decided with a button press whether each stimulus was agrammatical ASL sentence. An A′ score was computed for each participant’sperformance for each structure and then averaged.4
ASL and MCE narrative comprehension. Two narrative comprehension taskswere adapted from a previous study with children. The tasks involved watchinga story in sign language, answering questions, and then retelling it (Chamberlain& Mayberry, 2000). One narrative was about a man driving through town in avan unaware that his horn was blaring. The second narrative was about a womanstuck in an elevator because she could not hear the door opening behind her. Eachstory used a simple story structure (Stein, 1979) and included the following storyelements: a setting, a major deaf character, minor deaf and hearing characters, aproblem arising for the main character related to deafness, two attempts by themain character to solve the problem, and a resolution. The plots were inspiredby a collection stories by deaf storytellers (Bragg & Bergman, 1981). Twelvequestions probed different elements of story structure. Three questions askedabout the nature of the problem, such as, “Why did people point and stare atDennis?” Three questions asked about the characters and setting, such as, “Whotold Mary her friend was in the hospital?” Three questions asked about extraneousinformation required for story understanding, such as, “Why would an elevatorhave two doors?” Finally, three questions required an inference based on storycomprehension, such as, “Did Dennis’s brother know sign language?”
In previous work, we found a ceiling effect on this task for 13- to 15-year-olds.To avoid ceiling effects and make the stories more appropriate for adults, weincreased the number, length, and complexity of story episodes. Two sign versionswere created of each story, one in ASL and one in MCE, by ASL consultantswho were deaf native signers. A deaf native ASL signer produced each story,once in ASL and once in MCE, and was videotaped. The MCE stories weresigned with simultaneous mouthing of English words without vocalizing, whichwas the consultant’s manner of expressing MCE. The comprehension questionswere signed in the same sign language as the story, ASL or MCE. The ASL andMCE story versions were presented to participants in a counterbalanced fashion.If a participant saw the elevator story in ASL then he or she saw the van story inMCE, and vice versa. Each story was 3 to 4 min in length. Participants watchedthe story on a laptop computer and then answered 12 comprehension questions,also presented on the laptop. Participants’ responses were videotaped and thenscored for accuracy, strictly correct or not, by a deaf research assistant.
We analyzed the variance associated with the reading and sign language mea-sures with Cronbach alpha. Alpha for the entire set of measures, three reading testsand three sign language measures, was .8. The Cronbach alpha for ASL gram-matical judgment was .91 and for the ASL and MCE narrative comprehensionmeasures were .91 and .91, respectively, indicating that the variance associatedwith the three sign language measures was similar to that associated with the three
Applied Psycholinguistics 29:3 373Chamberlain & Mayberry: ASL and reading
reading tests. Cronbach α values were .88 for the Stanford reading comprehensionsubtest, .89 for the Gates–MacGinitie reading comprehension subtest, and .89 forthe vocabulary comprehension subtest of the Gates–MacGinitie.
Print exposure measures
Author Recognition Test. Because skilled reading development is influenced byreading frequency (Stanovich, 1986), we administered the Author RecognitionTest (ART; Stanovich & West, 1989) to measure reading practice. The test usesrecognition of popular authors’ names as the dependent measure. The Canadianversion listed 45 popular authors (including popular Canadian authors, e.g., PierreBurton, Margaret Atwood) and 41 foils to control for guessing.5 Instructionsincluded a warning against guessing because not all listed names were popularauthors. Scoring of the checklist was the number correct minus the number of foilschecked.
Magazine Recognition Test. As a second measure of reading frequency, we ad-ministered the Magazine Recognition Test (MRT; Stanovich & West, 1989), whichuses familiarity with popular magazine titles (e.g., Vogue, Rolling Stone, Time)as the dependent measure. The Canadian version included 60 popular magazinestitles. Participants checked all magazines with which they were familiar.5 Tocontrol for guessing, the list included 34 foils that were fictional names but couldbe magazine titles (e.g., Reader’s Choice, Digital Sound). Instructions warnedagainst guessing; scoring of the checklist was the number of correct magazinetitles checked minus the number of foils checked.
Reading and Media Habits Questionnaire. All participants filled out an 11-itemquestionnaire designed to ascertain amount of exposure to print and TV media(Stanovich & West, 1989). Questions included amount and frequency of book,magazine, newspaper reading, frequency of bookstore and library visits, andamount and type of TV watching habits.6 For the present study we used par-ticipants’ responses to three questions: “How often do you read a newspaper?How many books do you read a year? How often do you read for pleasure?”
Participants
Participants were recruited several ways, through flyers posted at deaf centers, di-rect contacts by research assistants, and recruiting previous research participants.The institutional review board of the McGill University Faculty of Medicine ap-proved the protocol. The participants resided in various locales across Quebec andOntario. They had attended a wide range of educational programs, thereby makingeducational program a random effect in the sample. All participants were educatedin English and used ASL as a primary language, although several participants alsoknew and used French and/or Langue des Signes Quebecoise (LSQ), which arethe majority spoken and signed languages in Quebec.
Forty adults volunteered. They reported being deaf from birth and that ASL wastheir primary language, which they had used daily for a minimum of 10 years.
Applied Psycholinguistics 29:3 374Chamberlain & Mayberry: ASL and reading
Four participants did not complete the experimental protocol, which required twotesting sessions, so their data were excluded. The data from four other participantswere excluded because they performed one standard deviation below the normedaverage on the nonverbal IQ screening task. The data from one participant wereexcluded because of equipment failure. The remaining 31 participants included12 women and 19 men between the ages of 17 and 53 years with average age of32 years.
Procedure
A research assistant fluent in ASL who was deaf tested participants individually ina nondistracting room at several testing sites conforming to the same arrangement.A second researcher who was hearing (the first author) was present for all testingsessions and conducted the hearing screening and computer tasks. All instructions,including the informed consent, were given in ASL, and questionnaire items weretranslated into ASL upon request. The ASL grammatical judgment task and signlanguage narratives and questions were presented on an Apple G3 PowerBook. Thedeaf research assistant was the interlocutor; the hearing researcher controlled thepresentation of the stories and questions. Participants watched the sign languagenarrative uninterrupted. Next, the questions were shown one at a time on the laptop.Participants then signed the answer to the deaf research assistant who respondedneutrally with comments such as, “anything else,” or “that’s fine.” There wasno time limit. Participants were free to answer in their language of choice, andeveryone answered in ASL.
Reading group assignment
Each participant was categorized as being either an SR or LSR using the readingcomprehension subtest of the Stanford 9 (Psychological Corporation, 1995). Astandard score of 680 or above (Grade 8 equivalent or above) was the criterion forclassification as an SR. Any participant scoring below criterion was categorized asan LSR. An eighth-grade cutoff was selected prior to analyzing the data because itrepresents the official definition of functional literacy by the Canadian government(Statistics Canada, 1996).
Data analyses
For statistical analyses, the data took the following forms. For the ASL gram-matical judgment task, the participant’s accuracy was converted into a mean A′score. Narrative question accuracy was converted to proportion (12 total for eachstory), one for ASL and one for MCE. Nonverbal IQ subtest performance wasconverted to scaled scores, as were the reading comprehension and vocabularycomprehension subtests of the Gates–MacGinitie, and the reading comprehensionsubtest of the Stanford. All other measures were in raw score or numerical rank(for the self-assessment of speech use and comprehension skill).
Applied Psycholinguistics 29:3 375Chamberlain & Mayberry: ASL and reading
RESULTS
We analyzed the data three ways. First we categorized the participants into twogroups, SR (performance ≥ Grade 8) and LSR (performance < Grade 8). Next wecompared the SR and LSR groups on all the measures: reading, background, signlanguage, and print exposure. Third, we analyzed the relations among measureswith multiple correlations. Last, we analyzed the data with regressions to determinethe degree to which sign language proficiency predicted reading proficiency, andprint exposure predicted sign language proficiency, as we explain below. We beginwith a description of the SR and LSR groups.
SR and LSR group comparisons
Categorizing the participants as reading above or below the Grade 8 criterionprovided a clear distinction between the groups, resulting a bimodal distributionof reading ability in the sample. Mean reading level for the SR group was grade11.06 compared with 3.46 for the LSR group. No Stanford score among theLSR participants was close to eighth-grade criterion for being an SR (see Table 1).Three LSR participants performed at a Grade 5 level; all the other LSR participantsperformed at or below a Grade 3.5 level.
Background measures. Table 1 shows all the measures for the two reader groups.The SR group was on average 30.0 years old and the LSR group was on average33.8 years old, which was not significantly different, F (1, 29) = .903, p = .35.The SR group performed at higher levels on the nonverbal IQ screening, with amean of 12.26, than that the LSR group, 10.24, F (1, 29) = 9.78, p < .01). Notethat a scaled score of 10 is the normed average with a standard deviation of 3.0,indicating that both groups’ mean nonverbal IQ performance within the averagerange for the hearing population (Weschler, 1981). The groups did not differ inmean years of education, 15.43 and 14.41 years for the SR and LSR groups,respectively, F (1, 29) = 1.02, p = .32. The SR group reported a younger meanage of ASL exposure, 4.2 years compared with the LSR group, 6.5 years, whichwas not significantly different, F (1, 29) = 2.11, p = .156. Seven participantsin the SR group had deaf parents; two participants in the LSR group had deafparents.
Reading measures
As expected, given the eighth-grade criterion for being a skilled reader, the SRgroup significantly outperformed the LSR group on the reading comprehensionsubtest of the Stanford with means of 11.06 and 3.46, respectively, F (1, 29) =197.73, p < .001. Differences in reading achievement were corroborated with twoadditional reading tests. The SR group significantly outperformed the LSR groupon the Gates–MacGinitie comprehension subtest with grade equivalent means of9.89 and 3.68, respectively, F (1, 29) = 85.80, p < .0001. The same was truefor performance on the vocabulary subtest where the SR group performed at a
Applied Psycholinguistics 29:3 376Chamberlain & Mayberry: ASL and reading
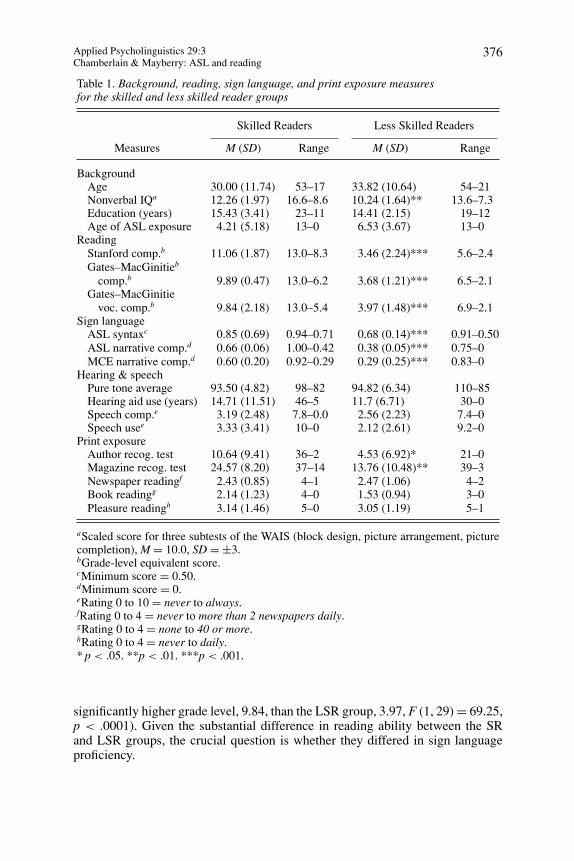
Table 1. Background, reading, sign language, and print exposure measuresfor the skilled and less skilled reader groups
Skilled Readers Less Skilled Readers
Measures M (SD) Range M (SD) Range
BackgroundAge 30.00 (11.74) 53–17 33.82 (10.64) 54–21Nonverbal IQa 12.26 (1.97) 16.6–8.6 10.24 (1.64)** 13.6–7.3Education (years) 15.43 (3.41) 23–11 14.41 (2.15) 19–12Age of ASL exposure 4.21 (5.18) 13–0 6.53 (3.67) 13–0
ReadingStanford comp.b 11.06 (1.87) 13.0–8.3 3.46 (2.24)*** 5.6–2.4Gates–MacGinitieb
comp.b 9.89 (0.47) 13.0–6.2 3.68 (1.21)*** 6.5–2.1Gates–MacGinitie
voc. comp.b 9.84 (2.18) 13.0–5.4 3.97 (1.48)*** 6.9–2.1Sign language
ASL syntaxc 0.85 (0.69) 0.94–0.71 0.68 (0.14)*** 0.91–0.50ASL narrative comp.d 0.66 (0.06) 1.00–0.42 0.38 (0.05)*** 0.75–0MCE narrative comp.d 0.60 (0.20) 0.92–0.29 0.29 (0.25)*** 0.83–0
Hearing & speechPure tone average 93.50 (4.82) 98–82 94.82 (6.34) 110–85Hearing aid use (years) 14.71 (11.51) 46–5 11.7 (6.71) 30–0Speech comp.e 3.19 (2.48) 7.8–0.0 2.56 (2.23) 7.4–0Speech usee 3.33 (3.41) 10–0 2.12 (2.61) 9.2–0
Print exposureAuthor recog. test 10.64 (9.41) 36–2 4.53 (6.92)* 21–0Magazine recog. test 24.57 (8.20) 37–14 13.76 (10.48)** 39–3Newspaper readingf 2.43 (0.85) 4–1 2.47 (1.06) 4–2Book readingg 2.14 (1.23) 4–0 1.53 (0.94) 3–0Pleasure readingh 3.14 (1.46) 5–0 3.05 (1.19) 5–1
aScaled score for three subtests of the WAIS (block design, picture arrangement, picturecompletion), M = 10.0, SD = ±3.bGrade-level equivalent score.cMinimum score = 0.50.dMinimum score = 0.eRating 0 to 10 = never to always.fRating 0 to 4 = never to more than 2 newspapers daily.gRating 0 to 4 = none to 40 or more.hRating 0 to 4 = never to daily.* p < .05. **p < .01. ***p < .001.
significantly higher grade level, 9.84, than the LSR group, 3.97, F (1, 29) = 69.25,p < .0001). Given the substantial difference in reading ability between the SRand LSR groups, the crucial question is whether they differed in sign languageproficiency.
Applied Psycholinguistics 29:3 377Chamberlain & Mayberry: ASL and reading
Sign language measures
ASL syntactic proficiency. Mean A′ score on the ASL grammaticality judgmenttask for the SR group was .85, indicating a high degree of receptive control overASL syntactic structures, whereas that of the LSR group performance was .68,indicating weak control over ASL syntax (where .50 represents performance atchance), F (1, 29) = 19.36, p < .0001.
ASL and MCE narrative comprehension. On the ASL narrative comprehensiontask, the SR group’s performance was .66 and that of the LSR group was .38.On the MCE narrative comprehension task, SR group mean performance was .60and that of the LSR group was .29. Two participants in the LSR group could notanswer any questions for the MCE narrative; one LSR participant declined thetask. The two stories were thus of sufficient difficulty to avoid ceiling effects evenamong the best sign language comprehenders in the sample. A two-way analysisof variance for the between-subjects factor of reading group, SR and LSR, andthe within-subjects factor of sign language type, ASL and MCE, showed the SRgroup to comprehend both ASL and MCE narratives at significantly higher levelsthan the LSR group, F (1, 25) = 21.1, p < .0001, with no significant interactionbetween group and sign language type (see Table 1).
Hearing and speech measures
No participant was excluded for having less than a severe loss. The majority,94%, of the sample had profound loss. Mean hearing loss for the SR group was93.5 dB (12 of 14 participants had a profound loss) and 94.82 dB for the LSR group(14 of 17 participants had a profound loss), and was not significantly different,F (1, 29) = 0.413, p = .525. The SR group reported more years of hearing aid use,14.7, than the LSR group, 11.74, which was not significantly different, F (1, 29) =0.767, p = .388 (see Table 1).
On the self-report scale of everyday speech comprehension and use (0 = not atall, 10 = always), the SR group reported a mean speech use of 3.3 and the LSRgroup reported a mean speech use of 2.1, which did not differ, Kruskal–Wallis z =1.022, p = .31. The reported mean speech comprehension of the SR group was3.2 and that of the LSR group was 2.6, which also was not significantly different,Kruskal–Wallis, z = .76, p = .45.
Thus, the SR group showed significantly higher sign language proficiency inASL and MCE than the LSR groups, but the two groups did not differ in resid-ual hearing level, hearing aid use, or how easily and often they could use andunderstand speech in daily life.
Print exposure measures
The SR group recognized more authors, with a mean of 10.64, than the LSR group,with a mean of 4.53, F (1, 29) = 4.34, p < .05. The SR group also recognizedmore magazine titles than did the LSR group, with means of 24.58 and 13.76,respectively, F (1, 29) = 9.88, p < .01 (see Table 1). Although the SR group
Applied Psycholinguistics 29:3 378Chamberlain & Mayberry: ASL and reading
recognized more authors and magazine titles than the LSR group, both groupsreported reading newspapers daily to several times a week (2.43 and 2.47 forthe SR and LSR groups, respectively; Kruskal–Wallis, z = −.52, p = .60). Bothgroups reported reading one to three books on average a year (2.14 and 1.53 forthe SR and LSR, respectively; Kruskal–Wallis, z = 1.54, p = .12). Both groupsreported reading for pleasure at least once a week (3.14 and 3.05 for the SR andLSR groups, respectively; Kruskal–Wallis, z = .33, p = 74).
In sum, the SR and LSR groups primarily differed in mastery of ASL syntax,narrative comprehension in both ASL and MCE, and print exposure as measuredby author and magazine recognition, but not in the amount of newspaper, book,or pleasure reading. They also differed in mean nonverbal IQ, which was howeverwithin the normal range for both groups. The next question is how these measuresrelate to one another.
Relationships among the measures
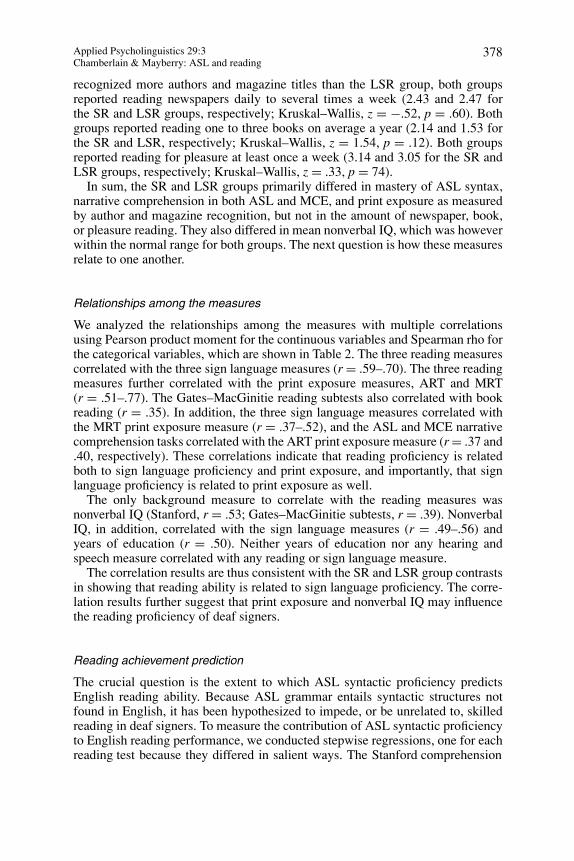
We analyzed the relationships among the measures with multiple correlationsusing Pearson product moment for the continuous variables and Spearman rho forthe categorical variables, which are shown in Table 2. The three reading measurescorrelated with the three sign language measures (r = .59–.70). The three readingmeasures further correlated with the print exposure measures, ART and MRT(r = .51–.77). The Gates–MacGinitie reading subtests also correlated with bookreading (r = .35). In addition, the three sign language measures correlated withthe MRT print exposure measure (r = .37–.52), and the ASL and MCE narrativecomprehension tasks correlated with the ART print exposure measure (r = .37 and.40, respectively). These correlations indicate that reading proficiency is relatedboth to sign language proficiency and print exposure, and importantly, that signlanguage proficiency is related to print exposure as well.
The only background measure to correlate with the reading measures wasnonverbal IQ (Stanford, r = .53; Gates–MacGinitie subtests, r = .39). NonverbalIQ, in addition, correlated with the sign language measures (r = .49–.56) andyears of education (r = .50). Neither years of education nor any hearing andspeech measure correlated with any reading or sign language measure.
The correlation results are thus consistent with the SR and LSR group contrastsin showing that reading ability is related to sign language proficiency. The corre-lation results further suggest that print exposure and nonverbal IQ may influencethe reading proficiency of deaf signers.
Reading achievement prediction
The crucial question is the extent to which ASL syntactic proficiency predictsEnglish reading ability. Because ASL grammar entails syntactic structures notfound in English, it has been hypothesized to impede, or be unrelated to, skilledreading in deaf signers. To measure the contribution of ASL syntactic proficiencyto English reading performance, we conducted stepwise regressions, one for eachreading test because they differed in salient ways. The Stanford comprehension
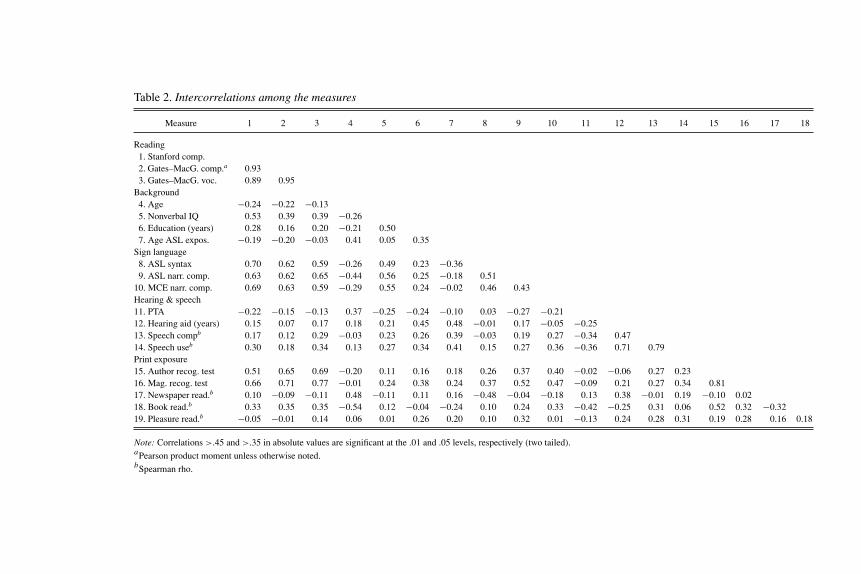
Table 2. Intercorrelations among the measures
Measure 1 2 3 4 5 6 7 8 9 10 11 12 13 14 15 16 17 18
Reading1. Stanford comp.2. Gates–MacG. comp.a 0.933. Gates–MacG. voc. 0.89 0.95
Background4. Age −0.24 −0.22 −0.135. Nonverbal IQ 0.53 0.39 0.39 −0.266. Education (years) 0.28 0.16 0.20 −0.21 0.507. Age ASL expos. −0.19 −0.20 −0.03 0.41 0.05 0.35
Sign language8. ASL syntax 0.70 0.62 0.59 −0.26 0.49 0.23 −0.369. ASL narr. comp. 0.63 0.62 0.65 −0.44 0.56 0.25 −0.18 0.51
10. MCE narr. comp. 0.69 0.63 0.59 −0.29 0.55 0.24 −0.02 0.46 0.43Hearing & speech11. PTA −0.22 −0.15 −0.13 0.37 −0.25 −0.24 −0.10 0.03 −0.27 −0.2112. Hearing aid (years) 0.15 0.07 0.17 0.18 0.21 0.45 0.48 −0.01 0.17 −0.05 −0.2513. Speech compb 0.17 0.12 0.29 −0.03 0.23 0.26 0.39 −0.03 0.19 0.27 −0.34 0.4714. Speech useb 0.30 0.18 0.34 0.13 0.27 0.34 0.41 0.15 0.27 0.36 −0.36 0.71 0.79Print exposure15. Author recog. test 0.51 0.65 0.69 −0.20 0.11 0.16 0.18 0.26 0.37 0.40 −0.02 −0.06 0.27 0.2316. Mag. recog. test 0.66 0.71 0.77 −0.01 0.24 0.38 0.24 0.37 0.52 0.47 −0.09 0.21 0.27 0.34 0.8117. Newspaper read.b 0.10 −0.09 −0.11 0.48 −0.11 0.11 0.16 −0.48 −0.04 −0.18 0.13 0.38 −0.01 0.19 −0.10 0.0218. Book read.b 0.33 0.35 0.35 −0.54 0.12 −0.04 −0.24 0.10 0.24 0.33 −0.42 −0.25 0.31 0.06 0.52 0.32 −0.3219. Pleasure read.b −0.05 −0.01 0.14 0.06 0.01 0.26 0.20 0.10 0.32 0.01 −0.13 0.24 0.28 0.31 0.19 0.28 0.16 0.18
Note: Correlations >.45 and >.35 in absolute values are significant at the .01 and .05 levels, respectively (two tailed).aPearson product moment unless otherwise noted.bSpearman rho.
Applied Psycholinguistics 29:3 380Chamberlain & Mayberry: ASL and reading
Table 3. Regression analyses predicting readingcomprehension
Step/Variable R2 �R2 F Ratio
Stanford comprehension1. Print exposure .439 .439 10.50**2. MCE narrative .627 .188 8.63**3. ASL syntax .758 .131 14.629***
Gates–MacGinitie comprehension1. Print exposure .507 .507 22.09***2. ASL syntax .655 .148 11.95**
Gates–MacGinitie vocabulary1. Print exposure .591 .591 32.931***2. ASL syntax .698 .107 9.905**
**p < .01. ***p < .001.
subtest was normed for deaf readers. The Gates–MacGinitie reading comprehen-sion subtest was normed for hearing readers. Although the same was true for theGates–MacGinitie vocabulary subtest, the nature of the task was different, specif-ically, inferring word meaning from sentence contexts rather than comprehendingpassages.
Following the same procedure for each regression, we controlled for nonverbalIQ by entering it on the first step. Next we controlled for the effects of printexposure by entering it on the second step. We used the MRT because it correlatedmore highly with reading performance than the ART; however, the results wereconsistent regardless of which print exposure measure was used (see Table 2).In the third step, we controlled for the effects of MCE narrative comprehensionbecause it has been argued to facilitate reading development, whereas ASL hasbeen argued to impede it. On the fourth and last step, we entered ASL syntacticproficiency to determine whether it made a unique contribution to reading per-formance, after the effects of nonverbal IQ, print exposure, and MCE narrativecomprehension were controlled.
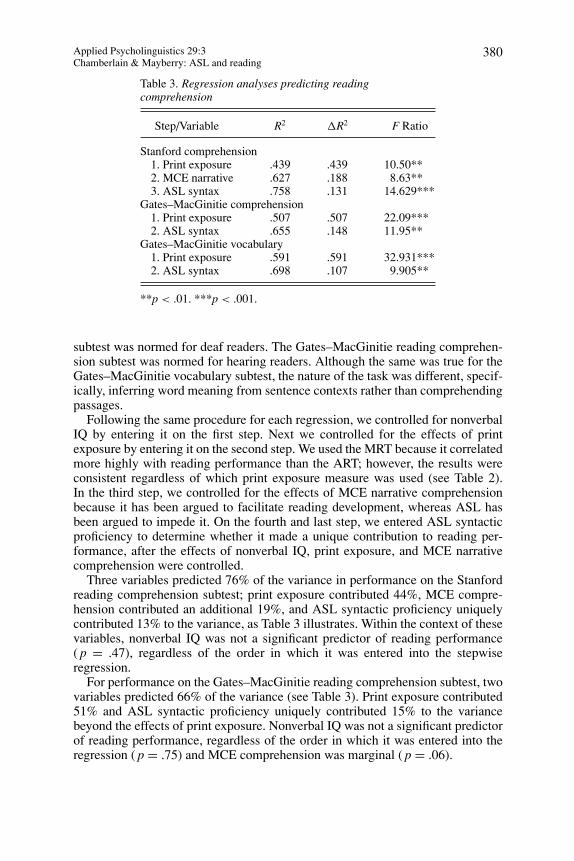
Three variables predicted 76% of the variance in performance on the Stanfordreading comprehension subtest; print exposure contributed 44%, MCE compre-hension contributed an additional 19%, and ASL syntactic proficiency uniquelycontributed 13% to the variance, as Table 3 illustrates. Within the context of thesevariables, nonverbal IQ was not a significant predictor of reading performance( p = .47), regardless of the order in which it was entered into the stepwiseregression.
For performance on the Gates–MacGinitie reading comprehension subtest, twovariables predicted 66% of the variance (see Table 3). Print exposure contributed51% and ASL syntactic proficiency uniquely contributed 15% to the variancebeyond the effects of print exposure. Nonverbal IQ was not a significant predictorof reading performance, regardless of the order in which it was entered into theregression ( p = .75) and MCE comprehension was marginal ( p = .06).
Applied Psycholinguistics 29:3 381Chamberlain & Mayberry: ASL and reading
Table 4. Regression analyses predicting sign language proficiency
Step/Variable R2 �R2 F Ratio
ASL syntax1. Age of ASL exposure .130 .130 11.704**2. Nonverbal IQ .391 .261 9.663**3. Print exposure .519 .128 7.138**
ASL narrative comprehension1. Age of ASL exposure .032 .032 5.823*2. Nonverbal IQ .354 .322 12.367**2. Print exposure .566 .212 13.132**
MCE narrative comprehension1. Nonverbal IQ .302 .302 9.922**2. Print exposure .422 .120 5.806*
*p < .05. **p < .01.
Regression results for the Gates–MacGinitie vocabulary subtest were similar.Two variables accounted for 70% of the variance (see Table 3). Print exposurecontributed 59% and ASL syntactic proficiency uniquely contributed 11% of thevariance in vocabulary knowledge beyond the effects of print exposure. Neithernonverbal IQ nor MCE narrative comprehension predicted vocabulary knowledgeregardless of the order in which they were entered into the regression ( p = .96and .19, respectively).
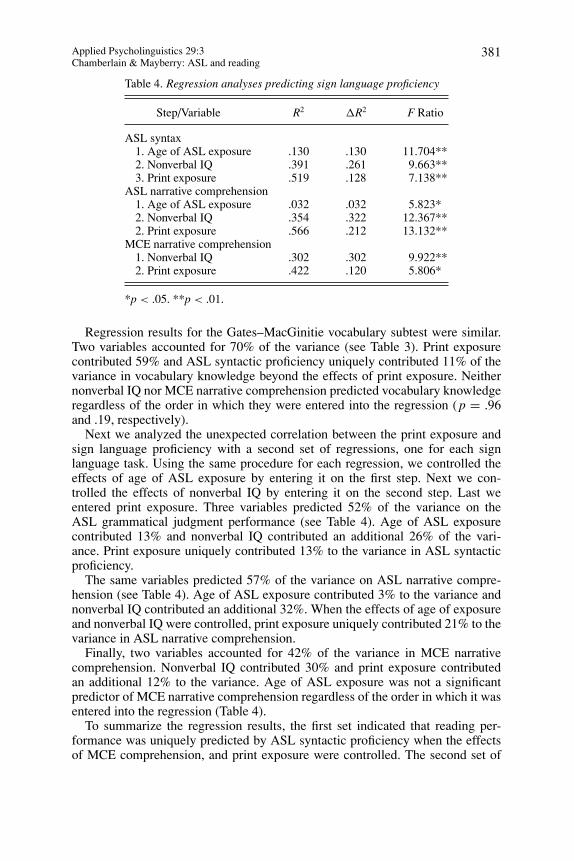
Next we analyzed the unexpected correlation between the print exposure andsign language proficiency with a second set of regressions, one for each signlanguage task. Using the same procedure for each regression, we controlled theeffects of age of ASL exposure by entering it on the first step. Next we con-trolled the effects of nonverbal IQ by entering it on the second step. Last weentered print exposure. Three variables predicted 52% of the variance on theASL grammatical judgment performance (see Table 4). Age of ASL exposurecontributed 13% and nonverbal IQ contributed an additional 26% of the vari-ance. Print exposure uniquely contributed 13% to the variance in ASL syntacticproficiency.
The same variables predicted 57% of the variance on ASL narrative compre-hension (see Table 4). Age of ASL exposure contributed 3% to the variance andnonverbal IQ contributed an additional 32%. When the effects of age of exposureand nonverbal IQ were controlled, print exposure uniquely contributed 21% to thevariance in ASL narrative comprehension.
Finally, two variables accounted for 42% of the variance in MCE narrativecomprehension. Nonverbal IQ contributed 30% and print exposure contributedan additional 12% to the variance. Age of ASL exposure was not a significantpredictor of MCE narrative comprehension regardless of the order in which it wasentered into the regression (Table 4).
To summarize the regression results, the first set indicated that reading per-formance was uniquely predicted by ASL syntactic proficiency when the effectsof MCE comprehension, and print exposure were controlled. The second set of
Applied Psycholinguistics 29:3 382Chamberlain & Mayberry: ASL and reading
regressions corroborated and extended these results. After the effects of age of ex-posure and nonverbal IQ were controlled, print exposure uniquely predicted ASLand MCE proficiency. These regression results show that nature of the relationshipbetween ASL proficiency and English reading is reciprocal.
DISCUSSION
We tested the hypothesis that sign language proficiency predicts reading ability ina sample of adults who were born deaf and used ASL as their primary language.Using Grade 8 as the criterion for skilled reading, we found the SR and theLSR groups to read at the 11th and 3rd grade levels, respectively. They differedprimarily with respect to three variables, sign language proficiency, print exposure,and nonverbal IQ. The regression results showed that nonverbal IQ was not asignificant predictor of reading proficiency, however. Skilled reading was predictedby a combination of print exposure and sign language proficiency. These resultsprovide evidence that the basis of reading in deaf signers is proficiency in theirthrough the air language, as we now explain.
First, the SR group showed higher levels of sign language proficiency than theLSR group. The SR group outperformed the LSR group on narrative comprehen-sion in ASL and MCE, and in grammatical judgment of ASL syntax. Performanceon all three sign language measures positively correlated with performance onall three reading tests. These results corroborate previous findings showing thatreading and sign language proficiency are correlated in deaf children who sign(Hoffmeister, 2000; Padden & Ramsey, 2000; Strong & Prinz, 1997). The presentresults extend these findings by showing that the positive relationship betweensign language proficiency and reading holds for readers who are deaf adults. Signlanguage proficiency thus shows a positive relationship to reading ability acrossthe lifespan.
Second, we found that reading ability correlated positively with print exposure.Performance on all three reading tests was predicted by print exposure. Printexposure reflects the frequency with which deaf signers read. We thus find acommonality between skilled readers who are deaf signers and those who arehearing speakers (Stanovich, 1986). Skilled readers read, regardless of whetherthey can hear or not, and regardless of whether their language is signed or spoken.Print exposure was not the only variable to predict reading ability in deaf adultsigners, however. After the effects of print exposure were controlled, we foundthat reading skill was uniquely predicted by ASL syntactic proficiency. Thus, ASLsyntactic proficiency plays a crucial role in the development of skilled reading ofdeaf signers. Skilled readers are proficient in the syntax of their primary language,even when it is a natural sign language.
A predictive relationship between reading and syntactic proficiency is not a newfinding. For example, syntactic ability predicted reading performance in a sampleof adults with average to below reading performance, R2 = .695 (Gottardo, Siegl,& Stanovich, 1997). Moreover, syntactic measures have been widely reported topredict the reading performance of hearing children (Catts et al., 1999; Leachet al., 2003; Scarborough, 1990). The novelty of the present finding is that thepredictive relationship between syntactic proficiency and reading performance is
Applied Psycholinguistics 29:3 383Chamberlain & Mayberry: ASL and reading
between two different languages in two different modalities, ASL and English.These results indicate that the linguistic basis of reading can be bilingual, andrelates to the phenomenon of being able to read a foreign language without theability to speak it, as learning to read a foreign language for degree requirements,or the ability to read languages that are no longer spoken such as Latin.
Third, another key result is that print exposure relates to sign language profi-ciency. Print exposure predicted performance on ASL grammatical judgment andASL and MCE narrative comprehension, to some degree. Among adult readerswho are deaf and sign, those with higher sign language proficiency (in compre-hending ASL and MCE narratives and making meta-linguistic judgments of ASLsyntax) showed higher reading frequency. At first glance a relationship betweenprint exposure and sign language proficiency seems counterintuitive. How canreading one language, such as English, boost proficiency in another language,such as ASL? In pondering the nature of this reciprocal relationship, it is impor-tant to consider three facts. First, ASL signers live, work, and are immersed in anEnglish milieu so that their read language is English, not ASL. Second, a recipro-cal relationship between print exposure and spoken language comprehension hasbeen well documented and reflects the fact that much vocabulary learning occursthrough the print medium (Stanovich, 1986). Thus, deaf readers learn vocabularyin print that they use in sign, and vice versa. ASL and English vocabulary overlaps,as it does for any two languages. Third, the reciprocal relationship between ASLand print exposure is consistent with previous research showing that print expo-sure bolsters a host of cognitive skills, including mathematics performance andnonverbal analogical reasoning (Stanovich & Cunningham, 1993). The reciprocallink between sign language and written language spans no greater a divide thanthat between written language and geometric analogies or mathematics. After all,sign language and written language are both instantiations of language.
Fourth and finally, and most logically, the predictive relationship of printexposure and sign language proficiency is the reverse of the predictive relationshipbetween sign language proficiency and reading performance. Skilled readersread; skilled readers are proficient comprehenders of through the air language.Proficient language comprehenders can become skilled readers. These findingsindicate that the linguistic basis of reading is bilingual and bimodal. The reciprocalrelationship of print exposure and spoken language encompasses the case of signlanguage as well.
If the linguistic basis of reading is bimodal and bilingual, then why is themedian reading level of the deaf population not higher? The probable reason,and the hypothesis motivating the present study, is that a significant proportion ofindividuals who are born deaf have underdeveloped language proficiency in anylanguage. In other research, we have found substantial variation in sign languagecomprehension among adults related to a variety factors including age of exposureand input (Mayberry, 2007; Mayberry & Lock, 2003; Mayberry, Lock, & Kazmi,2002). The present results suggest that the low median reading achievement re-ported for the deaf student population is due to incomplete language acquisition,signed or spoken. In other words, skilled deaf readers are proficient sign languagecomprehenders. Reading does not develop to skilled levels in the absence ofthrough the air language proficiency, as indicated by the present results and case
Applied Psycholinguistics 29:3 384Chamberlain & Mayberry: ASL and reading
studies of deaf adolescents who received sparse language sign language input inchildhood in their home countries prior to immigrating to North America. Theseexceptionally late learners of a first language show low levels of sign languagedevelopment and cannot read (Gates, 2002; Hargraves, 2002). An empirical ques-tion is whether some threshold level of syntactic and narrative proficiency isnecessary for the reciprocal bolstering of reading and language development tooccur.
The present results provide an initial characterization of the reading habits ofless-skilled, adult readers who are deaf. Although the mean reading level of theLSR group was Grade 3 to 4, they reported reading on a regular basis. They readnewspapers and read for pleasure like their peers with proficient reading skills. Itwould be a mistake to conclude that deaf adults with weak reading skills neverread nor benefit from it, just as hearing adults with weak reading skills have beenfound to read and profit from it (Stanovich & Cunningham, 1993). The inabilityto hear language increases the need to interact with print in daily life.
The present results also underscore how little we know about how deaf signerslearn to read. Educational practice based solely on how hearing children learn toread cannot harness the rich linguistic proficiency many deaf students bring tothe reading task in the form of sign language, and may discourage the search forlinguistic causes of reading problems unrelated to speech. Equally important, theseresults underscore the necessity of creating and validating measures of sign lan-guage proficiency. Not all signers are proficient in sign language comprehension,as the present results show, just as hearing speakers show wide variation in spokenlanguage comprehension. The link between sign language and reading cannot beinvestigated, either from a research or an educational standpoint, without adequatemeasures of sign language proficiency.
Language skills play a central and enduring role in the skilled reading of childrenwho hear and speak. The present results both confirm and extend theory by showingthat sign language proficiency plays a central and enduring role in the skilledreading of adults who do not hear and sign. The linguistic basis of reading isclearly bilingual and bimodal.
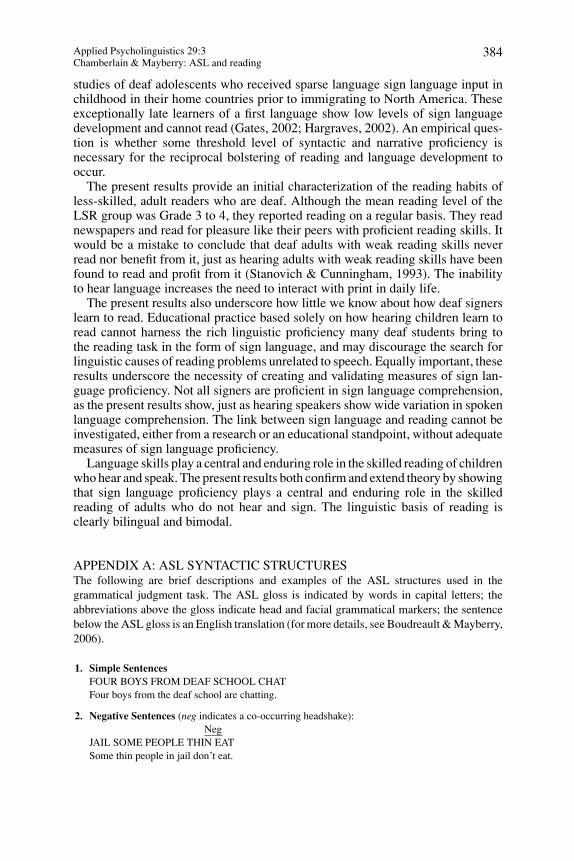
APPENDIX A: ASL SYNTACTIC STRUCTURESThe following are brief descriptions and examples of the ASL structures used in thegrammatical judgment task. The ASL gloss is indicated by words in capital letters; theabbreviations above the gloss indicate head and facial grammatical markers; the sentencebelow the ASL gloss is an English translation (for more details, see Boudreault & Mayberry,2006).
1. Simple Sentences
FOUR BOYS FROM DEAF SCHOOL CHATFour boys from the deaf school are chatting.
2. Negative Sentences (neg indicates a co-occurring headshake):Neg
JAIL SOME PEOPLE THIN EATSome thin people in jail don’t eat.
Applied Psycholinguistics 29:3 385Chamberlain & Mayberry: ASL and reading
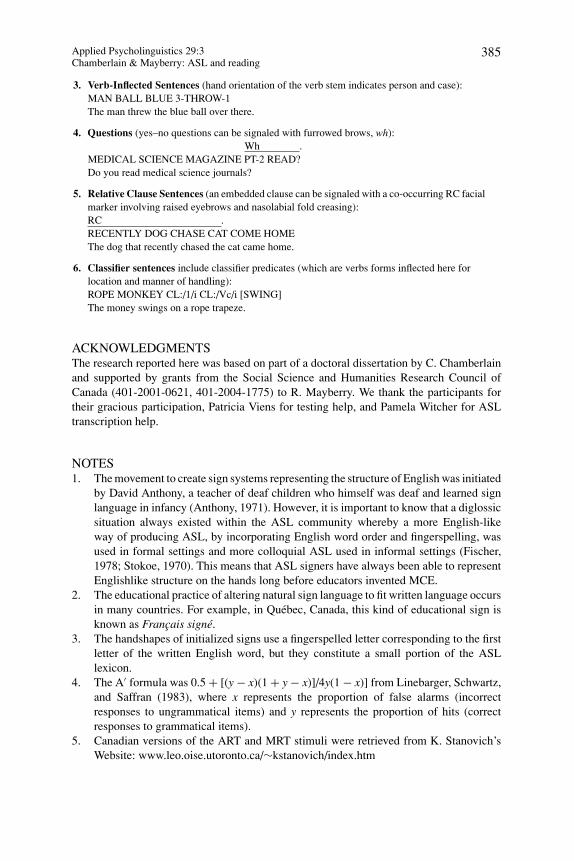
3. Verb-Inflected Sentences (hand orientation of the verb stem indicates person and case):MAN BALL BLUE 3-THROW-1The man threw the blue ball over there.
4. Questions (yes–no questions can be signaled with furrowed brows, wh):Wh .
MEDICAL SCIENCE MAGAZINE PT-2 READ?Do you read medical science journals?
5. Relative Clause Sentences (an embedded clause can be signaled with a co-occurring RC facialmarker involving raised eyebrows and nasolabial fold creasing):RC .RECENTLY DOG CHASE CAT COME HOMEThe dog that recently chased the cat came home.
6. Classifier sentences include classifier predicates (which are verbs forms inflected here forlocation and manner of handling):ROPE MONKEY CL:/1/i CL:/Vc/i [SWING]The money swings on a rope trapeze.
ACKNOWLEDGMENTSThe research reported here was based on part of a doctoral dissertation by C. Chamberlainand supported by grants from the Social Science and Humanities Research Council ofCanada (401-2001-0621, 401-2004-1775) to R. Mayberry. We thank the participants fortheir gracious participation, Patricia Viens for testing help, and Pamela Witcher for ASLtranscription help.
NOTES1. The movement to create sign systems representing the structure of English was initiated
by David Anthony, a teacher of deaf children who himself was deaf and learned signlanguage in infancy (Anthony, 1971). However, it is important to know that a diglossicsituation always existed within the ASL community whereby a more English-likeway of producing ASL, by incorporating English word order and fingerspelling, wasused in formal settings and more colloquial ASL used in informal settings (Fischer,1978; Stokoe, 1970). This means that ASL signers have always been able to representEnglishlike structure on the hands long before educators invented MCE.
2. The educational practice of altering natural sign language to fit written language occursin many countries. For example, in Quebec, Canada, this kind of educational sign isknown as Francais signe.
3. The handshapes of initialized signs use a fingerspelled letter corresponding to the firstletter of the written English word, but they constitute a small portion of the ASLlexicon.
4. The A′ formula was 0.5 + [(y − x)(1 + y − x)]/4y(1 − x)] from Linebarger, Schwartz,and Saffran (1983), where x represents the proportion of false alarms (incorrectresponses to ungrammatical items) and y represents the proportion of hits (correctresponses to grammatical items).
5. Canadian versions of the ART and MRT stimuli were retrieved from K. Stanovich’sWebsite: www.leo.oise.utoronto.ca/∼kstanovich/index.htm
Applied Psycholinguistics 29:3 386Chamberlain & Mayberry: ASL and reading
6. The media questions unfortunately did not probe frequency of subtitle reading dur-ing television and movie watching because this is another important source of printexposure for deaf readers.
REFERENCESAllen, T. E. (1986). Patterns of academic achievement among hearing impaired students: 1974 and
1983. In A. N. Schildroth & M. A. Karchmer (Eds.), Deaf children in America (pp. 161–206).San Diego, CA: College Hill Press.
Allen, T. E. (1994). Who are the deaf and hard-of-hearing students leaving high school and en-tering post-secondary education? Washington, DC: Gallaudet University, Pelavin ResearchInstitute.
Anthony, D. (1971). Seeing essential English. Anaheim, CA: Anaheim Union High School District,Educational Services Division.
Boudreault, P., & Mayberry, R. I. (2006). Grammatical processing in American Sign Language: Ageof first-language acquisition effects in relation to syntactic structure. Language and CognitiveProcesses, 21, 608–635.
Bragg, B., & Bergman, E. (1981). Tales from a clubroom. Washington, DC: Gallaudet University Press.Catts, H. W., Fey, M. E., Tomblin, J. B., & Zhang, X (2002). A longitudinal investigation of reading
outcomes in children with language impairments. Journal of Speech, Language, and HearingResearch, 45, 1142–1157.
Catts, H. W., Fey, M. E., Zhang, X., & Tomblin, J. B. (1999). Language basis of reading and readingdisabilities: Evidence from a longitudinal investigation. Scientific Studies of Reading, 3, 331–361.
Chamberlain, C., & Mayberry, R. I. (2000). Theorizing about the relationship between ASL andreading. In C. Chamberlain, J. Morford, & R. I. Mayberry (Eds.), Language acquisition by eye(pp. 221–260). Mahwah, NJ: Erlbaum.
Dickenson, D. K., & McCabe, A. (2001). Bringing it all together: The multiple origins, skills, andenvironmental supports of early literacy. Learning Disabilities Research and Practice, 16,186–202.
Dickenson, D. K., McCabe, A., L. Anastasopoulos, Peisner-Feinberg, E. S., & Poe, D. M. (2003).The comprehensive language approach to early literacy: The interrelationships among vocab-ulary, phonological sensitivity, and print knowledge among preschool-aged children. Journalof Educational Psychology, 95, 465–481.
Emmorey, K. (2002). Language, cognition, and the brain. Mahwah, NJ: Erlbaum.Fischer, S. D. (1978). Sign language and creoles. In P. Siple (Ed.), Understanding language through
sign language research (pp. 309–331). New York: Academic Press.Gates, A. (2002). The effects of delayed first-language exposure on language acquisition: A case study.
Unpublished Masters Thesis. McGill University.Geers, A. E., & Moog, J. S. (1987). Predicting spoken language acquisition of profoundly hearing-
impaired children. Volta Review, 89, 69–86.Gottardo, A., Siegel, L. S., & Stanovich, K. E. (1997). The assessment of adults with reading disabilities:
What can we learn from experimental tasks? Journal of Research in Reading, 20, 42–54.Hanson, V. L., & Flowler, C. A. (1987). Phonological coding in word reading: Evidence from hearing
and deaf readers. Memory and Cognition, 15, 199–207.Hargraves, L. M. (2002). The linguistic system of a deaf language learner: Examining the effects of
delayed language exposure. Unpublished masters thesis, McGill University.Hoffmeister, R. (2000). A piece of the puzzle: ASL and reading comprehension in deaf children. In C.
Chamberlain, J. P. Morford, & R. I. Mayberry (Eds.), Language acquisition by eye. Mahwah,NJ: Erlbaum.
Hoover, W. A., & Gough, P. B. (1990). The simple view of reading. Reading and Writing: AnInterdisciplinary Journal, 2, 127–160.
Karchmer, M. A., & Mitchell, R. E. (2003). Demographic and achievement characteristics ofdeaf and hard-of-hearing students. In M. Marschark & P. Spencer (Eds.), Oxford hand-book of deaf studies, language, and education (pp. 21–37). New York: Oxford UniversityPress.
Applied Psycholinguistics 29:3 387Chamberlain & Mayberry: ASL and reading
LaSasso, C., & Davey, B. (1987). The relationship between lexical knowledge and reading com-prehension for prelingually, profoundly hearing-impaired students. Volta Review, 89, 211–220.
Leach, J. M., Scarborough, H. S., & Rescorla, L. (2003). A longitudinal investigation of readingoutcomes in children with language impairments. Journal of Speech, Language, and HearingResearch, 45, 1142–1157.
Linebarger, M., Schwartz, M., & Saffran, E. (1983). Sensitivity to grammatical structure in so-calledagrammatic aphasics. Cognition, 13, 361–392.
MacGinitie, W. H., & MacGinitie, R. K. (1992). Gates–MacGinite reading tests (2nd Canadian ed.).Scarborough, Canada: ITP Nelson.
MacSweeney, M., Woll, B., Campbell, R., McGuire, P., David, A. S., Williams, S. C. R., et al. (2002).Neural systems underlying British Sign Language and audio-visual English processing in nativeusers. Brain, 125, 1583–1593.
Mayberry, R. I. (2007). When timing is everything: Age of first-language acquisition effects onsecond-language learning. Applied Psycholinguistics, 28, 537–549.
Mayberry, R. I., & Lock, E. (2003). Age constraints on first versus second language acqui-sition: Evidence for linguistic plasticity and epigenesis. Brain and Language, 87, 369–383.
Mayberry, R. I., Lock, E., & Kazmi, H. (2002). Linguistic ability and early language exposure. Nature,417, 38.
Mayer, C., & Wells, G. (1996). Can the linguistic interdependence theory support a bilingual–biculturalmodel of literacy education for deaf students? Journal of Deaf Studies and Deaf Education, 4,1–8.
Moores, D. F., & Sweet, C. (1990). Relationships of English grammar and communicative fluency inreading in deaf adolescents. Exceptionality, 1, 97–106.
Nation, K., & Snowling, M. J. (2004). Beyond phonological skills: Broader language skills contributeto the development of reading. Journal of Research in Reading, 27, 342–356.
Padden, C., & Ramsey, C. (2000). American Sign Language and reading ability in deaf children. In C.Chamberlain, J. P. Morford, & R. I. Mayberry (Eds.), Language acquisition by eye. Mahwah,NJ: Erlbaum.
Perfetti, C. A., & Sandak, R. (2000). Reading optimally builds on spoken language: Implications fordeaf readers. Journal of Deaf Studies and Deaf Education, 5, 32–50.
Perlmutter, D. (2008). Nobilior est vulgaris: Dante’s hypothesis and sign language poetry. To appear inD. DeLuca, K. Lindgren, & D. J. Napoli (Eds.), Signs and voices: Language, arts, and identifyin the Deaf community. Washington, DC: Gallaudet University Press.
Petitto, L. A., Zatorre, R. J., Gauna, K., Nikelski, E. J., Dostie, D., & Evans, A. C., et al. (2000). Speech-like cerebral activity in profoundly deaf people processing signed languages: Implications forthe neural basis of human language. Proceedings of the National Academy of Sciences USA97, 13961–13966.
Poizner, H., Klima, E. S., & Bellgui, U. (1987). What the hands reveal about the brain. Cambridge,MA: MIT Press.
Psychological Corporation. (1995). The Stanford Achievement Test (9th ed.). San Antonio, TX:Harcourt Brace Educational Measurement.
Quigley, S. P., & Paul, P. V. (1989). English language development. In M. C. Wang, M. C. Reynolds,& H. J. Walberg (Eds.), The handbook of special education: Research and practice (Vol. 3,pp. 3–21). Oxford: Pergamon Press.
Roth, F. P., Speece, D. L., & Cooper, D. H. (2002). A longitudinal analysis of the connectionbetween oral language and early reading. The Journal of Educational Research, 95, 259–272.
Sandler, W., & Lillo-Martin, D. (2006). Sign language and linguistic universals. Cambridge:Cambridge University Press.
Scarborough, H. S. (1990). Very early language deficits in dyslexic children. Child Development, 61,1728–1743.
Schick, B., & Moeller, M. P. (1992). What is learnable in manually coded English sign systems?Applied Psycholinguistics, 3, 313–340.
Stanovich, K. E. (1986). Matthew effects in reading: Some consequences of individual differences inthe acquisition of literacy. Reading Research Quarterly, 21, 360–407.
Applied Psycholinguistics 29:3 388Chamberlain & Mayberry: ASL and reading
Stanovich, K. E., & Cunningham, A. E. (1993). Where does knowledge come from? Specific associa-tions between print exposure and information acquisition. Journal of Educational Psychology,85, 211–229.
Stanovich, K. E., & West, R. F. (1989). Exposure to print and orthographic processing. ReadingResearch Quarterly, 24, 402–433.
Stein, N. L. (1979). How children understand stories: A developmental analysis. In L. G. Katz &M. Z. Glockner, C. Watkins, & M. J. Spencer (Eds.), Current topics in early childhood education(Vol. II, pp. 261–290). Norwood, NJ: Ablex.
Stokoe, W. (1970). Sign language diglossia. Studies in Linguistics, 21, 27–41.Strich, T. G., & James, J. H. (1984). Listening and reading. In P. D. Pearson (Ed.), Handbook of reading
research (pp. 293–317). New York: Longman.Strong, M., & Prinz, P. M. (1997). A study of the relationship between American Sign Language and
English literacy. Journal of Deaf Studies and Deaf Education, 2, 37–46.Statistics Canada. (1996). Reading the future: A portrait of literacy in Canada. Ottawa: Author.Traxler, C. B. (2000). The Stanford Achievement Test (9th ed.). National norming and performance
standards for deaf and hard-of-hearing students. Journal of Deaf Studies and Deaf Education,5, 337–348.
Waters, G. S., & Doehring, D. G. (1990). Reading acquisition in congenitally deaf children whocommunicate orally: Insights from an analysis of component reading, language and memoryskills. In T. Carr & B. Levy (Eds.), Reading and its development: Component skills approaches(pp. 323–373). New York: Academic Press.
Weber-Fox, C. M., & Neville, H. J. (1996). Maturational constraints on functional specializations forlanguage processing: ERP and behavioral evidence in bilingual speakers. Journal of CognitiveNeuroscience, 8, 231–256.
Wechsler, D. (1981). Weschler Adult Intelligence Scale—Revised. New York: Harcourt BraceJovanovich.
Wolk, S., & Schildroth, A. N. (1986). Deaf children and speech intelligibility: A national survey. In A.N. Schildroth & M. A. Karchmer (Eds.), Deaf children in America (pp. 139–159). San Diego,CA: College–Hill Press.