Embed Size (px)
Citation preview

AMERICAN ASSOCIATION OF WINE ECONOMISTS
AAWE WORKING PAPER No. 216
Economics
WINE AND CHEESE:
TWO PRODUCTS OR ONE ASSOCIATION? A NEW METHOD FOR ASSESSING WINE-CHEESE PAIRING
Mara V. Galmarini, Lucie Dufau, Anne Loiseau,
Michel Visalli, and Pascal Schlich
June 2017
www.wine-economics.org

AAWEWorkingPapersarecirculatedfordiscussionandcommentpurposes.Theyhavenotbeensubjecttoapeerreviewprocess.Theviewsexpressedhereinarethoseoftheauthor(s)anddonotnecessarilyreflecttheviewsoftheAmericanAssociationofWineEconomistsAAWE.
©2017bytheauthor(s).Allrightsreserved.Shortsectionsoftext,nottoexceedtwoparagraphs,maybequotedwithoutexplicitpermissionprovidedthatfullcredit,including©notice,isgiventothesource.
1
Wine and cheese: two products or one association? A new method for assessing wine-cheese pairing
Mara V. Galmarini1,2,3, Lucie Dufau1,4, Anne Loiseau1, Michel Visalli, 1 and Pascal Schlich1
1Centre des Sciences du Goût et de l'Alimentation, CNRS, INRA, Université de Bourgogne Franche-Comté, F-21000 Dijon, France. E-Mail : [email protected] 2 CONICET, Buenos Aires, Argentina 3 Facultad de Ingeniería y Ciencias Agrarias, Pontificia Universidad Católica Argentina, Buenos Aires, Argentina 4AgroParisTech, Massy, France
Abstract
The aim of this study was to identify which attributes impacted the dynamic liking of
cheese and wine individually as well as when consumed together. Three wines (a white one,
Pouilly Loché; and two red ones Maranges and Beaujolais) and three cheeses (Comté,
Époisses, Chaource) were individually evaluated by a group of 60 consumers using mono-
intake Temporal Dominance of Sensations (TDS) with simultaneous hedonic ratings. The
same data acquisition screen was used for all products showing a unique list of 14 descriptors
(covering cheese and wine perception) and a hedonic scale for dynamical rating of liking. The
dynamic hedonic data was associated to the TDS profiles obtaining Temporal Drivers of
Liking (TDL). The nine wine-cheese associations were evaluated by multi-bite and multi-sip
TDS, consumed in a free manner. Individually, Chaource had practically no TDL, in Comté
mushroom flavor was a positive TDL, and in Epoisses salty was a negative TDL. All wines
presented TDL, but negative were only present in the red ones: bitter, sour and astringent. In
wines, the positive TDL were: fruity, spicy and woody. Dynamic perception changes had a
bigger impact on liking in wine compared to cheese. For the associations, the negative TDL
were only three and mostly wine related: sour (for 7/9 combinations), bitter (6/9) and
astringent (5/9). Positive TDL were more varied (a total of 10 descriptors) and were related
either to wine or cheese. As opposed to what was found in cheese alone, salty was a positive
TDL in two of the combinations. It was observed that the dynamic sensory perception had a
more important impact on liking in wine-cheese combinations than when consumed
separately. This shows that TDS and TDL have a big potential in the study of food pairing
which should be further exploited.

2
1. Introduction
Wine and cheese, are not only emblematic products of the French gastronomic culture,
but also fundamental to the country’s economy. Even though worldwide competition is
strong, 17% of the world’s wine production comes from France (OIV, 2014); wine exports
represented, in 2015, 7.9 billions to the French economy (www.vinetsociete.fr). As for cheese,
France is the third biggest producer worldwide, after USA and Germany (www.insee.fr).
Other than this big market share, these two products have another thing in common: they are
both obtained by a fermentation process. Fermentation was one of the earliest forms of food
preservation, so this might be one of the reasons why they have long been consumed together,
a natural match providing a safe source of complete protein along with a thirst-quenching
liquid (King and Cliff, 2005).
After this long history side by side, numerous recommendations can be found in the
gastronomic, culinary and popular literature on what makes a “good” or “bad” wine-cheese
combination. However, in the scientific field of sensory evaluation and consumer science, few
research papers can be found on wine and cheese pairing (Harrington and Hammond, 2005,
King and Cliff, 2005, Harrington and Hammond, 2007, Bastian et al., 2009, Bastian et al.,
2010, Harrington et al., 2010). Needless to say, food and beverage pairings are complex
stimuli which can be challenging to rate in a consistent manner both by experts and naïve
consumers (Paulsen et al., 2015). There can be a high variation among judges related to
personal expectation or preference associated with the suitability of wine for a certain cheese
(King and Cliff, 2005). Given the importance of these products from an economic and cultural
point of view, and taking into account the immense variation of brands, elaboration
procedures, taste, pricing, etc.; understanding how one can enhance, or not, the perception of
the other and knowing what makes a “good” wine-cheese pair can be key for product
marketing. But it is evident so far, that traditional evaluation methods are not enough to get
this information.
The few sensory works which can be found explaining why one combination should
be favored over another one (Nygren et al., 2003b, Nygren et al., 2003a, Nygren et al., 2002,
Harrington et al., 2010, Harrington and Hammond, 2005, King and Cliff, 2005) present
classic descriptive analysis methods (e.g. Quantitative Descriptive Analysis) which evaluate
only one specific moment of the tasting (usually the final impression) giving a static global
measurement. But it is known that sensory perception is a dynamic phenomenon, widely

3
affected by mastication, volatile release, aftertaste and it requires a more complex
methodology to better understand what consumers actually perceive.
Temporal Dominance of Sensation (TDS) (Pineau et al., 2009) is a temporal multi-
dimensional sensory method which consists in presenting to the tasters a list of descriptors
from which they can choose the one they consider dominant at every moment of tasting.
“Dominant” is defined as the sensation which triggers their attention at every given moment
of the tasting. Using this dynamic technique, rather than a traditional profiling method, allows
to find out how the dominant sensations perceived during wine-cheese consumption change in
terms of duration (time in seconds during which the sensation is dominant) and/or
sequentiality, widening the knowledge on the complete sensory experience.
It is also known that experts and consumers, especially in the wine sector, might not
have the same opinion on a product (Hopfer and Heymann, 2014): that which might be
relevant for experts might not be so for consumers. Working on wine TDS description,
Brachet et al. (2014) found that consumers were as discriminant as experts, but that the
obtained profiles of ones and the others were not the same, showing that what is dominant
changes from consumers to experts. This revealed the importance of working directly with
consumers. Moreover, it has been shown that TDS provides an intuitive response needing
almost no training since no scaling is used and it can be effectively used by consumers
(Schlich, 2013, Brachet et al., 2014, Thomas et al., 2015).
Another advantage of using consumers to evaluate the product is that TDS can be
coupled with a hedonic response. This means that consumers describe what they perceive and
rate their level of liking in the same session (Thomas et al., 2014, Thomas and Schlich, 2014).
This can be done after every wine sip (Galmarini et al., 2016) or in simultaneous with the
TDS evaluation. This makes it possible to associate hedonic temporal data and descriptive
temporal data (TDS profiles), identifying temporal drivers of liking, that is to say, attributes
which when cited as dominant lead to an increase or a decrease of liking (Thomas et al.,
2015). This dynamic evaluation of liking drivers is definitely more in line with the normal
way of eating, but it is seldom used due to the complexity of the obtained data.
Delarue and Blumenthal (2015) have lately pointed out that sensory evaluation should
evolve towards more realistic experiments in regards to consumption episodes notably by
taking into account more than one bite or sip of the product. In relation to this, TDS has also
been used to evaluate successive intakes such as multi-bite or multi-sip working with
consumers (Schlich et al., 2013, Galmarini et al., 2015). In a recent work (which was part of
this same research project), Galmarini et al (2016) evaluated the impact of cheese on wine
4
perception and liking over consecutive wine sips. Focusing only on wine description, it was
found that cheese had either a positive or no impact on temporal wine perception and
appreciation; but none of the cheeses had a negative impact on wine. However, no dynamic
study on the pairing was done in this mentioned work.
A good food-wine duo might be considered that in which no product dominates over
the other (Nilsen & Öström, 2013); or that in which new sensations are created. By definition,
a pair is something consisting of two parts joined together. In this way, evaluation of two
products as a whole, almost in a simultaneous manner, is a natural step forward for describing
perception of a food pair. Following this hypothesis, it was the aim of the present work to
identify which attributes impacted the dynamic liking of cheese and wine individually as well
as when consumed together over several sips and bites. This would allow to have a real close
look to what consumers perceive, and to better understand why they like - or dislike - a
certain wine-cheese couple.
2. Materials and Methods
2.1 Samples
Three different cheeses (Table 1) and three different wines (Table 2) were used to in
the present study. They were regional products which allowed working with the association of
two products which shared terroir.
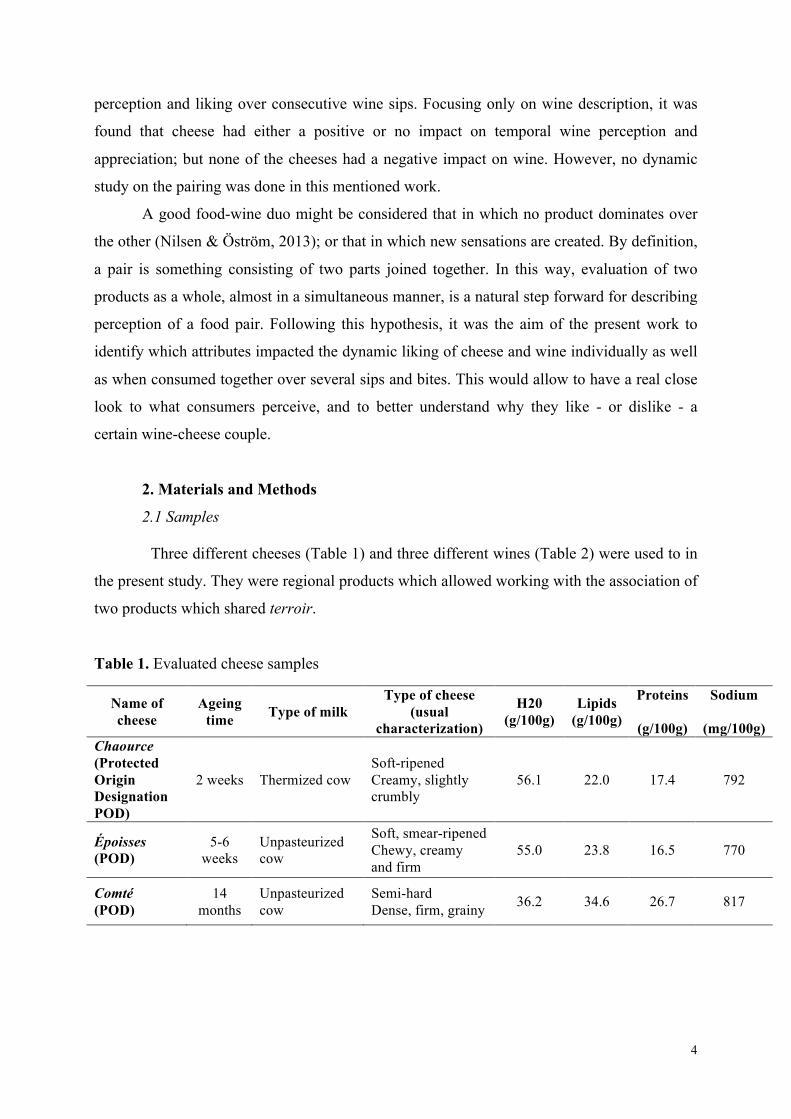
Table 1. Evaluated cheese samples
Name of cheese
Ageing time Type of milk
Type of cheese (usual
characterization)
H20 (g/100g)
Lipids (g/100g)
Proteins
(g/100g)
Sodium
(mg/100g) Chaource (Protected Origin Designation POD)
2 weeks Thermized cow Soft-ripened Creamy, slightly crumbly
56.1 22.0 17.4 792
Époisses (POD)
5-6 weeks
Unpasteurized cow
Soft, smear-ripened Chewy, creamy and firm
55.0 23.8 16.5 770
Comté (POD)
14 months
Unpasteurized cow
Semi-hard Dense, firm, grainy 36.2 34.6 26.7 817
5
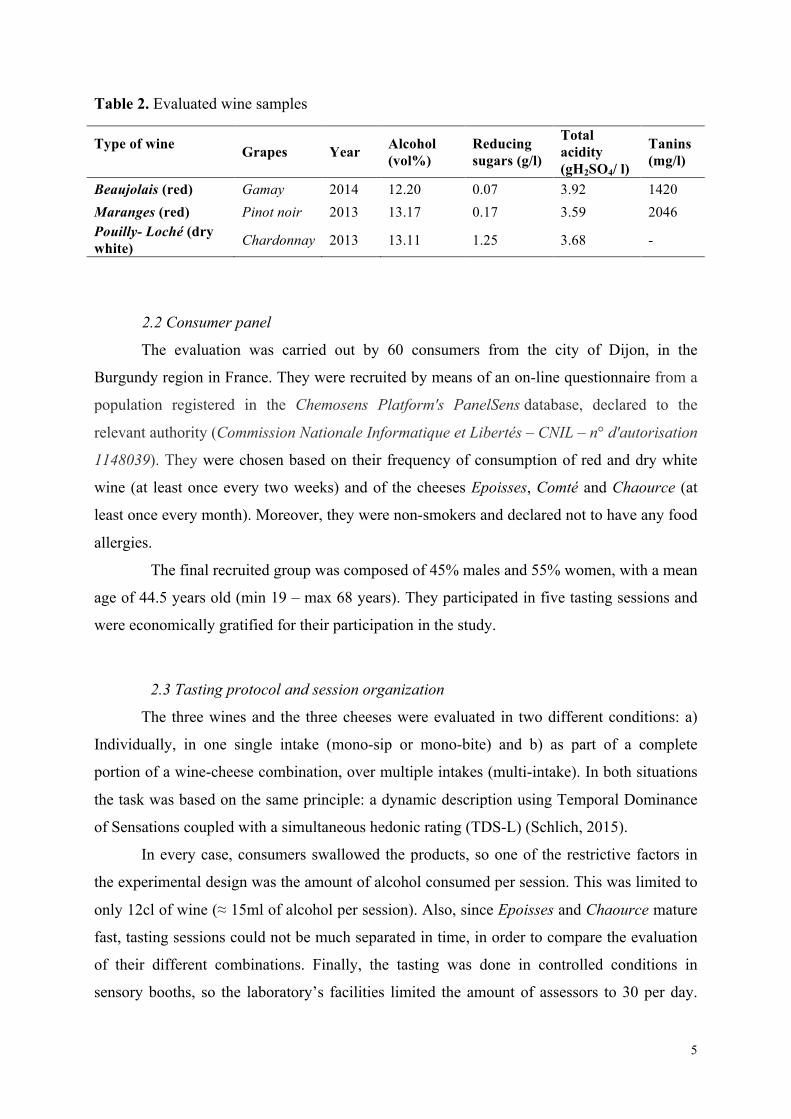
Table 2. Evaluated wine samples
Type of wine Grapes Year Alcohol
(vol%) Reducing sugars (g/l)
Total acidity (gH2SO4/ l)
Tanins (mg/l)
Beaujolais (red) Gamay 2014 12.20 0.07 3.92 1420 Maranges (red) Pinot noir 2013 13.17 0.17 3.59 2046 Pouilly- Loché (dry white) Chardonnay 2013 13.11 1.25 3.68 -
2.2 Consumer panel
The evaluation was carried out by 60 consumers from the city of Dijon, in the
Burgundy region in France. They were recruited by means of an on-line questionnaire from a
population registered in the Chemosens Platform's PanelSens database, declared to the
relevant authority (Commission Nationale Informatique et Libertés – CNIL – n° d'autorisation
1148039). They were chosen based on their frequency of consumption of red and dry white
wine (at least once every two weeks) and of the cheeses Epoisses, Comté and Chaource (at
least once every month). Moreover, they were non-smokers and declared not to have any food
allergies.
The final recruited group was composed of 45% males and 55% women, with a mean
age of 44.5 years old (min 19 – max 68 years). They participated in five tasting sessions and
were economically gratified for their participation in the study.
2.3 Tasting protocol and session organization
The three wines and the three cheeses were evaluated in two different conditions: a)
Individually, in one single intake (mono-sip or mono-bite) and b) as part of a complete
portion of a wine-cheese combination, over multiple intakes (multi-intake). In both situations
the task was based on the same principle: a dynamic description using Temporal Dominance
of Sensations coupled with a simultaneous hedonic rating (TDS-L) (Schlich, 2015).
In every case, consumers swallowed the products, so one of the restrictive factors in
the experimental design was the amount of alcohol consumed per session. This was limited to
only 12cl of wine (≈ 15ml of alcohol per session). Also, since Epoisses and Chaource mature
fast, tasting sessions could not be much separated in time, in order to compare the evaluation
of their different combinations. Finally, the tasting was done in controlled conditions in
sensory booths, so the laboratory’s facilities limited the amount of assessors to 30 per day.
6
Taking all this into consideration, the evaluation of the six products and the nine combinations
took place over five one-hour long sessions. In each session consumers tasted: one sample of
cheese in mono-bite (6±0.5g), one sample of wine in mono-sip (1cl) and two portions of
wine-cheese combinations (5cl of wine and 30g of cheese for each combination) which
consumers could eat in as many intakes as they wanted, beginning by one or the other
product, alternating them more or less regularly in their own personal manner. During the first
session the tasting method and the attributes to be used were presented. Details on the
complete sensory method used are given in the subsections below.
2.3.1 Familiarization with the method
Based on previous experiments, 14 sensory attributes were chosen (Table 3) covering
basic tastes, textures and aromatic families. It should be noted that some of these aromatic
families (e.g.: fruity), could be used for the wines as well as for the cheeses. The definitions
presented in Table 3 were given to consumers together with several examples.
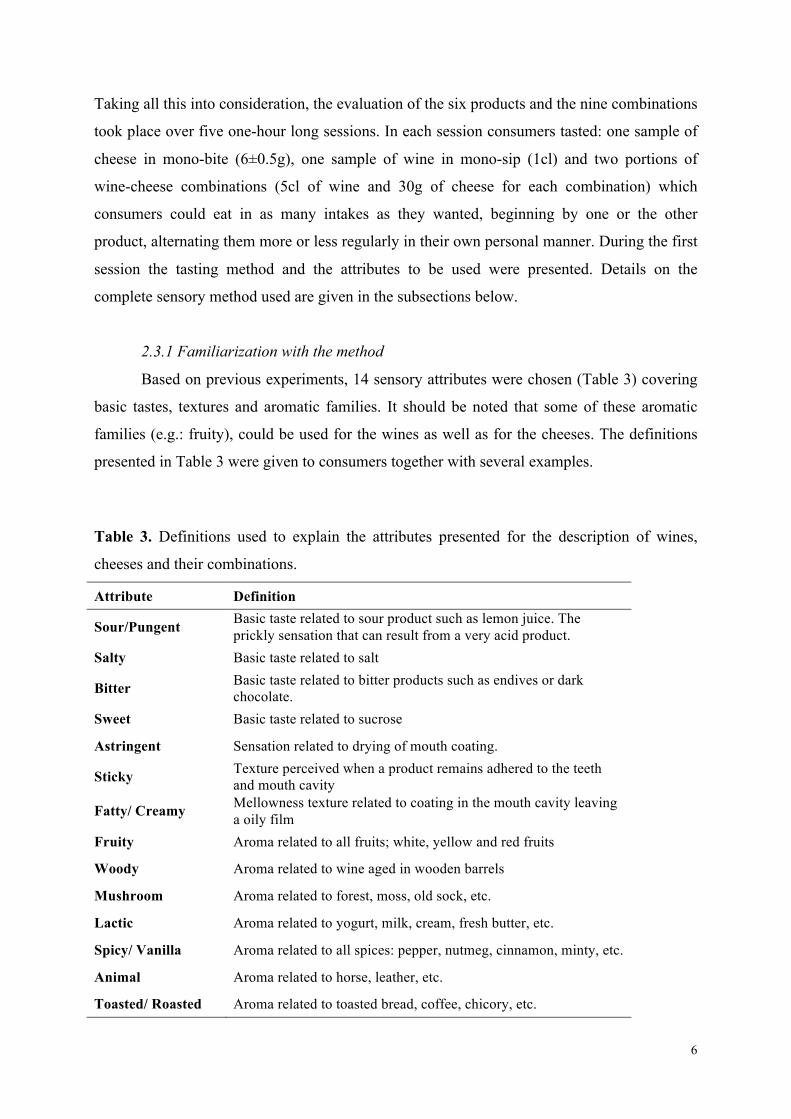
Table 3. Definitions used to explain the attributes presented for the description of wines,
cheeses and their combinations.
Attribute Definition
Sour/Pungent Basic taste related to sour product such as lemon juice. The prickly sensation that can result from a very acid product.
Salty Basic taste related to salt
Bitter Basic taste related to bitter products such as endives or dark chocolate.
Sweet Basic taste related to sucrose
Astringent Sensation related to drying of mouth coating.
Sticky Texture perceived when a product remains adhered to the teeth and mouth cavity
Fatty/ Creamy Mellowness texture related to coating in the mouth cavity leaving a oily film
Fruity Aroma related to all fruits; white, yellow and red fruits
Woody Aroma related to wine aged in wooden barrels
Mushroom Aroma related to forest, moss, old sock, etc.
Lactic Aroma related to yogurt, milk, cream, fresh butter, etc.
Spicy/ Vanilla Aroma related to all spices: pepper, nutmeg, cinnamon, minty, etc.
Animal Aroma related to horse, leather, etc.
Toasted/ Roasted Aroma related to toasted bread, coffee, chicory, etc.

7
A short presentation was given to explain the tasting method. Consumers were
instructed that a dominant sensation was the one which caught their attention at a given
moment, not necessarily the most intense. Moreover, they were instructed that if no sensation
was more important than another one, they could indicate it using a “Nothing dominates”
attribute which was also present in the list to be used.
In order to conclude the training, the first tasting was done on a commercial French
cheese (Comté, Le Montarlier, Président) and commercial French wine (Macôn Villages,
2013) which were evaluated individually and then as a combination. The obtained data was
only used to verify that consumers had understood the task (data not shown).
2.3.2 Used sensory method
All data was acquired by means of the on-line software TimeSens 1.0 (INRA, Dijon,
France) using a protocol based on TDS, with simultaneous evaluation of liking (TDS-L)
(Schlich, 2015). For each type of product(s) (wine, cheese and wine-cheese combinations)
consumers had to indicate the dominant sensation at each moment of the tasting and also give
their level of liking all along the evaluation. This had for purpose obtaining the dynamic
description and liking score(s) of the products when consumed alone to then better understand
their role in the perception and appreciation of the combinations. Doing a descriptive and a
hedonic task at the same time can be considered a controversial approach. However, we
believe that when evaluating a combination of products, this protocol provided consumers the
possibility of eating in a somewhat traditional manner, being able to state at every moment
their liking (whether it changed or not) without being interrupted at fixed moments.
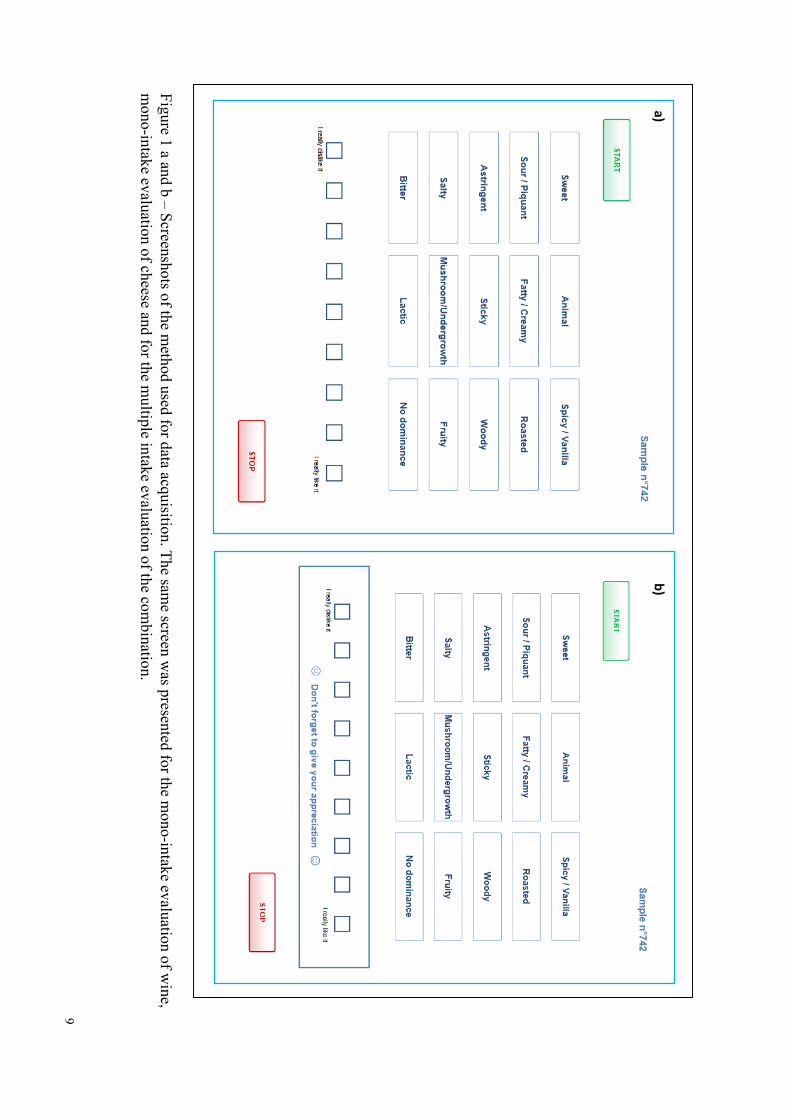
Consumers were instructed to click on the “START” button (Figure 1 a and b) and to
place the sample in their mouth almost at the same time. Then, they could successively select
the descriptors that most triggered their attention. Whether products were evaluated
individually or as a combination, the same list of 14 attributes was available for the evaluation
(Table 3). The descriptor order was randomized across consumers (Pineau et al., 2012) but
each consumer had the same order for all evaluations. Consumers could select one attribute at
a time and change as many times as they wanted whenever a new sensation became dominant.
The clicked attribute stayed highlighted as dominant until the following one was selected.
8
At the same time, consumers were asked to rate their liking on a discrete 9-point
hedonic scale in a dynamic way, as many times as they wanted. The given liking grade
disappeared after 5 seconds to encourage re-notation. Also, a reminder popped-up every 20
seconds indicating consumers not to forget to give their appreciation (Figure 1b). However,
re-notating was not mandatory. The evaluation ended by clicking on the “STOP” button; there
was no pre-established time limit.
Products and combinations were coded with random three-digit numbers and were
presented following a Williams Latin Square, by session. In every case, wine samples were
presented in black wine glasses while cheese samples were presented in small plastic plates
with a fork.
9
Figure 1 a and b – Screenshots of the method used for data acquisition. The sam
e screen was presented for the m
ono-intake evaluation of wine,
mono-intake evaluation of cheese and for the m
ultiple intake evaluation of the combination.
a)b)

10
2.4 Data analysis
2.4.1 Consumer behavior in relation to the sensory protocol
The performance of consumers on the TDS evaluation was analyzed in terms
of the following parameters: number of different descriptors used (ND), total number of
clicks done (NC), time before the first citation (TBFC) and duration of the evaluation
(DE). As for the hedonic task the time before the first liking note (TBFL) and the total
number of liking ratings given (NL) were evaluated.
For individual evaluation of products, the analysis was done according to the
following ANOVA model:
Parameter = Product + Subject; subject being a random factor.
In the case of the combinations, wine and cheese were included as two
different factors, while Subject and its interactions with wine and cheese were random
factors.
Parameter = Wine + Cheese + Subject + Wine*Cheese + Wine*Subject +
Cheese*Subject.
Analyses were done using the softwares TimeSens (INRA, Dijon, France) and
R 3.0.3 (R Core Team, 2014).
2.4.2 Temporal characterization of products and combinations
Differences among products and combinations were evaluated in terms of the
proportional duration of the dominant sensations. For this purpose, the total duration of
the evaluations were standardized making the duration of each dominant attribute
represents a percentage of the total time of the evaluation (Galmarini et al., 2017).
Following standardization, ANOVA/MANOVA tests were carried out by descriptor
according to the models:
(i) Duration = Subject + Product
For the individual wine and cheese evaluations, where duration represented
the standardized duration of each recorded descriptor, product was either the wines or
the cheeses and Subject was a random factor.
(ii) Duration = Subject + Wine + Cheese + Wine*Cheese + Subject*
Wine + Subject* Cheese
For the evaluated combinations, where duration represented the
standardized duration of each recorded descriptor and Subject and its interactions with
wine and cheese were random effects.
11
In case of significant differences (p<10%) a Fisher’s Least Significant
Difference test (LSD) was carried out.
Analyses were done using the softwares TimeSens (INRA, Dijon, France) and R
Core Team (2014).
2.4.3 Temporal appreciation of products and their combination
Liking data was recorded in a dynamic way. For each panelist a series of
liking scores was obtained; the amount of liking scores varied among products and
assessors. For each wine, cheese and their combinations, an individual mean liking
score weighted by its duration was calculated (see Figure 2). Differences among
products in mono-intake and the effect of wine and cheese in the liking scores of the
combinations were evaluated following the same model as described in 2.4.2(i) and
2.4.2(ii) respectively.
The relationship between the given liking score and a cited descriptor was
obtained by calculating the Temporal Drivers of Liking (TDL), based on the concept of
“Liking While Dominant" according to Thomas et al. (2015). Liking while dominant is
the average rating given by a consumer to a product while a certain attribute was chosen
as dominant.
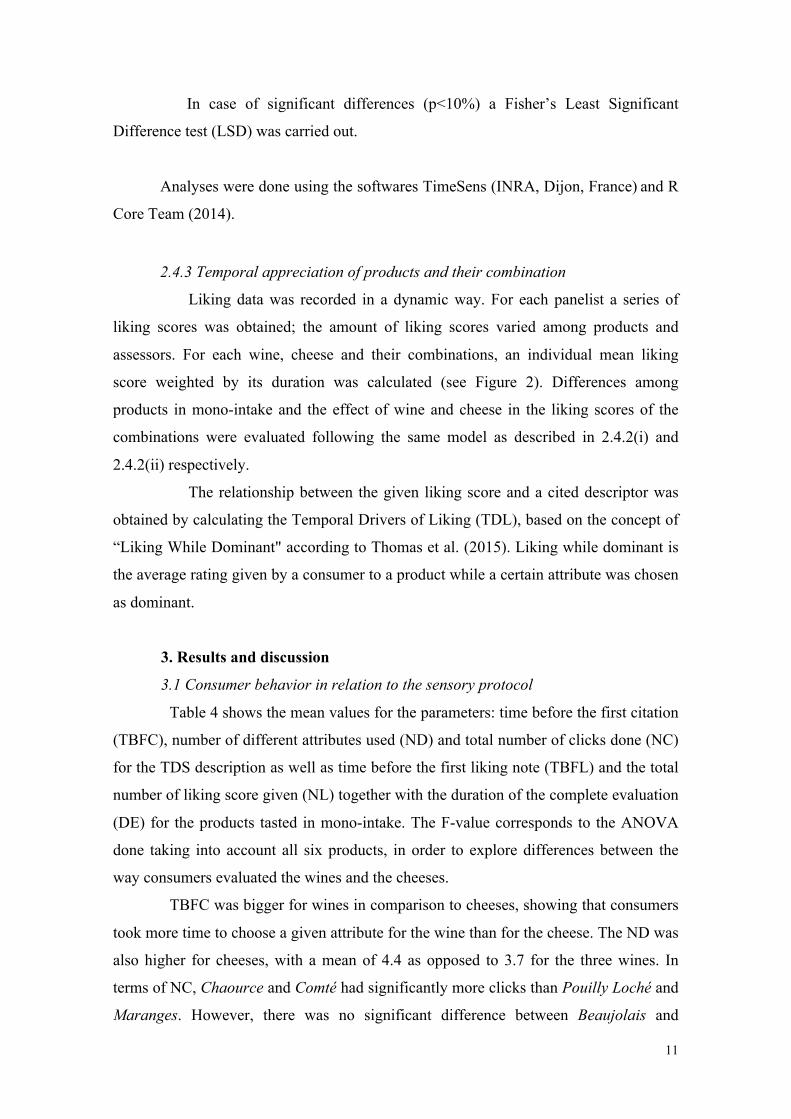
3. Results and discussion
3.1 Consumer behavior in relation to the sensory protocol
Table 4 shows the mean values for the parameters: time before the first citation
(TBFC), number of different attributes used (ND) and total number of clicks done (NC)
for the TDS description as well as time before the first liking note (TBFL) and the total
number of liking score given (NL) together with the duration of the complete evaluation
(DE) for the products tasted in mono-intake. The F-value corresponds to the ANOVA
done taking into account all six products, in order to explore differences between the
way consumers evaluated the wines and the cheeses.
TBFC was bigger for wines in comparison to cheeses, showing that consumers
took more time to choose a given attribute for the wine than for the cheese. The ND was
also higher for cheeses, with a mean of 4.4 as opposed to 3.7 for the three wines. In
terms of NC, Chaource and Comté had significantly more clicks than Pouilly Loché and
Maranges. However, there was no significant difference between Beaujolais and

12
Epoisses, showing that a wine and a cheese can have, in average, the same amount of
clicks along the tasting.
For the hedonic test, TBFL did not result in a clear grouping of the products,
probably related to a higher inter-Subject variation. In order to have a more accurate
description of consumers’ behavior towards product rating, the TBFL was compared to
the DE, showing at which moment of the tasting consumers gave their liking. It could
be observed that for Chaource, Comté and Beaujolais, the first liking score was given
before the first half of the tasting. For the other three products, consumers gave the first
liking score in the second part of the tasting, even after 67% of the tasting time has
passed in the case of Pouilly L.
Moreover, it was found that consumers clicked on the liking scale more than
once for every product (mean NC≥2.5), therefore validating the fact that giving several
liking scores was possible even when evaluating one intake. For NC, cheeses and wines
did not result in two separate clear groups as in the case ND (TDS description). This
shows that the number of clicks on the liking scale was independent of the product type
and directly related to the individual characteristics of each product. Comté cheese
recorded the most number of liking clicks while Maranges was the one with the fewest.
However, it should be noted that a change in the number of clicks is not the same as
having changes in the dynamics of liking; this will be analyzed in section 3.3.
Finally, there were differences in terms of the duration of the evaluation. The
evaluation of Comté cheese lasted the longest while the one for Pouilly Loché was the
shortest. However, there was no grouping of cheese vs. wines, showing that the duration
of the evaluation was determined by the product itself and not by the product category.
13
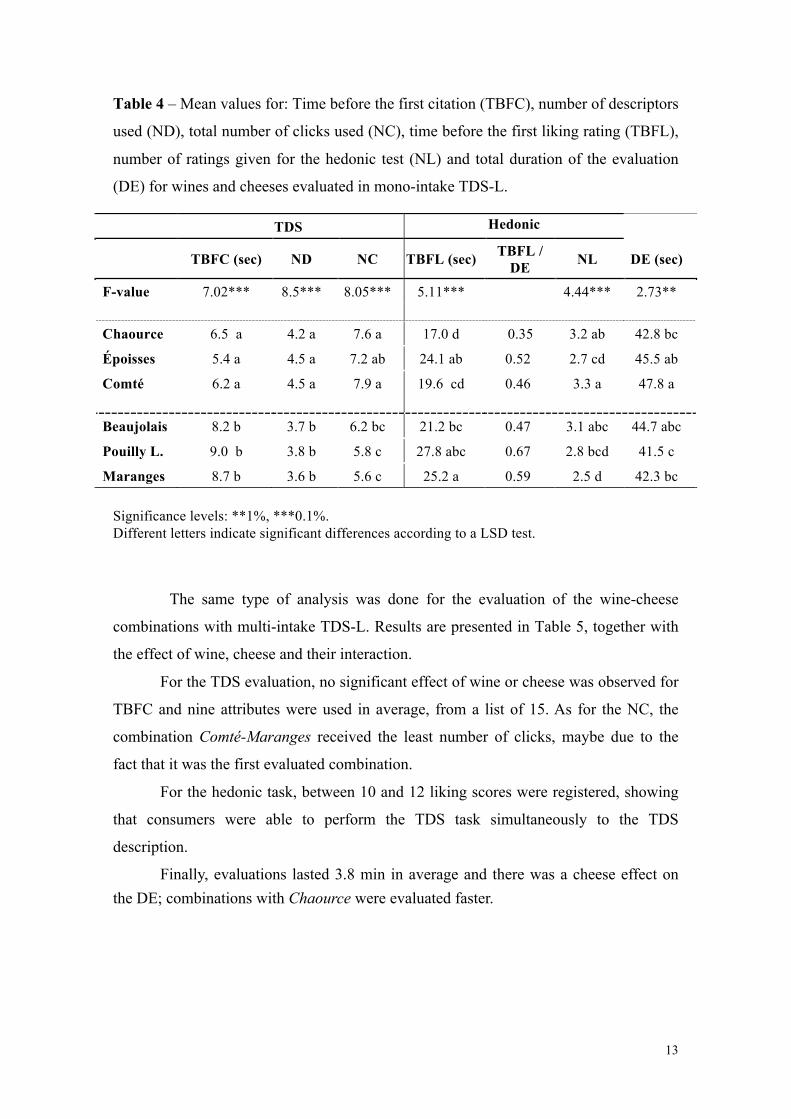
Table 4 – Mean values for: Time before the first citation (TBFC), number of descriptors
used (ND), total number of clicks used (NC), time before the first liking rating (TBFL),
number of ratings given for the hedonic test (NL) and total duration of the evaluation
(DE) for wines and cheeses evaluated in mono-intake TDS-L.
Significance levels: **1%, ***0.1%. Different letters indicate significant differences according to a LSD test.
The same type of analysis was done for the evaluation of the wine-cheese
combinations with multi-intake TDS-L. Results are presented in Table 5, together with
the effect of wine, cheese and their interaction.
For the TDS evaluation, no significant effect of wine or cheese was observed for
TBFC and nine attributes were used in average, from a list of 15. As for the NC, the
combination Comté-Maranges received the least number of clicks, maybe due to the
fact that it was the first evaluated combination.
For the hedonic task, between 10 and 12 liking scores were registered, showing
that consumers were able to perform the TDS task simultaneously to the TDS
description.
Finally, evaluations lasted 3.8 min in average and there was a cheese effect on the DE; combinations with Chaource were evaluated faster.
TDS Hedonic
TBFC (sec) ND NC TBFL (sec) TBFL / DE NL DE (sec)
F-value 7.02*** 8.5*** 8.05*** 5.11*** 4.44*** 2.73**
Chaource 6.5 a 4.2 a 7.6 a 17.0 d 0.35 3.2 ab 42.8 bc
Époisses 5.4 a 4.5 a 7.2 ab 24.1 ab 0.52 2.7 cd 45.5 ab
Comté 6.2 a 4.5 a 7.9 a 19.6 cd 0.46 3.3 a 47.8 a
Beaujolais 8.2 b 3.7 b 6.2 bc 21.2 bc 0.47 3.1 abc 44.7 abc
Pouilly L. 9.0 b 3.8 b 5.8 c 27.8 abc 0.67 2.8 bcd 41.5 c
Maranges 8.7 b 3.6 b 5.6 c 25.2 a 0.59 2.5 d 42.3 bc

14
Table 5 – Mean values for: Time before the first citation (TBFC), number of descriptors
used (ND), total number of clicks used (NC), time before the first liking rating (TBFL),
number of ratings given for the hedonic test (NL) and total duration of the evaluation
(D) for wine -cheese combinations evaluated in multiple-intake TDS-L.
TDS Hedonic
TBFC (sec) ND NC TBFL
(sec) TBFL/DE NL DE (sec)
F – Vin 2.8 1.18 5.6** 3.5* 5.3** 0.50 F - Fromage 2.7 0.14 1.1 5.1** 0.4 9.4*** F – Vin*Fromage 1.3 4.4** 3.8** 1.8 2.5* 1.6
Chaource Beaujolais 6.2 9 a 32 ab 28.6 a 0.13 12 214 ab Chaource Maranges 7.0 9 a 30 ab 34.1 ab 0.16 11 219 ab Chaource Pouilly 6.5 9 a 31 ab 27.5 a 0.13 11 204 b Comté Beaujolais 7.8 9 a 33 b 33.6 ab 0.14 12 238 a Comté Maranges 10.6 8 b 26 a 50.1 b 0.21 10 228 abc Comté Pouilly 7.2 9 a 34 b 33.1 ab 0.14 12 237 a Époisses Beaujolais 7.0 9 a 33 b 45.0 ab 0.19 10 241 a Époisses Maranges 7.6 9 a 32 b 41.2 ab 0.18 10 233 ab Époisses Pouilly 7.4 9 a 33 b 37.2 ab 0.15 12 243 a
Significance levels: *5%, **1%, ***0.1%. Different letters indicate significant differences according to a LSD test.
3.2 Temporal perception of wines and cheeses individually and combined
3.2.1 Individual wine and cheese description
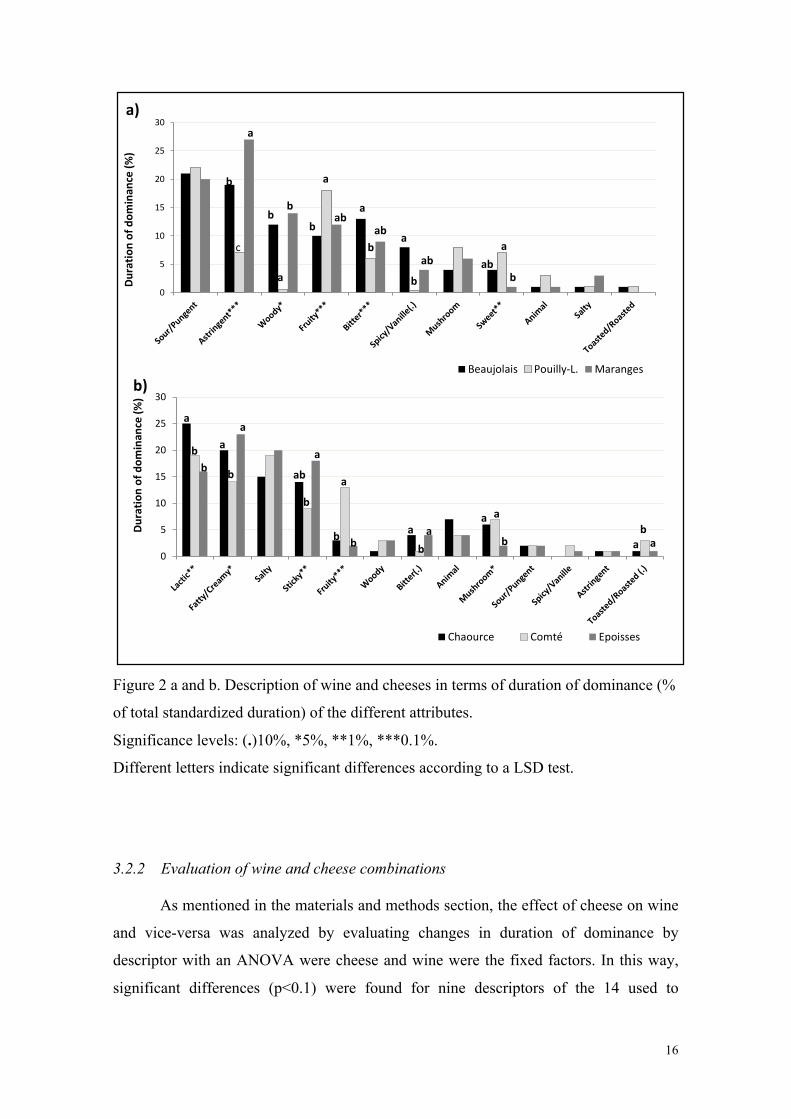
Figure 2 a and b present the percentage duration of dominance of the attributes
used to describe the wines (a) and the cheeses (b). As it was expected, certain attributes
were used mainly for cheese description (e.g. lactic, fatty/creamy, sticky) while others
were used for the wine (e.g. astringent, sweet). However, fruity for example, was used
to describe both, and it was a discriminant attribute for wines and cheeses.
The tested products had different temporal profiles which are also evident in
Figure 2a (wines) and b (cheeses). Pouilly L was characterized by the duration of
dominance of fruity and sweet, Maranges was the wine with the longest duration of
dominance of astringent and the least duration of sweet; and Beaujolais had the longest
duration of dominance of bitter taste. These results are in-line with the chemical
15
composition of the wines (Table 2). The Maranges had the highest level of tannins and
was perceived as the most astringent, while the tannins present in the Beaujolais,
together with the almost non-existent reducing sugars, resulted in the perception of the
wine as bitter. At the same time, the fact that consumers would perceive the Pouilly
Loche as astringent during 6% of the time of the tasting was quite surprising. Previous
work done by Brachet et al (2014) showed that consumers referred more to the term
astringent when describing wines in comparison to a trained panel. It could be possible
that some of the consumers could mix-up sourness with astringency (Lee and Lawless,
1991). All three wines were characterized by sour/pungent but this attribute was not
discriminant among them.
Chaource cheese had the longest duration of lactic aroma; Comté was the least
creamy and the most fruity and Epoisses was the one with the longest duration for
sticky. Salty had an important duration in all cheeses but it was not discriminant among
samples.
This individual characterization of the products was important to know how they
can change when ingested in combination.
16
Figure 2 a and b. Description of wine and cheeses in terms of duration of dominance (%
of total standardized duration) of the different attributes.
Significance levels: (.)10%, *5%, **1%, ***0.1%.
Different letters indicate significant differences according to a LSD test.
3.2.2 Evaluation of wine and cheese combinations
As mentioned in the materials and methods section, the effect of cheese on wine
and vice-versa was analyzed by evaluating changes in duration of dominance by
descriptor with an ANOVA were cheese and wine were the fixed factors. In this way,
significant differences (p<0.1) were found for nine descriptors of the 14 used to
0
5
10
15
20
25
30
Duratio
nofdom
inan
ce(%
)
Chaource Comté Epoisses
0
5
10
15
20
25
30Du
ratio
nofdom
inan
ce(%
)
Beaujolais Pouilly-L. Marangesb)
a
b
c
a
abb
a
b ab
b a
bab
a
b
a)
aba
b
a
bb b
aa
a
ab
b
a
b ba ab
a a
b a ab

17
describe the combinations. The standardized durations of dominance for these
descriptors for each wine-cheese combination are presented in Figure 3.
A wine by cheese interaction (p<0.1) was found for salty and lactic. A
significant cheese effect was obtained for: creamy, fruity and spicy/vanilla; a wine
effect was found for astringent, sweet, fruity, woody, toasted/roasted.
It should be noted that there was no difference among cheeses for the duration of
dominance of salty (Figure 2b). But, when evaluated as wine-cheese pairs, the duration
of salty as dominant changed a lot according to the wine that accompanied the cheese.
The longest duration of dominance for salty was found in Epoisses-Maranges and the
shortest duration in Chaource-Maranges, while it stayed almost the same for all cheeses
when eaten together with Pouilly L. Another interesting interaction was observed with
lactic. In the combinations with Maranges, its perception changed drastically from one
cheese to another, but this was more moderate in the Beaujolais and Pouilly L.
associations (Figure 3). This interaction is probably the result of synergistic and
antagonistic interactions between the volatile compounds in the different cheeses and
wines. This kind of behavior has been previously studied in food pairing interactions
(Traynor et al., 2013) with a conjoint approach using qualitative (organic volatile
analysis and descriptive sensory analysis) and quantitative (comparable semi
quantitative organic volatile analysis and affective sensory tests) methods of analysis in
an attempt to elucidate the success or failure of selected food pairings. It would be
interesting to have studies done using a similar approach but on wine-cheese pairs.
In the same way as for salty, the descriptor spicy was not significant when
describing the cheeses on their own; but in the combinations there was a cheese effect
making the perception of this aroma last as dominant for a longer period of time when
eating Chaource or Comté, regardless of the wine. Fatty/creamy also showed a cheese
effect, but in this case it could be interpreted as a reflection of what was found in the
evaluation of the cheeses; combinations with Comté were less fatty/creamy.
Changes in the perception of fruity were related to the cheese and the wine.
There was a somewhat additive effect given by Comté (the fruitiest cheese) and Pouilly
L. (the fruitiest wine).
The dominance duration of astringency, was longer in the red wine combinations
(as expected). Nonetheless its dominance duration was reduced more in the combination
with Comté and Epoisses than with Chaource. The effect of sweetness followed the
same pattern: in those combinations with white wine sweetness was dominant for a
18
longer period. When evaluating the wine alone, it was observed that both Maranges and
Beaujolais had a woody character (Figure 2a). However, in the associations, there was a
distinct difference in the duration of dominance of this attribute, being the associations
with Beaujolais, less woody (and as woody as those with Pouilly L.) than those with
Maranges wine. In a previous work Galmarini et al (2016) had found that after eating
Roquefort and Epoisses duration of dominance of astringency in red Bourgogne was
reduced. A similar effect was found for Madiran (P value of MANOVA <0.001) where
duration of astringency and sourness was reduced after eating Crottin de Chavignol,
Epoisses, Comté and Roquefort.
.

19
Figure 3. Standardized duration of dominance (%
) by descriptor by combination.
W= significant (p<0.1) w
ine effect C
= significant (p<0.1) cheese effect W
*C=significant (p<0.1) interaction
0 2 4 6 8
10
12
14
16
Chaource
Epoisses
Comte
Chaource
Epoisses
Comte
Chaource
Epoisses
Comte
Chaource
Epoisses
Comte
Chaource
Epoisses
Comte
Chaource
Epoisses
Comte
Chaource
Epoisses
Comte
Chaource
Epoisses
Comte
Chaource
Epoisses
Comte
Fatty/C
reamy
LacticFru
itySalty
Astrin
gent
Woody
Spicy/V
anilla
Sweet
Toaste
d/Roaste
d
Durationofdominance(%)Beaujolais
PouillyL.
Maranges
W
CW*C
W
W
W
CC
W*C
W

20
3.3 Temporal appreciation of wines and cheeses individually and combined
Figure 4 presents the weighted mean liking scores for the wines and the cheeses
when evaluated individually. Among the wines, white wine was more liked than the two
red wines. The cheeses had higher mean values than wines, but they were all three
equally liked. This was probably due to the fact that wines were evaluated blindly; black
glasses were provided and no previous information on the type of wine was given. On
the other hand, the type of cheese to be tested was evident for consumers. It is known
that information, whether it is on the price (Almenberg and Dreber, 2011) on the label
(Combris et al., 2006) or the product category, can influence ratings given by
consumers. This is particularly so in the case of wine tasting which is a multi-sensory
experience (Spence et al., 2014). This could explain why the wines on their own had
lower ratings than cheeses on their own. It would be interesting to repeat the experience
but providing consumers information on at least the kind of product they taste (dry
white wine, aged red wine, etc.).
Figure 4. Weighted mean liking scores given to the products when tasted on their own
in mono-intake.
For the combinations, the wine, cheese and wine*cheese effect was studied (section
2.4.3). No significant effect was found for the wine*cheese interaction (F=0.90, p-
value=0.4639) nor for cheese (F=1.74, p-value=0.1793); but a significant wine effect
21
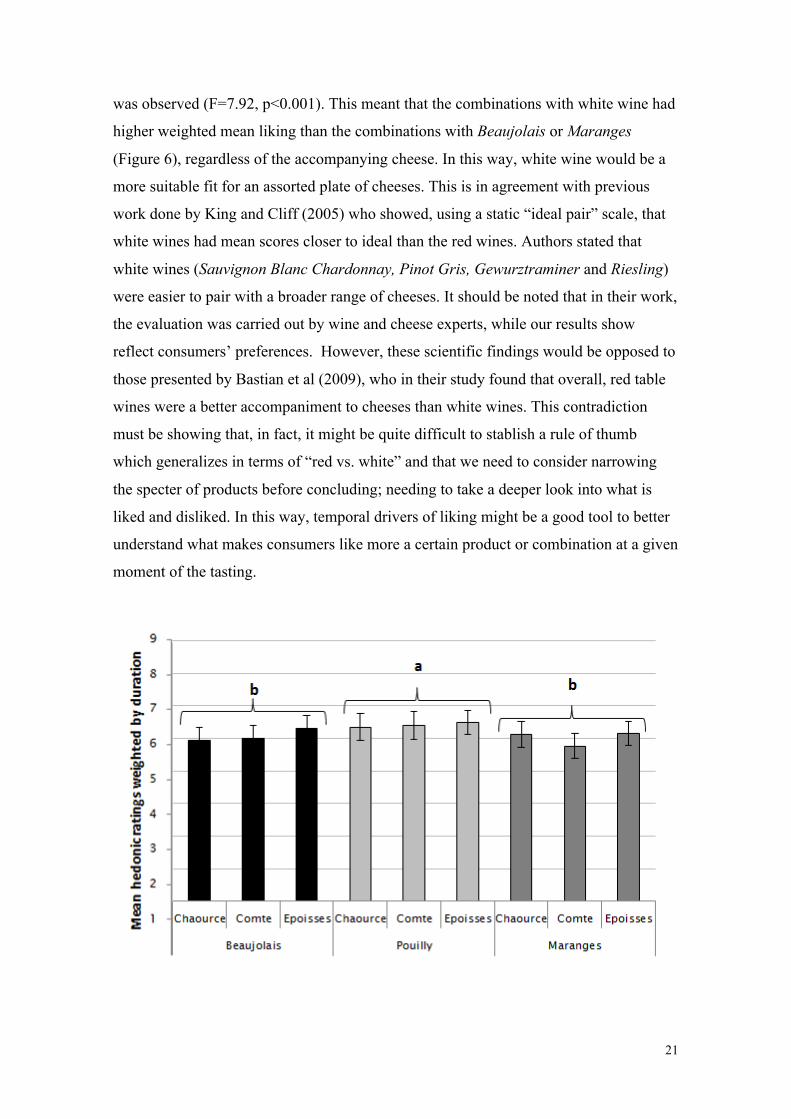
was observed (F=7.92, p<0.001). This meant that the combinations with white wine had
higher weighted mean liking than the combinations with Beaujolais or Maranges
(Figure 6), regardless of the accompanying cheese. In this way, white wine would be a
more suitable fit for an assorted plate of cheeses. This is in agreement with previous
work done by King and Cliff (2005) who showed, using a static “ideal pair” scale, that
white wines had mean scores closer to ideal than the red wines. Authors stated that
white wines (Sauvignon Blanc Chardonnay, Pinot Gris, Gewurztraminer and Riesling)
were easier to pair with a broader range of cheeses. It should be noted that in their work,
the evaluation was carried out by wine and cheese experts, while our results show
reflect consumers’ preferences. However, these scientific findings would be opposed to
those presented by Bastian et al (2009), who in their study found that overall, red table
wines were a better accompaniment to cheeses than white wines. This contradiction
must be showing that, in fact, it might be quite difficult to stablish a rule of thumb
which generalizes in terms of “red vs. white” and that we need to consider narrowing
the specter of products before concluding; needing to take a deeper look into what is
liked and disliked. In this way, temporal drivers of liking might be a good tool to better
understand what makes consumers like more a certain product or combination at a given
moment of the tasting.
22
Figure 5. Weighted mean liking scores given to the combinations of wine and cheese
evaluated over multiple intakes.
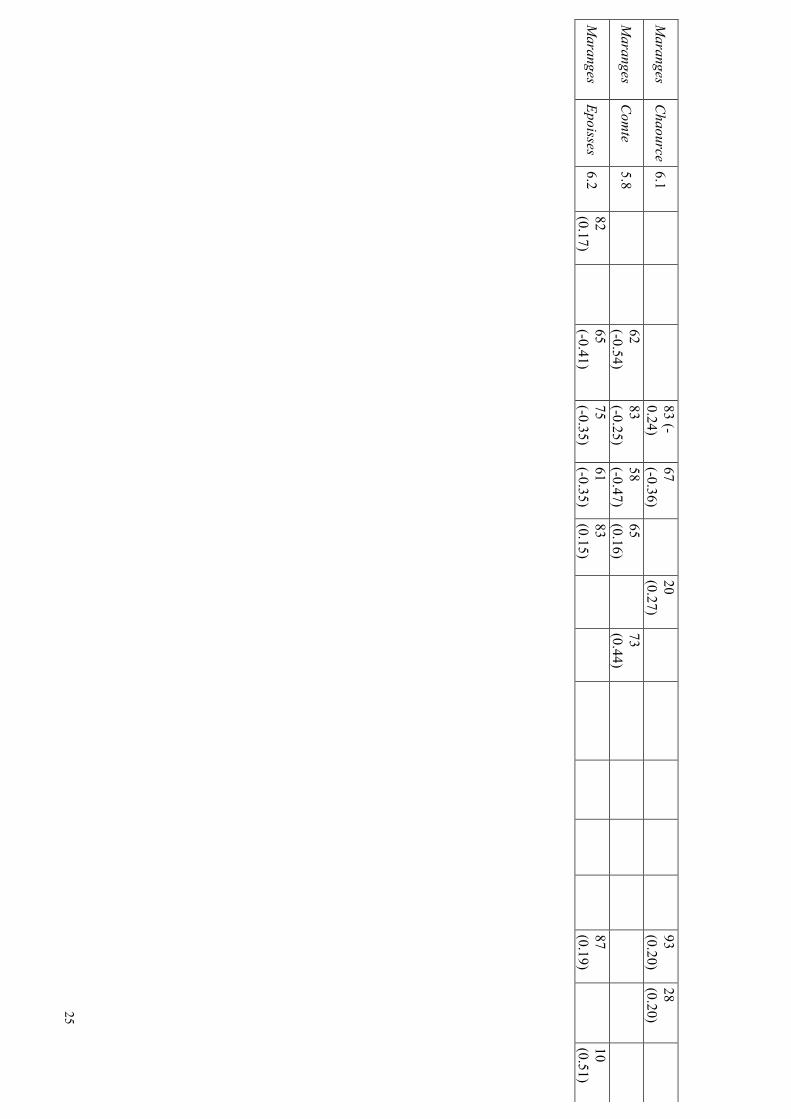
Table 6 shows that, when evaluated individually, less drivers of liking were
found for the cheeses than for the wines. The most outstanding finding for the cheeses
was that in Epoisses, salty was a negative driver of liking for 78% of the panel. This
meant that when this descriptor was cited, the given score was reduced in 0.18. For the
other two cheeses, positive drivers of liking were found, but they were relevant for a
smaller proportion of the panel (Comté: 30% increased their liking in 0.2 when citing
mushroom; Chaource: only 8% increased their liking in 0.29 while citing Toasted).
This negative perception of salty could be related to expectations regarding the cheese
category and not towards the attribute in itself, since al cheeses seem to have the same
duration of dominance for this attribute (Figure 2b).
For the wines, it was observed that astringent, bitter and sour were negative
temporal drivers of liking and were found only in the red wines. It should be noted that,
even if astringency was a highly dominant attribute when describing Maranges (Figue
2a), it was not considered a negative driver of liking in this wine, but it made decrease
the liking score in the Beaujolais.
When looking at the combinations it was observed that the negative TDL were
only three and mostly wine related: sour, bitter and astringent. Perception of bitterness
made consumers reduce their liking scores in all combinations with Maranges, two with
Beaujolais and only one with Pouilly Loché (with Comté). The interesting thing is that
in every case, this impact was cited by more than half the panel and ratings were
reduced up to 0.47; showing consensus on this dislike. So probably what would be
driving a good combination is that in which the perception of these three attributes is
reduced. Sourness also made liking scores decrease, in 7 out of the 9 combinations with
an even higher agreement of the panel; but the reduction in the scores was smaller.
Finally, the third negative TDL was astringency, which reduced the scores in 4 red wine
combinations and surprisingly in the Pouilly Loché-Comté combination where 48% of
the consumers reduced their score in 0.34.
Opposite to that, positive TDL were more varied (a total of 10 descriptors) and
were related either to wine or cheese. Also, one negative driver of liking in cheese
description became a positive one when evaluating the combinations: salty. In
Maranges-Comté and Maranges-Epoisses, consumers (65 and 83% respectively)
23
increased their liking scores when this attribute was perceived. Actually, Maranges-
Epoisses was the combination in which salty lasted as dominant for the longest period
of time. So this might be showing that consumers like to perceive the salty taste and the
characteristics of the cheese and not for them to be “blurred” by the wine; so a liked
combination would be that in which both the wine and the cheese can be perceived.
Also sticky and lactic were positive TDL for this combination.
The most liked combination was Epoisses-Pouilly Loché which had no negative
drivers of liking and had fatty and sweet as positive drivers of liking. The moment fatty
was cited as dominant, 95% of the consumers increased their liking score in 0.2 while
the liking increased in 0.3 for 43% of the panel when choosing sweet.
It is important to point out that, in the combinations, negative drivers of liking
were only three, out of the 14 presented descriptors, and they were repeated in several
combinations. However, the positive drivers of liking varied more from combination to
combination, having a total of 10 attributes (including “nothing dominates”) which
could explain a rising in the liking score.
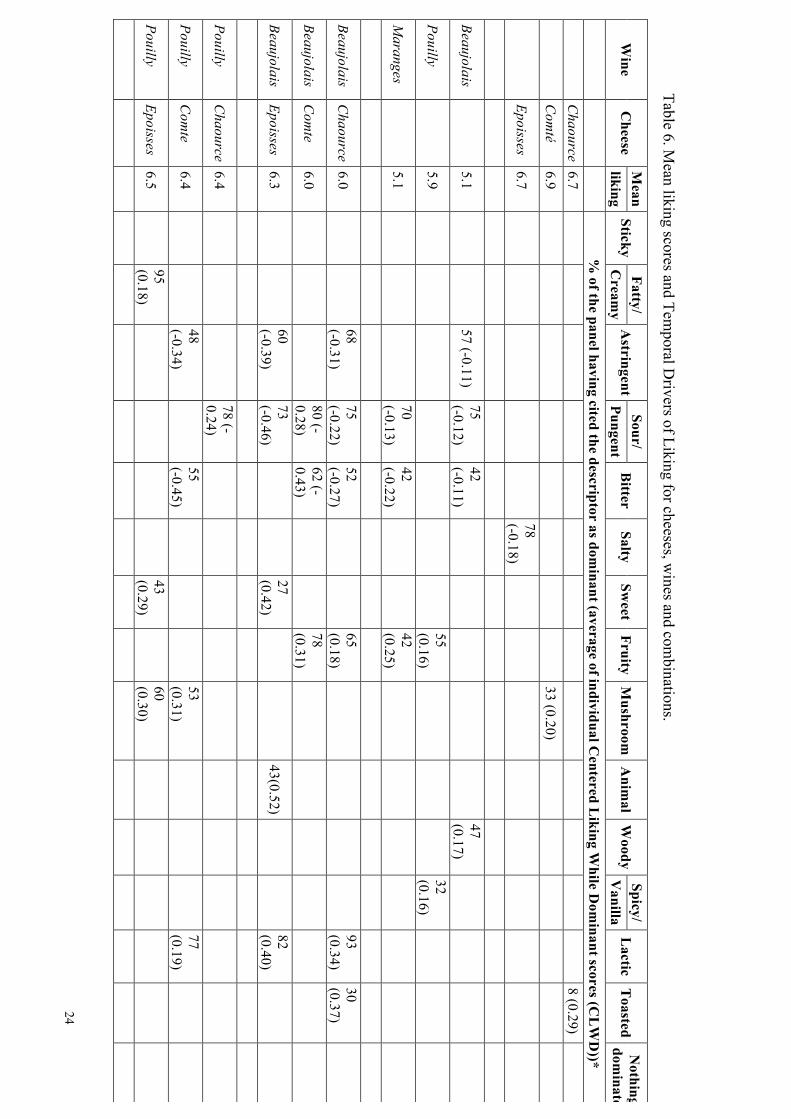
24 Table 6. M
ean liking scores and Temporal D
rivers of Liking for cheeses, wines and com
binations.
Wine
Cheese
Mean
Sticky Fatty/
Astringent
Sour/ B
itter Salty
Sweet
Fruity M
ushroom
Anim
al W
oody Spicy/
Lactic
Toasted
Nothing
dominates
liking C
reamy
Pungent V
anilla
%
of the panel having cited the descriptor as dominant (average of individual C
entered Liking W
hile Dom
inant scores (CL
WD
))*
C
haource 6.7
8 (0.29)
C
omté
6.9
33 (0.20)
Epoisses 6.7
78 (-0.18)
Beaujolais
5.1
57 (-0.11) 75 (-0.12)
42 (-0.11)
47 (0.17)
Pouilly
5.9
55 (0.16)
32 (0.16)
M
aranges
5.1
70 (-0.13)
42 (-0.22)
42 (0.25)
Beaujolais
Chaource
6.0
68 (-0.31)
75 (-0.22)
52 (-0.27)
65 (0.18)
93 (0.34)
30 (0.37)
Beaujolais
Com
te 6.0
80 (-0.28)
62 (-0.43)
78 (0.31)
Beaujolais
Epoisses 6.3
60 (-0.39)
73 (-0.46)
27 (0.42)
43(0.52)
82 (0.40)
Pouilly C
haource 6.4
78 (-0.24)
Pouilly
Com
te 6.4
48 (-0.34)
55 (-0.45)
53 (0.31)
77 (0.19)
Pouilly Epoisses
6.5
95 (0.18)
43 (0.29)
60 (0.30)
25
Maranges
Chaource
6.1
83 (-0.24)
67 (-0.36)
20 (0.27)
93 (0.20)
28 (0.20)
M
aranges C
omte
5.8
62 (-0.54)
83 (-0.25)
58 (-0.47)
65 (0.16)
73 (0.44)
M
aranges Epoisses
6.2 82 (0.17)
65 (-0.41)
75 (-0.35)
61 (-0.35)
83 (0.15)
87 (0.19)
10 (0.51)

26
Conclusions
From a methodological point of view, this experiment showed that dynamic
descriptive and hedonic data could be obtained on a full combined portion of wine and
cheese.
Wine-cheese interactions were found when describing the combinations, which
reminds us that the perception of a combination of products is not the result of an
additive or subtracting effect which can be predicted based on their individual
perception, but that they are complex associations that need to be deeply studied. This is
one of the reasons why stablishing a rule of thumb can be difficult and sometimes even
contradictory.
There was a wine effect on the liking of the combinations, showing that in the
present case, white wine was a better companion for the evaluated cheeses than the red
wines. This liking was explained by a reduced duration of astringency or bitterness as
dominant.
Another finding of the present work was that astringency, bitterness and
sourness in wine and in these wine-cheese combinations, were perceived as negative
drivers of liking by consumers. This is important information to be considered not only
when pairing wine with cheeses (and other foods probably) but also when
communicating the products’ characteristics to consumers.
The innovative method used in the present work opens a whole new field in the
evaluation of wine pairing. This could be used not only with cheese, but also pairing
wine (or beer) with complete dishes. This would enable a better communication on wine
sensory characteristics and usage, and could become a great tool for wine marketing.
Acknowledgement
Mara V. Galmarini has received the support of the EU in the framework of the
Marie-Curie FP7 COFUND People Programme, through the award of an AgreenSkills
fellowship under grant agreement n° 267196.
This research was also partly financed by the Burgundy Council, project PARI
2014 - VIGNE et VIN Nº 29000857 together with the collaboration of the following
partners: Comité Interprofessionnel de Gestion du Comté (CIGC), Centre Technique des

27
Fromages Comtois (CTFC), Syndicat de défense de l’Epoisses, Syndicat du Crottin de
Chavignol, Institut Français de la Vigne et du Vin (IFV) – SICAREX, Bureau
Interprofessionnel des Vins de Bourgogne (BIVB).
References
ALMENBERG, J. & DREBER, A. 2011. When Does the Price Affect the Taste? Results from a Wine Experiment. Journal of Wine Economics, 6, 111-121.
BASTIAN, S. E. P., COLLINS, C. & JOHNSON, T. E. 2010. Understanding consumer preferences for Shiraz wine and Cheddar cheese pairings. Food Quality and Preference, 21, 668-678.
BASTIAN, S. E. P., PAYNE, C. M., PERRENOUD, B., JOSCELYNE, V. L. & JOHNSON, T. E. 2009. Comparisons between Australian consumers' and industry experts' perceptions of ideal wine and cheese combinations. Australian Journal of Grape and Wine Research, 15, 175-184.
BRACHET, S., GALMARINI, M., CHATELET, B., LOISEAU, A.-L., CORDELLE, S., LEMPEREUR, V. & SCHLICH, P. Year. Evaluation de la Dominance Temporelle des Sensations de vins rouges de Bourgogne et du Beaujolais par un panel d'experts et de consommateurs. In: 37th World Congress of Vine and Wine and 12th General Assembly of the OIV, 2014. EDP Sciences, 06006.
COMBRIS, P., LANGE, C. & ISSANCHOU, S. 2006. Assessing the Effect of Information on the Reservation Price for Champagne: What are Consumers Actually Paying for? Journal of Wine Economics, 1, 75-88.
DELARUE, J. & BLUMENTHAL, D. 2015. Temporal aspects of consumer preferences. Current Opinion in Food Science, 3, 41-46.
GALMARINI, M. V., LOISEAU, A.-L., VISALLI, M. & SCHLICH, P. 2016. Use of Multi-Intake Temporal Dominance of Sensations (TDS) to Evaluate the Influence of Cheese on Wine Perception. Journal of Food Science, 81, S2566-S2577.
GALMARINI, M. V., VISALLI, M. & SCHLICH, P. 2015. Advances in representation and analysis of mono and multi-intake Temporal Dominance of Sensations data. In: ELSEVIER (ed.) 11th Pangborn Sensory Science Symposium. Gothemburg, Sweden.
GALMARINI, M. V., VISALLI, M. & SCHLICH, P. 2017. Advances in representation and analysis of mono and multi-intake Temporal Dominance of Sensations data. Food Quality and Preference, 56, Part B, 247-255.
HARRINGTON, R. J. & HAMMOND, R. 2005. The Direct Effects of Wine and Cheese Characteristics on Perceived Match. Journal of Foodservice Business Research, 8, 37-54.
HARRINGTON, R. J. & HAMMOND, R. 2007. Body Deviation-from-Match. Journal of Culinary Science & Technology, 5, 51-69.
HARRINGTON, R. J., MCCARTHY, M. & GOZZI, M. 2010. Perceived Match of Wine and Cheese and the Impact of Additional Food Elements: A Preliminary Study. Journal of Foodservice Business Research, 13, 311-330.
HOPFER, H. & HEYMANN, H. 2014. Judging wine quality: Do we need experts, consumers or trained panelists? Food Quality and Preference, 32, Part C, 221-233.

28
KING, M. & CLIFF, M. 2005. EVALUATION OF IDEAL WINE AND CHEESE PAIRS USING A DEVIATION-FROM-IDEAL SCALE WITH FOOD AND WINE EXPERTS. Journal of food quality, 28, 245-256.
LEE, C. B. & LAWLESS, H. T. 1991. Time-course of astringent sensations. Chemical Senses, 16, 225-238.
NYGREN, I. T., GUSTAFSSON, I.-B. & JOHANSSON, L. 2003a. Effects of tasting technique – sequential tasting vs. mixed tasting – on perception of dry white wine and blue mould cheese. Food Service Technology, 3, 61-69.
NYGREN, I. T., GUSTAFSSON, I.-B. & JOHANSSON, L. 2003b. Perceived flavour changes in blue mould cheese after tasting white wine. Food Service Technology, 3, 143-150.
NYGREN, I. T., GUSTAFSSON, I. B. & JOHANSSON, L. 2002. Perceived flavour changes in white wine after tasting blue mould cheese. Food Service Technology, 2, 163-171.
OIV 2014. Global Economic Vitiviniculture Data. PAULSEN, M. T., ROGNSÅ, G. H. & HERSLETH, M. 2015. Consumer perception of
food–beverage pairings: The influence of unity in variety and balance. International Journal of Gastronomy and Food Science, 2, 83-92.
PINEAU, N., SCHLICH, P., CORDELLE, S., MATHONNIÈRE, C., ISSANCHOU, S., IMBERT, A., ROGEAUX, M., ETIÉVANT, P. & KÖSTER, E. 2009. Temporal Dominance of Sensations: Construction of the TDS curves and comparison with time–intensity. Food Quality and Preference, 20, 450-455.
R CORE TEAM 2014. R: A language and environment for statistical computing. R Foundation for Statistical Computing, Viena, Austria. URL http://www.R-project.org/.
SCHLICH, P. Year. TDS with untrained consumers in lab and at home. In: 10th Pangborn Sensory Science Symposium, 2013 Rio de Janeiro, Brazil.
SCHLICH, P. Year. Temporal Dominance of Sensations paired with Temporal Liking. In: 11th Pangborn Sensory Science Symposium, 2015 Gothenburg, Sweden.
SCHLICH, P., PINEAU, N., URBANO, C. & VISALLI, M. Year. Overview - Multi-bites or multi-sips TDS with untrained subjects: a live demonstration on chocolates. In: 10th Pangborn Sensory Science Symposium, 2013 Rio de Janeiro, Brazil.
SPENCE, C., VELASCO, C. & KNOEFERLE, K. 2014. A large sample study on the influence of the multisensory environment on the wine drinking experience. Flavour, 3, 8.
THOMAS, A. & SCHLICH, P. Year. From temporality of sensations to dynamic of liking. In: Sensometrics, 2014 Chicago, USA.
THOMAS, A., VAN DER STELT, A., LAWLOR, B. & SCHLICH, P. Year. Alternating Temporal Dominance of Sensations and Liking Scales during the Intake of a Full Portion of an Oral Nutritional Supplement. In: 6th EuroSense, 7-10 September 2014 Copenhagen, Denmark.
THOMAS, A., VISALLI, M., CORDELLE, S. & SCHLICH, P. 2015. Temporal Drivers of Liking. Food Quality and Preference, 40, Part B, 365-375.
TRAYNOR, M. P., BURKE, R., O'SULLIVAN, M. G., HANNON, J. A. & BARRY-RYAN, C. 2013. Sensory and chemical interactions of food pairings (basmati rice, bacon and extra virgin olive oil) with banana. Food Research International, 54, 569-577.

29