Embed Size (px)
Citation preview

America Pays for Gas Leaks
Natural Gas Pipeline Leaks Cost Consumers Billions
A report prepared for Sen. Edward J. Markey
Released: August 1, 2013

This page intentionally left blank
America Pays for Gas Leaks Natural Gas Pipeline Leaks Cost Consumers Billions
American consumers are paying billions of dollars for natural gas that never reaches their homes,
but instead leaks from aging distribution pipelines, contributing to climate change, threatening
public health, and sometimes causing explosions. This staff report, which was prepared at the
request of Sen. Edward J. Markey (D-MA),1 draws on data from a variety of sources to assess the
impact of leaks and other “lost and unaccounted for” natural gas, using Massachusetts as a case
study.
Gas distribution companies in 2011 reported releasing 69 billion cubic feet of natural gas to the
atmosphere, almost enough to meet the state of Maine’s gas needs for a year and equal to the
annual carbon dioxide emissions of about six million automobiles.2 Nonetheless, last year these
companies replaced just 3 percent of their distribution mains made of cast iron or bare steel,3
which leak 18 times more gas than plastic pipes and 57 times more gas than protected steel.4 Gas
companies have little incentive to replace these leaky pipes, which span about 91,000 miles
across 46 states, because they are able to pass along the cost of lost gas to consumers. Nationally,
consumers paid at least $20 billion from 2000-2011 for gas that was unaccounted for and never
used, according to analysis performed for this report.5
Natural gas has been touted as a cleaner alternative to coal for producing electricity, but its
environmental benefits cannot be fully realized so long as distribution pipelines are leaking such
enormous quantities of gas, which is primarily comprised of methane, a greenhouse gas that is at
least 21 times more potent than carbon dioxide.6 Americans also remain at risk from gas
explosions and other safety hazards caused by leaky natural gas pipelines. From 2002 to 2012,
almost 800 significant incidents on gas distribution pipelines, including several hundred
1 The House Natural Resources Committee Democratic staff prepared the report at the request of Sen. Markey when
he was serving as the senior ranking Democrat on the committee and Senator Markey’s staff completed work on the
report prior to its issuance. 2 U.S. Environmental Protection Agency, “Inventory of U.S. Greenhouse Gas Emissions and Sinks: 1990-
2011,”April 12, 2013, available at http://www.epa.gov/climatechange/Downloads/ghgemissions/US-GHG-
Inventory-2013-Main-Text.pdf. Maine gas consumption levels are based on data reported to the Energy Information
Administration (EIA), available at http://www.eia.gov/naturalgas/annual/pdf/nga11.pdf. 3 Distribution mains are a common gas source for multiple customers. Individual customers receive gas via service
lines. In 2012, gas companies replaced 12 percent of their leak-prone service lines, according to PHMSA data. 4 This calculation is based on an average of the emissions factors for cast iron and bare steel pipelines assigned by
the U.S. Environmental Protection Agency in 40 CFR Part 98, Subpart W, available at
http://www.gpo.gov/fdsys/pkg/FR-2011-12-23/pdf/2011-31532.pdf. 5 Based on unaccounted for gas reported to EIA, multiplied by the average city gate price, and adjusted for inflation.
An EIA official recommended we use the average city gate price because it reflects the price the distribution
company paid for the gas from the transmission company. 6 Conservation Law Foundation, “Into Thin Air: How Leaking Natural Gas Infrastructure is Harming our
Environment and Wasting a Valuable Resource,” available at: http://www.clf.org/static/natural-gas-
leaks/WhitePaper_Final_lowres.pdf.

2
explosions,7 killed 116 people, injured 465 others, and caused more than $800 million in
property damage.
Table 1: U.S. Unaccounted for Gas, Emissions, and Significant Incidents on Natural Gas Systems
Total U.S. Unaccounted for Gas from Natural Gas Systems from 2000-2011a
2.6 trillion cubic feet of natural gas
Total U.S. Reported Emissions from Natural Gas Distribution Systems from 2010 - 2011b
Equivalent to releasing 56.2 million metric tons of CO2
Significant Incidents on U.S. Natural Gas Distribution Systems from 2002-2012c
796 incidents / 116 fatalities / 465 injuries / $810,677,757 in property damage
a Source: EIA, Form 176. Includes unaccounted for gas from transmission companies and distribution companies. b Source: EPA, U.S. Greenhouse Gas Inventory of Sources and Sinks, 1990-2011, available at: http://www.epa.gov/climatechange/Downloads/ghgemissions/US-GHG-Inventory-2013-Main-Text.pdf
c Source: PHMSA, available at: http://primis.phmsa.dot.gov/comm/reports/safety/SigPSI.html?nocache=1229
Gov. Deval Patrick’s administration has started to address this problem in Massachusetts, which
is a nationally recognized leader among states in energy efficiency8 and reducing greenhouse gas
emissions.9 In particular, the commonwealth’s Department of Public Utilities (DPU) recently
launched incentive programs to encourage gas companies to replace leak-prone pipelines and
operate more efficiently. The incentive programs are needed because gas companies in
Massachusetts own and operate one of America’s oldest natural gas pipeline distribution
systems, ranking sixth among state systems in the number of miles of main distribution pipelines
made of cast iron or bare steel.10
These companies have replaced less than 4 percent of their leak-
prone pipes per year while billing Massachusetts ratepayers an estimated $640 million to $1.5
billion from 2000-2011 for unaccounted for gas (see Table 3 on page 7).
The problem of leaky gas pipelines may be even worse than the data presented in this report
suggests. Indeed, companies frequently report negative volumes of unaccounted for gas to
various agencies—even though it’s physically impossible to dispose of more gas than enters a
closed system.11
Federal and state regulators explained in interviews for this report that there
isn’t a consistent methodology for calculating lost and unaccounted for gas, and data quality
problems are common. The Massachusetts DPU has responded by requesting additional funds in
its 2014 budget to hire a third-party consultant to review companies’ procedures for classifying
leaks and calculating lost and unaccounted for gas.12
7 There were 257 explosions from Mar. 2004 - Dec. 2012, according to data from PHMSA. PHMSA data before
Feb. 2004 does not indicate whether significant incidents involved explosions. There were 191 significant incidents
from Jan 2002- Feb. 2004. 8 Massachusetts was the top-ranked state according to The American Council for an Energy Efficient Economy’s
2012 State Energy Efficiency Scorecard, available at http://aceee.org/research-report/e12c. 9 For example, Massachusetts is part of the Regional Greenhouse Gas Initiative—the first mandatory cap and trade
emissions program in the United States. 10
In 2012, Massachusetts had 5,482 miles of leak-prone mains and 194,326 leak-prone service lines, according to
PHMSA data. 11
Commonwealth of Pennsylvania Bureau of Investigation and Bureau of Audits, 2012 “Unaccounted-for-Gas in
the Commonwealth of Pennsylvania,” February 2012, available at
http://www.puc.state.pa.us/transport/gassafe/pdf/UFG_Report_Feb2012.pdf. 12
Statement of Richard K. Sullivan, Massachusetts Secretary of Energy and Environmental Affairs, before the Joint
Committee on Telecommunications, Utilities and Energy, June 11, 2013.
3
Last year, 24.5 trillion cubic feet of natural gas was produced in the United States, up 4 trillion
cubic feet since 2007. 13
Sales of natural gas from federal lands were about 18 percent (4.3 tcf) of
total U.S. sales in fiscal year 2012, including 3 trillion cubic feet produced onshore and 1.3
trillion cubic feet produced offshore.14
Additionally, about 28 percent (85 tcf of 305 tcf) of U.S.
proved reserves of dry natural gas are located on federal lands.15
Fixing leaky pipelines is
important in making sure these newly abundant natural gas resources are put to responsible use
and fully benefit the American people.
To address the problems identified in this report, Sen. Markey is drafting legislation that will
push states and non-regulated utilities to accelerate replacement of high-risk, leaky pipelines and
curtail the practice of passing along the costs of lost gas to consumers. The following section of
the report uses Massachusetts as a case study to show why this legislation is necessary.
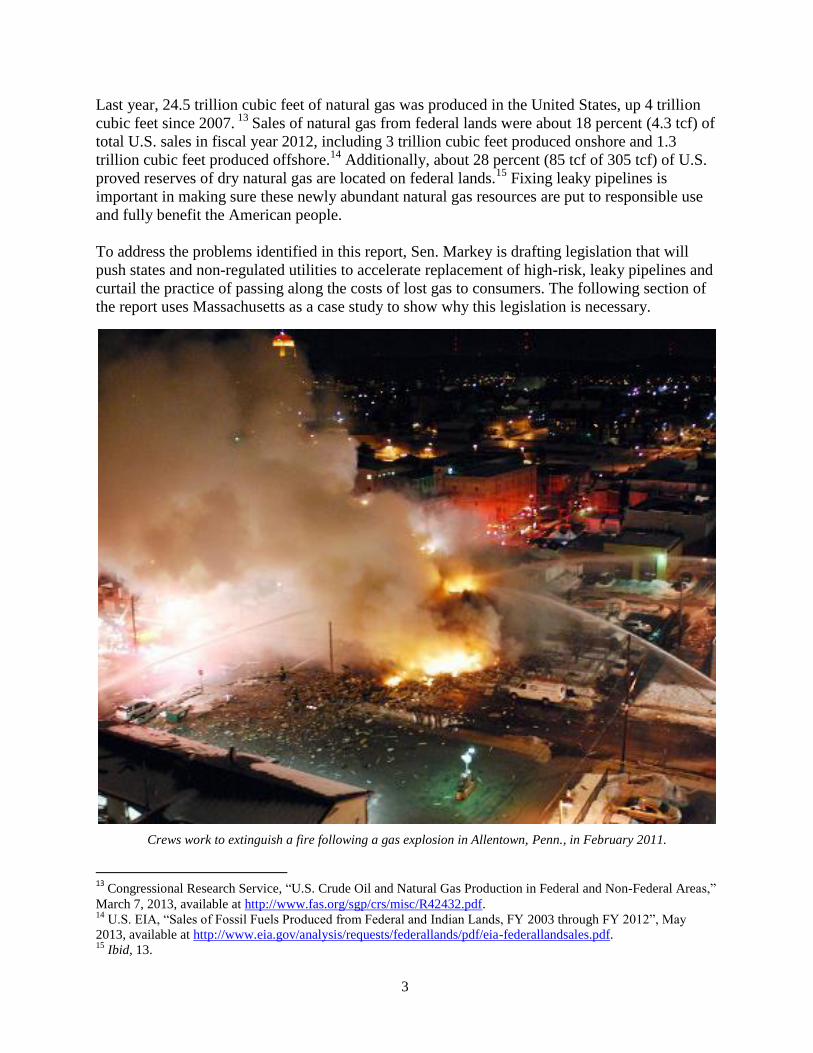
Crews work to extinguish a fire following a gas explosion in Allentown, Penn., in February 2011.
13
Congressional Research Service, “U.S. Crude Oil and Natural Gas Production in Federal and Non-Federal Areas,”
March 7, 2013, available at http://www.fas.org/sgp/crs/misc/R42432.pdf. 14
U.S. EIA, “Sales of Fossil Fuels Produced from Federal and Indian Lands, FY 2003 through FY 2012”, May
2013, available at http://www.eia.gov/analysis/requests/federallands/pdf/eia-federallandsales.pdf. 15
Ibid, 13.
4
The price of leaked gas
By not replacing leaking pipelines, gas companies nationwide are charging ratepayers for gas
that never reaches homes and is contributing to climate change, endangering public health,16
and
risking explosions and other safety hazards. The problem is particularly acute in Massachusetts
because of the advanced age of the commonwealth’s distribution system. Specifically, the data
show:
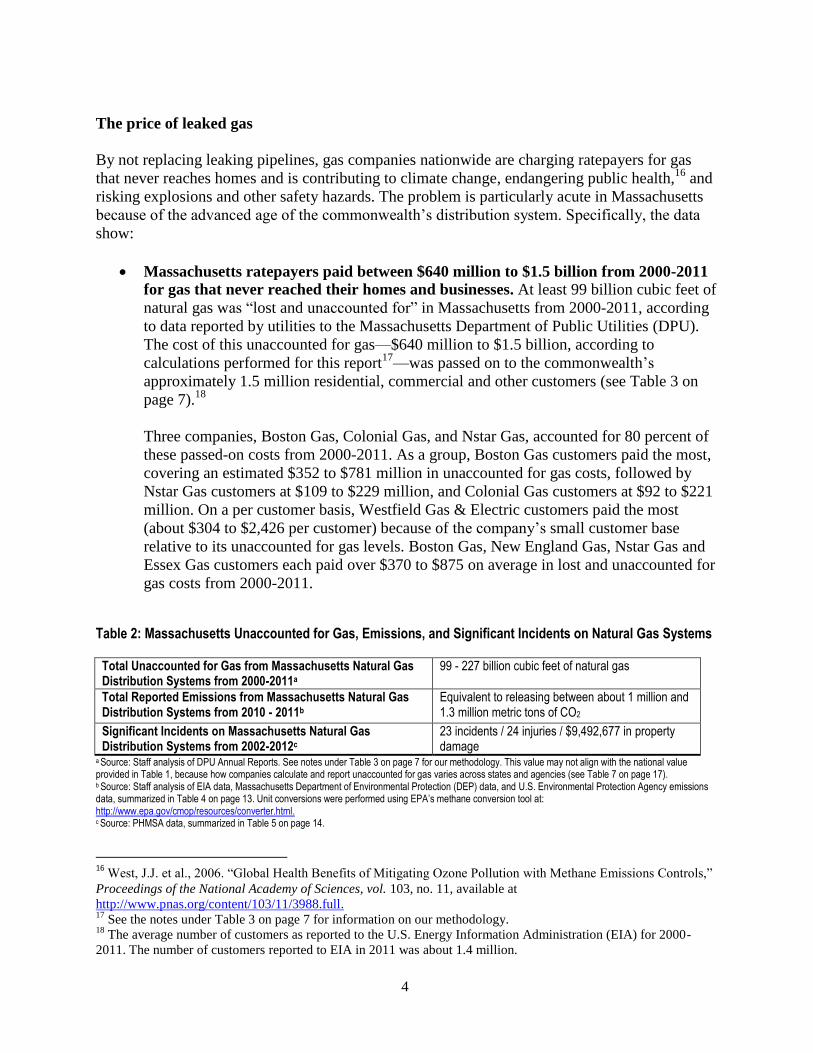
Massachusetts ratepayers paid between $640 million to $1.5 billion from 2000-2011
for gas that never reached their homes and businesses. At least 99 billion cubic feet of
natural gas was “lost and unaccounted for” in Massachusetts from 2000-2011, according
to data reported by utilities to the Massachusetts Department of Public Utilities (DPU).
The cost of this unaccounted for gas—$640 million to $1.5 billion, according to
calculations performed for this report17
—was passed on to the commonwealth’s
approximately 1.5 million residential, commercial and other customers (see Table 3 on
page 7).18
Three companies, Boston Gas, Colonial Gas, and Nstar Gas, accounted for 80 percent of
these passed-on costs from 2000-2011. As a group, Boston Gas customers paid the most,
covering an estimated $352 to $781 million in unaccounted for gas costs, followed by
Nstar Gas customers at $109 to $229 million, and Colonial Gas customers at $92 to $221
million. On a per customer basis, Westfield Gas & Electric customers paid the most
(about $304 to $2,426 per customer) because of the company’s small customer base
relative to its unaccounted for gas levels. Boston Gas, New England Gas, Nstar Gas and
Essex Gas customers each paid over $370 to $875 on average in lost and unaccounted for
gas costs from 2000-2011.
Table 2: Massachusetts Unaccounted for Gas, Emissions, and Significant Incidents on Natural Gas Systems
Total Unaccounted for Gas from Massachusetts Natural Gas Distribution Systems from 2000-2011a
99 - 227 billion cubic feet of natural gas
Total Reported Emissions from Massachusetts Natural Gas Distribution Systems from 2010 - 2011b
Equivalent to releasing between about 1 million and 1.3 million metric tons of CO2
Significant Incidents on Massachusetts Natural Gas Distribution Systems from 2002-2012c
23 incidents / 24 injuries / $9,492,677 in property damage
a Source: Staff analysis of DPU Annual Reports. See notes under Table 3 on page 7 for our methodology. This value may not align with the national value provided in Table 1, because how companies calculate and report unaccounted for gas varies across states and agencies (see Table 7 on page 17). b Source: Staff analysis of EIA data, Massachusetts Department of Environmental Protection (DEP) data, and U.S. Environmental Protection Agency emissions data, summarized in Table 4 on page 13. Unit conversions were performed using EPA’s methane conversion tool at: http://www.epa.gov/cmop/resources/converter.html.
c Source: PHMSA data, summarized in Table 5 on page 14.
16
West, J.J. et al., 2006. “Global Health Benefits of Mitigating Ozone Pollution with Methane Emissions Controls,”
Proceedings of the National Academy of Sciences, vol. 103, no. 11, available at
http://www.pnas.org/content/103/11/3988.full. 17
See the notes under Table 3 on page 7 for information on our methodology. 18
The average number of customers as reported to the U.S. Energy Information Administration (EIA) for 2000-
2011. The number of customers reported to EIA in 2011 was about 1.4 million.

5
Lost natural gas accounts for at least 45 percent of Massachusetts’ methane
emissions for large, stationary facilities.19
Utilities serving Massachusetts reported
releasing between 1.1 and 1.4 billion cubic feet of gas into the atmosphere in 2011,
accounting for between 45 and 58 percent of the commonwealth’s methane emissions for
large, stationary facilities, as reported to the Massachusetts Greenhouse Gas Registry (see
Table 4 on page 13).20
The three companies reporting the greatest emissions (Boston Gas, Nstar Gas, and
Columbia Gas) were also the three companies that had the most leak-prone pipes in their
distribution systems, as of 2012 (see Table 4 on page 13 and Table 6 on page 16). In
addition, researchers from Boston University and Duke University recently measured
methane levels over 785 miles of Boston roads and found 3,356 leaks likely due to
natural gas distribution pipelines.21
State law requires Massachusetts to reduce greenhouse gas emissions to 25 percent below
1990 levels by 2020.22
Addressing gas leaks is especially important in meeting this goal
because methane is such a potent heat-trapping gas, with at least 21 times the warming
potential of carbon dioxide over a 100-year time horizon and as much as 72 times the
warming potential over a 20-year horizon.23
By 2010, Massachusetts had already
succeeded in reducing methane emissions from the natural gas distribution system by 14
percent below 1990 levels.24
However, greater reductions are still possible by accelerating replacement of leaky pipes.
Natural gas companies could reduce their emissions in Massachusetts to 25 percent below
1990 levels by replacing about 777 miles of cast iron mains (the most leak-prone pipe
material), according to staff calculations.25
19
Calculation is based on data reported for large, stationary facilities during 2011 as part of the Greenhouse Gas
Registry, and is available at http://www.mass.gov/eea/docs/dep/air/climate/11facghg.pdf. These facilities represent
one quarter of Massachusetts’ total emissions inventory. The most recent year for data from Massachusetts’ total
emissions inventory is 2010. In 2010, distribution systems accounted for about 33 percent of total methane
emissions, available at http://www.mass.gov/eea/docs/dep/air/climate/ghginv9012.xls. 20
Companies reported different amounts of methane lost or emitted per year to different agencies—largely due to
differences in reporting methodologies. EIA does not require companies to follow a specific methodology for
calculating natural gas losses, and in some cases, there is a substantial difference between the numbers reported to
EIA and those reported to DEP and EPA. 21
Nathan G. Phillips et al., 2013, “Mapping urban pipeline leaks: Methane leaks across Boston,” Environmental
Pollution, vol. 173, available at http://www.sciencedirect.com/science/article/pii/S0269749112004800. 22
The Global Warming Solutions Act of 2008. 23
According to the EPA, methane has a global warming potential of 21 for a hundred-year time horizon, compared
to carbon dioxide’s global warming potential of 1. The International Panel on Climate Change (IPCC) and
individual studies have assigned a higher global warming potential of 25 and 33 for hundred-year time horizons,
respectively. For more information, see http://www.ipcc.ch/publications_and_data/ar4/wg1/en/ch2s2-10-2.html. 24
Calculation is based on 2010 emissions levels reported in the Greenhouse Gas Inventory,
http://www.mass.gov/eea/docs/dep/air/climate/ghginv9012.xls. 25
Calculation is based on the 1990 emissions levels for the natural gas distribution system in the Massachusetts
Greenhouse Gas Inventory, the emissions reductions reported as of 2010 in the Greenhouse Gas Inventory in 2010
and EPA’s emission rate for cast iron pipelines in 40 CFR Part 98, Subpart W.
6
Nationwide, the natural gas distribution system is the largest source of methane
emissions, accounting for 19 percent of total emissions in 2011, according to the U.S.
Environmental Protection Agency (EPA). EPA also found that recent reductions in U.S.
methane emissions have been driven in part by replacing leak-prone pipelines in
distribution systems.26
More significant pipeline incidents in Massachusetts involved cast iron or other
high-risk pipes. Incidents are four times more likely to occur on cast iron mains than
mains made of other materials, according to an analysis of national pipeline incidents by
the U.S Pipeline and Hazardous Materials Safety Administration (PHMSA).27
In Massachusetts, 57 percent of the significant incidents28
from 2002-2012—attributable
to human error, leaks, natural forces, excavation damage, and a variety of other causes—
occurred around segments of the distribution system utilizing cast iron or steel pipe (see
Table 5 on page 14). One of these incidents, a gas explosion in July 2002 involving a
corroded fitting on a steel pipe, leveled a home and killed two children in Hopkinton,
Mass. Another powerful explosion occurred in Springfield, Mass., last November, as a
result of human error after a worker from Columbia Gas of Massachusetts accidently
punctured a steel service line, which had been retrofitted with plastic, while responding to
a call about a gas leak. The incident resulted in injuries to 17 people and $1.3 million in
property damage, according PHMSA data.
Nationally, a number of recent killer pipeline explosions have been traced to aging, cast
iron pipelines,29
including explosions in Austin, Texas, Philadelphia, and Allentown,
Penn., where a gas main explosion in February 2011 resulted in five fatalities, three
hospitalizations, and eight destroyed homes (see photo on page 3). Some of these
accidents might have been prevented had gas companies performed timelier repair,
rehabilitation and replacement of high-risk pipeline, such as cast iron and unprotected
bare steel pipes, according to PHMSA.30
PHMSA warns that “public safety requires
prompt action [by gas companies] to repair, remediate, and replace high-risk gas pipeline
infrastructure.”
26
EPA, 2013 “Inventory of U.S. Greenhouse Gas Emissions and Sinks: 1990-2011”, available at
http://www.epa.gov/climatechange/Downloads/ghgemissions/US-GHG-Inventory-2013-Main-Text.pdf. The EPA
Inspector General is currently reviewing what actions can be taken to reduce methane leaks from pipelines,
according to the Wall Street Journal, available at
http://online.wsj.com/article/AP68bfefc2d9ce4d2c95fba5214c33dc19.html. 27
PHMSA’s analysis is based on incidents reported from 2005 – 2011, available at
http://opsweb.phmsa.dot.gov/pipeline_replacement/cast_iron_inventory.asp#recent_incidents. 28
Significant Incidents are those incidents reported by pipeline operators to PHMSA when any of the following
conditions are met: 1) Fatality or injury requiring in-patient hospitalization. 2) $50,000 or more in total costs,
measured in 1984 dollars. 3) Highly volatile liquid releases of 5 barrels or more or other liquid releases of 50 barrels
or more. 4) Liquid releases resulting in an unintentional fire or explosion. 29
See http://opsweb.phmsa.dot.gov/pipeline_replacement/cast_iron_inventory.asp#recent_incidents. 30
United States Department of Transportation, Pipeline and Hazardous Materials Safety Administration, 2011,
“White Paper on State Pipeline Infrastructure Replacement Programs,” December, 2011. available at:
http://opsweb.phmsa.dot.gov/pipelineforum/docs/PHMSA%20111011-002%20NARUC.pdf.

7
Table 3: Unaccounted for Gas Volumes and Estimated Cost by Company, 2000-2011, in 2012 dollars
Lower Bounda Upper Boundb
Company
Unaccounted for Gas Volume (mcf)
Estimated Cost of Gas, 2000-2011
Average Cost of Gas per Customer, 2000-2011
Unaccounted for Gas Volume (mcf)
Estimated Cost of Gas, 2000-2011
Average Cost of Gas per Customer, 2000-2011
Berkshire Gas 521,363 $3,327,089 $96 4,985,339 $34,508,094 $998
Blackstone Gas 19,013 $82,400 $63 72,138 $462,469 $352
Boston Gasc 54,938,203 $352,164,446 $604 117,674,912 $780,832,567 $1,340
Columbia Gase 6,098,769 $39,557,300 $143 17,175,142 $113,874,947 $412
Colonial Gasc 14,668,152 $91,740,162 $377 31,055,129 $220,658,386 $907
Essex Gasc 1,861,260 $12,801,477 $380 5,780,463 $43,893,343 $1,302
Fitchburg Gas & Electricd 908,172 $5,905,935 $211 3,592,072 $24,765,349 $886
City of Holyoked 498,363 $2,914,285 $291 818,892 $4,402,208 $440
Middleborough Gas & Electricd 159,915 $757,985 $188 313,768 $1,663,604 $412
New England Gas 2,998,250 $19,585,719 $371 9,353,842 $64,893,441 $1,230
Nstar Gas 16,118,577 $109,076,406 $427 33,654,316 $228,538,748 $895
Wakefield Municipal Gas & Lightd 75,498 $523,290 $88
547,872 $3,304,418 $553
Westfield Gas & Electricd 429,284 $1,816,422 $304 2,130,869 $14,501,210 $2,426
Total 99,294,819 $640,252,916 $273 227,154,754 $1,536,298,783 $935 Source: Staff Analysis of Massachusetts Department of Public Utilities (DPU) Annual Reports. Notes: The transfer of gas costs onto rate payers is based on 220 CMR 6, http://opsweb.phmsa.dot.gov/pipelineforum/docs/PHMSA%20111011-002%20NARUC.pdf and http://www.aga.org/SiteCollectionDocuments/KnowledgeCenter/PGA%20Mechanisms.doc. We calculated the cost of unaccounted for gas by multiplying the reported gas volumes by the NYMEX average futures price for that month, which are commonly used in cost of gas adjustments. We adjusted costs to 2012 dollars according to PHMSA’s methods for adjusting costs associated with pipeline incidents. a Based on the yearly unaccounted for gas volumes reported to DPU, which include negative unaccounted for gas volumes on a monthly basis. b Based on the positive monthly unaccounted for gas volumes reported to DPU, and excludes negative unaccounted for gas volumes. c Owned by National Grid. Of these, Essex Gas was merged into Boston Gas in 2010.
d Data were not available for all the years of our analysis. For the City of Holyoke, data were missing for 2006, 2005, 2004, 2003, 2002, and 2000. For Middleborough Gas & Electric, data were missing for 2006, 2005, and 2001. For Westfield Gas & Electric, data were missing for 2006. For the City of Wakefield, data were missing for 2005, 2004, 2002, and 2001.
eColumbia Gas is a subsidiary of NiSource.
8
The slow pace of fixing leaks
There are some federal and state incentives in place to accelerate the pace of infrastructure
replacement. Massachusetts is one of several forward-looking states that have either established
or are considering policies that create financial incentives for gas companies to repair or replace
leaky infrastructure. Despite these incentives, gas distribution companies’ progress at replacing
leak-prone pipeline remains slow. Specifically, the data show:
U.S. gas companies are replacing less than 5 percent of their leakiest pipes per year. Cast iron and bare steel are the most leak-prone pipe materials, releasing 27.25 and 12.58
cubic feet of methane per hour, per mile, respectively, according to the EPA.31
PHMSA
also lists these materials as high-risk pipeline infrastructure that is prone to failure.32
Nonetheless, last year gas companies nationwide replaced just 3 percent of their cast iron
and bare steel distribution mains—pipes that connect transmission lines to service lines—
with less leak-prone plastic pipes.33
The Massachusetts gas distribution system—which is owned and operated by gas
companies—ranks third among state distribution systems in the total number of miles of
cast iron mains and second in the number of cast iron service lines (or “services”), which
connect mains to customers. The distribution system ranks ninth and fourth in the number
of miles of bare steel mains and services, respectively.34
Gas companies operating in
Massachusetts, however, replaced just 4 percent of cast iron and bare steel pipes in 2012
(see Table 6 on page 16). Of these companies, Boston Gas replaced the most miles (99)
and service lines (3,277) made of cast iron and bare steel in 2012. Since 2004, Boston
Gas and Columbia Gas have reduced their inventory of cast iron and bare steel pipeline
the most. Boston Gas replaced 496 miles of leak-prone mains and Columbia Gas replaced
13,907 leak-prone service lines (Table 6).35
Nationwide, there are few federal or state incentives to repair or replace leaky pipes
or minimize lost gas. Federal pipeline safety regulations require only “hazardous leaks”
posing imminent threat to be repaired promptly, allowing non-hazardous leaks to go
unrepaired.36
Gas companies are required to identify and classify leaks according to risk
as part of their federally mandated Distribution Integrity Management Plans,37
but only
five states require all non-hazardous leaks to be repaired within a certain timeframe.38
31
40 CFR Part 98, Subpart W, available at http://www.gpo.gov/fdsys/pkg/FR-2011-12-23/pdf/2011-31532.pdf. 32
Ibid, 30. 33
Companies may also retrofit bare steel pipelines with protective linings, which also have a lower emissions rate. 34
The ranking is based on PHMSA’s cast and wrought iron and bare steel pipeline inventory, available at:
http://opsweb.phmsa.dot.gov/pipeline_replacement/cast_iron_inventory.asp and
http://opsweb.phmsa.dot.gov/pipeline_replacement/bare_steel_inventory.asp. 35
Both of these companies participate in Massachusetts’ targeted infrastructure replacement program. 36
49 CFR 192 Part 192.703(c). A hazardous leak represents an existing or probable hazard to people or property and
requires immediate action until the conditions are no longer hazardous, according to PHMSA guidance. 37
49 CFR Part 192§§1005-1007. 38
Ibid, 30; and National Association of Pipeline Safety Representatives, “Compendium of State Pipeline Safety
Requirements & Initiatives Providing Increased Public Safety Levels compared to Code of Federal Regulations,”
September 30, 2011, available at:
http://www.phmsa.dot.gov/staticfiles/PHMSA/DownloadableFiles/Files/Pipeline/Compendium.pdf.

9
The Massachusetts legislature is currently considering repair timeframes for all non-
hazardous leaks.39
Thirty-three states, including Massachusetts,40
have infrastructure replacement programs
targeting cast iron and bare steel pipelines that allow companies to recover costs for
replacing their leak-prone pipelines.41
However, companies may have little incentive to
use these programs to accelerate pipeline replacement so long as they can still pass costs
on to customers for lost gas.
Only two states with infrastructure replacement programs, Pennsylvania and Texas, have
established limits on the amount companies can charge customers for lost gas.42
Pennsylvania just took these actions, so the results are not in yet, but in Texas the results
are dramatic. From 2010 to 2012, with four gas companies participating in infrastructure
replacement programs, Texas gas companies reduced their inventory of leak-prone
service lines by 55 percent (101,790 lines). In this same time period, gas companies in
Massachusetts reduced their leak-prone service lines by just 4 percent (8,278 lines).
Notably, the Massachusetts legislature is also considering a cap on allowable
unaccounted for gas, which could provide an additional financial incentive for gas
companies to repair or replace leak-prone pipes.43
It’s hard to monitor company performance because data on unaccounted for gas is
of such poor quality. Companies regularly report negative volumes of unaccounted for
gas, and there can be substantial variance in the numbers reported across agencies (see
Table 7 on page 18). Negative unaccounted for gas volumes indicate calculating or
reporting errors because it’s physically impossible to dispose of more gas than enters a
closed distribution system, according to a 2012 report prepared for the Pennsylvania
Utility Commission.44
This report also noted that inconsistencies in methodologies across
companies can inhibit regulators’ ability to monitor company performance over time.
According to federal and state officials, companies do not use a consistent methodology
to calculate unaccounted for gas. Officials from PHMSA’s Office of Pipeline Safety
explained in an interview for this report that the agency provides companies with a
formula for calculating unaccounted for gas, as well as guidance about the types of
adjustments that are appropriate to make; however, each company decides which
adjustments to make and less sophisticated operators may not make basic adjustments,
39
H. 2933, “An Act enhancing natural gas pipeline safety;” H.2950, “An Act relative to natural gas leaks;” and S.
1580, “An Act relative to natural gas leaks,” available at https://malegislature.gov/Committees/Joint/J37. 40
New England Gas, Columbia Gas, and National Grid (MA)—which includes Boston Gas, Colonial Gas, and
Essex Gas (merged with Boston Gas)—all participate in Massachusetts’ targeted infrastructure replacement
program. 41
Based on the states listed in Ibid, 30 and Ibid, 6. 42
Pennsylvania capped unaccounted for gas at 3 percent, to be phased in over time, and finalized its rule in 2013,
(52 PA Code §59.111). Texas capped unaccounted for gas for distribution systems at 5 percent in 2002. 16 TX
Admin. Code §7.5525. 43
See S. 1580, “An Act relative to natural gas leaks,” available at https://malegislature.gov/Committees/Joint/J37. 44
Ibid, 11.

10
such as adjusting volumes based on standard temperature pressure.45
In Massachusetts,
the Department of Public Utilities requested additional funds in its 2014 budget to hire a
third-party consultant to review companies’ procedures for classifying leaks and
calculating lost and unaccounted for gas. 46
Actions needed to accelerate pipeline replacement
Despite slow progress to date, some state initiatives—like those established or proposed in
Massachusetts—show promise and should be expanded to accelerate the repair or replacement of
leak-prone pipelines. In particular:
States and non-regulated utilities such as municipal gas companies should adopt
cost recovery programs for accelerated replacement of high-risk, leak-prone
pipelines. Companies typically cannot recover the costs of their infrastructure
investments until the utility files for and receives such approval, which can be many
months—and sometimes more than a year—after costs have been incurred.47
Cost
recovery programs allow gas companies to recover the costs of infrastructure
improvements on a timelier basis, which could provide more incentive for companies to
replace their leaky pipelines.48
Ratepayers and the public may also benefit from these
programs through increased safety, reductions in rates from decreased operations and
maintenance and unaccounted for gas costs,49
and reduced greenhouse gas emissions,
according to a recent analysis of such programs in New England.
Taking into account widely accepted assumptions from the EPA regarding the rate of gas
leaks, global warming potential and the social cost of carbon, and including costs
associated with replacing pipelines, Massachusetts residents stand to realize $156 million
in net benefits over 10 years from the companies participating in the commonwealth’s
infrastructure replacement program.50
One of these companies, Colonial Gas, increased
their annual replacement rate of leak-prone pipeline by an average of 7 percent for
45
Examples of appropriate adjustments are temperature, pressure, heat content, meter reading cycles, calculable
losses from leaks or maintenance. PHMSA’s guidance is available at
http://www.phmsa.dot.gov/staticfiles/PHMSA/DownloadableFiles/Forms/Gas%20Distr%20Annual%20Report%20I
nstructions%20-%20PHMSA%20F%207100.1-1%20(01-2011).pdf. 46
Ibid, 12. 47
American Gas Association, “Infrastructure Cost Recovery Mechanisms,” December, 2007, available at:
http://www.aga.org/SiteCollectionDocuments/RatesReg/0712INFRASREPLAC.pdf. 48
While timelier cost recovery increases companies’ incentives to replace infrastructure, it may also reduce
companies’ incentive to control costs, as noted in a National Regulatory Research Institute analysis, “How
Regulators Should View Cost Trackers” Sept. 2009, available at
http://nrri.org/pubs/gas/NRRI_cost_trackers_sept09-13.pdf. 49
These reductions would help offset some, but not all, of the rate increase associated with replacing leak-prone
infrastructure. For an example of how such a program might impact Massachusetts ratepayers, see the Attorney
General’s comments in the National Grid petition for targeted infrastructure cost recovery, available at
http://www.env.state.ma.us/dpu/docs/gas/10-55/11310dpuord.pdf. 50
The companies were National Grid (Boston Gas and Colonial Gas), New England Gas, and Columbia Gas. The
Analysis Group, Inc. “Summary of Quantifiable Benefits and Costs Related to Select Targeted Infrastructure
Replacement Programs,” January, 2013, available at
http://www.analysisgroup.com/uploadedFiles/Publishing/Articles/Benefits_Costs_TIRF_Jan2013.pdf.
11
service lines and 13 percent for main lines during its two years in the program. The other
companies participating in the cost recovery program—Boston Gas, New England Gas,
and Colombia Gas—have not appreciably improved their replacement rates of leak-prone
pipes. This suggests that additional financial incentives, such as those currently under
consideration by the Massachusetts legislature, may be needed.51
In 2009, Secretary of Transportation Ray LaHood called on states to adopt and expand
infrastructure replacement programs. Forty-six states have leak-prone pipelines and could
benefit from such programs, but so far only 33 states, including Massachusetts,52
have
answered LaHood’s call to action.
States and non-regulated utilities should establish timeframes for repairing non-
hazardous gas leaks. Gas companies are already required by federal regulation to
identify, classify, and manage safety risks posed by leaks.53
Nonetheless, leaks that do
not pose a safety risk may continue unabated. Just five states—Florida, Georgia, Kansas,
Maine and Texas—have established firm timeframes for repairing all non-hazardous
leaks, with timeframes ranging from 3 months to 36 months for the least hazardous
leaks.54
As noted by the Conservation Law Foundation, this program may be having an
effect, as Maine had one of the lowest lost gas rates in the country, according to data
from the Energy Information Administration.55
The Massachusetts legislature is
considering repair timeframes for all non-hazardous leaks.56
States and non-regulated utilities should adopt a standard definition and
methodology for calculating unaccounted for gas. Inconsistent data reported by
companies inhibits regulators’ ability to perform oversight, according to the Pennsylvania
Public Utility Commission and others.57
Furthermore, negative unaccounted for gas
levels are indicative of calculating or reporting discrepancies, not actual gas volumes—
and PHMSA does not allow companies to report negative values. To address this issue,
the Pennsylvania Commission adopted a standard definition and methodology for
unaccounted for gas, based in part on PHMSA’s definition.58
Other states with similar
reporting issues should follow Pennsylvania’s lead. Massachusetts state regulators plan to
study the issue. 59
51
In the current legislative session, Massachusetts has at least two other innovative financing proposals for
infrastructure replacement under consideration, including one—H. 2990 “An Act establishing natural gas
infrastructure improvement financing”—specific to financing the repair of non-hazardous leaks. 52
Ibid, 51. 53
49 CFR Part 192 §1007. 54
Ibid, 6. 55
Ibid, 6. 56
H. 2933, “An Act enhancing natural gas pipeline safety;” H.2950, “An Act relative to natural gas leaks;” and S.
1580, “An Act relative to natural gas leaks,” available at https://malegislature.gov/Committees/Joint/J37. 57
Pennsylvania Public Utility Commission Public Meeting held June 7, 2012 Re: Proposed Rulemaking Order,
Docket No. L-2012-2294746 and Ibid, 6. 58
Ibid, 57. 59
Ibid, 12.

12
States and non-regulated utilities should limit the ability of gas companies to recover
costs for unaccounted for gas. Limiting the amount of unaccounted for gas for which
companies can charge would create a powerful financial incentive for gas companies to
minimize emissions. As noted earlier, Pennsylvania and Texas are the only states that
have set statewide caps on the percentages of gas for which companies can recover
costs.60
In both states, companies can recover costs for no more than 5 percent of the
unaccounted for gas, and Pennsylvania plans to lower that to 3 percent in coming years.61
In finalizing its plan earlier this year, the Pennsylvania Public Utility Commission stated
that eliminating cost recovery for gas lost above the cap shifts the financial burden of lost
gas from the ratepayer to the gas company. That approach appears to have worked in
Texas, which reduced its inventory of leak-prone service lines by an impressive 55
percent over the last two years. As noted earlier, the Massachusetts legislature is
considering a cap on allowable unaccounted for gas.62
To encourage action on these measures and build on Massachusetts’ efforts, Sen. Markey is
currently drafting legislation amending the Public Utilities Regulatory Policy Act of 1978.
American consumers, businesses and communities now pay for gas they don’t receive and bear
the risks of gas leaks they cannot repair. Gas distribution companies, on the other hand, have
little reason to treat leaky pipelines as an urgent problem. They may even make money off of lost
gas because they’re reimbursed whether it reaches the home or not. The Markey legislation will
help make sure gas companies take responsibility and fix their leaks.
60
Pennsylvania and Texas are the only states with permanent, statewide caps in place. Other states may have
temporary caps or company-specific caps in place. 61
Ibid, 28. 62
See S. 1580, “An Act relative to natural gas leaks,” available at https://malegislature.gov/Committees/Joint/J37.
13
Appendix
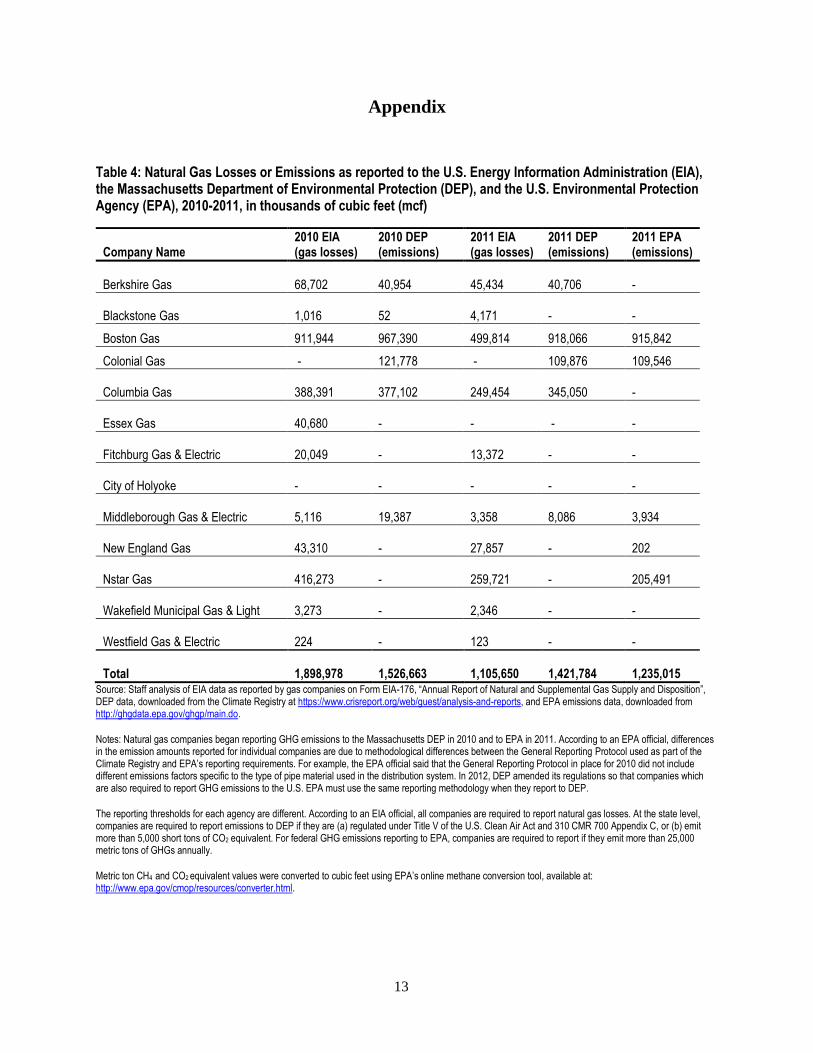
Table 4: Natural Gas Losses or Emissions as reported to the U.S. Energy Information Administration (EIA), the Massachusetts Department of Environmental Protection (DEP), and the U.S. Environmental Protection Agency (EPA), 2010-2011, in thousands of cubic feet (mcf)
Company Name 2010 EIA (gas losses)
2010 DEP (emissions)
2011 EIA (gas losses)
2011 DEP (emissions)
2011 EPA (emissions)
Berkshire Gas 68,702 40,954 45,434 40,706 -
Blackstone Gas 1,016 52
4,171 - -
Boston Gas 911,944 967,390 499,814 918,066 915,842
Colonial Gas - 121,778 - 109,876 109,546
Columbia Gas 388,391 377,102 249,454 345,050 -
Essex Gas 40,680 - - - -
Fitchburg Gas & Electric 20,049 - 13,372 - -
City of Holyoke - -
- - -
Middleborough Gas & Electric 5,116 19,387
3,358 8,086
3,934
New England Gas 43,310 - 27,857 -
202
Nstar Gas 416,273 - 259,721 - 205,491
Wakefield Municipal Gas & Light 3,273 -
2,346 - -
Westfield Gas & Electric 224 -
123 - -
Total 1,898,978 1,526,663 1,105,650 1,421,784 1,235,015
Source: Staff analysis of EIA data as reported by gas companies on Form EIA-176, “Annual Report of Natural and Supplemental Gas Supply and Disposition”, DEP data, downloaded from the Climate Registry at https://www.crisreport.org/web/guest/analysis-and-reports, and EPA emissions data, downloaded from http://ghgdata.epa.gov/ghgp/main.do.
Notes: Natural gas companies began reporting GHG emissions to the Massachusetts DEP in 2010 and to EPA in 2011. According to an EPA official, differences in the emission amounts reported for individual companies are due to methodological differences between the General Reporting Protocol used as part of the Climate Registry and EPA’s reporting requirements. For example, the EPA official said that the General Reporting Protocol in place for 2010 did not include different emissions factors specific to the type of pipe material used in the distribution system. In 2012, DEP amended its regulations so that companies which are also required to report GHG emissions to the U.S. EPA must use the same reporting methodology when they report to DEP.
The reporting thresholds for each agency are different. According to an EIA official, all companies are required to report natural gas losses. At the state level, companies are required to report emissions to DEP if they are (a) regulated under Title V of the U.S. Clean Air Act and 310 CMR 700 Appendix C, or (b) emit more than 5,000 short tons of CO2 equivalent. For federal GHG emissions reporting to EPA, companies are required to report if they emit more than 25,000 metric tons of GHGs annually.
Metric ton CH4 and CO2 equivalent values were converted to cubic feet using EPA’s online methane conversion tool, available at: http://www.epa.gov/cmop/resources/converter.html.

Table 5: Significant Incidents on Massachusetts Gas Distribution Pipelines, as Reported to PHMSA, 2002-2012a
Date City Operator Cause
Injuries Property Damage
Type of Pipe
05/24/2002 Framingham Nstar Gas Excavation Damage
0 $186,437 Steel
02/13/2003 Turners Falls Berkshire Gas Other Cause
0 $550,330 Steel
11/21/2003 New Bedford Nstar Gas Other Cause
0 $391,346 No data reported
04/13/2004 Walpole Columbia Gas Other Cause
0 $182,281 Steel
04/06/2005 Boston Boston Gas Other Cause
1 $0 No data reported
11/09/2005 Lexington Boston Gas Other Cause
0 $1,661,938 No data reported
04/28/2006 Needham Nstar Gas Unknown Cause
1 $22,285 Plastic
03/08/2007 Peabody Boston Gas Unknown Cause
0 $110,386 No data reported
05/17/2007 Wapole Columbia Gas Unknown Cause
1 $27,399 Plastic
09/10/2007 Easton Columbia Gas Unknown Cause
2 $2,208,346 Other
01/03/2008 Maynard Nstar Gas Unknown Cause
0 $161,597 Steel
01/25/2009 Gloucester Boston Gas Unknown Cause
1 $416,505 Cast iron (likely)c
03/09/2009 West Barnstable Colonial Gas Unknown Cause
0 $364,442 Plastic
01/15/2010 Waltham Boston Gas Incorrect Operation
0 $510,449 Steel
01/25/2010 Reading Boston Gas Natural Force Damage
1 $255,224 Cast iron
01/23/2011 West Springfield Columbia Gas Other Cause
0 $104,409 Steel
14
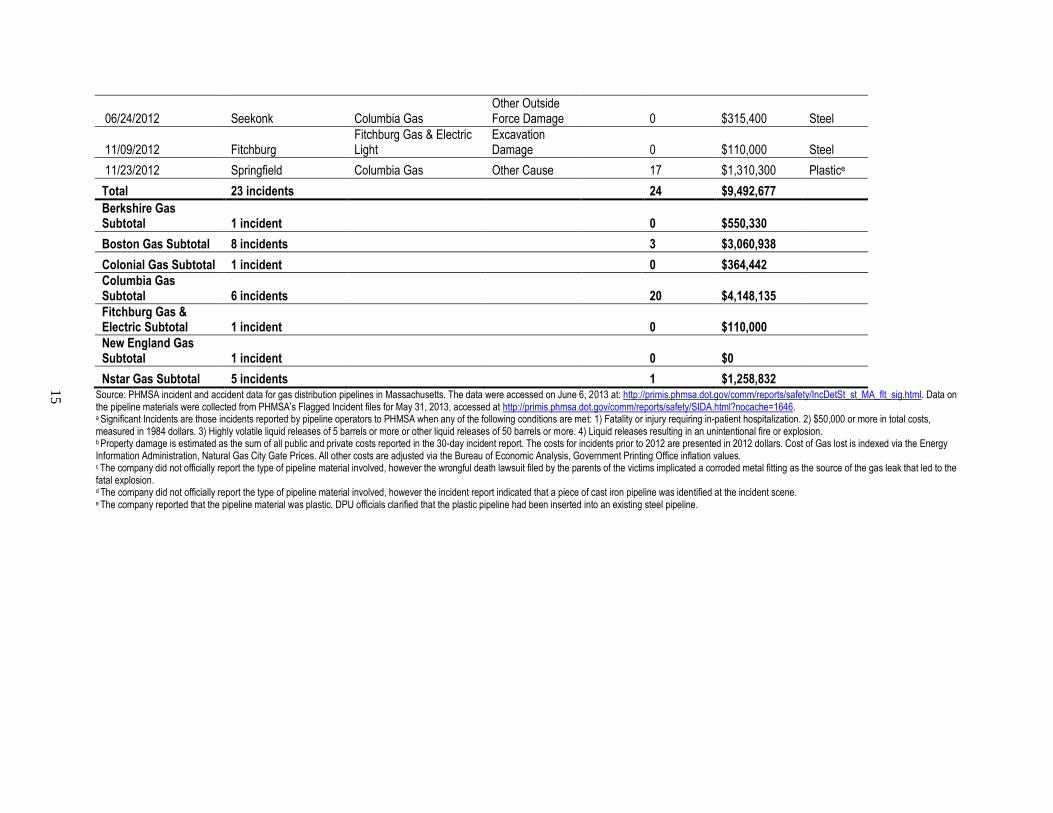
06/24/2012 Seekonk Columbia Gas Other Outside Force Damage
0 $315,400 Steel
11/09/2012 Fitchburg Fitchburg Gas & Electric Light
Excavation Damage
0 $110,000 Steel
11/23/2012 Springfield Columbia Gas Other Cause
17 $1,310,300 Plastice
Total 23 incidents
24 $9,492,677
Berkshire Gas Subtotal 1 incident 0 $550,330
Boston Gas Subtotal 8 incidents 3 $3,060,938
Colonial Gas Subtotal 1 incident 0 $364,442 Columbia Gas Subtotal 6 incidents 20 $4,148,135 Fitchburg Gas & Electric Subtotal 1 incident 0 $110,000 New England Gas Subtotal 1 incident 0 $0
Nstar Gas Subtotal 5 incidents 1 $1,258,832 Source: PHMSA incident and accident data for gas distribution pipelines in Massachusetts. The data were accessed on June 6, 2013 at: http://primis.phmsa.dot.gov/comm/reports/safety/IncDetSt_st_MA_flt_sig.html. Data on the pipeline materials were collected from PHMSA’s Flagged Incident files for May 31, 2013, accessed at http://primis.phmsa.dot.gov/comm/reports/safety/SIDA.html?nocache=1646. a Significant Incidents are those incidents reported by pipeline operators to PHMSA when any of the following conditions are met: 1) Fatality or injury requiring in-patient hospitalization. 2) $50,000 or more in total costs, measured in 1984 dollars. 3) Highly volatile liquid releases of 5 barrels or more or other liquid releases of 50 barrels or more. 4) Liquid releases resulting in an unintentional fire or explosion. b Property damage is estimated as the sum of all public and private costs reported in the 30-day incident report. The costs for incidents prior to 2012 are presented in 2012 dollars. Cost of Gas lost is indexed via the Energy Information Administration, Natural Gas City Gate Prices. All other costs are adjusted via the Bureau of Economic Analysis, Government Printing Office inflation values. c The company did not officially report the type of pipeline material involved, however the wrongful death lawsuit filed by the parents of the victims implicated a corroded metal fitting as the source of the gas leak that led to the fatal explosion. d The company did not officially report the type of pipeline material involved, however the incident report indicated that a piece of cast iron pipeline was identified at the incident scene. e The company reported that the pipeline material was plastic. DPU officials clarified that the plastic pipeline had been inserted into an existing steel pipeline.
15

Table 6: Replacement rates for leak-prone pipeline in Massachusetts, by company, 2004-2012
Replacement rate
Company Name
Leak-prone Pipeline Replaced Since 2004 2005 2006 2007 2008 2009 2010 2011 2012
Leak-prone Pipeline Remaining in 2012
Berkshire Gas - Main Miles 23 -2% -73% 251% -2% -2% -2% -3% -4% 115
Berkshire Gas - Service Lines 1,088 -3% -3% -3% -2% -2% -4% -2% -5% 3,864
Blackstone Gas - Main Miles 2 0% 0% 0% 0% 0% 0% 100% 0% 0
Blackstone Gas - Service Lines 0 0% 0% 0% 0% 0% 0% 0% 0% 0
Boston Gas - Main Milesa,b 496 -1% -2% -1% -1% -2% -3% -2% -3% 2,997
Boston Gas - Service Linesa,b 6,609 -2% 13% -1% -2% -3% -5% -3% -3% 90,523
Colonial Gas - Main Milesa,b 189 -1% -2% -2% -3% -3% -5% -19% -17% 253
Colonial Gas - Service Linesa,b 1,078 26% 1% -6% -8% -6% -3% -10% -10% 4,466
Columbia Gas - Main Milesb,c 344 -5% -5% -4% -4% -3% -2% -4% -4% 979
Columbia Gas - Service Linesb,c 13,907 -3% -4% -3% -3% -3% -3% -3% -4% 46,622
Essex Gas - Main Milesa,b 23 -2% -4% -1% -1% -3% -6% 1% -3% 111
Essex Gas - Service Linesa,b 533 -1% 4% -2% -2% -3% -2% -3% -3% 4,433
Fitchburg Gas & Electric - Main Milesb 21 -83% 433% -3% -3% -3% -3% -3% -4%
66
Fitchburg Gas & Electric - Service Linesb -490 -6% -14% -8% -9% -8% 119% -6% -8%
3,379
City of Holyoke Main Miles 6 0% -2% 0% -3% -3% 0% -2% 0% 58
City of Holyoke Service Lines 1,127 -2% -4% -2% -2% -5% -3% -7% -10% 2,557
16

Middleborough Gas & Electric Main Miles 5 -1% -90% 795% 0% 0% 0% -17% -7%
11
Middleborough Gas & Electric Service Lines 86 -7% -3% -9% -5% -3% -3% -3% -10% 149
New England Gas Main Milesb 17 -1% -1% -1% -2% -3% -3% 8% -4% 185
New England Gas Service Linesb -5,637 -2% -5% -2% -11% -13% -19% 448% -5% 8,813
Nstar Gas Main Miles 145 -3% -2% -2% -2% -3% -2% -3% -3% 716
Nstar Gas Service Lines 9,303 -2% -4% -2% -3% -4% -4% -4% -5% 26,514
Wakefield Municipal Gas & Light Main Miles 11 -1% -3% -4% -1% -1% -9% -4% -3% 37
Wakefield Municipal Gas & Light Service Lines 529 0% -4% -4% -1% -4% -7% -8% -2% 1,463
Westfield Gas & Electric Main Miles 15 -4% -2% -2% -2% -5% -4% -1% -10% 42
Westfield Gas & Electric Service Lines 493 14% -7% -6% -8% -6% -4% -4% -5%
1,543
Massachusetts - Main Miles 1,293 -3% -3% 0% -2% -2% -3% -3% -4% 5,571
Massachusetts - Service Lines 28,419 -2% -4% -2% -3% -4% -3% 0% -4% 194,326
National- Main Miles 20,944 -5% -3% -3% -2% -4% 3% -4% -3% 93,705
National- Services 2,036,032 -10% 4% -2% -2% -4% -35% -4% -12% 2,568,279 Source: Staff analysis of PHMSA’s Cast and Wrought Iron and Bare Steel Pipeline Inventory, available at: http://opsweb.phmsa.dot.gov/pipeline_replacement/cast_iron_inventory.asp and http://opsweb.phmsa.dot.gov/pipeline_replacement/bare_steel_inventory.asp respectively. Notes: According to PHMSA officials, changes in replacement rates are generally due to three factors: (1) pipeline replacement, (2) acquisition of or selling off part of a distribution pipeline, or (3) changes in pipeline classification due to updated information or recordkeeping. a Owned by National Grid. Essex Gas was merged into Boston Gas in 2010.
b Participating in Massachusetts’ Targeted Infrastructure Replacement Program. Fitchburg Gas & Electric applied in 2011.
cColumbia Gas is a subsidiary of NiSource.
17
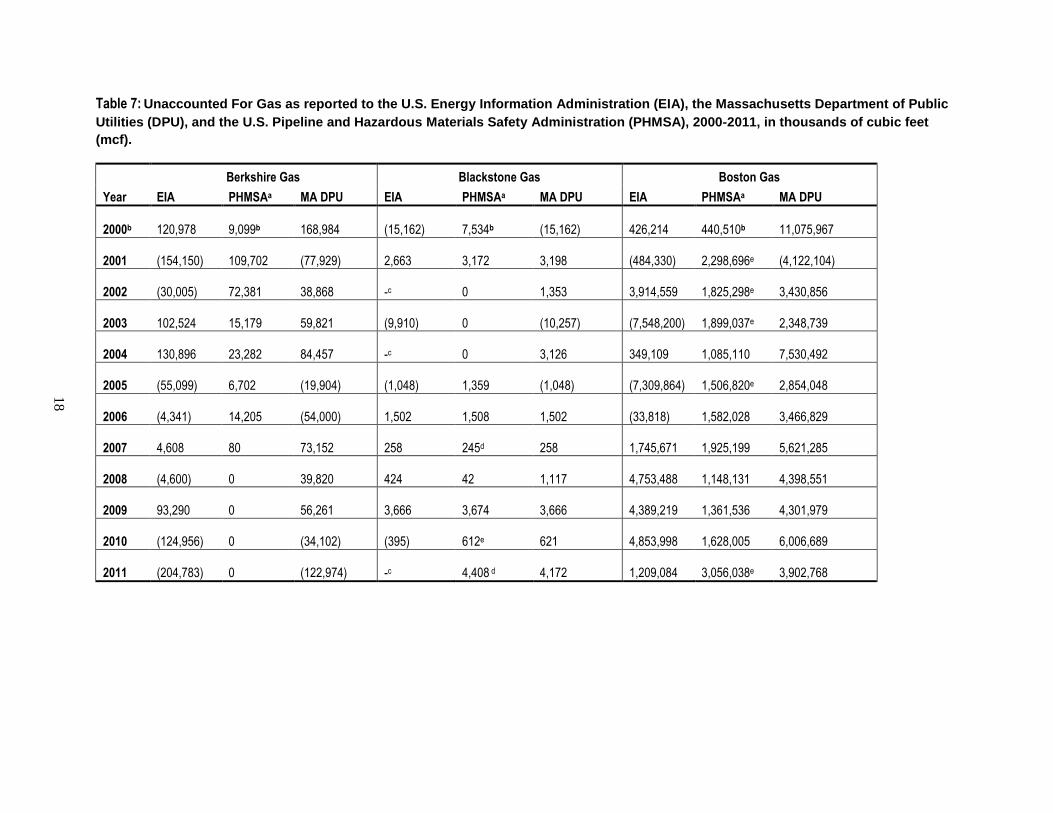
Table 7: Unaccounted For Gas as reported to the U.S. Energy Information Administration (EIA), the Massachusetts Department of Public
Utilities (DPU), and the U.S. Pipeline and Hazardous Materials Safety Administration (PHMSA), 2000-2011, in thousands of cubic feet
(mcf).
Berkshire Gas Blackstone Gas Boston Gas
Year EIA PHMSAa MA DPU EIA PHMSAa MA DPU EIA PHMSAa MA DPU
2000b 120,978
9,099b
168,984
(15,162)
7,534b
(15,162)
426,214
440,510b
11,075,967
2001 (154,150)
109,702
(77,929)
2,663
3,172
3,198
(484,330)
2,298,696e
(4,122,104)
2002 (30,005)
72,381
38,868
-c
0
1,353
3,914,559
1,825,298e
3,430,856
2003 102,524
15,179
59,821
(9,910)
0
(10,257)
(7,548,200)
1,899,037e
2,348,739
2004 130,896
23,282
84,457
-c 0
3,126
349,109
1,085,110
7,530,492
2005 (55,099) 6,702
(19,904)
(1,048) 1,359
(1,048)
(7,309,864)
1,506,820e
2,854,048
2006 (4,341) 14,205
(54,000)
1,502 1,508
1,502
(33,818)
1,582,028
3,466,829
2007 4,608 80
73,152
258 245d
258
1,745,671
1,925,199
5,621,285
2008 (4,600)
0
39,820
424 42
1,117
4,753,488
1,148,131
4,398,551
2009 93,290
0
56,261
3,666
3,674
3,666
4,389,219
1,361,536
4,301,979
2010 (124,956)
0
(34,102)
(395)
612e
621
4,853,998
1,628,005
6,006,689
2011 (204,783)
0
(122,974)
-c
4,408 d
4,172
1,209,084
3,056,038e
3,902,768
18

Colonial Gas Columbia Gas Essex Gas
Year EIA PHMSAa MA DPU EIA PHMSAa MA DPU EIA PHMSAa MA DPU
2000 4,156,770
261,174b
3,345,846
560,631
654,861b
383,435
448,976
39,116b
299,459
2001 1,547,492
818,573
1,617,123
748,841 0
(299,313)
531,639
150,556
506,173
2002 1,017,066
646,801
1,056,732
(1,828,316)
171,874
(95,467)
138,544
210,175
145,516
2003 (2,012,982)
224,138
167,355
846,681
526,380
967,263
397,023
29,213
(7,006)
2004 3,661,867
196,647
339,082
432,808
500,806
435,819
-c
82,640
224,803
2005 (1,665,602)
460,716
1,378,995
141,385
350,591
168,940
-c
193,763
288,613
2006 444,983
455,120
847,750
495,274
472,090
505,677
61,068
134,072
102,530
2007 (2,810,835)
962,352e
1,160,167
422,819
239,207
431,702
(873,400)
15,633
178,873
2008 1,757,733
505,349
1,105,796
897,251 889,654
906,609
589,382
0
105,165
2009 3,803,689
509,276
2,109,285
914,520 775,345
951,102
(65,256)
0
10,128
2010 2,660,178
459,805
1,268,962
(366,512) 889,321
803,978
(70,192)
0
(37,516)
2011 (116,205)
630,792
271,059
273,855
730,366
544,244
-c
-c -c
19
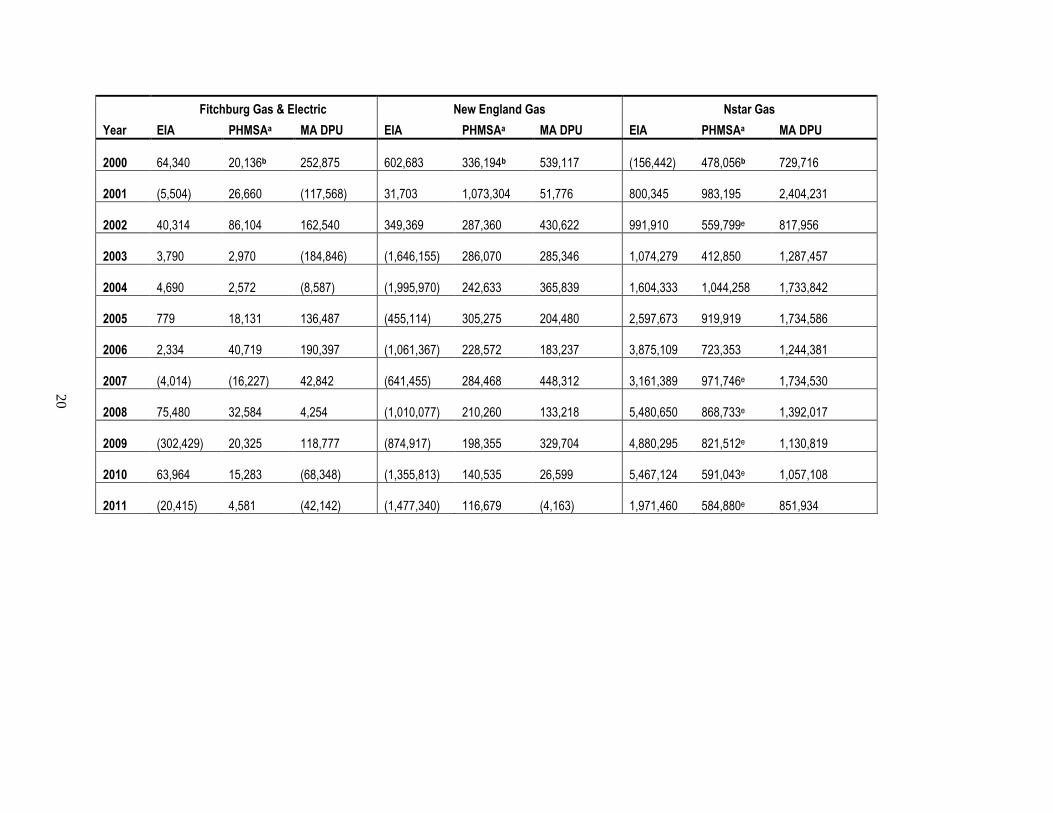
Fitchburg Gas & Electric New England Gas Nstar Gas
Year EIA PHMSAa MA DPU EIA PHMSAa MA DPU EIA PHMSAa MA DPU
2000 64,340
20,136b
252,875
602,683
336,194b
539,117
(156,442)
478,056b
729,716
2001 (5,504)
26,660
(117,568)
31,703
1,073,304
51,776
800,345
983,195
2,404,231
2002 40,314
86,104
162,540
349,369
287,360
430,622
991,910
559,799e
817,956
2003 3,790
2,970
(184,846)
(1,646,155)
286,070
285,346
1,074,279
412,850
1,287,457
2004 4,690
2,572
(8,587)
(1,995,970)
242,633
365,839
1,604,333
1,044,258
1,733,842
2005 779
18,131
136,487
(455,114)
305,275
204,480
2,597,673
919,919
1,734,586
2006 2,334
40,719
190,397
(1,061,367)
228,572
183,237
3,875,109
723,353
1,244,381
2007 (4,014)
(16,227)
42,842
(641,455)
284,468
448,312
3,161,389
971,746e
1,734,530
2008 75,480
32,584
4,254
(1,010,077)
210,260
133,218
5,480,650
868,733e
1,392,017
2009 (302,429)
20,325
118,777
(874,917)
198,355
329,704
4,880,295
821,512e
1,130,819
2010 63,964
15,283
(68,348)
(1,355,813)
140,535
26,599
5,467,124
591,043e
1,057,108
2011 (20,415)
4,581
(42,142)
(1,477,340)
116,679
(4,163)
1,971,460
584,880e
851,934
20

City of Holyoke Middleborough Gas and Electric Wakefield Municipal Gas & Light Department
Year EIA PHMSAa MA DPU EIA PHMSAa MA DPU EIA PHMSAa MA DPU
2000 26,252
11,076b
-c
9,604
5,546b
9,604
372
4,180b
(1,547)
2001 404
-c
403
5,368
1,615b
-c
12,604
4,683b -c
2002 65,469
26,759b
-c
33,798
18,404b
29,723
12,284 -c -c
2003 88,471
-c
-c
26,219
27,329
22,617
14,615
7,837b, d
12,494
2004 100,409
-c
-c
22,558
21,316d
23,289
18,345
6,345b -c
2005 -c
-c
-c
7,846
3,256b
-c
28,796 -c -c
2006 39,185
-c
-c
(1,663) -c
-c
10,968
10,761b
9,386
2007 92,669
6,076b
90,666
52,692
4,053b
(9,606)
14,711
8,536 d
9,904
2008 92,041
63,800
84,155
(2,070)
8,871
10,232
50,687
14,413e
21,041
2009 (49,658)
161,684
163,870
28,763
36,704d
36,653
18,270
9,905
19,877
2010 46,100
74,063
103,923
22,072
20,813d
20,256
15,752
17,709
1,398
2011 51,876
103,358
55,346
4,381
8,515
7,541
16,857
17,697
1,398
21

Westfield Municipal Gas & Light Department
Year EIA PHMSAa MA DPU
2000 34,191
39,246b
98,687
2001 7,404
54,448
24,890
2002 35,730
47,617
63,304
2003 (46,922)
52,823
37,398
2004 26,659
43,856
82,085
2005 (31,237)
28,761
10,465
2006 53,718 16,603b
-c
2007 50,401
37,696b
112,455
2008 (97,848)
33,429
(53,350)
2009 (79,530)
49,255
(55,449)
2010 (8,176)
12,682
(7,412)
2011 (44,794)
7,455
(45,652)
Sources: Energy Information Administration, EIA Form 176, “Ánnual Report of Natural and Supplemental Gas Supply and Disposition”, Unaccounted for Gas item, PHMSA, “Annual Gas Distribution Reports”, Form 7100.1.1, Unaccounted for Gas Percent., and Annual Reports filed with the Massachusetts DPU. The reporting timeframes are different for PHMSA versus EIA and DPU. Specifically, PHMSA requests data for the previous year through June 30 of the reporting year, while EIA and DPU request data for the previous calendar year. a Unaccounted for Gas is reported annually to PHMSA as a percentage. Based on discussions with PHMSA officials, we calculated a volume of gas by multiplying that percentage by the amount of reported gas made and purchased for one year through June 30 of the reporting year, per the instructions in PHMSA’s Annual Gas Distribution Report Form 7100.1.1. b Only partial year data were available, since annual reports from the Massachusetts DPU were not available for both of the years necessary to calculate the gas volume from the unaccounted for gas percentage reported to PHMSA. c No data were available for this year, either because annual reports from the Massachusetts DPU were not available, or companies did not report data for this field to EIA. d The percentage of unaccounted for gas reported to PHMSA and DPU were the same, however the volumes are different. Some of this variation may be due to differences in reporting timeframes (e.g. July 1 of the previous year-June 30 of the reporting year for PHMSA and calendar year for DPU). e The percentage of unaccounted for gas reported to PHMSA was greater than that reported to DPU, however the PHMSA volume listed here is less than that listed for DPU. Some of this variation may be due to differences in reporting timeframes (e.g. July 1 of the previous year-June 30 of the reporting year for PHMSA and calendar year for DPU).
Notes: Boston Gas, Colonial Gas, and Essex Gas are subsidiaries of National Grid. Essex Gas was merged into Boston Gas in 2010.
Columbia Gas is a subsidiary of NiSource.
22