Embed Size (px)
Citation preview

AMENDED: Pre-release Termination and Post-release Recidivism Rates of Colorado’s Probationers: FY 2005 Releases January 15, 2007
A report in compliance with Footnote 86 of the 2006 Appropriations Bill, HB06-1385
This report was prepared and submitted to the legislature on October 13, 2006 in compliance with Footnote 86 of the 2006 Appropriations Bill. The original report did not include a cohort of FY2005 releases, as modifications in the case management system were being made. The original report was prepared without private probation releases which effected success rates for adult offenders supervised on regular probation supervision only. Exclusion of this cohort of cases did not allow a comparison with previous years. Modifications in the case management system were completed in December 2006, allowing for the addition of the private probation releases (6,644 cases). This Amended: Pre-release Termination and Post-release Recidivism Rates of Colorado Probationers Report includes private probation releases for FY2005 and therefore can be compared to previous reports that have been prepared over the past ten years.
Division of Probation Services,
Research and Evaluation Unit State Court Administrator’s Office Colorado Judicial Branch
January 15, 2007

Pre-release Termination and Post-release Recidivism Rates of Colorado’s Probationers: FY 2005 Releases A report submitted to the General Assembly’s Joint Budget Committee to satisfy the conditions of Footnote 86 of the 2006 Appropriations Bill, HB06-1385 January 15, 2007 Prepared by Ken Schlessinger Division of Probation Services
Colorado Judicial Branch Gerald A. Marroney, State Court Administrator Thomas Quinn, Director, Division of Probation Services Eileen Kinney; Manager, Research and Evaluation Unit

i
FOOTNOTE 86 This report satisfies the conditions laid out in Footnote 86 of the General Assembly’s 2006 Appropriations Bill, HB06-1385
Judicial Department, Probation and Related Services -- The Judicial Department is requested to provide by November 1 of each year a report on pre release rates of recidivism and unsuccessful terminations and post-release recidivism rates among offenders in all segments of the probation population, including
adult and juvenile intensive supervision,
adult and juvenile minimum, medium, and maximum supervision and
the female offender program. The department is requested to include information about the disposition of pre-release failures and post-release recidivists, including
how many offenders are incarcerated (in different kinds of facilities) and
how many return to probation as the result of violations. For the eleventh consecutive year, the Judicial Branch’s Division of Probation Services has met the conditions of the above footnote by preparing a report on recidivism. This report stands as an independent document intended to fulfill the requirements contained in footnote 86 of the 2006 Appropriations Bill.

ii
Tables1
Table 1: Regular Probation: Juvenile Probation Comparison (FY2004 and FY2005) and Adult Probation Comparisons (FY2004 and FY2005) Terminations Page 4 Table 2: Regular Probation: Juvenile Probation Comparison (FY2004 and FY2005) and Adult Probation Successful Terminations with Proportion New Case Filed Terminations Page 5 Table 3: Regular Probation: Juvenile Probation Termination Type by Supervision Level – FY2005 Compared with Overall Termination Type - FY2004 Page 7 Table 4: Juvenile Intensive Supervision Probation Termination Type – FY2005 Compared with Juvenile ISP Termination Type - FY2004 Page 8 Table 5: Regular Probation: Adult Probation Termination Type by Supervision Level – FY2005, Compared with Termination Type FY2004 Page 9 Table 6: Specialized Programs: Adult Probation Termination Type by Program – FY2005 Compared with Specialized Programs Termination Type - FY2004 Page 10 Table 7: Regular Probation: Juvenile Post-release Recidivism by Last Supervision Level – FY2005 Compared with Overall Post-Release Recidivism Findings - FY2004 Page 11 Table 8: Juvenile ISP: Post-Release Recidivism by Last Supervision Level – FY2005 Compared with Overall Post-Release Recidivism Findings - FY2004 Page 11 Table 9: Regular Probation: Adult Post-Release Recidivism by Last Supervision Level – FY2005 and comparison to Post-Release Recidivism for FY2004 Page 12 Table 10: Specialized Probation Programs: Adult Successful Terminations and Proportion with New Case Filed – FY2005 Compared with Overall Post-Release Recidivism Findings – FY2004 Page 13 Table 11: Regular Probation: Overall Juvenile Program Failures and Successes – FY2005 Compared with Overall Post-Release Recidivism Findings – FY2004 Page 14 Table 12: Juvenile ISP: Overall Program Failure and Success – FY2005 and FY2004 Page 15
1 Note: Table percentages may not total to 100% because of rounding .

iii
Tables Table 13: Juvenile Regular Probation and JISP: Placement of Juvenile Probationers Who Terminated Probation for Technical Violations or a New Crime: FY2005 Page 16 Table 14: Juvenile Regular Probation and JISP: Placement of Juvenile Probationers Who Successfully Completed Probation and had a New Filing Post-Release: FY2005 Page 17 Table 15: Regular Probation: Overall Adult Program Failures and Successes – FY2005 compared with Overall Adult Program Failures and Successes FY2004 Page 19 Table 16: Specialized Programs Overall Adult Program Failures and Successes: FY2005 and FY2004 Page 20 Table 17: All Adult Probation Programs: Placement of Adult Probationers Who Terminated Probation for Technical Violations or a New Crime: FY2005 Page 22 Table 18: All Adult Probation Programs: Placement of Adult Probationers Who Successfully Terminated Probation and had a New Filing Post-Release: FY2005 Page 23

iv
Pre-release Termination and Post-release Recidivism Rates of Colorado’s Probationers: FY 2005 Releases Executive Summary Introduction The Judicial Branch’s Division of Probation Services annually prepares a report on recidivism among probationers. This executive summary provides an overview of the findings of the full report on the pre-release failure and one-year post-release recidivism for probationers terminated during FY2005. This report uses two definitions of recidivism: one that pertains to pre-release recidivism/failure (while still on probation supervision) and the second pertaining to recidivism post-release (after terminating from probation supervision). These are defined as follows: Pre-release recidivism/failure:
An adjudication or conviction for a felony or misdemeanor, or a technical violation relating to a criminal offense, while under supervision in a criminal justice program.
Post-release recidivism:
A filing for a felony or misdemeanor within one year of termination from program placement for a criminal offense.
Research Questions The General Assembly’s footnote, requiring this study, requests the following research questions be answered. 1. What proportions of probationers were terminated from probation for the commission
of a new crime (pre-release recidivism)? What proportions of probationers were terminated for a technical violation (pre-release failure)? Finally, what proportion of probationers successfully terminated?
2. What proportion of probationers had a juvenile delinquency petition or a criminal
case filed in Colorado within one year of termination of probation (post-release recidivism)?
3. What are the differences in pre-release and post-release recidivism rates for the
following groups: - regular probationers in each supervision level, - probationers in each of the specialized probation programs (adult and
juvenile intensive supervision probation and the adult female offender program)?

v
4. What is the overall failure rate of juvenile and adult probationers? That is, when
unsuccessful terminations (both new crime and technical violations) are combined with post-release recidivism, what is the overall failure rate for probationers who terminated in FY2005? Also, where are probationers placed upon failure?
Findings 1. Probation Termination: Success and Failure (pre-release recidivism/failure)
Successful termination rates have remained relatively stable. For FY2005, slightly more than two thirds (68.1%) of juveniles terminated successfully from regular supervision. This represents a slight reduction (0.7%) for juveniles from FY2004 that had a success rate of 68.8%. The successful termination rate of 61.3% for adults in FY2005 is slightly lower than the previous year of 62.6%. (See Table 1)
Youth on probation terminated for technical violations of probation in 25.7% of cases. This rate reflects a slight increase from the previous year (0.7%). The adult technical violation rate of 32.6% is slightly higher than previous year of 31.8%. (See Table 1)
Youth terminated for the commission of a new crime in 6.2% of the cases which is identical to the previous year FY2004. The adult new crime rate of 6.1% reflects an increase over the 5.6% new crime rate of FY2004. (See Table 1)
2. Probation’s Post-Release Recidivism Rate, One Year after Termination
For youth who successfully complete regular probation supervision, 16.6% received a new filing in FY2005 compared to 15.4% in FY2004. (See Table 2)
Adults who completed regular probation successfully received a new filing (one year out) at a rate of 8.0%, fractionally above the previous year which was 7.9%. (See Table 2)
3. Differences In Pre- And Post-Release Failure By Supervision Level (Pre-release failure includes technical violations and new crimes during supervision. Post-release failure refers to crimes filed within one year post-termination from supervision).
For both youth and adults, those supervised at the maximum supervision level and those classified as administrative2 cases were the most likely to fail both pre-release and post-release. The higher failure rate among maximum level probationers is consistent with risk classification tools, in which high risk/maximum level supervision offenders are often more than twice as likely
2 Administrative cases is a classification category used to denote offenders who are under the jurisdiction of probation,
but who may be currently supervised by other agencies, including community corrections, county jails or detention centers and may be classified at any one of the designated risk levels (e.g. minimum, medium, maximum).

vi
as those classified at lower supervision levels to commit a new crime while under supervision. Similarly, the higher failure rate among administrative cases is not surprising, given the range of offenders included in this classification category, which includes a mixture of risk levels and supervision outside of probation. Rates of success/failure for adult probationers presented are artificially lower than expected (due to the absence of lower risk private probation cases that tend to have higher rates of success) and should not be interpreted as the success rate for all adult regular probationers. (See Tables 3 & 5).
Among the three (formerly four)3 specialized probation programs [Juvenile Intensive Supervision Probation (JISP), Adult Intensive Supervision Probation (AISP), and the Female Offender Program (FOP)] pre-release failures are greater than on regular probation supervision, which is expected, given that the specialized programs are designed to supervise higher risk offenders. (See Tables 4 and 6.)
Successful terminations from AISP have increased (7.8%) at nearly the same rate (8.2%) technical violations have decreased. (See Table 6).
Those juveniles who had a new case filed within one year of successfully terminating JISP and completing probation remained stable in FY2005 compared to FY2004. Those adults who had a new case filed within one year of successfully terminating AISP and completing probation decreased by 2.5% in FY2005 compared to FY2004. Of the seven women who successful completed FOP and were terminated from probation, not one received a new filing. (See Tables 8 and 10)
4. Overall Success and Failure Rates among Colorado Probationers: How many
offenders terminated supervision successfully and remained crime-free (measured by a new court filing) within one year of termination?
More than one half (56.8%) of juveniles remain successful one year after release from probation. This represents a small decrease (2.2%) from FY2004. (See Table 11).
Approximately one fifth (17.8%) of youth supervised in the JISP, who terminated directly were successful. However, when considering those youth who successfully terminated JISP and then transferred to regular probation supervision, the success rate more than doubles to 46.8%. This is a slight decrease (48.7%) from FY2004. (See both “successful” columns of Table 12).
More than one half (56.4%) of adults remain successful one year after release from probation. This represents a small decrease (1.3%) from FY2004. (See Table 15).
3 The Specialized Drug Offender Program (SDOP) and the Female Offender Program (FOP) were discontinued in FY03
as a result of budget cuts. The FOP program was restored in FY2004 and increased by three FTE in FY2006. The Specialized Drug Offender Program has not been restored.

vii
The Adult Intensive Supervision Program produced an overall success rate of 5.3%, a decrease of two percentage points from the previous year (7.8%), however this only relates to those AISP offenders terminating directly from intensive supervision and is a percentage of all offenders who terminated. It should be noted that the majority of adults supervised on a specialized program are appropriately transferred to regular probation supervision and when considering these offenders, the success rate increases to 51.9%. (See both “successful” columns of Table 16).
The post-release recidivism rate for AISP is noteworthy as only one (.1%) probationer who successfully completed the program and terminated had a new filing one year post release. (See Table 16).
The Female Offender Program (FOP) had an overall success rate of 18.4% but when combined with offenders transferred to regular probation supervision, the success rate increased to 57.9%. (See both “successful” columns of Table 16).
5. Disposition Of Pre-Release Failures And Post-Release Recidivists
Both youthful and adult offenders supervised on regular probation are most frequently sentenced to detention or a county jail for technical violations. Sentences for offenders who commit new crimes while under supervision were evenly split between the county jail and the Division of Youth Corrections and the Department of Corrections. (See Tables 13 and 17.)
Youth and adults on specialized programs, who tend to be more serious offenders, are most frequently incarcerated at the Division of Youth Corrections or Department of Corrections when they violate their probation sentence. (See Tables 13 and 17.)
Of those cases where information is available, post-release recidivists (juveniles and adults) were most frequently re-sentenced to probation. This held true for both regular and intensive probation supervision, however the very small number of cases for some specialized programs do not allow for interpretation of trends. (See Tables 14 and 18.)
Summary The findings in this report highlight the fact that probation programs are successful in helping offenders remain crime free during periods of supervision. Indeed, 68.1% juvenile regular probationers were successful on probation (Table 1). Similarly the regular adult probationers successfully completed probation at a rate of 61.3% (Table 1). Both adults and juveniles classified as high risk are less likely to successfully terminate, and less likely to remain crime-free after termination than their lower-risk counterparts. In the intensive supervision programs designed to divert youth and adults who would otherwise be incarcerated, overall success rates (successful probation termination and no post-release recidivism and those transferred from specialized to regular supervision) range from 46.8% for the juvenile intensive supervision program, 51.9% for the adult

viii
intensive supervision program and 57.9% for the female offender program (See Tables 12 and 15). The largest type of failure among all specialized programs is in the area of technical violations. Statewide responses to technical violations and absconders continue to be on the priority list of supervision issues to address.

1
INTRODUCTION On June 30, 2004 there were 53,545 offenders on probation in Colorado, including 45,676 adult and 7,869 juvenile probationers in both regular and specialized programs. Probation officers across the state work within a range of regular and specialized probation programs, working to assess, supervise, educate and refer their probationers to a host of treatment and skill-building programs. Probation officers use validated instruments to assess offenders according to the level of risk they pose to the community, their ability to function in pro-social ways and the skills they need to make amends to victims and communities they have harmed. Probationers are supervised within the community according to their assessed risk level, and they are referred to appropriate community-based treatment and skill-based programs, based upon their assessed needs. Programs have been developed that are designed to match the intensity of supervision to the risk and need of each probationer. Programs include regular probation supervision and specialized intensive probation supervision. Budget cuts in FY2003 resulted in the elimination of the Specialized Drug Offender Program (SDOP) and the Female Offender Program (FOP). The FOP has since been restored and expanded. The SDOP has not been restored and the Division of Probation Services is in the process of exploring new strategies to address the needs of higher risk substance abusing offenders. The Adult and Juvenile Intensive Supervision programs (AISP and JISP) were also impacted by budget cuts in FY2003; however both programs have been restored. Colorado probation’s Statement of Common Ground emphasizes the need to maintain community safety through appropriate supervision and attention to the risk and needs of offenders as well as the need to identify and serve crime victims and the community at large. Embedded in this philosophy of restorative justice is the need to hold offenders accountable for their criminal behavior and to require offenders to repair the harm caused to the victim and/or the community. Additionally, a restorative justice philosophy invites crime victims and community members to actively participate in the restoration response. Under the framework of restorative justice, crime is believed to be a community problem, and, therefore, community involvement should be encouraged. Additionally, the presence of informal social controls, and the collaborative efforts of community agents and criminal justice agencies are believed to significantly impact crime (Fulton, 1996). Restorative justice activities implemented in Colorado probation include involving offenders in meaningful community service endeavors and other offender reparation activities. It is important to note that all of probation’s specialized programs were designed to be alternatives to incarceration. Thus, offenders placed in these programs have higher levels of risk (risk is related to the probability of program failure and the commission of a new crime), and typically have higher levels of identified needs. For these reasons, program success levels are expected to be lower for offenders in specialized programs than for those on regular probation. OVERVIEW The Colorado General Assembly first requested the Judicial Branch’s Division of Probation Services (DPS) to prepare an annual report on pre- and post-release recidivism rates of offenders terminated from probation in 1996. While this mandate has

2
not been funded, the Division of Probation Services has made every effort to produce a report that is both useful to the General Assembly and to probation departments in Colorado. Based upon a recommendation of the State Auditor’s Office in its December 1998 audit of juvenile probation, the Division of Probation Services convened a group of representatives from criminal justice agencies to develop a uniform definition of recidivism. With the use of this definition, policy makers can more easily compare outcomes across state criminal justice agencies in Colorado. The group agreed on a definition of pre-release recidivism and post-release recidivism. These definitions are as follows: Pre-release recidivism:
An adjudication or conviction for a felony or misdemeanor, or a technical violation relating to a criminal offense, while under supervision in a criminal justice program
Post-release recidivism:
A filing for a felony or misdemeanor within one year of termination from program placement for a criminal offense
These definitions are consistent with the definition of recidivism used by the Division of Probation Services since 1998, thus comparisons can easily be made between the probation outcomes reported in 1998, 1999, 2000, 2001, 2002, 2003, 2004, 2005 and those reported here. METHODOLOGY The annual recidivism study is generally based upon the entire population of probationers terminated from probation during the previous fiscal year. This design allows for follow-up to determine, for those who successfully terminated, what proportion received a filing in Colorado for a new criminal offense within the year following their termination. In addition to recidivism findings for the 2005 cohort of probationers terminated, the current report, based upon further recommendations by the State Auditor’s Office, presents disposition and placement findings for those who recidivated or failed pre-release from the current, 2005 cohort.
Data
For the 2005 termination cohort, a query was written to extract a data file of all adult and juvenile probationers who terminated probation during FY2005. The data file was generated from the Judicial Branch’s Management Information System, ICON/ECLIPSE. The termination files were combined with a file of all misdemeanor and felony criminal cases and juvenile delinquency petitions filed in Colorado’s district and county courts in FY2005 and FY2006 to derive post-release recidivism rates for those probationers who

3
successfully completed probation4. The recidivism period is limited to a uniform one-year time at risk. It should be noted that this method can result in over estimates especially when considering that filing may not result in conviction. Pre-release failure rates were derived based upon the type of termination (e.g. termination for technical violation or new crime).
Analysis To meet the request of the General Assembly, the following research questions guided the analysis.
1. What proportion of probationers were terminated from probation for the commission of a new crime (pre-release recidivism)? What proportion of probationers were terminated for a technical violation (pre-release failure)? Finally, what proportion of probationers successfully terminated?
2. What proportion of probationers had a juvenile delinquency petition or a criminal
case filed within one year of termination of probation (post-release recidivism)?
3. What are the differences in pre-release and post-release recidivism rates for the following groups: - regular probationers in each supervision level, and - probationers in each of the specialized probation programs (adult and
juvenile intensive supervision probation, and the adult female offender program)?
4. What is the overall failure rate of juvenile and adult probationers? That is, when
unsuccessful terminations (both new crime and technical violations) are combined with post-release recidivism, what is the overall failure rate for probationers who terminated in FY2005? Also, where are probationers placed upon failure?
To answer the research questions posed, we first disaggregated the data by offender case type (juvenile and adult). Second, placement categories were created for adult and juvenile probationers, designating their supervision level or specialized program type at termination. The data were further disaggregated by termination type (success/fail), and the failures were further analyzed to determine, for pre-release failures, where the offender was ultimately placed and, for those successfully terminated from probation, the proportion who received a criminal filing for a new crime. Data for FY2005 releases allow us to determine which proportion of offenders in specialized programs were terminated directly from the specialized program and which offenders were transferred to regular probation supervision upon completion of a specialized program. Termination data for both situations are presented in this report, to provide additional information to the reader. These data will be described in the pertinent sections.
4 Denver County court cases are not included in this cohort because the cases from this court are not part of the judicial
system’s information management system (ECLIPSE). However, this data may be included in future years as this court comes on-line with ECLIPSE.
4
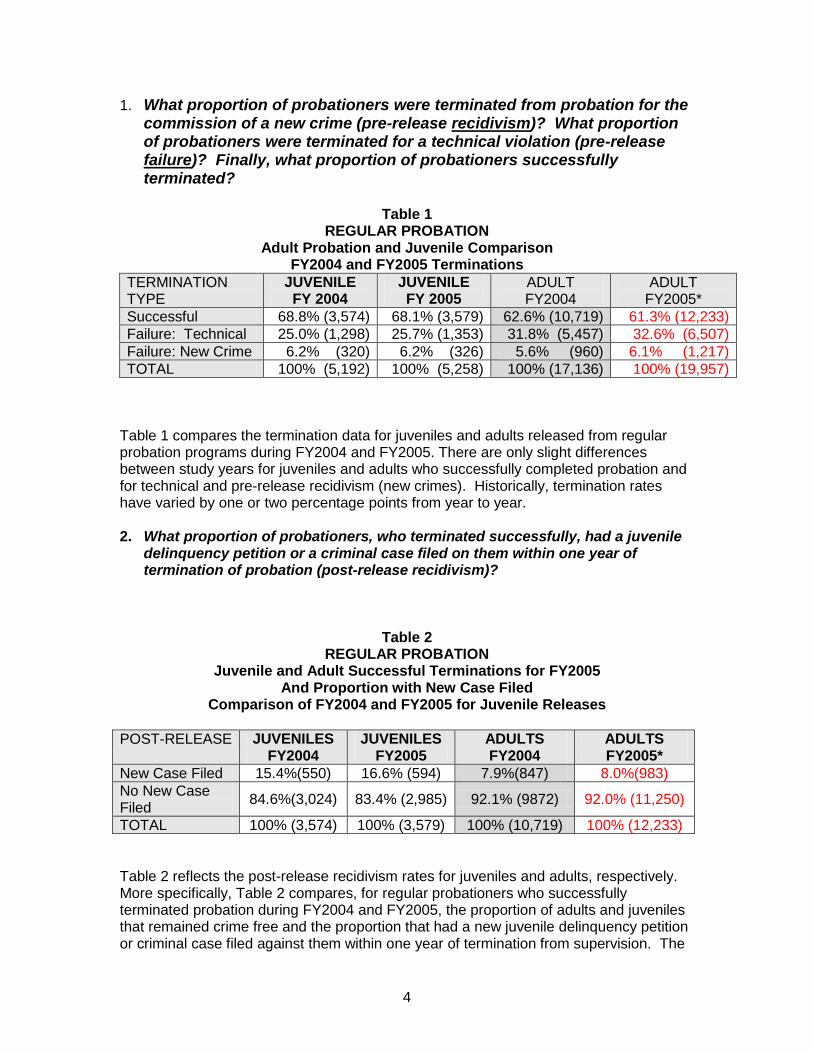
1. What proportion of probationers were terminated from probation for the commission of a new crime (pre-release recidivism)? What proportion of probationers were terminated for a technical violation (pre-release failure)? Finally, what proportion of probationers successfully terminated?
Table 1
REGULAR PROBATION Adult Probation and Juvenile Comparison
FY2004 and FY2005 Terminations TERMINATION TYPE
JUVENILE FY 2004
JUVENILE FY 2005
ADULT FY2004
ADULT FY2005*
Successful 68.8% (3,574) 68.1% (3,579) 62.6% (10,719) 61.3% (12,233)
Failure: Technical 25.0% (1,298) 25.7% (1,353) 31.8% (5,457) 32.6% (6,507)
Failure: New Crime 6.2% (320) 6.2% (326) 5.6% (960) 6.1% (1,217)
TOTAL 100% (5,192) 100% (5,258) 100% (17,136) 100% (19,957)
Table 1 compares the termination data for juveniles and adults released from regular probation programs during FY2004 and FY2005. There are only slight differences between study years for juveniles and adults who successfully completed probation and for technical and pre-release recidivism (new crimes). Historically, termination rates have varied by one or two percentage points from year to year. 2. What proportion of probationers, who terminated successfully, had a juvenile
delinquency petition or a criminal case filed on them within one year of termination of probation (post-release recidivism)?
Table 2 REGULAR PROBATION
Juvenile and Adult Successful Terminations for FY2005 And Proportion with New Case Filed
Comparison of FY2004 and FY2005 for Juvenile Releases
POST-RELEASE JUVENILES FY2004
JUVENILES FY2005
ADULTS FY2004
ADULTS FY2005*
New Case Filed 15.4%(550) 16.6% (594) 7.9%(847) 8.0%(983)
No New Case Filed
84.6%(3,024) 83.4% (2,985) 92.1% (9872) 92.0% (11,250)
TOTAL 100% (3,574) 100% (3,579) 100% (10,719) 100% (12,233)
Table 2 reflects the post-release recidivism rates for juveniles and adults, respectively. More specifically, Table 2 compares, for regular probationers who successfully terminated probation during FY2004 and FY2005, the proportion of adults and juveniles that remained crime free and the proportion that had a new juvenile delinquency petition or criminal case filed against them within one year of termination from supervision. The

5
rate at which juveniles had new case(s) filed after a successful termination increased slightly between FY2004 (15.4%) and FY2005 (16.6%). The rate of post-release recidivism for adults was 8.0%, which is fractionally higher than the 7.9% rate of FY2004.
3. What are the differences in pre-release and post-release recidivism
rates for the following groups: - regular probationers in each supervision level, and - probationers in each of the specialized probation programs (adult
and juvenile intensive supervision probation, the adult female offender program, and the specialized drug offender program)?
Pre-release Recidivism and Failure Rates Colorado Probation Officers use the LSI (Level of Supervision Inventory) to classify adults according to risk level and the CYO-LSI (Colorado Young Offender Level of Supervision Inventory) to classify juvenile offenders. The LSI is a research-based reliable and valid risk instrument that helps predict outcome, success on supervision and recidivism. The LSI is commonly used by probation and parole officers and other correctional workers in the United States and abroad. The CYO-LSI is based on similar research used to develop the LSI, but it was developed by Colorado criminal justice professionals and validated on a Colorado sample of juvenile offenders. Both of these classification tools result in one of three supervision levels: minimum, medium or maximum. In addition, probation uses the management classification level of “administrative” to denote those offenders who are under the jurisdiction of probation, but who may be currently supervised by other agencies, including community corrections or county jail for adults; and residential child care facilities for juveniles. The administrative classification includes offenders of all risk levels, including a high proportion assessed as high risk. Some probationers classified as administrative may also have completed all of the court requirements for probation, but still have outstanding restitution or fees to pay. The higher rate of failure among maximum level probationers is consistent with risk prediction classification tools, in which high risk/maximum level supervision offenders are often more than twice as likely as those classified at lower supervision levels to commit a new crime while under supervision. It is important to note that the LSI and CYO-LSI are instruments in which the probationer is scored on a number of risk factors, the sum of which comprise a total score. The probationer is initially assigned a risk level based upon the category (minimum, medium or maximum) in which his or her score falls and the intensity of supervision is matched to that assessed level of risk. On average, probationers are re-assessed every six months, and supervision strategies and level of supervision intensity change with the corresponding changes in the risk level score. Classification categories are determined according to policy, which has set the scores that correspond to each risk level. The policy determining risk categories is typically based on research that determines where cut-points are most appropriately set, given actual failure rates among the study group and resulting in more predictive cut-points.

6
Table 3 REGULAR PROBATION:
Juvenile Probation Termination Type by Supervision Level – FY2005 Compared with Overall Termination Type FY2004
SUPERVISION LEVEL
JUVENILE PROBATIONERS TERMINATED
Success
Fail: Technical
Fail: New Crime
Total
Juvenile Probationers Terminated FY2005
Regular: Administrative
51.0% (891) 41.4% (723) 7.6% (133) 100% (1747)
Regular: Unclassified
64.9% (37) 26.3% (15) 8.8% (5) 100% (57)
Regular: Minimum
93.1% (1,329) 5.1% (73) 1.8% (26) 100% (1,428)
Regular: Medium
77.7% (994) 17.2% (220) 5.1% (65) 100% (1279)
Regular: Maximum
44.0% (328) 43.0% (320) 13.0% (97) 100% (745)
TOTAL REGULAR PROBATION
68.1% (3,579)
25.7% (1,351) 6.2% (326) 100% (5,256)
Juvenile Probationers Terminated FY2004
TOTAL REGULAR PROBATION
68.8% (3,574)
25.0% (1,298) 6.2% (320) 100% (5,192)
Table 3 reflects the termination rates for juveniles on regular probation supervision, by risk/classification level. (Table 4 reflects the termination rates for juveniles on intensive supervision probation.) Both tables compare the overall termination rates for FY2005 with those in FY2004. Termination rates in FY2005 are consistent with the rates in FY2004, with only slight variations. As represented in Table 3, the 68.1% overall successful termination rate of juvenile probationers on regular supervision for FY2005 is slightly lower than the 68.8% success rate reported for youth in FY2004. Of juveniles that terminated probation in FY2005, 25.7% failed for violating the terms and conditions of probation (including absconding from supervision), and 6.2% failed by committing a new crime. These figures reflect a slight increase in technical violations in FY2004 (25.0%) and no difference from the FY2004 new crime failure rate of 6.2%. As has been true historically, juveniles supervised at the maximum and administrative levels on regular probation had the lowest success rates (44.0% and 51.0%, respectively). Youth classified at the maximum level represented the highest proportion of offenders terminating for the commission of a new crime. The rate at which maximum supervision level juveniles terminated due to a new crime decreased by 2.2% between FY2004 (15.2% not shown) and FY2005 (13.0%). It is expected that those classified at the higher risk levels would fail at a greater rate than the lower classification levels; indeed, that is the reason we develop levels of risk. Similarly, it is not surprising that

7
youth classified as administrative cases fail at higher rates, given that this caseload constitutes a large number of cases that are either higher risk or are supervised by another entity in tandem with probation (such as detention or other placement facilities), or both.
Table 4 Juvenile Intensive Supervision Probation:
Termination Type – FY2005 Compared with Juvenile ISP Termination Type FY2004
PROGRAM JUVENILE ISP PROBATIONERS TERMINATED
Successful on JISP Fail: Technical
Fail: New Crime
Total
Transfer to Regular Probation
Terminate Directly from JISP
Juvenile Intensive Probation FY2005
29.0% (135) 19.7% (92) 39.1% (182) 12.2% (57) 100% (466)
Juvenile Intensive Probation FY2004
26.8% (101) 24.5% (93) 37.4% (142) 11.3% (43) 100% (379)
Table 4 indicates that JISP clients succeeded 48.7% of the time5, but failed for committing technical violations in approximately one third of the cases (39.1%) and failed due to a new crime in 12.2% of the cases. These findings reflect a decrease in successes from FY2004 termination results in which 51.3% of youth succeeded on JISP. Technical and new crime violations in FY2005 were slightly higher than in FY2004 which account for the decreased success rate. This higher failure rate among JISP probationers compared to regular supervision probationers is not surprising, given that these juveniles are considered the most high risk offenders on probation, and often have the most severe levels of needs.6 This classification of offender would also likely be committed to a Division of Youth Corrections facility in the absence of the JISP sentencing option. The decision to transfer a probationer (both juveniles and adults) from a specialized probation program to regular probation supervision is based on local policy. Only recently have we been able to begin tracking those offenders who transfer from a specialized probation program to regular probation supervision. While we are able to report the termination status as they leave a specialized program, we have not yet been able to report the final termination status of these offenders as they exit regular probation supervision.
5JISP clients who successfully terminated included 29.0% who were successfully terminated from JISP and then moved
to regular supervision and 19.7% who were successfully terminated directly from JISP and released from supervision. 6 The Office of the State Auditor’s report of findings from the 1998 audit of juvenile probation found that high risk juveniles
on probation and on JISP frequently have high levels of need as well.

8
Table 5 REGULAR PROBATION:
Adult Probation Termination Type by Supervision Level – FY2005
SUPERVISION LEVEL
ADULT PROBATIONERS TERMINATED
Success Fail: Technical Fail: New Crime
Total
Adult Probationers Terminated FY2005*
Regular: Administrative
30.8% (2,216) 62.2% (4,475) 7.1% (508) 100% (7,199)
Regular: Unclassified
75.2% (1323) 23.2% (408) 1.6% (28) 100% (1759)
Regular: Minimum 91.7% (5,124) 6.5% (363) 1.8% (101) 100% (5,588)
Regular: Medium 77.8% (2,947) 16.2% (615) 5.9% (225) 100% (3,787)
Regular: Maximum 38.4% (623) 39.8% (646)
21.9% (355)
100% (1,624)
TOTAL REGULAR PROBATION
61.3% (12,233) 32.6% (6,507) 6.1% (1,217) 100% (19,957)
Adult Probationers Terminated 2004
TOTAL REGULAR PROBATION
62.6% (10,719) 31.8% (5,457) 5.6% (960) 100% (17,136)
Table 5 reflects the pre-release termination status for regular adult offenders by supervision level. Similar to the juvenile probationers, adult probationers supervised at administrative and maximum levels7 were the least likely to successfully terminate probation (30.8% and 38.4%, respectively). The higher failure rate among administrative cases is not surprising, given the range of offenders included in this classification category, which includes a mixture of risk levels and supervision outside of probation. Similarly, those classified at the maximum supervision level are considered to be at the highest risk for re-offense. Probationers who were supervised at the administrative and maximum levels were by far the most likely to terminate due to technical violations as well as a new crime, with one exception. That is, adults classified at the medium level were nearly as likely to fail for a new crime (5.9%) as those adults classified as administrative (7.1%). Overall, only 6.1% of adults on regular probation supervision were terminated due to a new crime.
7 Higher rates of failure among those classified as administrative are expected, since this classification level comprises
offenders of all risk levels, and actually denotes a supervision classification as opposed to risk level. In addition to comprising all levels of risk, these offenders were also likely to be under active supervision by another criminal justice entity, such as community corrections.

9
Table 6 SPECIALIZED PROGRAMS:
Adult Probation Termination Type by Program – FY2005 Compared with Specialized Programs Termination Type FY2004
PROGRAM Successful on Specialized Program
Fail: Technical
Fail: New Crime
Total Transfer to Regular Probation
Terminate Directly from Specialized Program
FY2005 Specialized Programs Terminations
Adult Intensive Supervision Probation (AISP)
46.6% (599) 5.4% (69) 34.4% (443) 13.6% (175) 100% (1286)
Female Offender Program (FOP) *
39.5% (15) 18.4% (7) 31.6% (12) 10.5% (4) 100% (38)
FY2004 Specialized Programs Terminations
Adult Intensive Supervision Probation (AISP)
36.2% (343) 8.0% (77) 42.6% (404) 13.2% (125) 100% (949)
*The Female Offender Program was discontinued in FY2004 due to budget reductions and therefore data is not available. The Female Offender Program was reinstated in FY05.
Table 6 presents termination data for adults supervised in specialized probation programs; it includes the success rates for those offenders who completed the specialized program and then continued under regular probation supervision and those who completed the specialized program, ending supervision directly from the specialized program, as well as failure rates for those probationers in a specialized program. The combined success rates (transfer to regular and terminate directly) for Adult Intensive Supervision Probation (AISP) increased between FY2004 (44.2%) and FY2005 (52.0%), a 7.8% increase. The increase in large part is the result of a decrease in technical violations from 42.6% in FY2004 to 34.4% in FY2005. As expected, the failure for new crime remained stable with 13.2% rate in FY2004 and a 13.6% rate in FY2005. The Female Offender Program was discontinued as a result of budget reduction in FY2003, but restored in FY2005. Comparative data is not available for the FOP; however in FY2005 the combined rate of those who were successful and transferred to regular probation (39.5%) and those who terminated directly and successfully (18.4%) from FOP is 57.9%.
Post-release Recidivism Rates Among Probationers who Successfully Terminate
To answer the second portion of question number three, we selected only those probationers who successfully terminated probation, and analyzed the data to determine what proportion had new cases filed in court. Tables 7 (regular probation) and 8 (JISP) present the post-release recidivism findings for juveniles; Tables 9 (regular probation) and 10 (AISP) present these findings for adults.

10
Table 7 REGULAR PROBATION:
Juvenile Post-release Recidivism by Last Supervision Level – FY2005 Compared with Overall Post-Release Recidivism Findings – FY2004
JUVENILES WHO SUCCESSFULLY TERMINATED PROBATION
SUPERVISION LEVEL New Case Filed No New Case Filed Total
FY2005 Successful Terminations
Regular: Administrative
17.6% (157) 82.4% (734) 100% (891)
Regular: Unclassified 16.2% (6) 83.8% (31) 100% (37)
Regular: Minimum 14.1% (188) 85.9% (1,141) 100% (1,329)
Regular: Medium 18.5% (184) 81.5% (809) 100% (993)
Regular: Maximum 18.0% (59) 82.0% (269) 100% (328)
Total 16.6% (594) 83.4% (2,985) 100% (3,579)
FY2004 Successful Terminations
Total 15.4% (549) 84.6% (3,025) 100% (3,574)
Table 7 indicates that the majority (83.4%) of juveniles who terminated regular probation successfully in FY2005 remained crime free for at least one year post termination. The remaining 16.6% had a delinquency petition filed in court within one year of termination. As expected, youth classified at higher supervision levels had higher rates of recidivism. The recidivism rate for probationers at the maximum supervision level was 18.0%, at the medium supervision level it was 18.5%, and at the minimum supervision level it was 14.1%. The recidivism rate among those offenders last classified at administrative level was (17.6%). Juveniles classified as administrative, tend to assess with higher criminal risk and need and include youth in residential placement.
Table 8 JUVENILE ISP:
Post-Release Recidivism – FY2005 Compared with Post-Release Recidivism Findings – FY2004
JISP Clients Who Successfully Terminated JISP and Completed Probation
PROGRAM New Case Filed
No New Case Filed
Total
JISP FY2005 10.0% (9) 90.0% (83) 100% (92)
JISP FY2004 10.1% (9) 89.9% (84) 100% (93)
Table 8 reflects that 90.0% of juveniles who terminated intensive probation supervision in FY2005 remained crime free for at least one year post termination. The remaining 10.0% had a delinquency petition filed in court within one year of termination. These figures reflect a significant improvement over FY2002 and FY2003 (not shown) in which the post-release recidivism rates were 21.6% and 19.8% respectively. Note that Table 8 represents only those 92 youth released from supervision altogether. An additional 135 youth successfully completed the terms of JISP and were transferred to regular probation supervision during the study year (See Table 4). Outcome behavior

11
for these youth will be included in the regular supervision population as they complete probation supervision.8
Table 9 REGULAR PROBATION:
Adult Post-Release Recidivism by Last Supervision Level – FY2005
ADULTS WHO SUCCESSFULLY TERMINATED PROBATION
SUPERVISION LEVEL New Case Filed No New Case Filed
Total
FY2005 Successful Terminations
Regular: Administrative 8.6% (191) 91.4% (2,025) 100% (2,216)
Regular: Unclassified 5.7% (76) 94.3% (1,247) 100% (1,323)
Regular: Minimum 6.3% (321) 93.7% (4,803) 100% (5,124)
Regular: Medium 11.0% (323) 89.0% (2,624) 100% (2,947)
Regular: Maximum 11.4% (71) 88.6% (551) 100% (622)
Total 8.2% (983) 91.8% (11,250) 100% (12,233)
FY2004 Successful Terminations
Total 7.9% (847) 92.1% (9,872) 100% (10,719)
Table 9 reflects that, overall, more than 90% of adult probationers who terminated successfully from probation during FY2005 remained crime free for at least one year post termination. The remaining 8.2% were subsequently brought to court on new charges within one year of termination. Those probationers last supervised at the maximum level were the most likely to have a new crime filed against them within one year of termination (11.4%), followed closely by those classified at the medium supervision level (11.0%).
Table 10 SPECIALIZED PROBATION PROGRAMS:
Adult Successful Terminations and Proportion with New Case Filed – FY2005
Compared with Overall Post-Release Recidivism Findings – FY2004
POST-RELEASE New Case Filed
No New Case Filed
TOTAL
Adults Who Successfully Terminated a Specialized Program and Completed Probation FY2005
AISP 1.4% (1) 98.6% (68) 100% (69)
FOP* 0% (0) 100.0% (7) 100% (7)
Adults Who Successfully Terminated a Specialized Program and Completed Probation FY2004
AISP 3.9% (3) 96.1% (73) 100% (76)
8 The addition of new codes in ICON now allows us to identify probationers who transfer from specialized program
supervision to regular supervision. Data limitations did not allow for specific tracking of these offenders within the “regular supervision” cohort of offenders.

12
*The Female Offender Program was discontinued in FY2004 due to budget reductions and therefore data is not available. The Female Offender Program was reinstated in FY05.
Table 10 reflects, for adult specialized program participants who successfully terminated probation, the proportion that remained crime free and those who had a new criminal case filed against them within one year. As reported for the JISP cohort of terminated probationers, Table 10 reflects only those adult offenders who completely terminated from specialized supervision, and not those transferred to regular probation for continued supervision. Those adult offenders who transferred to regular supervision are included in Table 6. Offenders successfully completing AISP have very low rates of recidivism. In FY2005, 98.6% of these offenders remained crime free for at least one year post termination, a slight improvement from the FY2004 rate of 96.1%. The actual number of adults who had successfully completed AISP and had cases filed post-release decreased from three offenders in FY2004 to one offender in FY2005. As a percentage, this is a 2.5% decrease from 3.9% in FY2004 and 1.4% in FY2005. Of the seven women who successfully completed the Female Offender Program there were no new cases filed one year following termination, resulting in a recidivism rate of 0.0%. Historical rates for FOP on this measure include a 5.9% and 16.7% recidivism rate for FY2002 and FY2003 (not shown) respectively. Again, the FOP was temporarily discontinued in FY2004.
4. What is the overall failure rate of juvenile and adult probationers? That is, when unsuccessful terminations (both new crime and technical violations) are combined with post-release recidivism, what is the failure rate of probationers? Also, where are probationers placed upon failure?
To answer the fourth question for the FY2005 termination cohort, we combined the pre-release and post-release failure categories to arrive at an overall probation failure rate by supervision level. Additionally, we combined the pre-release recidivism rate and the post-release recidivism rate to derive an overall recidivism rate. As a result, totals in Table 11 do not match totals in other tables that address only pre-release failures or only post-release recidivism. Finally, for comparison’s sake, the overall figures for the FY2004 study period are presented for each level of supervision.

13
Table 11 REGULAR PROBATION
Overall Juvenile Program Failures and Successes – FY2005 Compared with Overall Post-Release Recidivism Findings – FY2004
SUPERVISION LEVEL
Pre-release Failure:
Technical9
Pre-release Failure:
New Crime10
Successful and Post-release
Recidivism11
Successful12 Total
Juvenile Terminations FY2005
Regular: Administrative
41.4% (723) 7.6% (133) 9.0% (157) 42.0% (734) 100% (1747)
Regular: Unclassified
26.3% (15) 8.8% (5) 10.5% (6) 54.4% (31) 100% (57)
Regular: Minimum 5.1% (73) 1.8% (26) 13.2% (188) 79.9% (1,141) 100% (1,428)
Regular: Medium 17.2% (220) 5.1% (65) 14.4% (184) 63.3% (810) 100% (1,279)
Regular: Maximum 43.0% (320) 13.0% (97) 7.9% (59) 36.1% (269) 100% (745)
TOTAL REGULAR PROBATION
25.7% (1,351) 6.2% (326) 11.3% (594) 56.8% (2,985) 100% (5,258)
Juvenile Terminations FY2004
TOTAL REGULAR PROBATION
25.0% (1,298) 6.2% (320) 10.6% (549) 58.2% (3,025) 100% (5,192)
Table 11 represents all those juveniles who completed regular probation supervision and illustrates the rate at which these juveniles failed and succeeded. The failures include those youth who, during supervision, were terminated for a technical violation(s) or for the commission of a crime and those who “failed” by recidivating within one year of termination. As indicated in Table 11, the overall success rate for juveniles supervised on regular probation in FY2005 was 56.8%, which is slightly lower than the overall success rate in FY2004 of 58.2%. Not surprisingly, those youth supervised at the maximum supervision level and classified as administrative cases had the lowest success rates (36.1% and 42.0%, respectively).
9 The probationers included in this category terminated unsuccessfully from probation due to a technical violation(s). 10 The probationers included in this category terminated unsuccessfully from probation due to a new crime. 11 The probationers included in this category terminated successfully from probation and then recidivated within one year
of termination. 12 The probationers included in this category terminated successfully from probation and did not recidivate within one
year of termination.

14
Table 12 JUVENILE ISP:
Overall Program Failure and Success – FY2005 and FY2004
PROGRAM Pre-release Failure:
Technical13
Pre-release Failure:
New Crime14
Post-release Recidivism15
Successfully terminated
directly from JISP and did
not recidivate16
Successfully terminated from JISP
& transferred to regular
supervision17
Total
JISP FY2005 39.1% (182) 12.2% (57) 1.9% (9)
17.8% (83)
29.0% (135)
100% (466)
JISP FY2004 37.5% (142) 11.4% (43) 2.4% (9)
22.1% (84)
26.6% (101)
100% (379)
Table 12 represents all those juveniles who completed JISP and illustrates the rate at which these juveniles failed and succeeded. The failures include youth who, during supervision on JISP, were terminated for a technical violation(s) or for the commission of a crime and those who “failed” by recidivating within one year of termination from JISP. The successes include those youth who terminated the JISP program successfully and either terminated supervision at that point or transferred to regular probation supervision upon completion of JISP. It is a common practice among probation departments statewide to “step offenders down” from the intensive level of supervision in specialized programs to less intensive levels on regular probation prior to release from supervision. Given that more than one-quarter (29.0%) of youth are transferred from JISP to regular probation supervision, it is most accurate to consider those youth in the overall success rate. However it is useful to look at the data in two ways: the success rate of those juveniles who terminate supervision directly from JISP and the success rate of those juveniles who terminate JISP and then transfer to regular probation supervision. The overall success rate of those juveniles who terminate directly from JISP is relatively low (17.8%). However, when all JISP releases are considered (including those transferred to regular supervision), the program shows a 46.8% success rate, compared to 48.7% in FY2004. This overall success rate for FY2005 is calculated by adding the two “successful” columns in Table 12 together (17.8% and 29.0%). As explained earlier, lower rates of success are to be expected with higher risk cases. In the absence of a program like JISP, or without the ability to place youth under
13
The probationers included in this category terminated unsuccessfully from JISP due to a technical violation(s). 14 The probationers included in this category terminated unsuccessfully from JISP due to a new crime. 15 The probationers included in this category terminated successfully and directly from JISP and recidivated within one
year of termination. 16 The probationers included in this category terminated successfully and directly from JISP and did not recidivate within
one year of termination. 17 The probationers included in this category terminated successfully from JISP and were then transferred to regular
probation supervision. Their final termination status (e.g. failure/success/recidivism) is unknown and will be reflected in the overall program failure and success rates for regular probation.

15
extremely close supervision conditions; these youth would likely be placed in commitment facilities with the Division of Youth Corrections. In this respect, JISP is cost-effective with these high risk and high need youth, whereby all of these youth would likely have been placed in DYC at a cost of $64,60518 per year compared to $4,270 on JISP19. In summary, JISP redirected 21820 youth from DYC in FY2005 and, of those, we know more than one-third of them (83 of 218 = 38.0%) were successful. That is, they completed JISP successfully and did not recidivate for at least one year following their completion of JISP.
Table 13 JUVENILE REGULAR PROBATION and JISP
Placement of Juvenile Probationers Who Terminated Probation for Technical Violations or a New Crime: FY2005
PLACEMENT
Incarceration: Dept. of
Corrections or Div. of Youth Corrections
Detention/ County Jail
Fines, Fees, Comm. Service, Other
(includes no sentence)
TOTAL
Pre-Release Failure: Technical Violation
Juvenile Regular Probation 39.8% (538)
59.9% (809)
0.3% (4)
100% (1351)
JISP 65.1% (118)
34.9% (64)
0.0% (0)
100% (182)
Pre-Release Failure: New Crime
Juvenile Regular Probation
49.3% (161)
50.7% (165)
0% (0)
100% (326)
JISP
77.8% (44)
22.2% (13)
0.0% (0)
100% (57)
18 The commitment figure was provided by the Division of Youth Corrections Budget Office 7-2006. 19 The JISP figure is based on the Judicial Branch’s annual cost per case for FY2005. 20 This analysis includes offenders who succeeded and were terminated (83) and those that succeeded and were
transferred to regular probation (135).

16
Table 14 JUVENILE REGULAR PROBATIONERS and JISP
Placement of Juvenile Probationers Who Successfully Completed Probation and had a New Filing Post-Release: FY2005
PLACEMENT
Incarceration: Dept. of
Corrections or Div. of Youth Corrections
Community Corrections
Detention/ County Jail
Supervised Probation
Fines, Fees,
Comm. Service, Other
Not Yet Sentenced
or Case Dismissed
TOTAL
Juvenile Regular Probation
6.7% (40)
0.7% (4)
4.1% (24) 35.7% (212)
25.7% (153)
27.1% (161)
100% (594)
JISP 10.9% (1) 0% (0) 7.3% (1) 40.9% (4) 30.0% (3) 10.9% (1) 100% (9)
Tables 13 and 14 reflect the placement of youth who failed their probation terms or recidivated after successfully terminating from probation. Those youth who failed probation due to a technical violation or a new crime committed while on supervision are represented in Table 13. Those youth who received a new filing after successfully terminating probation are represented in Table 14. In addition to the probationers reflected in Table 13, some youth are revoked and reinstated on probation and others are revoked and placed in community corrections. The probationers who fall into either of these categories are not tracked as failures in the Judicial Department’s management information system because they continue under the jurisdiction of probation and, in the case of revoked and reinstated probationers, under direct supervision by probation. As expected, placement data for many youth who recidivated after terminating probation is unknown. Post-release recidivism is defined and measured as a filing for a felony or misdemeanor within one year of termination from program placement for a criminal offense. By definition then, filings for youth who terminated in FY2005 were tracked through June 30, 2006. It often takes a year from the time of filing, which could have occurred as late as June 2005, for sentencing or placement determination to occur and therefore that data are not yet available. A youth must be 18 or older at the time of revocation to be sentenced to the county jail, and then the term cannot exceed 180 days. Table 13 indicates that the majority of youth supervised on regular probation supervision are sentenced to detention for technical violations (59.9%). This year a slight majority of youth whose probation is revoked for a new crime committed while under supervision were also sentenced to detention or county jail (50.7%). The second most frequently used placement for youth on regular probation who were revoked for either technical violations (39.8%) or a new crime (49.3%) was Division of Youth Corrections. As expected, those youth who were supervised on JISP, programs typically consisting of more serious offenders were sentenced at a higher rate to the Division of Youth Corrections. More JISP youth were incarcerated at the Division of Youth Corrections than were sentenced to detention when they committed a technical violation (65.1%) or a new crime (77.8%). Fewer JISP youth were given a detention sentence for a technical

17
violation (34.9%) and for a new crime (22.2%). Less than one percent (0.3%) of all youth failing either regular probation or JISP received a fine, fee or community service as the only response to that failure. Table 14 reflects that youth who recidivated after successfully completing probation whose cases have been adjudicated and a sentencing decision has been made were most likely to be placed on probation (35.7%) followed by a sentence to fines, fees or other (25.7%).Just over four percent (4.1%) of these youth were sentenced to detention. Nearly seven percent (6.7%) were sentenced to the Division of Youth Corrections and less than 1.0% (0.7%) were sentenced to community corrections. Of the nine (9) youth who recidivated after successfully completing JISP and whose cases reached disposition most (4 or 40.9%) were placed back on probation while three (or 30.0%) were sanctioned with fines, fees, community service or otherwise. The number of juveniles in this category is too small to derive conclusions or observe trends. As reflected in Table 14, approximately one out of three (27.1%) regular probation cases have not yet reached disposition. As that data becomes available we would anticipate seeing many more offenders falling into the other placement categories (incarceration, community corrections, detention/jail, probation) while the number of cases in the fines/fee, community service and other category would remain relatively small. The cases falling into this latter category may be lower level and less serious offenses that are being resolved more quickly (therefore showing up in the data results sooner) and receiving the lighter sanction of a fine or community service work.

18
Table 15 REGULAR PROBATION
Overall Adult Program Failures and Successes – FY2005 Compared with Overall Post-Release Recidivism Findings – FY2004
SUPERVISION LEVEL Pre-release
Failure: Technical
21
Pre-release Failure: New
Crime22
Successful and Post-release
Recidivism23
Successful24
Total
Adult Terminations FY2005
Regular: Administrative
62.2% (4,475) 7.1% (508) 2.7% (191) 28.1% (2,025) 100% (7,199)
Regular: Unclassified
23.2% (408) 1.6% (28) 4.3% (76) 70.9% (1,247) 100% (1,759)
Regular: Minimum 6.5% (363) 1.8% (101) 5.7% (321) 86.0% (4,803) 100% (5,588)
Regular: Medium 16.2% (615) 5.9% (225) 8.5% (323) 69.3% (2,624) 100% (3,787)
Regular: Maximum 39.8% (646)
21.9% (355)
4.4% (71) 34.0% (552) 100% (1,624)
TOTAL REGULAR PROBATION
32.6% (6,507) 6.1% (1217) 4.9% (982) 56.4% (11,251) 100% (19,957)
Adult Terminations FY2004
TOTAL REGULAR PROBATION
31.8% (5,457) 5.6% (960) 4.9% (847) 57.7% (9,872) 100% (17,136)
Table 15 depicts the overall success rate of adult regular probation, defined as those who successfully terminated probation and remained crime-free for one year. Offenders supervised at the maximum supervision level and classified as administrative had the lowest overall success rate (34.0% and 28.1% respectively), and the failure was largely due to technical violations of their probation supervision (39.8% for maximum supervision) and (62.2% for administrative supervision).
21
The probationers included in this category terminated unsuccessfully from regular probation supervision due to a technical violation(s). 22 The probationers included in this category terminated unsuccessfully from regular probation supervision due to a new
crime. 23 The probationers included in this category terminated successfully from regular probation supervision but recidivated
within one year of termination. 24 The probationers included in this category terminated successfully from regular probation supervision and did not
recidivate within one year of termination.

19
Table 16 SPECIALIZED PROGRAMS
(Adult Intensive Supervision Probation and Female Offender Program) Overall Adult Program Failures and Successes: FY2005 and FY2004
SUPERVISION LEVEL
Pre-release Failure:
Technical25
Pre-release Failure: New
Crime26
Post-release Recidivism
27
Successfully terminated
directly from specialized
probation and did not
recidivate28
Successfully terminated from
specialized & transferred to
regular supervision
29
Total
Adult Specialized Program Terminations FY2005
AISP 34.4% (443) 13.6% (175) 0.1% (1) 5.3% (68) 46.6% (599) 100% (1,286)
FOP* 31.6% (12) 10.5% (4) 0% (0) 18.4% (7) 39.5% (15) 100% (38)
Adult Specialized Program Terminations FY2004
AISP 42.6% (404) 13.2% (125) 0.3% (3) 7.8% (74) 36.1% (343) 100% (949) * The Female Offender Program (FOP) was discontinued in FY2004 as a result of budget reductions and therefore data are not available. FOP was reinstated in FY2005.
Table 16 reflects, as expected, that overall adult offenders in specialized programs performed more poorly than those on regular probation supervision. Adults terminated from the intensive supervision probation program had an overall success rate of 51.9%, with a 46.6% success rate for those offenders who transferred from AISP to regular probation supervision and 5.3% for those offenders who did not continue on any supervision following an AISP sentence. This 51.9% overall success rate for AISP represents an 8% increase compared to the FY2004 overall success rate of 43.9%. It should be noted that the rate of technical violations (34.4%) decreased by 8.2% from the previous year (42.6%). This decrease may be attributed to a reduction in caseload size (45 to 25 offenders) in FY2005 as a result of program restoration; that is, caseload reductions allowed officers the time to intervene more quickly to violations and avoid failure in the program. The overall success rate for the Female Offender Program was 57.9% (18.4% and 39.5% combined) with no post-release recidivism for those who terminated directly from the program. In summary, FOP redirected 2230 offenders from DOC in FY2005 and, of for the 7 women who were successful and terminated, there was no recidivism. That is,
25 The probationers included in this category terminated unsuccessfully from a specialized program due to a technical
violation(s). 26 The probationers included in this category terminated unsuccessfully from a specialized program due to a new crime. 27 The probationers included in this category terminated directly and successfully from a specialized program and
recidivated within one year of termination. 28 The probationers included in this category terminated directly and successfully from a specialized program and did not
recidivate within one year of termination. 29 The probationers included in this category terminated successfully from specialized programs and were then
transferred to regular probation supervision. Their final termination status (e.g. failure/success/recidivism) is unknown and will be reflected in the overall failure and success rates for regular probation supervision. 30 This analysis includes offenders who succeeded and were terminated (7) and those that succeeded and were
transferred to regular probation (15).

20
they completed FOP successfully and did not recidivate for at least one year following their completion of FOP. Again, it is important to note that the intensive supervision program is a prison-avoidant program, and all offenders in these programs succeeded and remained crime free in nearly one half of the cases. In the absence of these programs, these offenders quite likely would have served time in prison, at a costly sum, both in human and fiscal terms. In the absence of programs like AISP and FOP, or without the ability to place higher risk probationers under extremely close supervision conditions; these offenders would likely have been sentenced to the Department of Corrections (DOC). Comparatively, the cost of sentencing an offender to the Department of Corrections is $26,81331 per year compared to $2,610 on AISP and $2,178 for FOP32. In summary, AISP redirected 66733 offenders from DOC in FY2005. Data on overall success rates can be useful to probation administrators, planners, and officers in developing strategies to assist probationers in increasing success rates. The lower rates of success among those probationers who terminated directly from a specialized program are heavily influenced by the pre-release failure rates and the most common practice of “stepping down” offenders from specialized programs to regular probation supervision. Most pre-release failures are due to technical violations, which can be addressed up front with strategies to prevent probationers from engaging in these behaviors.
31 This annualized cost of a prison bed was provided by the Budget Office of the Department of Corrections, July, 2006. 32 The JISP figure is based on the Judicial Branch’s annual cost per case for FY2005. 33 This analysis includes offenders who succeeded and were terminated (68) and those that succeeded and were
transferred to regular probation (599).

21
Table 17 ALL ADULT PROBATION PROGRAMS
Placement of Adult Probationers Who Terminated Probation for Technical Violations or a New Crime: FY2005
PLACEMENT
Incarceration: Dept. of Corrections
County Jail Fines, Fees, Comm. Service, Other (includes no sentence)
TOTAL
Pre-Release Failure: Technical Violation
Adult Regular Probation34
21.2% (1379) 77.9% (5,5069) 0.9% (59) 100% (6,507)
AISP 79.0% (350) 21.0% (93) 0.0% (0) 100% (443)
Pre-Release Failure: New Crime
Adult Regular Probation
46.3% (563) 53.5% (651) 0.2% (3) 100% (1,217)
AISP 91.3% (159) 8.7% (16) 0.0% (0) 100% (175)
Table 17 reflects the placement of those offenders who failed probation due to a technical violation or a new crime committed while on supervision. The majority of adults supervised on regular probation who receive technical violations are sentenced to the county jail (77.9%) and secondly to the Department of Corrections (21.2%). Probationers on regular supervision who failed probation for the commission of a new crime were more likely to be incarcerated in the county jail (53.5%) and a little less frequently, sentenced to the Department of Corrections (46.3%). As expected, adults who terminated from the Intensive Probation Supervision Program, regardless of whether that failure was due to a technical violation or a new crime, were most likely to be incarcerated at the Department of Corrections (DOC). Nearly eighty percent (79.0%) of the technical violators were sentenced to DOC while 91.3% of those committing a new crime received this type of sentence. In addition to the probationers reflected in Table 17, some probationers are revoked and reinstated on probation and others are revoked and placed in community corrections. The probationers who fall into either of these categories are not tracked as failures in Judicial Department management information system because they continue under the jurisdiction of probation and, in the case of revoked and reinstated probationers, under direct supervision by probation.
34 Note that, for regular probation, a revocation is only counted in the data base for those offenders who actually
terminate probation. For this reason, we cannot, at this time, account for those offenders who are revoked and reinstated to probation.

22
Table 18 ALL ADULT PROBATIONERS
Placement of Adult Probationers Who Successfully Terminated Probation And had a New Filing Post-Release: FY2005
PLACEMENT
Incarceration Dept. of
Corrections
Community Corrections
County Jail Probation Fines, Fees, Comm. Service,
Other
Not Yet Sentenced or
Case Dismissed
TOTAL
Adult Regular Probation
5.6% (55)
1.8% (18) 9.4% (92) 29.9% (294) 20.1% (198) 33.2% (326) 100% (983)
AISP 0.0% (0) 0.0% (0) 0.0% (0) 100.0% (1) 0.0% (0) 0.0% (0) 100% (1)
FOP 0.0% (0) 0.0% (0) 0.0% (0) 0.0% (0) 0.0% (0) 0.0% (0) 100% (0)
Table 18 represents placement for those adult offenders who successfully completed regular or specialized probation, but had a new filing post-release. As expected, placement data for some adult offenders who recidivated after terminating probation is unknown. Post-release recidivism is a filing for a felony or misdemeanor within one year of successful termination from program placement for a criminal offense. By definition then, filings for adults who terminated in FY2005 were tracked through June 30, 2006. It often takes a year from the time of filing, which could have occurred as late as June 2006, for sentencing or placement determination to occur and therefore that data are not yet available. Table 18 reflects that approximately one-third of new criminal cases filed on adults who recidivated after successfully terminating from regular probation supervision have not reached disposition (33.2%). Adult recidivists were most often sentenced to another probation sentence (29.9%) or to fines, community service or other sanction (20.1%). The number of adults who recidivated after terminating from a specialized program are so low (1), that it is impossible to draw any conclusions about these offenders from the data provided in Table 18. Females (7) who successfully completed FOP and completed probation did not recidivate, one year out.

23
Summary: 2005 Termination Cohort The Judicial Branch has produced a report on recidivism rates among probationers since 1996. Since 1998, the method and measures reported have been consistent with those reported here. Recidivism among probationers has remained relatively stable – particularly while offenders are under the supervision of the probation department. Once terminated, rates of recidivism among probationers has remained relatively low at less than ten percent for adults and less than twenty percent for juveniles on regular probation 35. Adults and juveniles assessed at higher levels of risk and need have higher rates of new crimes committed once terminated from probation, but these are still generally less than twenty percent across all programs36. The findings in this report highlight the fact that probation programs are successful in helping offenders remain crime free during periods of supervision. Indeed, juvenile and adult probationers were successful (they were successfully terminated from probation and remained crime free for one year after termination) in more than one half of all cases with overall success rates of 56.8% for juveniles and 56.4% for adults.37 Overall success rates were slight lower for juvenile and adult regular supervision. Both adults and juveniles classified as higher risk are less likely to successfully terminate, and less likely to remain crime-free after termination than their lower-risk counterparts. Post-termination recidivism rates, which spiked in FY2001 for juveniles, have remained relatively stable over the years this report has been produced. In FY2005, post-release recidivism rates were 16.6% for juvenile probationers and 8.2% for adult probationers38. This represents a slight increase from FY2004 for juveniles and adults. Across specialized programs, those programs designed to divert youth and adults who would otherwise be incarcerated, overall success rates range from 46.8%39 for the juvenile intensive supervision program and 51.9%40 for the adult intensive supervision program. When considering only those offenders terminated from specialized probation programs altogether, success rates range from 5.3% - 17.8%. These lower rates are heavily influenced by the pre-release failure rates and the most common practice of “stepping down” offenders from specialized programs to regular probation supervision. Historically, the largest type of failure among all specialized programs is in the area of technical violations, however for FY2005 the technical failure rate for Adult Intensive Supervised Probation fell by nearly 10% from the previous year, a possible artifact of the decreased caseload size for this time period. Statewide responses to technical violations continue to be on the priority list of supervision issues to address. The decision to transfer a probationer from a specialized probation program to regular probation supervision is based on local policy. Only recently have we been able to begin tracking those offenders who transfer from a specialized probation program to regular
35 See tables 2 and 5 36 See tables 3 and 5 37
See tables 11 and 15 38 See Table 2 39 See Table12 40 See table 16

24
probation supervision. While we are able to report the termination status as they leave a specialized program, we have not yet been able to report the final termination status of these offenders as they exit regular probation supervision. The Division of Probation Services and probation departments statewide take seriously the need to protect the public’s safety and, in particular, prevent probationers from engaging in future criminal behavior. Recidivism is an important performance measure for the criminal justice system. The public expects that offenders supervised within the criminal justice system are being supervised effectively. This can be accomplished with quality staff and training and adequate resources within probation and in those critical services (e.g. substance abuse, mental health, domestic violence treatment) necessary to probationers’ success.

25
BIBLIOGRAPHY Donziger, Steven (Ed.), The Real War On Crime: The Report of the National Criminal Justice Commission, Harper Perennial, 1996 Fulton, Betsy. Restoring Hope Through Community Partnerships: The Real Deal in Crime Control, The American Probation and Parole Association, Lexington, Kentucky, 1996. Office of Probation Services, State of State Report on Pre-Sentence Investigation and Assessment Activities, Colorado Judicial Department, Denver, Colorado, May 2000. Piehl, Anne Morrison, Economic Conditions, Work and Crime, in The Handbook of Crime and Punishment, edited by Michael Tonry, Oxford University Press, 1998. Pullen, Suzanne. Report to the Colorado General Assembly and the Legislative Audit Committee Concerning a Consistent and Common Definition of Recidivism in the Juvenile and Criminal Justice System, Colorado Judicial Branch, Denver, Colorado, June 1999. Simon, Rita J. and Landis, Jean The Crimes Women Commit: The Punishments they Receive, Lexington Books, Lexington, Massachusetts, 1991.