Embed Size (px)
Citation preview

Ambient Air Monitoring Plan
Tennessee Dept. of Environment and Conservation
Air Pollution Control Division
Final Plan
June 30, 2016

2 TN Ambient Air Monitoring Plan | 2016
Table of Contents
Introduction to the 2016 Ambient Air Monitoring Plan for Tennessee ............................................................ 4
Proposed Revisions to Tennessee’s Ambient Air Monitoring Network ............................................................ 5
PM2.5 Monitoring: ....................................................................................................................................................................5 PM10 Monitoring: .....................................................................................................................................................................6 Ozone Monitoring: ..................................................................................................................................................................6 Carbon Monoxide Monitoring:..............................................................................................................................................6 Nitrogen Dioxide Monitoring: ...............................................................................................................................................6
Community Wide Monitors .............................................................................................................................................. 6 Near-Road Monitors .......................................................................................................................................................... 6
Lead Monitoring: .....................................................................................................................................................................6 Sulfur Dioxide Monitoring: ....................................................................................................................................................7
The Purpose of Tennessee’s Ambient Air Monitoring Network ........................................................................ 8
MSA Monitoring Configuration for 2016 .............................................................................................................................9
Monitoring Sites and Discussion .......................................................................................................................... 10
Freels Bend – Anderson County ........................................................................................................................................ 10 Maryville – Blount County ................................................................................................................................................... 11 Look Rock – Blount County (GSM NP) ............................................................................................................................... 12 Cades Cove – Blount County (GSM NP)............................................................................................................................. 13 Dyersburg – Dyer County.................................................................................................................................................... 14 New Market – Jefferson County ......................................................................................................................................... 15 Lawrence – Lawrence County ............................................................................................................................................ 16 Loudon – Loudon County ................................................................................................................................................... 17 Athens – McMinn County .................................................................................................................................................... 18 Jackson – Madison County .................................................................................................................................................. 19 Columbia – Maury County .................................................................................................................................................. 20 Clarksville – Montgomery County ...................................................................................................................................... 21 Cookeville – Putnam County .............................................................................................................................................. 22 Harriman – Roane County .................................................................................................................................................. 23 Cove Mountain – Sevier Country (GSM NP) ...................................................................................................................... 24 Clingman’s Dome – Sevier County (GSM NP) ................................................................................................................... 25 Kingsport (PM2.5) – Sullivan County ................................................................................................................................... 26 Blountville – Sullivan County .............................................................................................................................................. 27 Kingsport O3 – Sullivan County .......................................................................................................................................... 28 Exide – Sullivan County ....................................................................................................................................................... 29 Hendersonville - Sumner County ...................................................................................................................................... 30 Cedars of Lebanon – Wilson County ................................................................................................................................. 32
Tennessee Geographic Regions, Descriptions and Climate ............................................................................. 33
Climate of Tennessee .......................................................................................................................................................... 33 Map of Tennessee Geographic Regions ........................................................................................................................... 36 Climate Synopsis for Tennessee ........................................................................................................................................ 37 Windrose Data for Tennessee ............................................................................................................................................ 38
Tennessee Metropolitan Statistical Areas and Population Estimates ............................................................ 39
Tennessee Micropolitan Statistical Areas and Population Estimates ............................................................. 40

3 TN Ambient Air Monitoring Plan | 2016
Tennessee County Population Data Trends ....................................................................................................... 41
2010 Metropolitan/Micropolitan Areas of Tennessee ...................................................................................... 42
TAPC Monitoring Equipment Evaluation 2016 AMP Field Sites ....................................................................... 43
TAPC Monitoring Equipment Evaluation 2016 AMP In Storage ....................................................................... 44
Tennessee Monitoring Site Agreement Letters .................................................................................................. 46
Kentucky ................................................................................................................................................................................ 46 Virginia................................................................................................................................................................................... 50
Sections of the CFR Referred to in the 2016 NMP ............................................................................................. 52
Ozone Monitoring Network Requirements ...................................................................................................................... 56 CO Monitoring Network Requirements ............................................................................................................................ 56 NO2 Monitoring Network Requirements .......................................................................................................................... 57 SO2 Monitoring Network Requirements ........................................................................................................................... 57 Lead Monitoring Network Requirements ......................................................................................................................... 59 PM2.5 Monitoring Network Requirements ........................................................................................................................ 59 Index reporting requirements ........................................................................................................................................... 60 NCore Monitoring Network Requirements and PM 10-2.5 ................................................................................................ 61 Coarse Particulate Matter (PM10-2.5) Design Criteria. ................................................................................................... 61 NCore Look Rock Monitoring Site ...................................................................................................................................... 62
Proposed Clarksville PM2.5 Site Information ....................................................................................................... 64
EPA Approval Letter for the Loudon Pope Monitoring Site .............................................................................. 73
Ross N Robinson .................................................................................................................................................................. 74 Skyland Drive ........................................................................................................................................................................ 90 Final Proposal Letter to EPA ............................................................................................................................................. 112

4 TN Ambient Air Monitoring Plan | 2016
Introduction to the 2016 Ambient Air Monitoring Plan for Tennessee
The draft plan that is presented in the following pages will address each of the requirements specified in the CFR.
An overview of the geography, general climate, wind patterns and population trends are included to provide
background information that will assist the reader in understanding the current air monitoring network and
reasons for placement of the existing monitoring sites. The actual regulatory requirements that specify the
number and placement of air monitoring sites are found in 40 CFR 58. The sections that provide this guidance are
also included in the report as a reference to help better understand the actual monitoring needs in a given area.
In many instances, the “areas” for which monitoring is required are based on population criteria in which
population must be considered to allow for monitoring in the areas where populations may be affected or
exposed to the various criteria pollutants of concern. Additional monitoring sites are needed to address areas
where source related emission density might be elevated and impact communities in the same area. Other
considerations must also be addressed when selecting and operating air monitoring sites. The local influences of
some types of sources (roadway dust or emissions) may be factors that require monitoring sites to be spaced
certain distances from those sources or in the case or near-road or roadway monitoring activities, the monitors
must be located very close to the potential sources of mobile emissions.
The principal areas in Tennessee with air monitoring sites are depicted with a graphic showing the locations for
each of the monitoring sites. The sites are further identified with a site number, an Air Quality Site Identification
(AQSID) and the types of pollutants being monitored for at each location. Tables containing the relevant
information for each site are also included. The tables are provided in two sections following the location graphic
and have been condensed and combined from the previous year’s format so that all relevant information can be
found within each area’s section of the report and relieves the reader from searching tables at the end of the
report for information about a given site.
Each of the four local programs operating an air monitoring network in Tennessee have also provided a separate
annual review, that are included with this report. Where revisions were noted in the local networks, similar
revisions were added to the State’s overall plan.
The recent changes in the National Ambient Air Quality Standards (NAAQS) have resulted in a need to evaluate
additional air monitoring in order to comply with the new standards. In some cases (SO2 and NO2), the revisions to
the standard were augmented with revisions to the monitoring requirements. Some of the necessary changes to
the monitoring networks have been completed while others are being planned for implementation.
The state of Tennessee is required to evaluate the ambient air monitoring network each year in accordance with
the requirements specified in 40 CFR Subpart B 58.10. The requirements that must be met in the annual
evaluation are included.

5 TN Ambient Air Monitoring Plan | 2016
Proposed Revisions to Tennessee’s Ambient Air Monitoring Network
PM2.5 Monitoring:
The state of Tennessee does not propose to shut down any of the current PM2.5 monitoring sites currently in
operation but will propose adding to the sites an FEM continuous monitor so that eventually all pf the PM2.5 sites
are equipped with an FEM/FRM continuous monitor. The following table details the proposed modifications to this
network, Once the FEM/FRM monitors are received and properly installed, a period of correlation testing will be
performed with the FRM and FEM/FRM samplers both operating at the same time. After suitable amounts of data
are generated, the selected FRM samplers will be evaluated for possible shutdown. Adequate colocation for the
new FEM/FRM samplers will be implemented and the need for meeting colocation requirements for the remaining
filter based FRM’s will be addressed based on the remaining network and minimum requirements for colocation.
Tennessee is proposing to move the Clarksville PM2.5 monitoring site due to safety concerns of the elevated
platforms that are a part of the sampling network. The siting package is attached. There are no Source Oriented
PM2.5 network monitoring requirements.
County PM2.5 FRM
Site ID Street Address
Existing TEOM Site
Proposed BAM
FEM/FRM 1020/1022
PM2.5 FRM Filter Based Sampler to
Remain
Change out
Schedule
Blount 470090011 2007 Sequoyah Ave,
Maryville TN 37803 Yes Yes No
7/1/2015 to
12/31/2016
Dyer 470450004 175-B Greenwood St,
Dyersburg TN 38024 Yes Yes No
7/1/2015 to
12/31/2016
Lawrence 470990002 355 Busby Rd,
Loretto, TN 38469 Yes Yes No
7/1/2015 to
12/31/2016
Loudon 471050108 1703 Roberts Rd,
Loudon, TN No Yes No
7/1/2015 to
12/31/2016
McMinn 470071002 707 N Jackson St, Athens,
TN 37303 Yes Yes No
7/1/2015 to
12/31/2016
Madison 471130006 1371-A North Pky,
Jackson, TN 38301 Yes Yes No
7/1/2015 to
12/31/2016
Maury 471192007 1600 Nashville Hwy,
Columbia, TN No Yes No
7/1/2015 to
12/31/2016
Montgomery 471251009 1514-C Golf Club Ln,
Clarksville, TN 37040 Yes Yes TBD TBD
Putnam 471410005 630 East 20th St,
Cookeville, TN 38501 No Yes No
7/1/2015 to
12/31/2016
Roane 471450004 1002 N. Roan St,
Harriman, TN 37748 Yes Yes No
7/1/2015 to
12/31/2016
Sullivan 471631007 1649 D St,
Kingsport TN 37664 Yes Yes No
7/1/2015 to
12/31/2016
Sumner 471650007
Rockland Recreation
Area Old Hickory Dam
Army Corp of Engineer
Property
Yes Yes TBD TBD

6 TN Ambient Air Monitoring Plan | 2016
PM10 Monitoring:
The state of Tennessee does not operate any PM10 monitors as a part of the state network.
Ozone Monitoring:
The state of Tennessee is proposing to shut down the Blountville (471-163-2002) ozone monitoring site in
Kingsport, Sullivan County, Tennessee. This site is a historical site, (Jan 1, 1980, operating for 36 years) with
another ozone monitoring site (471-163-2003) located in Sullivan County that will remain in operation after the
Blountville site is approved to be shut down. In the last 8 years, the Blountville site had an 8-hr daily maximum
average difference of only +0.5 ppb from the Kingsport site. Last year, the Blountville site had an 8-hr daily
maximum average difference of -1.2 ppb from the Kingsport site. The Blountville site’s 3-year design value is 6 ppb
below the new NAAQS standard of 70 ppb.
The Loudon Pope ozone site was approved by EPA to be relocated back to the Loudon Elementary School and
restarted there. This is proposed to be completed during the 2016 monitoring season. The EPA approval letter is
attached.
Carbon Monoxide Monitoring:
The state of Tennessee does not operate any CO monitors as a part of the state network.
Nitrogen Dioxide Monitoring:
The state of Tennessee does not operate any NO2 monitors as a part of the state network.
Community Wide Monitors
An NO2 monitoring site that meets the community wide monitoring requirement is already in operation in
Nashville (AQS 47-037-0011). The NO2 monitor AQS ID 47-037-0011, located on Trinity Lane in Nashville,
Tennessee is identified in AQS as a SLAMS monitor. In the Memphis CBSA the State of Arkansas currently
operates an NO2 monitor at its Marion site, (AQS 05-035-0005). Memphis-Shelby County Air Pollution
Control has requested EPA approve this site to meet minimum community-wide NO2 monitoring
requirements in the Memphis CBSA.
Near-Road Monitors
There are currently two Near Road sites in Tennessee, both located and operated in local program
counties (Davidson and Shelby).
Lead Monitoring:
The state operates a single lead monitoring site in Sullivan County, Tennessee in the vicinity of the Exide facility.
This site is located within the boundary of the current Bristol lead nonattainment area. A redesignation request
was submitted to EPA to classify the area as attainment based on clean data previously submitted for the state
site. There are three lead monitoring sites operating in Knox County.

7 TN Ambient Air Monitoring Plan | 2016
Sulfur Dioxide Monitoring:
The state of Tennessee will be installing two SO2 monitoring sites in the Kingsport, TN area named as
nonattainment by EPA in Sullivan County, Tennessee. The EPA approved siting documentation is attached.

8 TN Ambient Air Monitoring Plan | 2016
The Purpose of Tennessee’s Ambient Air Monitoring Network
There are several criteria used to determine the need for ambient air quality monitoring. Some of the criteria are
as follows:
EPA National Ambient Air Quality Standards (NAAQS) Criteria pollutant monitoring network requirements for
the NCore (National Core), formally NAMS (National Air Monitoring Site); SLAMS (State and Local Air
Monitoring Site); and SPM (Special Purpose Monitoring) monitoring networks
The Code of Federal Regulations (CFR) sets forth as regulations the requirements for air quality monitoring to
be implemented by the states and EPA. These requirements are primarily organized around population and
emission density in a given area with the number of required monitors and the distribution of the monitors
within the networks specified by these regulations. Additionally 40CFR, Part 58, Appendix D specifies criteria
that must be followed in designing the NCore and SLAMS networks. The EPA must approve design and/or
modifications to these networks.
Additional federal regulations also specify requirements for Prevention of Significant Deterioration (PSD)
monitoring networks. This monitoring is addressed at new facilities to be constructed in a given area or
around certain types of existing industry such as large coal fired power plants or facilities that release toxic
heavy metals such as lead to the environment.
Air quality monitoring is required to be conducted to alert citizens in given areas to elevated levels of air
pollutants in cities or communities of designated population levels that are required to provide Air Quality
Index (AQI) reports to the general public.
Air quality monitoring is conducted to address the need for background air quality data and to provide needed
air quality data that is used in industrial recruitment efforts with the monitoring areas periodically rotated to
new locations throughout the state on a routine basis.
Special air quality monitoring studies are conducted based on identified needs for monitoring data in a given
area.
Citizen complaints and enforcement investigations related to air quality are other reasons for air quality
monitoring usually in or around a specific area related to the complaint or investigation.
Requests from citizens for special air monitoring studies are also a reason for air monitoring activities.
The federal regulations also specify the frequency, method, location requirements, equipment, quality
assurance procedures and reporting of data collected from the ambient air monitoring networks.

9 TN Ambient Air Monitoring Plan | 2016
MSA Monitoring Configuration for 2016 MSA Monitor Requirements
Monitoring Program
Census Area Identification and Population
14129 Lead
42101 CO
42401 SO2
42602 NO2
44201 Ozone 81102 PM10
88101 PM2.5 88502 PM2.5
Speciation
88101 or
88501 PM2.5 Cont.
State / PQAO
CBSA Code
Census 2010 / 2014
CBSA Title (MS Areas)
Ope
rating
Requir
ed
Ope
rating
Requir
ed
Ope
rating
Requir
ed
Ope
rating
Requir
ed
Ope
rating
2013 2015 8 Hr DV*
Requir
ed
Ope
rating
Requir
ed
Ope
rating
2013 2015 Annual DV
ug/m3
2013 2015* 24
Hr DV ug/m3 R
equir
ed
Ope
rating
Requir
ed
Ope
rating
Requir
ed
GA 0437
16860 528143
/ 547776
Chattanooga, TN-GA
0 0 0 0 0 0 0 1(b)
0.066
0 0
1
9.9 21 2 0 1(a)
1 TN 0170 2 2 3 1
TN 1025
KY 0584
17300 260625
/ 281021
Clarksville, TN-KY
0 0 0 0
0 0 0
1
0.063 1
0
8.9 20 1 0 0
1 TN 0953 2
1
TN 1025
1 1
TN 0112 17420
115788 /
120864 Cleveland, TN 0 0 0 0
1 0 0 0 0
0 0 0 0
0 0 0 0 0
TN 1025
TN 1025 27180 130011
/ 129864
Jackson, TN 0 0 0 0 0 0 0 0 0
0 0 0 1 8.3 17 0 0 0 1 1
TN 1025 27740 198716
/ 200648
Johnson City, TN
0 0 0 0 0 0 0 0 0
0 0 0 0
0 0 0 0 0
TN 0375
28700 309544
/ 307120
Kingsport-Bristol-Bristol,
TN-VA
3
1
0
1
0
0.064 1 0 0
8.4 15 0 0 0
0 TN 1025 1
2
1 1 1
TN 1026
1 1 1
VA 1127
TN 0581
28940 837571
/ 861424
Knoxville, TN
3
1
0
1 0 1(b)
2
.067 2
1
1
4
10 20 2 0 0
1
1
TN 0921
2
NPS 0745
1 1 2
1
TN 1025
1 2 0 3 1
TN 1027
1
AR 0055
32820
1324829 /
1344127
Memphis, TN-MS-AR
1
1
1
1
2
1
0.067 2
2
9.1 19 2
1
1 MS 073
1
TN 0673 1 3 1 1 3 2 2 1 1
TN 1025
TN 1025 34100 113951
/ 116642
Morristown, TN 0 0 0 0 0 0 0 0 1 0.067 1 0 0 0
0 0 0 0 0
TN 0682
34980
1670890 /
1830345
Nashville-Davidson--
Murfreesboro, TN
1
1 1
1 2
2
2
0.067 2
2
2
2
10.1 21 3 0 1(a)
1
1 TN 1025
3
1 1
* Ozone DV is based on the NAAQS standard of .075 ppb
Micropolitan Monitor Requirements
Monitoring Program
Census Area Identification and Population
14129 Lead
42101 CO
42401 SO2
42602 NO2
44201 Ozone 81102 PM10
88101 PM2.5 88502 PM2.5
Speciation
88101 or 88501 PM2.5 Cont.
State / PQAO
CBSA Code
Census 2010 / 2014
CBSA Title (MicroS Areas)
Ope
rating
Requir
ed
Ope
rating
Requir
ed
Ope
rating
Requir
ed
Ope
rating
Requir
ed
Ope
rating
2013 2015 8 Hr DV*
Requir
ed
Ope
rating
Requir
ed
Ope
rating
2013 2015 Annual DV
ug/m3
2013 2015 24 Hr DV ug/m3 R
equir
ed
Ope
rating
Requir
ed
Ope
rating
Requir
ed
TN 0112 11940
52266 / 52639
Athens. TN
1
0
0
TN 1025 1 8.6 17 1
(a) EPA has defunded the required speciation sampling in these areas. The CFR requirement has not been revised. (b) This monitor is the rear road site that may not be funded. The CFR requirement has not been revised.

10 TN Ambient Air Monitoring Plan | 2016
Monitoring Sites and Discussion Freels Bend – Anderson County
Address Freels Bend Study Area Melton Lake Oak R
AQSID 470010101
CBSA 28940
Lat, Lon 35.96522, -84.223159
Parameter Code 42401 44201
Parameter Name SO2 O3
Monitor Type SLAMS SLAMS
POC 1 1
Int 1 W
Collection Frequency Hourly Hourly
Method 100 87
FRM/FEM Instrument Api Model 100 A SO2 Analyzer
Model 400 Ozone Analyzer
Analysis Ultraviolet Fluorescence Ultra Violet Absorption
Ref Mtd ID EQSA-0495-100 EQOA-0992-087
Monitor Objective Population Exposure Population Exposure
Dominant Source Area Area
Measurement Scale Urban Scale Urban Scale
Land Use Type Forest Forest
Location Setting Rural Rural
The Freels Bend site is located in Anderson County, Tennessee and currently supports monitoring for ozone and
sulfur dioxide. The site was initially established in 1992 and is expected to operate during CY’s 2015 and 2016. This
site is located west of Knoxville and southeast of Oak Ridge, Tennessee. This site is an upwind site from the core
Knoxville MSA area.
Sulfur dioxide monitoring began 03/01/2013 to assess emission impacts from the Bull Run FP.
Because of the importance this site serves in assessing both the upwind ozone levels entering the Knoxville area
and the ongoing need to continue to collect SO2 data to assess area impacts near the TVA facility, this site will be
recommended to remain in operation over the next 5 years (2015 thru 2020). The Knoxville MSA has 6 operating
ozone sites and is required to have only 2. This MSA is also required to have 1 SO2 site which this site provides for.
This site is also employed in the AQI forecasting program and currently is attaining the standards for both ozone
and SO2.
Freels Bend Daily Air Quality
0
20
40
60
80
Jan '13 Apr '13 Jun '13 Sep '13 Dec '13 Mar '14 Jun '14 Sep '14 Dec '14 Mar '15 Jun '15 Sep '15 Dec '15
8h
r Ma
x Ozo
ne
(PP
B)

11 TN Ambient Air Monitoring Plan | 2016
Maryville – Blount County
Address 2007 Sequoyah Avenue Maryville TN 37803
AQSID 470090011
CBSA 28940
Lat, Lon 35.768847, -83.942152
Parameter Code 88101 88501
Parameter Name PM2.5 PM2.5 Cont
Monitor Type SPM SPM
POC 1 3
Int 7 1
Collection Frequency 1 in 3 Hourly
Method 118 716
FRM/FEM Instrument R & P Co Plus Model 2025 None
Analysis Gravimetric
Teom Gravimetric 50 Deg C
Ref Mtd ID Rfps-0498-118 None
Monitor Objective Population Exposure
Dominant Source Area
Measurement Scale Neighborhood
Land Use Type Residential
Location Setting Suburban
The Maryville site is located in Blount County, Tennessee and currently supports monitoring for fine particulate
matter. The site was initially established in 2000 and is expected to operate during CY’s 2015 and 2016. This site is
located south of Knoxville and northwest of the GSMNP. Tennessee. This site is an upwind site from the core
Knoxville MSA area.
PM2.5 monitoring began 05/01/2000 as a part of the original PM2.5 state network. Continuous PM2.5 monitoring
using a non FRM/FEM method was added later to assist with the PM Fine AQI forecasting program.
Because of the importance this site serves in assessing the upwind PM2.5 levels entering the Knoxville area, this
site will be recommended to remain in operation over the next 5 years (2015 thru 2020). The Knoxville MSA has 6
PM2.5 FRM sites and is only required to have 2 to meet the minimum requirements. This site is a candidate site to
receive an FEM continuous PM2.5 sampler (2016/2017) and at such time the FRM sampler will be retired.
This site is also employed in the AQI forecasting program and is used to help assess impacts from precursor
transport into Tennessee from Georgia and North Carolina.
Maryville Daily Air Quality01
Jan '13 Apr '13 Jun '13 Sep '13 Dec '13 Mar '14 Jun '14 Sep '14 Dec '14 Mar '15 Jun '15 Sep '15 Dec '15
8hrMaxOzo
0
10
20
30
Jan '13 Apr '13 Jun '13 Sep '13 Dec '13 Mar '14 Jun '14 Sep '14 Dec '14 Mar '15 Jun '15 Sep '15 Dec '15
PM
2.5
FRM
/FEM
(ug/m
3)
0
10
20
30
Jan '13 Apr '13 Jun '13 Sep '13 Dec '13 Mar '14 Jun '14 Sep '14 Dec '14 Mar '15 Jun '15 Sep '15 Dec '15
PM
2.5
TEOM
(u
g/m3
)

12 TN Ambient Air Monitoring Plan | 2016
Look Rock – Blount County (GSM NP)
Address Great Smoky Mountains NP Look Rock
AQSID 470090101
CBSA 28940
Lat, Lon 35.6334799, -83.941605999999993
Parameter Code 44201
Parameter Name O3
Monitor Type SLAMS
POC 1
Int W
Collection Frequency Hourly Hourly
Method 053 716
FRM/FEM Instrument Monitor Labs 8810 None
Analysis Ultra Violet
TEOM Gravimetric 50 deg C
Ref Mtd ID EQOA-0881-053 None
Monitor Objective General Background
Dominant Source 0
Measurement Scale 0
Land Use Type Forest
Location Setting Rural
The Look Rock site is located in Blount County, Tennessee and currently supports monitoring for ozone and other
pollutants. The site was initially established in 1980 and is expected to operate during CY’s 2015 and 2016. This site
is located within the Tennessee portion of the Great Smoky Mtns. National Park. This site is within and southeast of
the Knoxville MSA area.
Ozone monitoring began 07/23/1998 and this site is used with the ozone AQI forecasting program for verification
and to help address ozone levels found in the GSMNP area. PM2.5 monitoring began 05/01/2002 and this site is
used with the PM Fine AQI forecasting program for verification and to help address fine particulate levels found in
the GSMNP area. TDEC DAPC reports the TEOM PM2.5 data for this site to AQS.
This site is operated and maintained by the NPS and will likely remain in operation over the next 5 years (2015 thru
2020), subject to funding support from the NPS.
Look Rock Daily Air Quality
0
20
40
60
80
Jan '13 Apr '13 Jun '13 Sep '13 Dec '13 Mar '14 Jun '14 Sep '14 Dec '14 Mar '15 Jun '15 Sep '15 Dec '15
8h
r Max O
zon
e
(PP
B)
0
PM2.5FRM/F
0
10
20
30
Jan '13 Apr '13 Jun '13 Sep '13 Dec '13 Mar '14 Jun '14 Sep '14 Dec '14 Mar '15 Jun '15 Sep '15 Dec '15
PM
2.5
TEOM
(u
g/m3
)

13 TN Ambient Air Monitoring Plan | 2016
Cades Cove – Blount County (GSM NP)
Address Great Smoky Mountains NP - Cades Cove
AQSID 470090102
CBSA 28940
Lat, Lon 35.603056, -83.7836109999999
Parameter Code 44201
Parameter Name O3
Monitor Type Non-Epa Federal
POC 1
Int W
Collection Frequency Hourly
Method 53
FRM/FEM Instrument Monitor Labs 8810
Analysis Ultra Violet
Ref Mtd ID EQOA-0881-053
Monitor Objective Highest Concentration
Dominant Source 0
Measurement Scale Regional Scale
Land Use Type Forest
Location Setting Rural
The Cades Cove site is located in Blount County, Tennessee and currently supports monitoring for ozone and
meteorological parameters. The site was initially established in 05/01/1994 and is expected to operate during CY’s
2015 and 2016. This site is located within the Tennessee portion of the Great Smoky Mtns. National Park. This site
is within and southeast of the Knoxville MSA area.
Ozone monitoring began 05/01/1994 and this site is used with the ozone AQI forecasting program for verification
and to help address ozone levels found in the GSMNP area and
TDEC APCD reports the ozone data for this site to AQS.
This site is operated and maintained by the NPS and will likely remain in operation over the next 5 years (2015
thru 2020), subject to funding support from the NPS.
Cades Cove Daily Air Quality
0
20
40
60
80
Jan '13 Apr '13 Jun '13 Sep '13 Dec '13 Mar '14 Jun '14 Sep '14 Dec '14 Mar '15 Jun '15 Sep '15 Dec '15
8h
r Ma
x Ozo
ne
(PP
B)

14 TN Ambient Air Monitoring Plan | 2016
Dyersburg – Dyer County
Address 175-B Greenwood Street, Dyersburg TN
38024
AQSID 470450004
CBSA 20540
Lat, Lon 36.038924, -89.382126
Parameter Code 88101 88501
Parameter Name PM2.5 PM2.5 Cont
Monitor Type SLAMS SPM
POC 1 3
Int 7 1
Collection Frequency 1 In 3 Hourly
Method 118 716
FRM/FEM Instrument R & P Co Plus Model 2025
None
Analysis Gravimetric Teom Gravimetric 50 Deg C
Ref Mtd ID RFPS-0498-118 None
Monitor Objective Population Exposure
Dominant Source Area
Measurement Scale Neighborhood
Land Use Type Residential
Location Setting Suburban
The Dyersburg site is located in Dyer County, Tennessee and currently supports monitoring for fine particulate
matter. The site was initially established in 1999 and is expected to operate during CY’s 2015 and 2016. This site is
located northwest of Jackson and north-northeast of Memphis, Tennessee. This site is downwind from the core
Memphis MSA area.
PM2.5 monitoring began 08/22/1998 as a part of the original PM2.5 state network. Continuous PM2.5 monitoring
using a non FRM/FEM method was added later to assist with the PM Fine AQI forecasting program.
Because of the importance this site serves in assessing the area PM2.5 levels outside of the Memphis area, this site
will be recommended to remain in operation over the next 5 years (2015 thru 2020).
This site is a candidate site to receive an FEM continuous PM2.5 sampler (2016/2017) and at such time, the FRM
sampler will be retired. This site is also employed in the AQI forecasting program and is used to help assess
impacts from precursor transport into Tennessee from adjacent states.
Dyersburg Daily Air Quality01
Jan '13 Apr '13 Jun '13 Sep '13 Dec '13 Mar '14 Jun '14 Sep '14 Dec '14 Mar '15 Jun '15 Sep '15 Dec '15
8hrMaxOzo
0
10
20
30
Jan '13 Apr '13 Jun '13 Sep '13 Dec '13 Mar '14 Jun '14 Sep '14 Dec '14 Mar '15 Jun '15 Sep '15 Dec '15
PM
2.5
FRM
/FEM
(ug/m
3)
0
10
20
30
Jan '13 Apr '13 Jun '13 Sep '13 Dec '13 Mar '14 Jun '14 Sep '14 Dec '14 Mar '15 Jun '15 Sep '15 Dec '15
PM
2.5
TEOM
(u
g/m3
)

15 TN Ambient Air Monitoring Plan | 2016
New Market – Jefferson County
Address 2393 Forrester Rd, New Market, TN 37820
AQSID 470890002
CBSA 34100
Lat, Lon 36.105629, -83.6020769999999
Parameter Code 44201
Parameter Name O3
Monitor Type SLAMS
POC 1
Int W
Collection Frequency Hourly
Method 87
FRM/FEM Instrument Model 400 Ozone Analyzer
Analysis Ultra Violet Absorption
Ref Mtd ID EQOA-0992-087
Monitor Objective Max Ozone Concentration
Dominant Source 0
Measurement Scale 0
Land Use Type Agricultural
Location Setting Rural
The New Market site is located in Jefferson County, Tennessee and currently supports monitoring for ozone. The
site was initially established in 1999 and is expected to operate during CY’s 2015 and 2016. This site is located east
northeast of Knoxville and west northwest of Morristown, Tennessee. This site is downwind from the core
Knoxville MSA area.
Ozone monitoring began 03/01/1999 and this site is used with the ozone AQI forecasting program for verification
and to help address transport wind patterns opposite of the predominate area directions. This MSA is required to
have 1 ozone site and this site meets that requirement. Because of the importance, this site serves in assessing
the area ozone levels outside and downwind of the Knoxville area, this site will be recommended to remain in
operation over the next 5 years (2015 thru 2020).
New Market Daily Air Quality
0
20
40
60
80
Jan '13 Apr '13 Jun '13 Sep '13 Dec '13 Mar '14 Jun '14 Sep '14 Dec '14 Mar '15 Jun '15 Sep '15 Dec '15
8h
r Max O
zon
e
(PP
B)

16 TN Ambient Air Monitoring Plan | 2016
Lawrence – Lawrence County
Address 355 Busby Rd, Loretto, TN 38469
AQSID 470990002
CBSA 29980
Lat, Lon 35.115968, -87.469954
Parameter Code 88101 88501
Parameter Name PM2.5 PM2.5 Cont
Monitor Type SLAMS SPM
POC 1 3
Int 7 1
Collection Frequency 1 In 3 Hourly
Method 118 716
FRM/FEM Instrument R & P Co Plus Model 2025
None
Analysis Gravimetric Teom Gravimetric 50 Deg C
Ref Mtd ID RFPS-0498-118 None
Monitor Objective Upwind background, population exposure
Dominant Source 0
Measurement Scale Regional Scale
Land Use Type Agricultural
Location Setting Rural
The Lawrence Co. site is located in Lawrence County, Tennessee and currently supports monitoring for PM2.5.
This site is located on the southern border of Tennessee north of Alabama. The site is south west of Nashville and
south east of Jackson, Tennessee. This site is not located near any MSA area in Tennessee.
PM2.5 monitoring began 12/24/1998 as a part of the original PM2.5 state network. Continuous PM2.5 monitoring
using a non FRM/FEM method was added 01/01/2003 to assist with the PM Fine AQI forecasting program. This site
also supported a PM2.5 Speciation and URG sampler from 12/03/2001 to 09/26/2014. This site has also supported
ozone monitoring in the past. This site is a candidate site to receive an FEM continuous PM2.5 sampler (2016/2017)
and at such time the FRM sampler will be retired.
Because this site serves as a background PM2.5 site it is proposed to remain in operation over the next 5 years
(2015 thru 2020).
Lawrence Daily Air Quality01
Jan '13 Apr '13 Jun '13 Sep '13 Dec '13 Mar '14 Jun '14 Sep '14 Dec '14 Mar '15 Jun '15 Sep '15 Dec '15
8hrMaxOzo
0
10
20
30
Jan '13 Apr '13 Jun '13 Sep '13 Dec '13 Mar '14 Jun '14 Sep '14 Dec '14 Mar '15 Jun '15 Sep '15 Dec '15
PM
2.5
FRM
/FEM
(ug/m
3)
0
10
20
30
Jan '13 Apr '13 Jun '13 Sep '13 Dec '13 Mar '14 Jun '14 Sep '14 Dec '14 Mar '15 Jun '15 Sep '15 Dec '15
PM
2.5
TEOM
(u
g/m3
)

17 TN Ambient Air Monitoring Plan | 2016
Loudon – Loudon County
Address 130 Webb Drive, Loudon, TN 37774
AQSID 471050108
CBSA 28940
Lat, Lon 35.744539, -84.317057
Parameter Code 44201 88101
Parameter Name O3 PM2.5
Monitor Type SLAMS SPM
POC 1 1
Int W 7
Year 2014 2014
Collection Frequency Hourly 1 In 3
Method 87 118
FRM/FEM Instrument Model 400 Ozone Analyzer
R & P Co Plus Model
Analysis Ultra Violet Absorption Gravimetric
Ref Mtd ID EQOA-0992-087 RFPS-0498-118
Monitor Objective Max Ozone Concentration
Population Exposure
Dominant Source Area
Measurement Scale Neighborhood
Land Use Type Residential
Location Setting Suburban
The Loudon Pope site is located in Loudon County, Tennessee and currently supports monitoring for PM2.5 and
ozone. This site is located southwest of Knoxville and northeast of Chattanooga, Tennessee. This site is upwind of
the Knoxville Core MSA area and downwind from the Chattanooga MSA area. Ozone monitoring began
03/01/2014 and this site is used with the ozone AQI forecasting program for verification and to help address
Knoxville MSA area. The ozone monitor is scheduled to be relocated to the Loudon Elementary School site during
2016. PM2.5 monitoring began 08/01/2003 as a part of the Loudon air quality study and complaint investigation.
This site is a candidate site to receive an FEM continuous PM2.5 sampler (2016/2017) and at such time the FRM
sampler will be retired. This sampler will also be relocated at the time of the ozone move. This site serves in
assessing the area ozone levels upwind of the Knoxville area. This site will be recommended to remain in
operation over the next 5 years (2015 thru 2020). The Knoxville MSA has 6 operating ozone sites and is required
to have only 2. The Knoxville MSA has 6 operating PM2.5 FRM sites and is required to have only 2.
Loudon Daily Air Quality
0
0.02
0.04
0.06
0.08
Jan '13 Apr '13 Jun '13 Sep '13 Dec '13 Mar '14 Jun '14 Sep '14 Dec '14 Mar '15 Jun '15 Sep '15 Dec '15
8h
r Ma
x Ozo
ne
(PP
B)
0
10
20
30
Jan '13 Apr '13 Jun '13 Sep '13 Dec '13 Mar '14 Jun '14 Sep '14 Dec '14 Mar '15 Jun '15 Sep '15 Dec '15
PM
2.5
FRM
/FEM
(ug/m
3)
0
10
20
30
Jan '13 Apr '13 Jun '13 Sep '13 Dec '13 Mar '14 Jun '14 Sep '14 Dec '14 Mar '15 Jun '15 Sep '15 Dec '15
PM
2.5
TEOM
(u
g/m3
)

18 TN Ambient Air Monitoring Plan | 2016
Athens – McMinn County
Address Saint Mark Ame Zion Church: 707 North
Jackson St, Athens, TN 37303
AQSID 471071002
CBSA 11940
Lat, Lon 35.45011499, -84.5961949999999
Parameter Code 88101 88501
Parameter Name PM2.5 PM2.5 Cont
Monitor Type SPM SPM
POC 1 3
Int 7 1
Collection Frequency 1 In 3 Hourly
Method 118 716
FRM/FEM Instrument R & P Co Plus Model 2025
None
Analysis Gravimetric Teom Gravimetric 50 Deg C
Ref Mtd ID RFPS-0498-118 None
Monitor Objective Population Exposure
Dominant Source Area
Measurement Scale Neighborhood
Land Use Type Commercial
Location Setting Urban And Center City
The Athens site is located in McMinn County, Tennessee and currently supports monitoring for PM2.5. This site is
located northeast of Chattanooga and southwest of Knoxville, Tennessee. This site is downwind from the
Chattanooga MSA area and located in the Athens, Micropolitan area.
PM2.5 monitoring began 02/03/2000 as a part of the original PM2.5 state network. Continuous PM2.5 monitoring
using a non FRM/FEM method was added 01/01/2005 to assist with the PM Fine AQI forecasting program.
This site is a candidate site to receive an FEM continuous PM2.5 sampler (2016/2017) and at such time, the FRM
sampler will be retired.
This site will be recommended to remain in operation over the next 5 years (2015 thru 2020). This site serves to
help quantify air quality in this developing area of the state.
Athens Daily Air Quality01
Jan '13 Apr '13 Jun '13 Sep '13 Dec '13 Mar '14 Jun '14 Sep '14 Dec '14 Mar '15 Jun '15 Sep '15 Dec '15
8hrMaxOzo
0
10
20
30
Jan '13 Apr '13 Jun '13 Sep '13 Dec '13 Mar '14 Jun '14 Sep '14 Dec '14 Mar '15 Jun '15 Sep '15 Dec '15
PM
2.5
FRM
/FEM
(ug/m
3)
0
10
20
30
Jan '13 Apr '13 Jun '13 Sep '13 Dec '13 Mar '14 Jun '14 Sep '14 Dec '14 Mar '15 Jun '15 Sep '15 Dec '15
PM
2.5
TEOM
(u
g/m3
)
19 TN Ambient Air Monitoring Plan | 2016
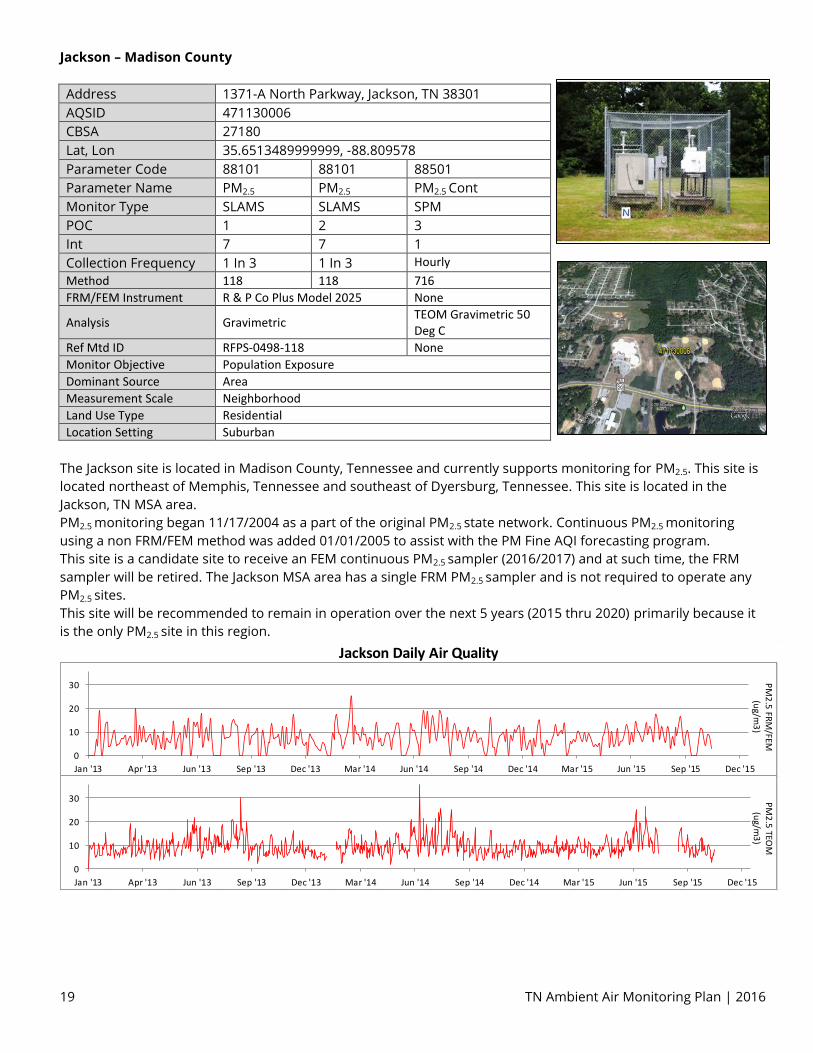
Jackson – Madison County
Address 1371-A North Parkway, Jackson, TN 38301
AQSID 471130006
CBSA 27180
Lat, Lon 35.6513489999999, -88.809578
Parameter Code 88101 88101 88501
Parameter Name PM2.5 PM2.5 PM2.5 Cont
Monitor Type SLAMS SLAMS SPM
POC 1 2 3
Int 7 7 1
Collection Frequency 1 In 3 1 In 3 Hourly
Method 118 118 716
FRM/FEM Instrument R & P Co Plus Model 2025 None
Analysis Gravimetric TEOM Gravimetric 50 Deg C
Ref Mtd ID RFPS-0498-118 None
Monitor Objective Population Exposure
Dominant Source Area
Measurement Scale Neighborhood
Land Use Type Residential
Location Setting Suburban
The Jackson site is located in Madison County, Tennessee and currently supports monitoring for PM2.5. This site is
located northeast of Memphis, Tennessee and southeast of Dyersburg, Tennessee. This site is located in the
Jackson, TN MSA area.
PM2.5 monitoring began 11/17/2004 as a part of the original PM2.5 state network. Continuous PM2.5 monitoring
using a non FRM/FEM method was added 01/01/2005 to assist with the PM Fine AQI forecasting program.
This site is a candidate site to receive an FEM continuous PM2.5 sampler (2016/2017) and at such time, the FRM
sampler will be retired. The Jackson MSA area has a single FRM PM2.5 sampler and is not required to operate any
PM2.5 sites.
This site will be recommended to remain in operation over the next 5 years (2015 thru 2020) primarily because it
is the only PM2.5 site in this region.
Jackson Daily Air Quality01
Jan '13 Apr '13 Jun '13 Sep '13 Dec '13 Mar '14 Jun '14 Sep '14 Dec '14 Mar '15 Jun '15 Sep '15 Dec '15
8hrMaxOzo
0
10
20
30
Jan '13 Apr '13 Jun '13 Sep '13 Dec '13 Mar '14 Jun '14 Sep '14 Dec '14 Mar '15 Jun '15 Sep '15 Dec '15
PM
2.5
FRM
/FEM
(ug/m
3)
0
10
20
30
Jan '13 Apr '13 Jun '13 Sep '13 Dec '13 Mar '14 Jun '14 Sep '14 Dec '14 Mar '15 Jun '15 Sep '15 Dec '15
PM
2.5
TEOM
(u
g/m3
)

20 TN Ambient Air Monitoring Plan | 2016
Columbia – Maury County
Address 1600 Nashville Hwy, Columbia, TN
AQSID 471192007
CBSA 17940
Lat, Lon 35.65187999, -87.0096
Parameter Code 88101
Parameter Name PM2.5
Monitor Type SPM
POC 1
Int 7
Collection Frequency 1 In 3
Method 118
FRM/FEM Instrument R & P Co Plus Model 2025
Analysis Gravimetric
Ref Mtd ID RFPS-0498-118
Monitor Objective Population Exposure
Dominant Source Area
Measurement Scale Middle Scale
Land Use Type Commercial
Location Setting Urban And Center City
The Columbia site is located in Maury County, Tennessee and currently supports monitoring for PM2.5. This site is
located south-southwest of Nashville and northwest of Lewisburg, Tennessee. This site is up wind from the
Nashville MSA area.
PM2.5 monitoring began 12/25/1998 as a part of the original PM2.5 state network
This site is a candidate site to receive an FEM continuous PM2.5 sampler (2016/2017) and at such time, the FRM
sampler will be retired.
This site will be recommended to remain in operation over the next 5 years (2015 thru 2020) primarily because it
is the only PM2.5 site in this region.
Columbia Daily Air Quality01
Jan '13 Apr '13 Jun '13 Sep '13 Dec '13 Mar '14 Jun '14 Sep '14 Dec '14 Mar '15 Jun '15 Sep '15 Dec '15
8hrMaxOzo
0
10
20
30
Jan '13 Apr '13 Jun '13 Sep '13 Dec '13 Mar '14 Jun '14 Sep '14 Dec '14 Mar '15 Jun '15 Sep '15 Dec '15
PM
2.5
FRM
/FEM
(ug/m
3)

21 TN Ambient Air Monitoring Plan | 2016
Clarksville – Montgomery County
Address 1514-C Golf Club Ln, Clarksville, TN
AQSID 471251009
CBSA 11940
Lat, Lon 36.514712, -87.3280469999999
Parameter Code 88101 88501
Parameter Name PM2.5 PM2.5 Cont
Monitor Type SLAMS SPM
POC 1 3
Int 7 1
Collection Frequency Daily Hourly
Method 118 716
FRM/FEM Instrument R & P Co Plus Model 2025
None
Analysis Gravimetric TEOM Gravimetric 50 Deg C
Ref Mtd ID RFPS-0498-118 None
Monitor Objective Population Exposure
Dominant Source 0
Measurement Scale Neighborhood
Land Use Type Residential
Location Setting Suburban
The Clarksville site is located in Montgomery County, Tennessee and currently supports monitoring for PM2.5. This
site is located northwest of Nashville, Tennessee and is located near the Tennessee/Kentucky border. This site is
upwind from the Clarksville, TN-KY MSA area. This site is suitable for use in meeting the MSA monitoring
requirement for PM2.5 for both Tennessee and Kentucky.
PM2.5 monitoring began 01/01/1998 as a part of the original PM2.5 state network. Continuous PM2.5 monitoring
using a non FRM/FEM method was added 03/10/2008 to assist with the PM fine AQI forecasting program. The
Clarksville MSA area has a single FRM PM2.5 sampler and is not required to operate a PM2.5 site for the MSA.
This site is a candidate site to receive an FEM continuous PM2.5 sampler. This site will be recommended to remain
in operation over the next 5 years (2015 thru 2020) primarily because it is the only PM2.5 site in this region.
Tennessee is considering removal of the elevated platforms that are a part of the sampling network for safety
related concerns and is proposing to place the Clarksville PM2.5 monitoring site on the ground near the existing
location the elevated platform now occupies. If a suitable location is not available in the immediate area,
Tennessee proposes to relocate the site as close as possible to the previous location. This proposed change is
anticipated over the next calendar year and will be preceded by a formal written request to EPA with the
relocation details.
Clarksville Daily Air Quality01
Jan '13 Apr '13 Jun '13 Sep '13 Dec '13 Mar '14 Jun '14 Sep '14 Dec '14 Mar '15 Jun '15 Sep '15 Dec '15
8hrMaxOzo
0
10
20
30
Jan '13 Apr '13 Jun '13 Sep '13 Dec '13 Mar '14 Jun '14 Sep '14 Dec '14 Mar '15 Jun '15 Sep '15 Dec '15
PM
2.5
FRM
/FEM
(ug/m
3)
0
10
20
30
Jan '13 Apr '13 Jun '13 Sep '13 Dec '13 Mar '14 Jun '14 Sep '14 Dec '14 Mar '15 Jun '15 Sep '15 Dec '15
PM
2.5
TEOM
(u
g/m3
)

22 TN Ambient Air Monitoring Plan | 2016
Cookeville – Putnam County
Address 630 East 20Th Street, Cookeville TN
AQSID 471410005
CBSA 18260
Lat, Lon 36.1857019999999, -85.492107
Parameter Code 88101
Parameter Name PM2.5
Monitor Type SPM
POC 1
Int 7
Collection Frequency 1 In 3
Method 118
FRM/FEM Instrument R & P Co Plus Model 2025
Analysis Gravimetric
Ref Mtd ID RFPS-0498-118
Monitor Objective Population Exposure
Dominant Source Area
Measurement Scale Neighborhood
Land Use Type Residential
Location Setting Suburban
The Cookeville site is located in Putnam County, Tennessee and currently supports monitoring for PM2.5. This site
is located east of Nashville and northeast of Chattanooga, Tennessee. This site is not located in or near an MSA
area.
PM2.5 monitoring began 08/15/2006 after the site was relocated.
This site is a candidate site to receive an FEM continuous PM2.5 sampler (2016/2017) and at such time, the FRM
sampler will be retired.
This site will be recommended to remain in operation over the next 5 years (2015 thru 2020) primarily because it
is the only PM2.5 site in this region.
Cookeville Daily Air Quality01
Jan '13 Apr '13 Jun '13 Sep '13 Dec '13 Mar '14 Jun '14 Sep '14 Dec '14 Mar '15 Jun '15 Sep '15 Dec '15
8hrMaxOzo
0
10
20
30
Jan '13 Apr '13 Jun '13 Sep '13 Dec '13 Mar '14 Jun '14 Sep '14 Dec '14 Mar '15 Jun '15 Sep '15 Dec '15
PM
2.5
FRM
/FEM
(ug/m
3)

23 TN Ambient Air Monitoring Plan | 2016
Harriman – Roane County
Address Harriman High: 1002 N. Roan St Harriman,
TN
AQSID 471450004
CBSA 11940
Lat, Lon 35.939078, -84.5428019999999
Parameter Code 88101 88501
Parameter Name PM2.5 PM2.5 Cont
Monitor Type SPM SPM
POC 1 3
Int 7 1
Collection Frequency 1 In 3 Hourly
Method 118 716
FRM/FEM Instrument R & P Co Plus Model 2025
None
Analysis Gravimetric TEOM Gravimetric 50 Deg C
Ref Mtd ID RFPS-0498-118 None
Monitor Objective Population Exposure
Dominant Source Area
Measurement Scale 0
Land Use Type Industrial
Location Setting Suburban
The Harriman site is located in Roane County, Tennessee and currently supports monitoring for PM2.5. This site is
located west of Knoxville and west-southwest of Oak Ridge, Tennessee. This site is upwind from the Knoxville MSA
area.
PM2.5 monitoring began 01/01/1998 as a part of the original PM2.5 state network. Continuous PM2.5 monitoring
using a non FRM/FEM method was added 01/01/2005 to assist with the PM fine AQI forecasting program.
This site is a candidate site to receive an FEM continuous PM2.5 sampler (2016/2017) and at such time, the FRM
sampler will be retired.
This site will be recommended to remain in operation over the next 5 years (2015 thru 2020) primarily because it
is in a county containing a partial PM2.5 nonattainment area. The Knoxville MSA has six operating PM2.5 FRM sites
and is required to have only two.
Harriman Daily Air Quality01
Jan '13 Apr '13 Jun '13 Sep '13 Dec '13 Mar '14 Jun '14 Sep '14 Dec '14 Mar '15 Jun '15 Sep '15 Dec '15
8hrMaxOzo
0
10
20
30
Jan '13 Apr '13 Jun '13 Sep '13 Dec '13 Mar '14 Jun '14 Sep '14 Dec '14 Mar '15 Jun '15 Sep '15 Dec '15
PM
2.5
FRM
/FEM
(ug/m
3)
0
10
20
30
Jan '13 Apr '13 Jun '13 Sep '13 Dec '13 Mar '14 Jun '14 Sep '14 Dec '14 Mar '15 Jun '15 Sep '15 Dec '15
PM
2.5
TEOM
(u
g/m3
)

24 TN Ambient Air Monitoring Plan | 2016
Cove Mountain – Sevier Country (GSM NP)
Address Great Smoky Mountain NP- Cove Mountain
AQSID 471550101
CBSA 42940
Lat, Lon 35.6966669999999, -83.609722
Parameter Code 44201
Parameter Name O3
Monitor Type NON-EPA FEDERAL
POC 1
Int W
Collection Frequency Hourly
Method 47
FRM/FEM Instrument Thermo Electron 49
Analysis Ultra Violet
Ref Mtd ID EQOA-0880-047
Monitor Objective General/Background
Dominant Source Area
Measurement Scale Neighborhood
Land Use Type Forest
Location Setting Rural
The Cove Mt. site is located in Sevier County, Tennessee and currently supports monitoring for ozone and
meteorological parameters. This site is located within the Tennessee portion of the Great Smoky Mtns. National
Park. This site is outside and southeast of the Knoxville MSA area.
Ozone monitoring began 07/01/1988 and this site is used with the ozone AQI forecasting program for verification
and to help address ozone levels found in the GSMNP area.
This site is operated and maintained by the NPS and will likely remain in operation over the next 5 years (2015
thru 2020), subject to funding support from the NPS.
Cove Mountain Daily Air Quality
0
20
40
60
80
Jan '13 Apr '13 Jun '13 Sep '13 Dec '13 Mar '14 Jun '14 Sep '14 Dec '14 Mar '15 Jun '15 Sep '15 Dec '15
8h
r Ma
x Ozo
ne
(PP
B)

25 TN Ambient Air Monitoring Plan | 2016
Clingman’s Dome – Sevier County (GSM NP)
Address Great Smoky Mountain Np Clingman’s
Dome
AQSID 471550102
CBSA 42940
Lat, Lon 35.562778, -83.4981
Parameter Code 44201
Parameter Name O3
Monitor Type NON-EPA FEDERAL
POC 1
Int W
Year 2014
Collection Frequency Hourly
Method 47
FRM/FEM Instrument Thermo Electron 49
Analysis Ultra Violet
Ref Mtd ID EQOA-0880-47
Monitor Objective Highest Concentration
Dominant Source Area
Measurement Scale Regional Scale
Land Use Type Forest
Location Setting Rural
The Clingman’s Dome site is located in Sevier County, Tennessee and currently supports monitoring for ozone and
meteorological parameters. This site is located within the Tennessee portion of the Great Smoky Mtns. National
Park. This site is outside and southeast of the Knoxville MSA area.
Ozone monitoring began 04/01/1993 and this site is used with the ozone AQI forecasting program for verification
and to help address ozone levels found in the GSMNP area.
This site is operated and maintained by the NPS and will likely remain in operation over the next 5 years (2015
thru 2020), subject to funding support from the NPS.
The location for the site is the highest point inside of Tennessee and the site is actually located on the border of
Tennessee and North Carolina. The elevation of the site poses challenges in maintenance and access as the site is
often impacted in the late fall and through-out the winter and spring by excessive snow fall and icing events that
prevent access to the site.
The ozone data collected at this site is truncated due to the site access issues in March and April and in some
years in October due to early snowfall events.
Clingman's Dome Daily Air Quality
0
20
40
60
80
Jan '13 Apr '13 Jun '13 Sep '13 Dec '13 Mar '14 Jun '14 Sep '14 Dec '14 Mar '15 Jun '15 Sep '15 Dec '15
8h
r Ma
x Ozo
ne
(PP
B)

26 TN Ambient Air Monitoring Plan | 2016
Kingsport (PM2.5) – Sullivan County
Address 1649 D Street Kingsport Tn 37664
AQSID 471631007
CBSA 11940
Lat, Lon 36.5387619999999, -82.5215649999999
Parameter Code 88101 88501
Parameter Name PM2.5 PM2.5 Cont
Monitor Type SLAMS SPM
POC 1 3
Int 7 1
Collection Frequency 1 In 3 Hourly
Method 118 716
FRM/FEM Instrument R & P Co Plus Model
2025
None
Analysis Gravimetric TEOM Gravimetric 50 Deg C
Ref Mtd ID RFPS-0498-118 None
Monitor Objective Population Exposure Upwind Background
Population Exposure
Dominant Source 0
Measurement Scale Urban Scale
Land Use Type Residential
Location Setting Suburban
The Kingsport site is located in Sullivan County, Tennessee and currently supports monitoring for PM2.5. This site is
located in the far northeast corner of the state and is south of the state of Virginia on the Tennessee Virginia line.
This site is upwind of Gate City, VA and downwind from the Johnson City MSA area. Kingsport is also a part of the
Kingsport Bristol MSA.
PM2.5 monitoring began 10/01/1998 as a part of the original PM2.5 state network. Continuous PM2.5 monitoring
using a non FRM/FEM method was added 01/01/2005 to assist with the PM Fine AQI forecasting program. The
Kingsport MSA area has a single FRM PM2.5 sampler and is not required to operate a PM2.5 site for the MSA.
This site is a candidate site to receive an FEM continuous PM2.5 sampler (2016/2017) and at such time the FRM
sampler will be retired.
This site will be recommended to remain in operation over the next 5 years (2015 thru 2020) primarily because it
is the only PM2.5 site in this region.
Kingsport PM2.5 Daily Air Quality01
Jan '13 Apr '13 Jun '13 Sep '13 Dec '13 Mar '14 Jun '14 Sep '14 Dec '14 Mar '15 Jun '15 Sep '15 Dec '15
8hrMaxOzo
0
10
20
30
Jan '13 Apr '13 Jun '13 Sep '13 Dec '13 Mar '14 Jun '14 Sep '14 Dec '14 Mar '15 Jun '15 Sep '15 Dec '15
PM
2.5
FRM
/FEM
(ug/m
3)
0
10
20
30
Jan '13 Apr '13 Jun '13 Sep '13 Dec '13 Mar '14 Jun '14 Sep '14 Dec '14 Mar '15 Jun '15 Sep '15 Dec '15
PM
2.5
TEOM
(u
g/m3
)
27 TN Ambient Air Monitoring Plan | 2016
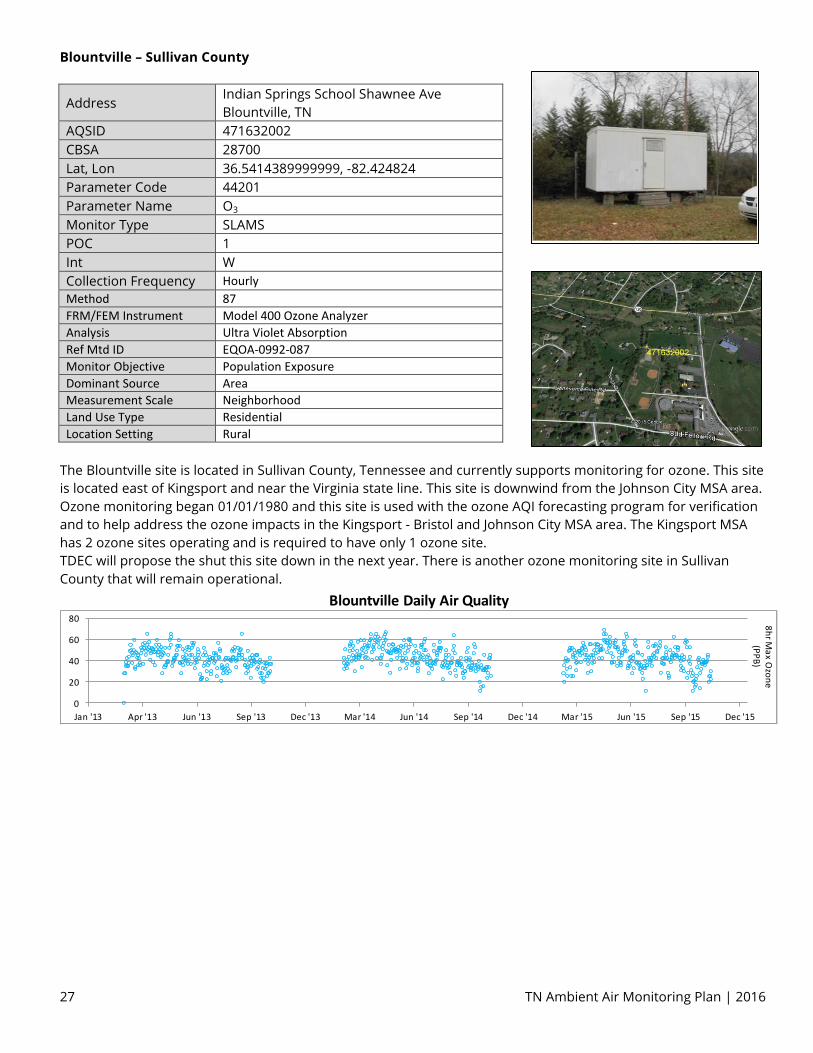
Blountville – Sullivan County
Address Indian Springs School Shawnee Ave
Blountville, TN
AQSID 471632002
CBSA 28700
Lat, Lon 36.5414389999999, -82.424824
Parameter Code 44201
Parameter Name O3
Monitor Type SLAMS
POC 1
Int W
Collection Frequency Hourly
Method 87
FRM/FEM Instrument Model 400 Ozone Analyzer
Analysis Ultra Violet Absorption
Ref Mtd ID EQOA-0992-087
Monitor Objective Population Exposure
Dominant Source Area
Measurement Scale Neighborhood
Land Use Type Residential
Location Setting Rural
The Blountville site is located in Sullivan County, Tennessee and currently supports monitoring for ozone. This site
is located east of Kingsport and near the Virginia state line. This site is downwind from the Johnson City MSA area.
Ozone monitoring began 01/01/1980 and this site is used with the ozone AQI forecasting program for verification
and to help address the ozone impacts in the Kingsport - Bristol and Johnson City MSA area. The Kingsport MSA
has 2 ozone sites operating and is required to have only 1 ozone site.
TDEC will propose the shut this site down in the next year. There is another ozone monitoring site in Sullivan
County that will remain operational.
Blountville Daily Air Quality
0
20
40
60
80
Jan '13 Apr '13 Jun '13 Sep '13 Dec '13 Mar '14 Jun '14 Sep '14 Dec '14 Mar '15 Jun '15 Sep '15 Dec '15
8h
r Ma
x Ozo
ne
(PP
B)

28 TN Ambient Air Monitoring Plan | 2016
Kingsport O3 – Sullivan County
Address 3301 Bloomingdale Rd. Kingsport Tn 3762
AQSID 471632003
County Name Sullivan
CBSA 28700
Lat, Lon 36.58211, -82.485742
Parameter Code 44201
Parameter Name O3
Monitor Type SLAMS
POC 1
Int W
Collection Frequency Hourly
Method 87
FRM/FEM Instrument Model 400 Ozone Analyzer
Analysis Ultra Violet Absorption
Ref Mtd ID EQOA-0992-087
Monitor Objective Population Exposure
Dominant Source 0
Measurement Scale Neighborhood
Land Use Type Residential
Location Setting Suburban
The Kingsport site is located in Sullivan County, Tennessee and currently supports monitoring for ozone. This site
is located in the far northeast corner of the state and is south of the state of Virginia on the Tennessee Virginia
line. This site is upwind of Gate City, VA and downwind from the Johnson City MSA area. Kingsport is also a part of
the Kingsport Bristol MSA
Ozone monitoring began 04/01/1995 and this site is used with the ozone AQI forecasting program for verification
and to help address the Kingsport-Bristol-MSA area. The Kingsport MSA has two ozone sites operating and is
required to have only one ozone site.
This site will be recommended to remain in operation over the next 5 years (2015 thru 2020) primarily because it
is located in the Kingsport area.
Kingsport Daily Air Quality
0
20
40
60
80
Jan '13 Apr '13 Jun '13 Sep '13 Dec '13 Mar '14 Jun '14 Sep '14 Dec '14 Mar '15 Jun '15 Sep '15 Dec '15
8h
r Ma
x Ozo
ne
(PP
B)

29 TN Ambient Air Monitoring Plan | 2016
Exide – Sullivan County
Address 364 Exide Dr, Bristol TN 37620
AQSID 471633004
County Name Sullivan
CBSA 11940
Lat, Lon 36.524433, -82.27261
Parameter Code 14129 14129
Parameter Name Pb Pb
Monitor Type SLAMS SLAMS
POC 1 2
Int 7 7
Collection Frequency 1 In 6 1 In 6
Method 192 192
FRM/FEM Instrument Pb-TSP/ICP Spectra
(ICP-MS)
Pb-TSP/ICP Spectra
(ICP-MS)
Analysis
Inductively Coupled
Plasma-Mass
Spectrometry Acid
Filter Extract With
Hot Nitric Acid
Inductively Coupled Plasma-Mass Spectrometry Acid Filter Extract With Hot Nitric Acid
Ref Mtd ID EQL-0710-192 EQL-0710-192
Monitor Objective Source Oriented
Dominant Source Point
Measurement Scale Urban Scale
Land Use Type Industrial
Location Setting Urban And Center City
The Exide site is located in Sullivan County, Tennessee and currently supports monitoring for lead. This site is
located east of Kingsport and northeast of Blountville on the Tennessee Virginia state lines. This site is downwind
from Johnson City and Blountville and is located in the Kingsport Bristol MSA area.
Lead monitoring began 01/01/2010 and this site is used to verify lead NAAQS compliance at a now shutdown lead
battery plant. This site is an industrial oriented site helping to define the lead air quality in the Kingsport Sullivan
county lead nonattainment area.
This site will be recommended to remain in operation over the next 2 years (2015 thru 2017) primarily to
demonstrate lead NAAQS compliance.

30 TN Ambient Air Monitoring Plan | 2016
Hendersonville Daily Air Quality
0
20
40
60
80
100
Jan '13 Apr '13 Jun '13 Sep '13 Dec '13 Mar '14 Jun '14 Sep '14 Dec '14 Mar '15 Jun '15 Sep '15 Dec '15
8hr Max O
zone (PPB)
0
10
20
30
Jan '13 Apr '13 Jun '13 Sep '13 Dec '13 Mar '14 Jun '14 Sep '14 Dec '14 Mar '15 Jun '15 Sep '15 Dec '15
PM
2.5
FRM
/FEM
(ug/m
3)
0
10
20
30
Jan '13 Apr '13 Jun '13 Sep '13 Dec '13 Mar '14 Jun '14 Sep '14 Dec '14 Mar '15 Jun '15 Sep '15 Dec '15
PM
2.5
TEOM
(u
g/m3
)Hendersonville - Sumner County
Address Rockland Recreational Area, Old Hickory Dam
AQSID 471650007
CBSA 34980
Lat 36.297559999999997, -86.653137000000001
Parameter Code 44201 88101 88101 88501
Parameter Name O3 PM2.5 PM2.5 PM2.5 Cont
Monitor Type SLAMS SLAMS SLAMS SPM
POC 1 1 2 3
Int W 7 1
Collection Frequency Hourly 1 in 3 Hourly
Method 047 118 716
FRM/FEM Instrument Thermo Electron
49
R&P Co Plus
Model 2025
None
Analysis Ultra violet Gravemetric TEOM Gravimetric
50C
Ref Mtd ID EQOA-0880-047 RFPS-0498-118 None
Monitor Objective Highest Conc Population Exposure
Dominant Source Area Area
Measurement Scale Neighborhood Neighborhood
Land Use Type Industrial Industrial
Location Setting Rural Rural
The Hendersonville site is located in Sumner County, Tennessee and currently supports monitoring for ozone and
PM2.5. This site is located northeast of Nashville and west southwest of Gallatin, Tennessee. This site is downwind
from the core Nashville MSA area. Sumner County is part of the Nashville MSA.
Ozone monitoring began 01/01/1973 and this site is used with the ozone AQI forecasting program for verification
and to help address NAAQS compliance in the Nashville MSA area. PM2.5 monitoring began 10/01/1998 as a part of
the original PM2.5 state network. Continuous PM2.5 monitoring using a non FRM/FEM method was added 01/01/2003
to assist with the PM fine AQI forecasting program. This site is a candidate site to receive an FEM continuous PM2.5
sampler. This site will be recommended to remain in operation over the next 5 years (2015 thru 2020) primarily
because it is the ozone DV site for the Nashville MSA area and is downwind from the Nashville fine particulate
precursor sources. The Nashville MSA has 5 ozone monitors operating and is only required to have 2.

31 TN Ambient Air Monitoring Plan | 2016
Fairview – Williamson County
Address Fairview Middle School Crow Cut Road F
AQSID 471870106
CBSA 34980
Lat, Lon 35.951534, -87.137005
Parameter Code 44201
Parameter Name O3
Monitor Type SLAMS
POC 1
Int W
Collection Frequency Hourly
Method 47
FRM/FEM Instrument Thermo Electron 49
Analysis Ultra Violet
Ref Mtd ID EQOA-0880-047
Monitor Objective Population Exposure
Dominant Source Area
Measurement Scale Urban Scale
Land Use Type Agricultural
Location Setting Rural
The Fairview site is located in Williamson County, Tennessee and currently supports monitoring for ozone. This
site is located southwest of Nashville and northwest of Franklin, Tennessee. This site is upwind from the core
Nashville MSA area.
Ozone monitoring began 10/30/2001 and this site is used by the ozone AQI forecasting program for verification
and to help address upwind ozone concentrations entering the Nashville MSA area. The Nashville MSA has 5
ozone sites operating and is only required to have 2.
Because of the importance this site serves in assessing the area ozone levels outside and upwind of the Nashville
area, this site will be recommended to remain in operation over the next 5 years (2015 thru 2020).
Fairview Daily Air Quality
0
20
40
60
80
Jan '13 Apr '13 Jun '13 Sep '13 Dec '13 Mar '14 Jun '14 Sep '14 Dec '14 Mar '15 Jun '15 Sep '15 Dec '15
8h
r Ma
x Ozo
ne
(PP
B)

32 TN Ambient Air Monitoring Plan | 2016
Cedars of Lebanon – Wilson County
Address Cedars Of Lebanon State Park
AQSID 471890103
CBSA 34980
Lat, Lon 36.060833, -86.2862609999999
Parameter Code 44201
Parameter Name O3
Monitor Type SLAMS
POC 1
Int W
Collection Frequency Hourly
Method 47
FRM/FEM Instrument Thermo Electron 49
Analysis Ultra Violet
Ref Mtd ID EQOA-0880-047
Monitor Objective Unknown
Dominant Source Area
Measurement Scale Urban Scale
Land Use Type Forest
Location Setting Rural
The Cedars site is located in Wilson County, Tennessee and currently supports monitoring for ozone. This site is
located east of Nashville and north of Murfreesboro, Tennessee. This site is downwind from Franklin and is
located within the Nashville MSA area.
Ozone monitoring began 05/01/1988 and this site is used with the ozone AQI forecasting program for verification
and to help address downwind ozone levels in the Nashville MSA area. The Nashville MSA has 5 ozone sites
operating and is only required to have 2.
Because of the importance this site serves in assessing the area ozone levels outside and downwind of the
Nashville area, this site will be recommended to remain in operation over the next 5 years (2015 thru 2020).
Cedars Daily Air Quality
0
20
40
60
80
Jan '13 Apr '13 Jun '13 Sep '13 Dec '13 Mar '14 Jun '14 Sep '14 Dec '14 Mar '15 Jun '15 Sep '15 Dec '15
8h
r Ma
x Ozo
ne
(PP
B)

33 TN Ambient Air Monitoring Plan | 2016
Tennessee Geographic Regions, Descriptions and Climate
Climate of Tennessee
Topographic Features - The topography of Tennessee is quite varied, stretching from the lowlands of the
Mississippi Valley to the mountain peaks in the east. The westernmost part of the State, between the bluffs
overlooking the Mississippi River and western valley of the Tennessee River, is a region of gently rolling plains
sloping gradually from 200 to 250 feet in the west to about 600 feet above sea level in the hills overlooking the
Tennessee River. The hilly Highland Rim, in a wide circle touching the Tennessee River Valley in the west and the
Cumberland Plateau in the east, together with the enclosed Central Basin make up the whole of Middle
Tennessee. The Highland Rim ranges from about 600 feet in elevation along the Tennessee River to 1,000 feet in
the east and rises 300 to 400 feet above the Central Basin which is a rolling plain of about 600 feet average
elevation, but with a crescent of hills reaching to over 1,000 feet south of Nashville. The Cumberland Plateau, with
an average elevation of 2,000 feet extends roughly northeast-southwest across the State in a belt 30 to 50 miles
wide, being bounded on the west by the Highland Rim and overlooking the Great Valley of East Tennessee on the
east. The Great Valley, paralleling the Plateau to the west and the Great Smoky Mountains to the east, is a funnel
shaped valley varying in width from about 30 miles in the south to about 90 miles in the north. Within the valley,
which slopes from 1,500 feet in the north to 700 feet in the south, is a series of northeast-southwest ridges. Along
the Tennessee-North Carolina border lie the Great Smoky Mountains, the most rugged and elevated portion of
Tennessee, with numerous peaks from 4,000 to 6,000 feet.
Tennessee, except for a small area east of Chattanooga, lies entirely within the drainage of the Mississippi River
system. The extreme western section of the State is drained through several relatively small rivers directly into the
Mississippi River. Otherwise, drainage is into either the Cumberland or Tennessee Rivers, both of which flow
northward near the end of their courses to join the Ohio River along the Kentucky-Illinois border. The Cumberland
River, which drains north-central portions of Tennessee rises in the Cumberland Mountains in Kentucky, flows
southwestward, then south into Tennessee reaching the Nashville area before tuning northward to re-enter
Kentucky. The Tennessee River is formed by the juncture of the Holston and French Broad rivers at Knoxville. It
flows southwesterly along the Alabama-Mississippi line, and then flows northward across the State into Kentucky.
Besides the headwater streams, other important tributaries include the: Clinch, Little Tennessee, Hiawassee, Elk
and Duck Rivers.
Temperature - Most aspects of the State’s climate are related to the widely varying topography within its borders.
The decrease of temperature with elevation is quite apparent, amounting to, on the average, three degrees
Fahrenheit (°F) per 1,000 feet increase in elevation. Thus higher portions of the State, such as the Cumberland
Plateau and the mountains of the east, have lower average temperature than the Great Valley of East Tennessee,
which they flank, and other lower parts of the State. In the Great Valley temperature increases from north to
south, reaching a value at the south end comparable to that of Middle and West Tennessee where elevation
variations are a generally minor consideration. Across the State, the average annual temperature varies from over
62° F in the extreme southwest to near 45 degrees atop the highest peaks of the east. It is of interest to note that
average January temperature atop a 6,000 foot peak in the Great Smokies is equivalent to that in Central Ohio,
while average July temperature is duplicated along the southern edge of the Hudson Bay in Canada. While most of
the State can be described as having warm, humid summers and mild winters, this must be qualified to include
variations with elevation. Thus with increasing elevation, summers become cooler and more pleasant while
winters become colder and more blustery.

34 TN Ambient Air Monitoring Plan | 2016
This dependence of temperature on elevation is of considerable importance to a variety of interests.
Temperature, together with precipitation, plays an important role in determination what plant and animal life are
adaptable to the area. In the Great Smoky Mountains, for example, the variations in elevation from 1,000 to 6,000
feet with attendant variations in temperature contribute to a remarkable variety of plant life. The relative coolness
of the mountains also contributes to the popularity of that area during the warmer part of the year.
Length of growing season is linked to topography in a way similar to temperature, varying from an average of 237
days at low-lying Memphis to a near 130 days on the highest mountains in the east. Most of the State is included
in the range of 180 to 220 days. Shorter growing seasons than this are confined to the mountains forming the
State’s eastern border and to the northern part of the Cumberland Plateau. Longer growing seasons are found in
counties bordering the Mississippi River, parts of the Central Basin of the Middle Tennessee, and the southern
end of the Great Valley of East Tennessee.
Precipitation - Since the principal source of moist air for this area is the Gulf of Mexico, there exists a gradual
decrease of average precipitation from south to north. This effect is largely obscured however, by the overruling
influence of topography. Air forced to ascend, cools and condenses out a portion of its moisture. Thus, average
precipitation ranges from 46 to 54 inches, increasing from Mississippi bottomlands to the slight hills farther east.
In Middle Tennessee the variation is from a minimum of 45 inches in the Central Basin to 50 to 55 inches in the
surrounding hilly Highland Rim. Over the elevated Cumberland Plateau average annual precipitation is generally
from 50 to 55 inches. In contrast, average annual precipitation in the Great Valley of East Tennessee increases
from near 40 inches in northern portions to over 50 inches in the south. The northern minimum, lowest for the
entire State, results from the shielding influence of the Great Smoky Mountains to the southeast and the
Cumberland Plateau to the northwest. The mountainous eastern border of the State is the wettest, having
average annual precipitation ranging up to 80 inches on the higher, and well-exposed peaks of the Smokies.
Over most of the State, the greatest precipitation occurs during the winter and early spring due to the more
frequent passage of large-scale storms over and near the State during those months. A secondary maximum of
precipitation occurs in midsummer in response to thunderstorm activity. This is especially pronounced in the
mountains of the east where July rainfall exceeds the precipitation of any other month. Lightest precipitation,
observed in the fall, is brought about by the maximum occurrence of slow moving, rain suppressing high pressure
areas. Although all parts of Tennessee are generally well supplied with precipitation, there occurs on the average
one or more prolonged dry spells each year during summer and fall. Studies illustrate the beneficial effects of
supplemental irrigation of crops, despite usually bountiful annual precipitation.
Average annual snowfall varies from four to six inches in the southern and western parts of the State and in most
of the Great Valley of East Tennessee to more than 10 inches over the northern Cumberland Plateau and the
mountains of the east. Over most of the State, due to relatively mild winter temperatures, snow cover rarely
persists for more than a few days.
The most important flood season is during the winter and early spring when the frequent migratory storms bring
general rains of high intensity. During this period both widespread flooding and local flash floods can occur.
During the summer, heavy thunderstorm rains frequently result in local flash flooding. In the fall, while flood
producing rains are rare, a decadent tropical system on occasion causes serious floods. The numerous dams
constructed along the Tennessee and Cumberland rivers are major features in the control of flood waters in the
State.

35 TN Ambient Air Monitoring Plan | 2016
The dams of the Tennessee and Cumberland River systems and the lakes so formed, in addition to vastly reducing
flood damage have: facilitated water transportation, provided abundant low cost hydroelectric power and created
extensive recreation areas. Fishing, boating, swimming and camping along the many lakes, together with the
several state and national parks, have made tourism one of the major industries in the State.
Climate and the Economy - Water resources of Tennessee have been a major factor in the State’s industrial
growth. The bountiful and good quality water supply has influenced the location of industry, especially chemical
processing plants. Three major waterways, the Mississippi, Cumberland and Tennessee Rivers, are suitable for
commercial traffic. Finally, the availability of low cost hydroelectric power from the multipurpose dams of the
Cumberland and Tennessee rivers and tributaries has been stimulus to industry of all types. The principal types of
manufacturing products are: textile mill products, primary metals, fabricated metals and lumber products.
Although surpassed in monetary value by industrial activity, agriculture remains a vital feature of Tennessee’s
economic life. The wide range of climates in Tennessee, from river bottom to mountaintop, coupled with a wide
range of soils, has resulted in a large number of crops which thrive in the State.
Forests represent an additional important segment of Tennessee’s natural resources related to the climate of the
State. Timberland, containing principally hardwood types, covers approximately one-half of the total area of
Tennessee. This has led to a highly diversified woodworking industry and made the area around Memphis the
center of production for wood flooring. The temperate climate of the State is very favorable for logging
operations, allowing full-scale activity during nine months of the year and to a lesser extent during the winter
months.
Climate descriptions of Tennessee
Generally, Tennessee has a temperate climate, with warm summers and mild winters. However, the state's varied
topography leads to a wide range of climatic conditions.
The warmest parts of the state, with the longest growing season, are the Gulf Coastal Plain, the Central Basin, and
the Sequatchie Valley. In the Memphis area in the southwest, the average date of the last killing frost is 20 March,
and the growing season is about 235 days. Memphis has an annual mean temperature of 62°F (17°C), 40°F (4°C) in
January, and 83°F (28°C) in July. In the Nashville area, the growing season lasts about 225 days. Nashville has an
annual mean of 59°F (15°C), ranging from 36°F (2°C) in January to 79°F (26°C) in July. The Knoxville area has a
growing season of 220 days. The city's annual mean temperature is 60°F (16°C), with averages of 41°F (5°C) in
January and 78°F (26°C) in July. In some parts of the mountainous east, where the temperatures are considerably
lower, the growing season is as short as 130 days. The record high temperature for the state is 113°F (45°C), set at
Perryville on 9 August 1930; the record low, –32°F (–36°C), was registered at Mountain City on 30 December 1917.
Severe storms occur infrequently. The greatest rainfall occurs in the winter and early spring, especially March; the
early fall months, particularly September and October, are the driest. Average annual precipitation (1971–2000)
was 54.7 in (138.9 cm) in Memphis and 48 in (122 cm) in Nashville. Snowfall varies and is more prevalent in East
Tennessee than in the western section; Nashville gets about 10 in (25.4 cm) a year, Memphis only 5 in (12.7 cm).
UT Institute of Agriculture > Tennessee Climatological Service > Climate Data for Tennessee

36 TN Ambient Air Monitoring Plan | 2016
Map of Tennessee Geographic Regions

37 TN Ambient Air Monitoring Plan | 2016
Climate Synopsis for Tennessee
The highly varied topography of Tennessee has a significant impact on the state's climate. The landscape varies
generally from west to east, starting with the gently rolling lowlands (200-600' above sea level) in the west, rising
to the Highland Rim (600-1000') enclosing the Central Basin, and on up to the Cumberland Plateau (~2000') which
trends northeast-southwest across the state in a belt 30-50 miles wide. East of the Plateau is the Great Valley of
East Tennessee (elevations ranging from 1500' in the north down to 700' in the south) containing a series of
northeast-southwest ridges. The eastern border of the state is dominated by the Great Smoky Mountains, with
numerous peaks rising 4000' to 6000' above sea level.
Average annual temperatures across the state range from around 57°F to 60°F (1981-2010). Winter mean
temperatures are near 39°F (1981-2010) over most of the state, while summer temperatures average between
74°F and 78°F (1981-2010). Of course, these general patterns are affected by topography: the higher mountain
areas tend to have milder summers as well as colder, more blustery winters. The length of the growing season is
also linked to topography: most of the state has a growing season between 180 and 220 days, but this stretches to
over 235 days in the lowlands around Memphis and drops to near 130 days in the highest mountains to the east.
The principal source of moisture for the state is the Gulf of Mexico to the south, which results in a gradual
decrease of precipitation from south to north. This gradient is largely obscured, however, by orographic effects. In
West Tennessee, annual precipitation amounts range from 46 inches to 54 inches, increasing from the Mississippi
bottomlands to the slight hills farther east. In Middle Tennessee, the variation is from around 45 inches in the
Central Basin to 50-55 inches in the surrounding Highland Rim. The Cumberland Plateau also averages 50-55
inches per year. In the Great Valley of Eastern Tennessee, annual precipitation rises from a minimum of 40 inches
in the north (the driest part of the state due to the rain shadow effect of the Great Smoky Mountains and the
Cumberland Plateau) to over 50 inches in the south. The mountainous eastern border of the state is the wettest
part, with annual totals of up to 80 inches in the higher, well-exposed peaks.
Over most of the state, the greatest precipitation occurs in winter and early spring owing to the more frequent
passage of large-scale (frontal) storms over the region. A secondary maximum of precipitation occurs in
midsummer in response to shower and thunderstorm activity, especially in July in the mountains of the east. Fall
tends to be the dry season for the state, due to the higher frequency of slow-moving high pressure areas during
this season. Average annual snowfall ranges from 4-6 inches in the south and west to over 10 inches in the east.
Due to the relatively mild winter conditions over most of the state, snow cover rarely persists for more than a few
days.
Severe storms are relatively infrequent in the state, being east of the center of tornado activity, south of most
blizzard conditions, and too far inland to be often affected by hurricanes. An average of 26 (1991-2011) tornadoes
are observed in the state each year, mostly confined to areas west of the Cumberland Plateau. Hailstorms (>1”) at
a given location are observed 3 to 6 (2003-2012) times a year, and damaging glaze storms occur in the state every
3 or 4 years (1996-2013). Thunderstorms are frequent in the warm season, and severe thunderstorms with
damaging winds are experienced at scattered locations throughout the state each year.
Adapted from: Climatography of the United States, No. 60, National Climatic Data Center
Updated 2/26/2014 by TDAPC using data from NCDC

38 TN Ambient Air Monitoring Plan | 2016
Windrose Data for Tennessee

39 TN Ambient Air Monitoring Plan | 2016
Tennessee Metropolitan Statistical Areas and Population Estimates
CBSA ST COU NAME LSAD CENSUS
2010 POP POP EST
2015 16860 Chattanooga, TN-GA Metropolitan Statistical Area 528143 547776
16860 13047 Catoosa County, GA County or equivalent 63942 66050
16860 13083 Dade County, GA County or equivalent 16633 16264
16860 13295 Walker County, GA County or equivalent 68756 68066
16860 47065 Hamilton County, TN County or equivalent 336463 354098
16860 47115 Marion County, TN County or equivalent 28237 28487 16860 47153 Sequatchie County, TN County or equivalent 14112 14811
17300 Clarksville, TN-KY Metropolitan Statistical Area 260625 281021
17300 21047 Christian County, KY County or equivalent 73955 73309
17300 21221 Trigg County, KY County or equivalent 14339 14233
17300 47125 Montgomery County, TN County or equivalent 172331 193479
17420 Cleveland, TN Metropolitan Statistical Area 115788 120864
17420 47011 Bradley County, TN County or equivalent 98963 104091 27180 Jackson, TN Metropolitan Statistical Area 130011 129682
27180 47023 Chester County, TN County or equivalent 17131 17471
27180 47033 Crockett County, TN County or equivalent 14586 14601
27180 47113 Madison County, TN County or equivalent 98294 97610
27740 Johnson City, TN Metropolitan Statistical Area 198716 200648
27740 47019 Carter County, TN County or equivalent 57424 56486 27740 47171 Unicoi County, TN County or equivalent 18313 17860
27740 47179 Washington County, TN County or equivalent 122979 126302
28700 Kingsport-Bristol-Bristol, TN-VA Metropolitan Statistical Area 309544 307120
28700 47073 Hawkins County, TN County or equivalent 56833 56471
28700 47163 Sullivan County, TN County or equivalent 156823 156791
28700 51169 Scott County, VA County or equivalent 23177 22126
28700 51191 Washington County, VA County or equivalent 54876 54591 28700 51520 Bristol city, VA County or equivalent 17835 17141
28940 Knoxville, TN Metropolitan Statistical Area 837571 861424
28940 47001 Anderson County, TN County or equivalent 75129 75749
28940 47009 Blount County, TN County or equivalent 123010 127253
28940 47013 Campbell County, TN County or equivalent 40716 39752
28940 47057 Grainger County, TN County or equivalent 22657 22846
28940 47093 Knox County, TN County or equivalent 432226 451324 28940 47105 Loudon County, TN County or equivalent 48556 51130
28940 47129 Morgan County, TN County or equivalent 21987 21498
28940 47145 Roane County, TN County or equivalent 54181 52753
28940 47173 Union County, TN County or equivalent 19109 19119
32820 Memphis, TN-MS-AR Metropolitan Statistical Area 1324829 1344127
32820 5035 Crittenden County, AR County or equivalent 50902 48963
32820 28009 Benton County, MS County or equivalent 8729 8182 32820 28033 DeSoto County, MS County or equivalent 161252 173323
32820 28093 Marshall County, MS County or equivalent 37144 35916
32820 28137 Tate County, MS County or equivalent 28886 28296
32820 28143 Tunica County, MS County or equivalent 10778 10343
32820 47047 Fayette County, TN County or equivalent 38413 39165
32820 47157 Shelby County, TN County or equivalent 927644 938069
32820 47167 Tipton County, TN County or equivalent 61081 61870 34100 Morristown, TN Metropolitan Statistical Area 113951 116642
34100 47063 Hamblen County, TN County or equivalent 62544 63402
34100 47089 Jefferson County, TN County or equivalent 51407 53240
34980 Nashville-Davidson--Murfreesboro--Franklin, TN Metropolitan Statistical Area 1670890 1830345
34980 47015 Cannon County, TN County or equivalent 13801 13840
34980 47021 Cheatham County, TN County or equivalent 39105 39741 34980 47037 Davidson County, TN County or equivalent 626681 678889
34980 47043 Dickson County, TN County or equivalent 49666 51487
34980 47081 Hickman County, TN County or equivalent 24690 24363
34980 47111 Macon County, TN County or equivalent 22248 23177
34980 47119 Maury County, TN County or equivalent 80956 87757
34980 47147 Robertson County, TN County or equivalent 66283 68570
34980 47149 Rutherford County, TN County or equivalent 262604 298612 34980 47159 Smith County, TN County or equivalent 19166 19295
34980 47165 Sumner County, TN County or equivalent 160645 175989
34980 47169 Trousdale County, TN County or equivalent 7870 8042
34980 47187 Williamson County, TN County or equivalent 183182 211672
34980 47189 Wilson County, TN County or equivalent 113993 128911

40 TN Ambient Air Monitoring Plan | 2016
Tennessee Micropolitan Statistical Areas and Population Estimates
CBSA ST COU NAME LSAD CENSUS
2010 POP
POP ESTIMATE
2015 11940 Athens, TN Micropolitan Statistical Area 52266 52639
11940 47107 McMinn County, TN County or equivalent 52266 52639
18260 Cookeville, TN Micropolitan Statistical Area 106042 108191
18260 47087 Jackson County, TN County or equivalent 11638 11509
18260 47133 Overton County, TN County or equivalent 22083 22129 18260 47141 Putnam County, TN County or equivalent 72321 74553
18900 Crossville, TN Micropolitan Statistical Area 56053 58229
18900 47035 Cumberland County, TN County or equivalent 56053 58229
19420 Dayton, TN Micropolitan Statistical Area 31809 32526
19420 47143 Rhea County, TN County or equivalent 31809 32526
20540 Dyersburg, TN Micropolitan Statistical Area 38335 37893
20540 47045 Dyer County, TN County or equivalent 38335 37893 24620 Greeneville, TN Micropolitan Statistical Area 68831 68580
24620 47059 Greene County, TN County or equivalent 68831 68580
29980 Lawrenceburg, TN Micropolitan Statistical Area 41869 42564
29980 47099 Lawrence County, TN County or equivalent 41869 42564
30280 Lewisburg, TN Micropolitan Statistical Area 30617 31552
30280 47117 Marshall County, TN County or equivalent 30617 31552
32280 Martin, TN Micropolitan Statistical Area 35021 33960 32280 47183 Weakley County, TN County or equivalent 35021 33960
32660 McMinnville, TN Micropolitan Statistical Area 39839 40435
32660 47177 Warren County, TN County or equivalent 39839 40435
35460 Newport, TN Micropolitan Statistical Area 35662 35162
35460 47029 Cocke County, TN County or equivalent 35662 35162
37540 Paris, TN Micropolitan Statistical Area 32330 32147 37540 47079 Henry County, TN County or equivalent 32330 32147
42940 Sevierville, TN Micropolitan Statistical Area 89889 95946
42940 47155 Sevier County, TN County or equivalent 89889 95946
43180 Shelbyville, TN Micropolitan Statistical Area 45058 47183
43180 47003 Bedford County, TN County or equivalent 45058 47183
46100 Tullahoma-Manchester, TN Micropolitan Statistical Area 100210 102048
46100 47031 Coffee County, TN County or equivalent 52796 54277 46100 47051 Franklin County, TN County or equivalent 41052 41449
46100 47127 Moore County, TN County or equivalent 6362 6322
46460 Union City, TN-KY Micropolitan Statistical Area 38620 36877
46460 21075 Fulton County, KY County or equivalent 6813 6238
46460 47131 Obion County, TN County or equivalent 31807 30639

41 TN Ambient Air Monitoring Plan | 2016
Tennessee County Population Data Trends (2010 Census and Estimates to 2015 by US Census Bureau)
Annual Estimates of the Resident Population: April 1, 2010 to July 1, 2015
2015 Population Estimates
Geography April 1, 2010 Population Estimate (as of July 1)
Geography April 1, 2010 Population Estimate (as of July 1)
Census Estimate 2010 2011 2012 2013 2014 2015
Census Estimate 2010 2011 2012 2013 2014 2015
Anderson 75,129 75,126 75,154 75,222 75,354 75,443 75,382 75,749
Lake 7,832 7,832 7,820 7,773 7,708 7,714 7,664 7,576
Bedford 45,058 45,058 45,103 45,279 45,327 45,712 46,428 47,183
Lauderdale 27,815 27,815 27,731 27,680 27,659 27,526 27,335 26,936
Benton 16,489 16,489 16,492 16,421 16,359 16,281 16,115 16,129
Lawrence 41,869 41,869 42,005 42,073 42,154 42,017 42,323 42,564
Bledsoe 12,876 12,869 12,870 12,837 12,786 13,778 14,526 14,502
Lewis 12,161 12,161 12,151 12,137 11,905 11,953 11,872 11,854
Blount 123,010 123,016 123,156 123,623 123,998 124,943 126,124 127,253
Lincoln 33,361 33,361 33,420 33,414 33,438 33,568 33,589 33,743
Bradley 98,963 98,963 99,155 100,009 101,222 101,929 103,058 104,091
Loudon 48,556 48,559 48,752 49,088 49,773 50,431 50,722 51,130
Campbell 40,716 40,716 40,716 40,570 40,439 40,211 39,910 39,752
McMinn 52,266 52,266 52,185 52,358 52,447 52,401 52,684 52,639
Cannon 13,801 13,801 13,800 13,746 13,848 13,783 13,718 13,840
McNairy 26,075 26,076 26,054 26,040 26,166 26,092 26,149 26,066
Carroll 28,522 28,505 28,466 28,569 28,608 28,472 28,207 27,910
Macon 22,248 22,242 22,258 22,466 22,509 22,643 23,012 23,177
Carter 57,424 57,424 57,360 57,483 57,352 57,025 56,358 56,486
Madison 98,294 98,294 98,252 98,010 98,505 98,707 98,089 97,610
Cheatham 39,105 39,108 39,120 39,000 39,257 39,396 39,714 39,741
Marion 28,237 28,232 28,234 28,084 28,233 28,328 28,396 28,487
Chester 17,131 17,131 17,173 17,212 17,210 17,349 17,379 17,471
Marshall 30,617 30,617 30,686 30,904 30,940 31,100 31,301 31,552
Claiborne 32,213 32,213 32,234 32,084 31,723 31,598 31,624 31,709
Maury 80,956 80,959 81,218 81,448 82,002 83,640 85,598 87,757
Clay 7,861 7,860 7,843 7,819 7,796 7,775 7,740 7,771
Meigs 11,753 11,753 11,781 11,667 11,684 11,677 11,724 11,830
Cock 35,662 35,662 35,660 35,385 35,463 35,309 35,285 35,162
Monroe 44,519 44,517 44,631 44,932 45,153 45,225 45,386 45,771
Coffee 52,796 52,795 52,778 52,880 53,125 53,321 53,638 54,277
Montgomery 172,331 172,337 173,189 176,681 185,311 184,635 189,795 193,479
Crockett 14,586 14,584 14,584 14,556 14,611 14,597 14,635 14,601
Moore 6,362 6,362 6,356 6,418 6,355 6,325 6,336 6,322
Cumberland 56,053 56,050 56,198 56,604 57,048 57,478 57,915 58,229
Morgan 21,987 21,987 22,001 22,062 21,946 21,709 21,757 21,498
Davidson 626,681 626,662 628,131 635,799 649,318 659,428 669,094 678,889
Obion 31,807 31,807 31,818 31,685 31,356 31,081 30,884 30,639
Decatur 11,757 11,750 11,729 11,683 11,658 11,701 11,730 11,660
Overton 22,083 22,078 22,091 22,177 22,208 22,004 21,981 22,129
DeKalb 18,723 18,721 18,717 18,795 18,903 19,098 19,211 19,182
Perry 7,915 7,915 7,930 7,844 7,840 7,862 7,843 7,929
Dickson 49,666 49,654 49,697 49,934 50,153 50,195 50,592 51,487
Pickett 5,077 5,077 5,072 5,135 5,073 5,046 5,084 5,146
Dyer 38,335 38,337 38,321 38,142 38,237 38,132 37,868 37,893
Polk 16,825 16,825 16,808 16,729 16,595 16,628 16,711 16,773
Fayette 38,413 38,413 38,408 38,526 38,615 38,765 38,999 39,165
Putnam 72,321 72,367 72,601 72,905 73,339 73,788 74,467 74,553
Fentress 17,959 17,959 17,928 18,021 17,919 17,936 17,862 17,917
Rhea 31,809 31,809 31,865 32,005 32,290 32,498 32,652 32,526
Franklin 41,052 41,052 40,957 40,844 40,759 41,258 41,378 41,449
Roane 54,181 54,180 54,144 53,820 53,472 53,011 52,756 52,753
Gibson 49,683 49,683 49,723 49,855 49,663 49,441 49,501 49,399
Robertson 66,283 66,288 66,330 66,644 66,700 67,235 67,983 68,570
Giles 29,485 29,485 29,398 29,325 28,926 28,737 28,811 28,946
Rutherford 262,604 262,604 263,781 269,097 274,339 281,596 289,147 298,612
Grainger 22,657 22,652 22,709 22,722 22,633 22,663 22,815 22,846
Scott 22,228 22,228 22,235 22,110 22,157 22,004 21,994 21,950
Greene 68,831 68,831 68,834 68,981 68,643 68,265 68,413 68,580
Sequatchie 14,112 14,119 14,135 14,280 14,425 14,666 14,778 14,811
Grundy 13,703 13,708 13,720 13,628 13,628 13,478 13,444 13,441
Sevier 89,889 89,876 90,131 91,282 92,436 93,532 94,889 95,946
Hamblen 62,544 62,541 62,558 62,826 62,718 63,054 62,994 63,402
Shelby 927,644 927,640 928,618 933,529 939,672 939,074 938,405 938,069
Hamilton 336,463 336,465 337,313 340,918 345,752 349,036 350,800 354,098
Smith 19,166 19,162 19,135 19,156 19,126 19,064 19,040 19,295
Hancock 6,819 6,819 6,812 6,711 6,676 6,634 6,619 6,572
Stewart 13,324 13,324 13,347 13,239 13,333 13,329 13,268 13,259
Hardeman 27,253 27,253 27,158 26,842 26,523 26,251 25,941 25,707
Sullivan 156,823 156,823 156,833 156,952 156,636 156,578 156,803 156,791
Hardin 26,026 26,025 26,052 25,886 26,014 26,002 25,843 25,756
Sumner 160,645 160,657 161,288 163,943 166,183 169,128 172,870 175,989
Hawkins 56,833 56,836 56,872 56,637 56,569 56,740 56,558 56,471
Tipton 61,081 61,081 61,147 61,318 61,659 61,712 61,812 61,870
Haywood 18,787 18,787 18,769 18,541 18,255 18,227 18,196 18,023
Trousdale 7,870 7,869 7,867 7,809 7,780 7,785 8,002 8,042
Henderson 27,769 27,793 27,797 28,032 28,025 27,976 28,017 28,015
Unicoi 18,313 18,313 18,275 18,272 18,233 18,052 17,928 17,860
Henry 32,330 32,330 32,381 32,359 32,353 32,224 32,261 32,147
Union 19,109 19,109 19,100 19,216 19,112 19,051 18,984 19,119
Hickman 24,690 24,699 24,659 24,350 24,142 24,170 24,388 24,363
Van Buren 5,548 5,548 5,548 5,523 5,616 5,553 5,611 5,677
Houston 8,426 8,426 8,444 8,340 8,420 8,284 8,258 8,149
Warren 39,839 39,840 39,864 39,899 39,775 39,930 40,038 40,435
Humphreys 18,538 18,538 18,573 18,400 18,299 18,240 18,128 18,135
Washington 122,979 122,979 123,338 124,012 124,919 125,488 125,862 126,302
Jackson 11,638 11,614 11,577 11,490 11,501 11,504 11,478 11,509
Wayne 17,021 17,021 16,978 16,997 16,988 16,908 16,842 16,748
Jefferson 51,407 51,570 51,608 51,927 52,289 52,312 52,680 53,240
Weakley 35,021 35,021 35,031 34,912 34,780 34,283 34,142 33,960
Johnson 18,244 18,244 18,285 18,212 18,123 18,001 17,917 17,830
White 25,841 25,834 25,836 26,045 26,086 26,260 26,350 26,521
Knox 432,226 432,234 433,035 436,530 441,097 444,170 448,617 451,324
Williamson 183,182 183,180 184,068 188,296 193,010 198,969 205,334 211,672
Wilson 113,993 114,011 114,620 116,787 119,106 122,002 125,418 128,911
http://factfinder.census.gov/faces/tableservices/jsf/pages/productview.xhtml?src=bkmk
Suggested Citation: Annual Estimates of the Resident Population: April 1, 2010 to July 1, 2015
Source: U.S. Census Bureau, Population Division Release Dates: For the United States, regions, divisions, states, and Puerto Rico Commonwealth, December 2015. For counties, municipios, metropolitan statistical areas, micropolitan statistical areas,
metropolitan divisions, and combined statistical areas, March 2016. For Cities and Towns (Incorporated Places and Minor Civil Divisions), May 2016.
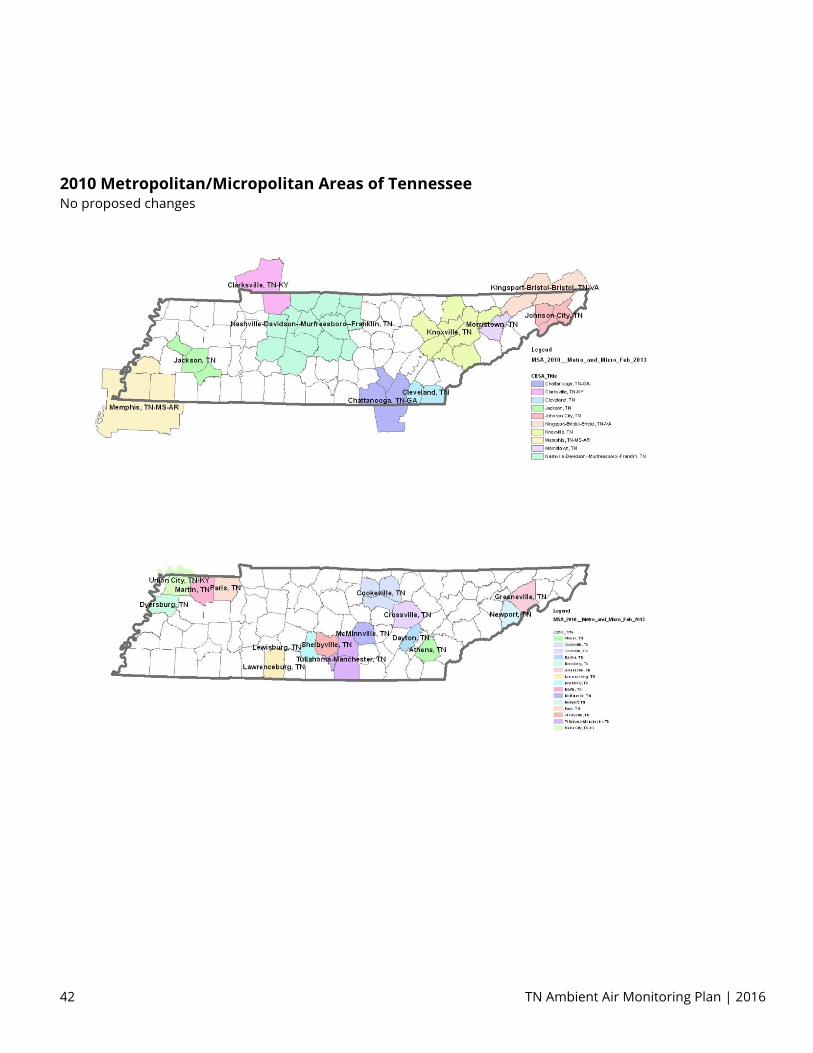
42 TN Ambient Air Monitoring Plan | 2016
2010 Metropolitan/Micropolitan Areas of Tennessee No proposed changes

43 TN Ambient Air Monitoring Plan | 2016
TAPC Monitoring Equipment Evaluation 2016 AMP Field Sites
Site Monitor Chart Recorder Data Logger Calibrator Shelter
Model Condition Model Condition Model Condition Model Condition Model Condition Blountville Teledyne 400A Good L&N Good ESC8832 Good Teledyne T703 Good T&R 8X20 Good Blountville API 400A Good ESC8832 Good Teledyne T703 New Kingsport Teledyne 400e Good L&N Good ESC8832 Good Teledyne T703 New x Good Kingsport ESC8832 Good Dasibi (spare) Cookeville R&P 2025 Good Streamline Pro Good Freel’s Bend API 400A Good L&N Poor ESC8832 Good Teledyne T703 New 820 Good Freel’s Bend ESC8832 Good(spare) Freel’s Bend Teledyne M100E New E&A Poor Teledyne T700 New New Market API 400E Good L&N Good ESC8832 Good Teledyne T703 New 820 Good New Market ESC8832 Good(spare) Loudon Pope R&P 2025 Good Streamline Pro Loudon Pope ATEC2200 Poor Good
Loudon MS at Pope (O3)
Teledyne 400e Good EA Good ESC8832 Good Teledyne T703 New 818 Good ESC 8832 Good(spare)
Kingsport R&P 2025 Good Streamline Pro Good Kingsport TEOM1400a Good ESC8832 Good ESC 8832(spare) Bristol Hivol Good Bristol Hivol Good Kit #9 Good Clarksville TEOM1400a Good ESC 8816 Good 432SP Good Clarksville Thermo 2025 Good
Clarksville MetOne BAM1022 New
Centerhill MIC AUC Good ESC 8816 Good
Centerhill Climatronics 101156-GO Good
Cedars of Leb TEI49C Good E&A Poor ESC8832 Good Teledyne 703E Good Trailer Good Cedars of Leb ESC8832 Good Dyersburg R&P 2025 Good Dyersburg TEOM 1400a Good ESC 8816 TEOM 432SP
Hendersonville TEI49C Good Westronics 4000 Good ESC8832 Good Teledyne 703E Good Trailer Good
Hendersonville ESC8832 Good(spare) Hendersonville R&P 2025 Good Hendersonville R&P 2025 Good Hendersonville TEOM1400a Good
Hendersonville MetOne BAM1022 New
Jackson R&P 2025 Good Jackson R&P 2025 Good Jackson TEOM1400a Good ESC 8816 Good 432SP Good Maryville R&P 2025 Good Maryville TEOM1400a Good ESC 8816 Good Streamline Pro Good TEOM 432SP Good Fairview TEI49C Good L&N Good ESC8832 Good Teledyne T703 New T&R Custom Good
Fairview ESC8832 Good (spare)
Columbia R&P 2025 Good Streamline Pro Lawrence R&P 2025 Good Lawrence TEOM1400a Good ESC 8816 Good 432SP Good Athens R&P 2025 Good Streamline Pro Good Athens TEOM1400a Good ESC8832 Good 4325P Good Harriman R&P 2025 Good Harriman TEOM1400a Good ESC 8816 Good x Good Hatchie Refuge x Poor

44 TN Ambient Air Monitoring Plan | 2016
TAPC Monitoring Equipment Evaluation 2016 AMP In Storage
Site Monitor Chart Recorder Data Logger Calibrator Shelter Model Condition Model Condition Model Condition Model Condition Model Condition
NFO Storage and QA Climatronics Sonic Good CS CR200 Good Dasisbi 1008PC Poor
NFO Storage and QA TEOM 1400a Poor ESC8816 Poor Dasisbi 1008PC Poor NFO Storage and QA TEOM 1400a Good ESC8816 Poor Dasisbi 1008PC Poor NFO Storage and QA TEOM 1400a Good ESC8816 Poor Dasisbi 1008PC Poor NFO Storage and QA TEOM 1400a Good ESC8816 Poor Dasisbi 1008PC Poor NFO Storage and QA TEOM 1400a Good ESC8816 Poor Dasisbi 1008PC Poor NFO Storage and QA TEOM 1400a Good ESC8816 Good Dasisbi 1008PC Poor NFO Storage and QA MetOne SASS New ESC8832 Good Dasisbi 1008PC Poor NFO Storage and QA MetOne SASS Poor ESC8832 Good Dasisbi 1008PC Poor NFO Storage and QA MetOne SASS Good ESC8832 Good Dasisbi 1008PC Poor NFO Storage and QA MetOne SASS Good ESC8832 Good Dasisbi 1008PC Poor NFO Storage and QA MetOne SASS Good ESC8816 Poor Dasisbi 1008PC Poor NFO Storage and QA URG3000N Good ESC8816 Good Dasisbi 1008PC Poor NFO Storage and QA URG3000N Good ESC8816 Good NFO Storage and QA R&P 2025 Poor ESC8816 Good Teledyne 703E Good NFO Storage and QA R&P 2025 Poor ESC8816 Good Teledyne 703E Good NFO Storage and QA R&P 2025 Poor ESC8816 Good Teledyne T703 New NFO Storage and QA R&P 2025 Poor ESC8816 Good Teledyne T700 Good NFO Storage and QA R&P 2025 Good ESC8816 Good Teledyne T700 Good NFO Storage and QA R&P 2025 Good ESC8832 Good Teledyne T700 Good NFO Storage and QA R&P 2025 Poor Environics 100 Poor
NFO Storage and QA R&P 2025 Poor Agilaire 8872 New TEI 146 Poor
NFO Storage and QA R&P 2025 Poor Agilaire 8872 New GMW 76-100 Good
NFO Storage and QA R&P 2025 Poor Agilaire 8872 New GMW 76-100 Good
NFO Storage and QA Agilaire 8872 New GMW 76-100 Good
NFO Storage and QA Agilaire 8872 New GMW 76-100 Good
NFO Storage and QA MetOne BAM 1020 Good
Agilaire 8872 New GMW 76-100 Good
NFO Storage and QA MetOne BAM 1020 Good
Agilaire 8872 New GMW 76-100 Good
NFO Storage and QA MetOne BAM 1020 Good
Agilaire 8872 New GMW 76-100 Good
NFO Storage and QA MetOne BAM 1020 Good
Agilaire 8872 New GMW 2000 Good
NFO Storage and QA MetOne BAM 1020 Good
Agilaire 8872 New Streamline Pro Good
NFO Storage and QA MetOne BAM 1020 Good Streamline Pro Good
NFO Storage and QA MetOne BAM 1020 Good Streamline Pro Good
NFO Storage and QA MetOne BAM 1022 New Streamline Pro Good
NFO Storage and QA MetOne BAM 1022 New Streamline Pro Good
NFO Storage and QA MetOne BAM 1022 New Streamline Pro Good
NFO Storage and QA MetOne BAM 1022 New Streamline Pro Good
NFO Storage and QA MetOne BAM 1022 New Tetracal Good
NFO Storage and QA MetOne BAM 1022 New Tetracal Good
NFO Storage and QA MetOne BAM 1022 New Streamline Pro New

45 TN Ambient Air Monitoring Plan | 2016
Site Monitor Chart Recorder Data Logger Calibrator Shelter Model Condition Model Condition Model Condition Model Condition Model Condition
NFO Storage and QA MetOne BAM 1022 New Streamline Pro New
NFO Storage and QA MetOne BAM 1022 New Streamline Pro New
NFO Storage and QA MetOne BAM 1022 New
Roots meter 5M125TC Good
NFO Storage and QA TEI49C Good BGI Orifice Good NFO Storage and QA TEI 49C Good BGI Orifice Good NFO Storage and QA TEI 49C Good BGI Orifice Good NFO Storage and QA TEI49C Good Orifice Good NFO Storage and QA TEI 49i Good Buck M-5 Good
NFO Storage and QA API 400E Good BIOS DryCal DC-1B Rev 2.06F Poor
NFO Storage and QA API 400A Poor
NFO Storage and QA API 400A Good Environics Calibrator Poor
NFO Storage and QA API 400A Poor Environics Calibrator Poor
NFO Storage and QA API 400A Poor Environics Calibrator Poor
NFO Storage and QA Teledyne API T400 Good Dasibi Calibrator Poor
NFO Storage and QA Teledyne API T400 Good
Bios Drycal flow meter Poor
NFO Storage and QA Teledyne API T400 Good Dasibi Calibrator Poor
NFO Storage and QA Teledyne API T400 Good Dasibi Calibrator Poor
NFO Storage and QA Teledyne API T400 Good Dasibi Calibrator Poor
NFO Storage and QA Teledyne API T400 Good Roots Meter Good
NFO Storage and QA Teledyne API T400 Good Sierra Cal Bench Good
NFO Storage and QA Teledyne M100E Good Teledyne 703E Good NFO Storage and QA Teledyne M100E Good
NFO Storage and QA Teledyne M100E Good Environics Calibrator 6103S Good
NFO Storage and QA Tisch Housing Good TEI 49i (ref phometer Good
NFO Storage and QA Tisch Housing Good TEI 49i (ref phometer Good
NFO Storage and QA Tisch Housing Good Teledyne T750U New NFO Storage and QA GMW Housing Good Teledyne T750U New NFO Storage and QA GMW Housing Good Streamline Pro Good NFO Storage and QA GMW Housing Good Streamline Pro Good
NFO Storage and QA GMW Housing Good Streamline Pro Good
shelter (from EV) Good
NFO Storage and QA Anderson 2000 Good BGI TetraCal Good
Shelter (from Copper HIll)
NFO Storage and QA Graseby Good BGI TetraCal Good
shelter (from CT) Good
NFO Storage and QA Graseby Good BGI Challenger Good
NFO Storage and QA Aircheck 224-PCXR7 Poor
NFO Storage and QA Aircheck 224-PCXR7 Poor
NFO Storage and QA Aircheck 224-PCXR7 Poor

46 TN Ambient Air Monitoring Plan | 2016
Tennessee Monitoring Site Agreement Letters
Kentucky

47 TN Ambient Air Monitoring Plan | 2016

48 TN Ambient Air Monitoring Plan | 2016

49 TN Ambient Air Monitoring Plan | 2016

50 TN Ambient Air Monitoring Plan | 2016
Virginia

51 TN Ambient Air Monitoring Plan | 2016

52 TN Ambient Air Monitoring Plan | 2016
Sections of the CFR Referred to in the 2016 NMP
§ 58.10 Annual monitoring network plan and periodic network assessment.
(a)(1) Beginning July 1, 2007, the state, or where applicable local, agency shall submit to the Regional
Administrator an annual monitoring network plan which shall provide for the documentation of the establishment
and maintenance of an air quality surveillance system that consists of a network of SLAMS monitoring stations
that can include FRM, FEM, and ARM monitors that are part of SLAMS, NCore, CSN, PAMS, and SPM stations. The
plan shall include a statement of whether the operation of each monitor meets the requirements of appendices A,
B, C, D, and E of this part, where applicable. The Regional Administrator may require additional information in
support of this statement. The annual monitoring network plan must be made available for public inspection and
comment for at least 30 days prior to submission to the EPA and the submitted plan shall include and address, as
appropriate, any received comments.
(2) Any annual monitoring network plan that proposes network modifications (including new or discontinued
monitoring sites, new determinations that data are not of sufficient quality to be compared to the NAAQS, and
changes in identification of monitors as suitable or not suitable for comparison against the annual PM2.5 NAAQS)
to SLAMS networks is subject to the approval of the EPA Regional Administrator, who shall approve or disapprove
the plan within 120 days of submission of a complete plan to the EPA.
(3) The plan for establishing required NCore multipollutant stations shall be submitted to the Administrator not
later than July 1, 2009. The plan shall provide for all required stations to be operational by January 1, 2011.
(4) A plan for establishing source-oriented Pb monitoring sites in accordance with the requirements of appendix D
to this part for Pb sources emitting 1.0 tpy or greater shall be submitted to the EPA Regional Administrator no
later than July 1, 2009, as part of the annual network plan required in paragraph (a)(1) of this section. The plan
shall provide for the required source-oriented Pb monitoring sites for Pb sources emitting 1.0 tpy or greater to be
operational by January 1, 2010. A plan for establishing source-oriented Pb monitoring sites in accordance with the
requirements of appendix D to this part for Pb sources emitting equal to or greater than 0.50 tpy but less than 1.0
tpy shall be submitted to the EPA Regional Administrator no later than July 1, 2011. The plan shall provide for the
required source-oriented Pb monitoring sites for Pb sources emitting equal to or greater than 0.50 tpy but less
than 1.0 tpy to be operational by December 27, 2011.
(5)(i) A plan for establishing or identifying an area-wide NO2 monitor, in accordance with the requirements of
Appendix D, section 4.3.3 to this part, shall be submitted as part of the Annual Monitoring Network Plan to the
EPA Regional Administrator by July 1, 2012. The plan shall provide for these required monitors to be operational
by January 1, 2013.
(ii) A plan for establishing or identifying any NO2 monitor intended to characterize vulnerable and susceptible
populations, as required in Appendix D, section 4.3.4 to this part, shall be submitted as part of the Annual
Monitoring Network Plan to the EPA Regional Administrator by July 1, 2012. The plan shall provide for these
required monitors to be operational by January 1, 2013.
(iii) A plan for establishing a single near-road NO2 monitor in CBSAs having 1,000,000 or more persons, in
accordance with the requirements of Appendix D, section 4.3.2 to this part, shall be submitted as part of the
Annual Monitoring Network Plan to the EPA Regional Administrator by July 1, 2013. The plan shall provide for
these required monitors to be operational by January 1, 2014.
(iv) A plan for establishing a second near-road NO2 monitor in any CBSA with a population of 2,500,000 or more
persons, or a second monitor in any CBSA with a population of 500,000 or more persons that has one or more

53 TN Ambient Air Monitoring Plan | 2016
roadway segments with 250,000 or greater AADT counts, in accordance with the requirements of Appendix D,
section 4.3.2 to this part, shall be submitted as part of the Annual Monitoring Network Plan to the EPA Regional
Administrator by July 1, 2014. The plan shall provide for these required monitors to be operational by January 1,
2015.
(v) A plan for establishing a single near-road NO2 monitor in all CBSAs having 500,000 or more persons, but less
than 1,000,000, not already required by paragraph (a)(5)(iv) of this section, in accordance with the requirements of
Appendix D, section 4.3.2 to this part, shall be submitted as part of the Annual Monitoring Network Plan to the
EPA Regional Administrator by July 1, 2016. The plan shall provide for these monitors to be operational by January
1, 2017.
(6) A plan for establishing SO2 monitoring sites in accordance with the requirements of appendix D to this part
shall be submitted to the EPA Regional Administrator by July 1, 2011 as part of the annual network plan required
in paragraph (a) (1). The plan shall provide for all required SO2 monitoring sites to be operational by January 1,
2013.
(7) A plan for establishing CO monitoring sites in accordance with the requirements of appendix D to this part
shall be submitted to the EPA Regional Administrator. Plans for required CO monitors shall be submitted at least
six months prior to the date such monitors must be established as required by section 58.13.
(8)(i) A plan for establishing near-road PM2.5 monitoring sites in CBSAs having 2.5 million or more persons, in
accordance with the requirements of appendix D to this part, shall be submitted as part of the annual monitoring
network plan to the EPA Regional Administrator by July 1, 2014. The plan shall provide for these required
monitoring stations to be operational by January 1, 2015.
(ii) A plan for establishing near-road PM2.5 monitoring sites in CBSAs having 1 million or more persons, but less
than 2.5 million persons, in accordance with the requirements of appendix D to this part, shall be submitted as
part of the annual monitoring network plan to the EPA Regional Administrator by July 1, 2016. The plan shall
provide for these required monitoring stations to be operational by January 1, 2017.
(9) The annual monitoring network plan shall provide for the required O3 sites to be operating on the first day of
the applicable required O3 monitoring season in effect on January 1, 2017 as listed in Table D-3 of appendix D of
this part.
(10) A plan for making Photochemical Assessment Monitoring Stations (PAMS) measurements, if applicable, in
accordance with the requirements of appendix D paragraph 5(a) of this part shall be submitted to the EPA
Regional Administrator no later than July 1, 2018. The plan shall provide for the required PAMS measurements to
begin by June 1, 2019.
(11) An Enhanced Monitoring Plan for O3, if applicable, in accordance with the requirements of appendix D
paragraph 5(h) of this part shall be submitted to the EPA Regional Administrator no later than October 1, 2019 or
two years following the effective date of a designation to a classification of Moderate or above O3 nonattainment,
whichever is later.
(12) A detailed description of the PAMS network being operated in accordance with the requirements of appendix
D to this part shall be submitted as part of the annual monitoring network plan for review by the EPA
Administrator. The PAMS Network Description described in section 5 of appendix D may be used to meet this
requirement.

54 TN Ambient Air Monitoring Plan | 2016
(b) The annual monitoring network plan must contain the following information for each existing and proposed
site:
(1) The AQS site identification number.
(2) The location, including street address and geographical coordinates.
(3) The sampling and analysis method(s) for each measured parameter.
(4) The operating schedules for each monitor.
(5) Any proposals to remove or move a monitoring station within a period of 18 months following plan submittal.
(6) The monitoring objective and spatial scale of representativeness for each monitor as defined in appendix D to
this part.
(7) The identification of any sites that are suitable and sites that are not suitable for comparison against the
annual PM2.5 NAAQS as described in §58.30.
(8) The MSA, CBSA, CSA or other area represented by the monitor.
(9) The designation of any Pb monitors as either source-oriented or non-source-oriented according to Appendix D
to 40 CFR part 58.
(10) Any source-oriented monitors for which a waiver has been requested or granted by the EPA Regional
Administrator as allowed for under paragraph 4.5(a)(ii) of Appendix D to 40 CFR part 58.
(11) Any source-oriented or non-source-oriented site for which a waiver has been requested or granted by the
EPA Regional Administrator for the use of Pb-PM10 monitoring in lieu of Pb-TSP monitoring as allowed for under
paragraph 2.10 of Appendix C to 40 CFR part 58.
(12) The identification of required NO2 monitors as near-road, area-wide, or vulnerable and susceptible
population monitors in accordance with Appendix D, section 4.3 of this part.
(13) The identification of any PM2.5 FEMs and/or ARMs used in the monitoring agency's network where the data
are not of sufficient quality such that data are not to be compared to the NAAQS. For required SLAMS where the
agency identifies that the PM2.5 Class III FEM or ARM does not produce data of sufficient quality for comparison to
the NAAQS, the monitoring agency must ensure that an operating FRM or filter-based FEM meeting the sample
frequency requirements described in §58.12 or other Class III PM2.5 FEM or ARM with data of sufficient quality is
operating and reporting data to meet the network design criteria described in appendix D to this part.
(c) The annual monitoring network plan must document how state and local agencies provide for the review of
changes to a PM2.5 monitoring network that impact the location of a violating PM2.5 monitor. The affected state or
local agency must document the process for obtaining public comment and include any comments received
through the public notification process within their submitted plan.
(d) The state, or where applicable local, agency shall perform and submit to the EPA Regional Administrator an
assessment of the air quality surveillance system every 5 years to determine, at a minimum, if the network meets
the monitoring objectives defined in appendix D to this part, whether new sites are needed, whether existing sites
are no longer needed and can be terminated, and whether new technologies are appropriate for incorporation

55 TN Ambient Air Monitoring Plan | 2016
into the ambient air monitoring network. The network assessment must consider the ability of existing and
proposed sites to support air quality characterization for areas with relatively high populations of susceptible
individuals (e.g., children with asthma), and, for any sites that are being proposed for discontinuance, the effect
on data users other than the agency itself, such as nearby states and tribes or health effects studies. The state, or
where applicable local, agency must submit a copy of this 5-year assessment, along with a revised annual network
plan, to the Regional Administrator. The assessments are due every five years beginning July 1, 2010.
(e) All proposed additions and discontinuations of SLAMS monitors in annual monitoring network plans and
periodic network assessments are subject to approval according to §58.14.
[71 FR 61298, Oct. 17, 2006, as amended at 72 FR 32210, June 12, 2007; 73 FR 67059, Nov. 12, 2008; 73 FR 77517,
Dec. 19, 2008; 75 FR 6534, Feb. 9, 2010; 75 FR 35601, June 22, 2010; 75 FR 81137, Dec. 27, 2010; 76 FR 54341, Aug.
31, 2011; 78 FR 16188, Mar. 14, 2013; 78 FR 3282, Jan. 15, 2013; 80 FR 65466, Oct. 26, 2015; 81 FR 17279, Mar. 28,
2016]

56 TN Ambient Air Monitoring Plan | 2016
Ozone Monitoring Network Requirements
40 CFR 58 Subpart G, Appendix D to Part 58 Revised as of July 1, 2014
TABLE D–2 OF APPENDIX D TO PART 58 SLAMS MINIMUM O3 MONITORING REQUIREMENTS
MSA population1, 2
Most recent 3-year design value
concentrations ≥85% of any O3
NAAQS3
Most recent 3-year design value
concentrations <85% of any O3
NAAQS3,4
>10 million 4 2
4–10 million 3 1
350,000–<4 million 2 1
50,000–<350,000 5
1 0
1. Minimum monitoring requirements apply to the Metropolitan statistical area (MSA).
2. Population based on latest available census figures.
3. The ozone (O3) National Ambient Air Quality Standards (NAAQS) levels and forms are defined in 40 CFR part 50.
4. These minimum monitoring requirements apply in the absence of a design value.
5. Metropolitan statistical areas (MSA) must contain an urbanized area of 50,000 or more population.
CO Monitoring Network Requirements
40 CFR 58 Subpart G, Appendix D to Part 58 Revised as of July 1, 2014
4.2 Carbon Monoxide (CO) Design Criteria.
4.2.1 General Requirements. (a) Except as provided in subsection (b), one CO monitor is required to operate
collocated with one required near-road NO2 monitor, as required in Section 4.3.2 of this part, in CBSAs having a
population of 1,000,000 or more persons. If a CBSA has more than one required near-road NO2 monitor, only one
CO monitor is required to be collocated with a near-road NO2 monitor within that CBSA.
(b) If a state provides quantitative evidence demonstrating that peak ambient CO concentrations would occur in a
near-road location which meets microscale siting criteria in Appendix E of this part but is not a near-road
NO2 monitoring site, then the EPA Regional Administrator may approve a request by a state to use such an
alternate near-road location for a CO monitor in place of collocating a monitor at near-road NO2 monitoring site.
4.2.2 Regional Administrator Required Monitoring. (a) The Regional Administrators, in collaboration with states,
may require additional CO monitors above the minimum number of monitors required in 4.2.1 of this part, where
the minimum monitoring requirements are not sufficient to meet monitoring objectives. The Regional
Administrator may require, at his/her discretion, additional monitors in situations where data or other
information suggest that CO concentrations may be approaching or exceeding the NAAQS. Such situations
include, but are not limited to, (1) characterizing impacts on ground-level concentrations due to stationary CO
sources, (2) characterizing CO concentrations in downtown areas or urban street canyons, and (3) characterizing
CO concentrations in areas that are subject to high ground level CO concentrations particularly due to or
enhanced by topographical and meteorological impacts. The Regional Administrator and the responsible State or
local air monitoring agency shall work together to design and maintain the most appropriate CO network to
address the data needs for an area, and include all monitors under this provision in the annual monitoring
network plan.

57 TN Ambient Air Monitoring Plan | 2016
NO2 Monitoring Network Requirements
40 CFR 58 Subpart G, Appendix D to Part 58 Revised as of July 1, 2014
4.3.2 Requirement for Near-road NO2 Monitors
(a) Within the NO2 network, there must be one microscale near-road NO2 monitoring station in each CBSA with a
population of 500,000 or more persons to monitor a location of expected maximum hourly concentrations sited
near a major road with high AADT counts as specified in paragraph 4.3.2(a)(1) of this appendix. An additional
near-road NO2monitoring station is required for any CBSA with a population of 2,500,000 persons or more, or in
any CBSA with a population of 500,000 or more persons that has one or more roadway segments with 250,000 or
greater AADT counts to monitor a second location of expected maximum hourly concentrations. CBSA
populations shall be based on the latest available census figures.
(1) The near-road NO2 monitoring stations shall be selected by ranking all road segments within a CBSA by AADT
and then identifying a location or locations adjacent to those highest ranked road segments, considering fleet mix,
roadway design, congestion patterns, terrain, and meteorology, where maximum hourly NO2 concentrations are
expected to occur and siting criteria can be met in accordance with appendix E of this part. Where a State or local
air monitoring agency identifies multiple acceptable candidate sites where maximum hourly NO2 concentrations
are expected to occur, the monitoring agency shall consider the potential for population exposure in the criteria
utilized to select the final site location. Where one CBSA is required to have two near-road NO2 monitoring
stations, the sites shall be differentiated from each other by one or more of the following factors: fleet mix;
congestion patterns; terrain; geographic area within the CBSA; or different route, interstate, or freeway
designation.
(b) Measurements at required near-road NO2 monitor sites utilizing chemiluminescence FRMs must include at a
minimum: NO, NO2, and NOX.
Originally, near –road monitoring sites were to be established and in operation by January 1, 2013. However, the
lack of funding has delayed the implementation of near-road monitoring requirements. The Memphis and
Nashville CBSA’s are now established and operational. The Knoxville and Chattanooga near-road sites may not be
funded by EPA until sometime in the future.
4.3.3 Requirement for Area-wide NO2 Monitoring
(a) Within the NO2 network, there must be one monitoring station in each CBSA with a population of 1,000,000 or
more persons to monitor a location of expected highest NO2 concentrations representing the neighborhood or
larger spatial scales. PAMS sites collecting NO2 data that are situated in an area of expected high
NO2 concentrations at the neighborhood or larger spatial scale may be used to satisfy this minimum monitoring
requirement when the NO2 monitor is operated year round. Emission inventories and meteorological analysis
should be used to identify the appropriate locations within a CBSA for locating required area-wide NO2 monitoring
stations. CBSA populations shall be based on the latest available census figures.
An area-wide NO2 monitoring site is required in each of the Memphis and Nashville CBSA’s. An area-wide NO2
monitoring site is currently in operation in the Nashville CBSA (Site 47-037-0011). Currently the State of Arkansas
operates an NO2 monitor at its Marion site (AQS 05-035-0005) which is in the Memphis CBSA.
SO2 Monitoring Network Requirements
40 CFR 58 Subpart G, Appendix D to Part 58 Revised as of July 1, 2014

58 TN Ambient Air Monitoring Plan | 2016
4.4 Sulfur Dioxide (SO2) Design Criteria.
4.4.1 General Requirements. (a) State and, where appropriate, local agencies must operate a minimum number of
required SO2 monitoring sites as described below.
4.4.2 Requirement for Monitoring by the Population Weighted Emissions Index. (a) The population weighted
emissions index (PWEI) shall be calculated by States for each core based statistical area (CBSA) they contain or
share with another State or States for use in the implementation of or adjustment to the SO2 monitoring network.
The PWEI shall be calculated by multiplying the population of each CBSA, using the most current census data or
estimates, and the total amount of SO2 in tons per year emitted within the CBSA area, using an aggregate of the
most recent county level emissions data available in the National Emissions Inventory for each county in each
CBSA. The resulting product shall be divided by one million, providing a PWEI value, the units of which are million
persons-tons per year. For any CBSA with a calculated PWEI value equal to or greater than 1,000,000, a minimum
of three SO2 monitors are required within that CBSA. For any CBSA with a calculated PWEI value equal to or
greater than 100,000, but less than 1,000,000, a minimum of two SO2 monitors are required within that CBSA. For
any CBSA with a calculated PWEI value equal to or greater than 5,000, but less than 100,000, a minimum of one
SO2 monitor is required within that CBSA.
(1) The SO2 monitoring site(s) required as a result of the calculated PWEI in each CBSA shall satisfy minimum
monitoring requirements if the monitor is sited within the boundaries of the parent CBSA and is one of the
following site types (as defined in section 1.1.1 of this appendix): population exposure, highest concentration,
source impacts, general background, or regional transport. SO2 monitors at NCore stations may satisfy minimum
monitoring requirements if that monitor is located within a CBSA with minimally required monitors under this
part. Any monitor that is sited outside of a CBSA with minimum monitoring requirements to assess the highest
concentration resulting from the impact of significant sources or source categories existing within that CBSA shall
be allowed to count towards minimum monitoring requirements for that CBSA.
PWEI calculations were performed for CBSA’s in Tennessee based on emissions and populations listed in the
following table. Based on these calculations ambient sulfur dioxide monitors are required as listed in the table.
4.4.3 Regional Administrator Required Monitoring. (a) The Regional Administrator may require additional
SO2monitoring stations above the minimum number of monitors required in 4.4.2 of this part, where the
minimum monitoring requirements are not sufficient to meet monitoring objectives. The Regional Administrator
may require, at his/her discretion, additional monitors in situations where an area has the potential to have
concentrations that may violate or contribute to the violation of the NAAQS, in areas impacted by sources which
are not conducive to modeling, or in locations with susceptible and vulnerable populations, which are not
monitored under the minimum monitoring provisions described above. The Regional Administrator and the
PWEI
2010
PWEI
2011
PWEI
2012
PWEI
2013
PWEI
2014
PWEI
2015
Chattanooga, TN-GA 547776 953 503 508 512 516 519 522
Clarksville, TN-KY 281021 431 112 114 119 118 120 121
Cleveland, TN 120864 5 1 1 1 1 1 1
Jackson, TN 129682 154 20 20 20 20 20 20
Johnson City, TN 200648 4 1 1 1 1 1 1
Kingsport-Bristol-Bristol, TN-VA 307120 39082 12098 12080 12071 12051 12040 12003
Knoxville, TN 861424 28722 24057 24207 24351 24470 24632 24742
Memphis, TN-MS-AR 1344127 15025 19905 20025 20144 20159 20182 20195
Morristown, TN 116642 21 2 2 2 2 2 2
Nashville-Davidson--Murfreesboro--Franklin, TN 1830345 24560 41038 41710 42419 43191 44028 44954
FALSE
CBSA AREA NAME
POP
ESTIMATE
2015
2011 NEI
SO2 Total
CBSA
03232016
Using 2011 NEI Data 03/23/2016
SO2 Monitors
Required
1
FALSE
1
FALSE
FALSE
FALSE
FALSE
1
1

59 TN Ambient Air Monitoring Plan | 2016
responsible State or local air monitoring agency shall work together to design and/or maintain the most
appropriate SO2 network to provide sufficient data to meet monitoring objectives.
4.4.5 NCore Monitoring. (a) SO2 measurements are included within the NCore multipollutant site requirements as
described in paragraph (3)(b) of this appendix. NCore-based SO2 measurements are primarily used to characterize
SO2trends and assist in understanding SO2 transport across representative areas in urban or rural locations and
are also used for comparison with the SO2 NAAQS. SO2 monitors at NCore sites that exist in CBSAs with minimum
monitoring requirements per section 4.4.2 above shall be allowed to count towards those minimum monitoring
requirements.
Lead Monitoring Network Requirements
40 CFR 58 Subpart G, Appendix D to Part 58 Revised as of July 1, 2014
4.5 Lead (Pb) Design Criteria.
a) State and, where appropriate, local agencies are required to conduct ambient air Pb monitoring near Pb
sources which are expected to or have been shown to contribute to a maximum Pb concentration in ambient air
in excess of the NAAQS, taking into account the logistics and potential for population exposure. At a minimum,
there must be one source-oriented SLAMS site located to measure the maximum Pb concentration in ambient air
resulting from each non-airport Pb source which emits 0.50 or more tons per year and from each airport which
emits 1.0 or more tons per year based on either the most recent National Emission Inventory
(http://www.epa.gov/ttn/chief/eiinformation.html) or other scientifically justifiable methods and data (such as
improved emissions factors or site-specific data) taking into account logistics and the potential for population
exposure.
(i) One monitor may be used to meet the requirement in paragraph 4.5(a) for all sources involved when the
location of the maximum Pb concentration due to one Pb source is expected to also be impacted by Pb emissions
from a nearby source (or multiple sources). This monitor must be sited, taking into account logistics and the
potential for population exposure, where the Pb concentration from all sources combined is expected to be at its
maximum.
PM2.5 Monitoring Network Requirements
40 CFR 58 Subpart G, Appendix D to Part 58 Revised as of July 1, 2014
TABLE D–5 OF APPENDIX D TO PART 58 PM2.5 MINIMUM MONITORING REQUIREMENTS
MSA population1, 2
Most recent 3-
year design value
concentrations
≥85% of any
PM2.5 NAAQS3
Most recent 3-
year design
value
concentrations
<85% of any
PM2.5 NAAQS3,4
Continuous
PM2.5
Monitoring
PM2.5
Background
and Transport
Sites
PM2.5
Chemical
Speciation
Sites
>1,000,000 3 2 1 - 2 One site each
per state for
background
and transport.
Existing
STN
Required
Site(s)
500,000–1,000,000 2 1 1
50,000–<500,000 5
1 0 0 - 1
1 Minimum monitoring requirements apply to the Metropolitan statistical area (MSA).
2 Population based on latest available census figures.

60 TN Ambient Air Monitoring Plan | 2016
3 The PM2.5 National Ambient Air Quality Standards (NAAQS) levels and forms are defined in 40 CFR part 50.
4 These minimum monitoring requirements apply in the absence of a design value.
5 Metropolitan statistical areas (MSA) must contain an urbanized area of 50,000 or more population.
4.7.2 Requirement for Continuous PM2.5 Monitoring. The State, or where appropriate, local agencies must
operate continuous PM2.5 analyzers equal to at least one-half (round up) the minimum required sites listed in
Table D-5 of this appendix. At least one required continuous analyzer in each MSA must be collocated with one of
the required FRM/FEM/ARM monitors, unless at least one of the required FRM/FEM/ARM monitors is itself a
continuous FEM or ARM monitor in which case no collocation requirement applies. State and local air monitoring
agencies must use methodologies and quality assurance/quality control (QA/QC) procedures approved by the EPA
Regional Administrator for these required continuous analyzers.
4.7.3 Requirement for PM2.5 Background and Transport Sites. Each State shall install and operate at least one
PM2.5 site to monitor for regional background and at least one PM2.5 site to monitor regional transport. These
monitoring sites may be at community-oriented sites and this requirement may be satisfied by a corresponding
monitor in an area having similar air quality in another State. State and local air monitoring agencies must use
methodologies and QA/QC procedures approved by the EPA Regional Administrator for these sites. Methods used
at these sites may include non-federal reference method samplers such as IMPROVE or continuous
PM2.5 monitors.
4.7.4 PM2.5 Chemical Speciation Site Requirements. Each State shall continue to conduct chemical speciation
monitoring and analyses at sites designated to be part of the PM2.5 Speciation Trends Network (STN). The
selection and modification of these STN sites must be approved by the Administrator. The PM2.5 chemical
speciation urban trends sites shall include analysis for elements, selected anions and cations, and carbon.
Samples must be collected using the monitoring methods and the sampling schedules approved by the
Administrator. Chemical speciation is encouraged at additional sites where the chemically resolved data would be
useful in developing State implementation plans and supporting atmospheric or health effects related studies.
Index reporting requirements
40 CFR 58 Subpart F, 58.50 Revised as of July 1, 2014
58.50 Index reporting.
(a) The State or where applicable, local agency shall report to the general public on a daily basis through
prominent notice an air quality index that complies with the requirements of appendix G to this part.
(b) Reporting is required for all individual MSA with a population exceeding 350,000.
(c) The population of a MSA for purposes of index reporting is the most recent decennial U.S. census population.
Geographic area 2010
Census 2015
Census Est. Required to Have
AQI Reporting Daily AQI/Air Quality Forecasts
Provided
Chattanooga, TN-GA 528143 547776 Yes Yes
Clarksville, TN-KY 260625 281021 No Yes
Cleveland, TN 115788 120864 No No
Jackson, TN 130011 129682 No No
Johnson City, TN 198716 200648 No Yes Based on the combined population of both areas. Kingsport-Bristol-Bristol, TN-VA 309544 307120 No
Knoxville, TN 837571 861424 Yes Yes In addition, the GSMNP has a separate AQI/Forecast provided.
Memphis, TN-MS-AR 1324829 1344127 Yes Yes
Morristown, TN 113951 116642 No No
Nashville-Davidson--Murfreesboro, TN 1670890 1830345 Yes Yes

61 TN Ambient Air Monitoring Plan | 2016
NCore Monitoring Network Requirements and PM 10-2.5
40 CFR 58 Subpart G, Appendix D to Part 58 Revised as of July 1, 2014
(a) Each State (i.e. the fifty States, District of Columbia, Puerto Rico, and the Virgin Islands) is required to operate at
least one NCore site. States may delegate this requirement to a local agency. States with many MSAs often also
have multiple air sheds with unique characteristics and, often, elevated air pollution. These States include, at a
minimum, California, Florida, Illinois, Michigan, New York, North Carolina, Ohio, Pennsylvania, and Texas. These
States are required to identify one to two additional NCore sites in order to account for their unique situations.
These additional sites shall be located to avoid proximity to large emission sources. Any State or local agency can
propose additional candidate NCore sites or modifications to these requirements for approval by the
Administrator. The NCore locations should be leveraged with other multipollutant air monitoring sites including
PAMS sites, National Air Toxics Trends Stations (NATTS) sites, CASTNET sites, and STN sites. Site leveraging
includes using the same monitoring platform and equipment to meet the objectives of the variety of programs
where possible and advantageous.
(b) The NCore sites must measure, at a minimum, PM2.5 particle mass using continuous and integrated/filter-
based samplers, speciated PM2.5, PM10-2.5 particle mass, O3, SO2, CO, NO/NOY, wind speed, wind direction, relative
humidity, and ambient temperature.
(1) Although the measurement of NOy is required in support of a number of monitoring objectives, available
commercial instruments may indicate little difference in their measurement of NOy compared to the conventional
measurement of NOX, particularly in areas with relatively fresh sources of nitrogen emissions. Therefore, in areas
with negligible expected difference between NOy and NOX measured concentrations, the Administrator may allow
for waivers that permit NOX monitoring to be substituted for the required NOy monitoring at applicable NCore
sites.
(2) The EPA recognizes that, in some cases, the physical location of the NCore site may not be suitable for
representative meteorological measurements due to the site's physical surroundings. It is also possible that
nearby meteorological measurements may be able to fulfill this data need. In these cases, the requirement for
meteorological monitoring can be waived by the Administrator.
40 CFR 58 Subpart G, Appendix D to Part 58 Revised as of July 1, 2014
Coarse Particulate Matter (PM10-2.5) Design Criteria.
4.8.1 General Monitoring Requirements.
The only required monitors for PM10-2.5 are those required at NCore Stations.

62 TN Ambient Air Monitoring Plan | 2016
NCore Look Rock Monitoring Site
Air quality monitoring at the Look Rock monitoring site has a long history dating at least back to about 1980.
Monitoring at this site has been a joint effort of the National Park Service (NPS), EPA and the State of Tennessee.
Siting
The coordinates are:
Latitude + 35.6334N
Longitude -83.9416W
Elevation 801 Meters.
Site is approved by the EPA as a rural NCore site.
Monitoring Objective
Determine compliance with NAAQS; observe pollution trends for national data analysis, provide pollution levels
for daily index reporting; and provide date for scientific studies.
Quality Assurance
All Quality Assurance procedures shall be implemented in accordance with 40 CFR 58, Appendix A.
Area of Representativeness
40 CFR Part 58 Appendix D provides design criteria for ambient air monitoring. In the case of urban NCore the
spatial scales to be used are neighborhood and urban. Because the Look Rock site is located in a pristine high
elevation area, it is understood that the site is ideally suited for both background and transport related
measurements..
Spatial Scales for Each Pollutant
Generally regional scale.
Need For Additional Resources
All parties agree that the collaboration between the National Park Service, EPA and the State of Tennessee at the
Look Rock sampling site has produced an extraordinarily diverse and in-depth air quality record and that the bulk
of this data set has been validated and reported to the U.S. EPA AQS repository. However, under the present
piecemeal funding by the various agencies, there is no assurance that this will continue at the site for the longer
term needed for monitoring compliance with the PM NAAQS and with the regional haze rule (RHR). What is
needed is a long-term commitment by EPA to coordinate the operation of this and other sites to maintain quality
and relevance in the NCore network over the long term. This commitment should commence by the 2011 time
frame when NCore sites are expected to become fully operational.
EPA has agreed to provide support and funding to continue the operation of the NCore site. This is the final
equipment list currently in place at the site.

63 TN Ambient Air Monitoring Plan | 2016
Air Monitoring Equipment at Look Rock
POLLUTANT INSTRUMENT
ANALYSIS METHOD SAMPLING REPORTING
FREQ
AQS CODE
PARA METER CODE
POC REP ORD
CODE
DATE SAMPLING
BEGAN MONITOR
SAMPLING INSTRUMENT NAME AND
DESIGNATION
FED AGENCY
Type Comment Sulfur Dioxide (SO2) trace-level
Pulsed fluorescence Continuous/1hr 47-029-
101 42401 2 745 20070401
Special Purpose
Ncore Thermo SO2 47i TLE EQSA-0436-060
NPS
Carbon Monoxide (CO)
Trace-level NDIR-GFC
Continuous/1hr 47-029-
101 42102 2 745 20070401
Special Purpose
Ncore Thermo CO 48i TLE RFNA-0981-054
NPS
Nitrogen oxide (NO) trace-level
Chemilumenescence with molybdenum convertor
Continuous/1hr 47-029-
101 42601 2 745 20070401
Special Purpose
Ncore Thermo NO2/NOy 42c TLE RFNA1289-074
NPS
Total reactive nitrogen (NOy) trace-level
Chemilumenescence with molybdenum convertor
Continuous/1hr 47-029-
101 42603 2 745 20070401
Special Purpose
Ncore Thermo NO2/NOy 42c TLE RFNA1289-074
NPS
Nitrogen dioxide (NO2) trace-level
Chemilumenescence with molybdenum convertor
Continuous/1hr 47-029-
101 42412 1 745 20070401
Special Purpose
Ncore Thermo NO2/NOy 42c TLE RFNA1289-074
NPS
Nitrogen dioxide (NO2) trace-level
Cavity attenuated phase shift
Continuous/1hr 47-029-
101 42202 1 745 20141102
Special Purpose
Ncore Teledyne NO2 T500U CAS
NPS
Calibrator NA Daily NA NA NA NA 20070401 NA NA Thermo Model 146c TVA
Zero Air Supply NA NA NA NA NA NA 20070401 NA NA Thermo 111 TVA
Telemetry-Data Logger
NA 1 minute/ 1 hour
NA NA NA NA 20070401 NA NA ESC 8832 TVA

64 TN Ambient Air Monitoring Plan | 2016
Proposed Clarksville PM2.5 Site Information
Site Information
Existing Site 47-125-1009
The following proposed siting information supplements the supporting documentation section immediately
following this table. Where applicable, the section from 40CFR58 is included.
§58.10 (a)(1) A statement of purposes for each monitor
The existing Clarksville site (Golf Club Lane) is located upwind from the Clarksville, TN-KY MSA area. The site is suitable for use to meet the MSA monitoring requirements for PM2.5 for both Tennessee and Kentucky. The site is part of the state PM2.5 network and began monitoring in January 1998. The monitors at the existing site are located on an elevated platform. The removal of the elevated platform for safety related concerns will leave the existing site not meeting EPA air monitoring siting criteria. The monitors will be placed at ground level at the proposed new site (Paradise Hill Road). PM2.5 monitoring will be discontinued at the existing site when monitoring begins at the proposed relocated site.
Site photos facing from the site in each direction (N, S, E, W)
See photographs for general site information in the next sections. Photographs for the current Clarksville site and proposed relocated site are included.
Applicable measurements to any obstructions or trees
See measurement graphic provided in the next sections. The nearest obstruction is over 13 meters away (building north of proposed site) and the obstruction height is 3 meters est. height. The next closest obstruction (trees on other side of Paradise Hill Road) is over 30 meters away and the obstruction height is 12 meters est. height. The nearest roadway is 18 meters away (Paradise Hill Road).
Estimated PM2.5 inlets height for the site.
The PM2.5 inlet heights will be > 2 meters.
§58.10 (b) (1) The AQS site identification number. The AQS ID for this site is: 47-125-1009. The existing site is located at 1514-C Golf Club Lane. The proposed relocation site (Paradise Hill Road) is about 325 meters SW of the existing site.
(2) The location, including street address and geographical coordinates.
The current Clarksville site, 1514-C Golf Club Lane, Clarksville, TN 37040, Lat. 36.514627, Long.-87.328041, Elev. 535 to 540 ft. Proposed new Clarksville site, Paradise Hill Road, Clarksville, TN 37040, Lat. 36.512856, Long. -87.331045, Elev. 535 to 540 ft.
(3) The sampling and analysis method(s) for each measured parameter.
PM2.5 - Thermo Scientific Partisol®-Plus 2025 Sequential PM2.5 Air Sampler, Manual Reference Method: RFPS-0498-118 Continuous Ambient Particulate TEOM, Series 1400a.

65 TN Ambient Air Monitoring Plan | 2016
Met one BAM 1022 (FEM)
(4) The operating schedules for each monitor.
The TEOM monitor will operate continuously collecting 1 minute and hourly PM2.5 data. The single PM2.5 monitor will operate on the standard every day and will convert to operating on the 1 in 3 day national schedule when approved by EPA. The BAM will operate continuously collecting minute and hourly data.
(5) Any proposals to remove or move a monitoring station within a period of 18 months following plan submittal.
This is an existing site and is planned to operate for at least 3 years when approved.
(6) The monitoring objective and spatial scale of representativeness for each monitor as defined in appendix D to this part.
Monitoring objective: NAAQS Compliance Spatial Scale: Neighborhood scale—Defines concentrations within some extended area of the city that has relatively uniform land use with dimensions in the 0.5 to 4.0 kilometers range. Site type: population exposure. The non-reference continuous PM2.5 TEOM monitor is used for PM2.5 AQI forecasting.
(7) The identification of any sites that are suitable and sites that is not suitable for comparison against the “Ozone and PM2.5 NAAQS”.
The proposed site will be suitable for comparison to the PM2.5 NAAQS. This site will be a SLAMs or SLAMs equivalent site.
(8) The MSA, CBSA, CSA or other area represented by the monitor.
The site is located in the Clarksville TN-KY CBSA #17300.

66 TN Ambient Air Monitoring Plan | 2016
§58.10 (a)(1) Site photos facing from the site in each direction (N, S, E, W)
Existing site location at 1514-C Golf Club Lane, Clarksville, TN.
View of the current site from the north (Mar 2016) Looking north from site (Mar 2016)
View of the current site from the south (Mar 2016) Looking south from site (Mar 2016)
View of the current site from the east (Mar 2016) Looking east from site (Mar 2016)

67 TN Ambient Air Monitoring Plan | 2016
View of the current site from the west (Mar 2016) Looking west from site (Mar 2016)

68 TN Ambient Air Monitoring Plan | 2016
Proposed new site located at Paradise Hill Road, Clarksville, TN
Looking north from site (Mar 2016) Looking south from site (Mar 2016)
Looking south from site (Mar 2016) Looking west from site (Mar 2016)
Looking west from the site (Mar 2016) Looking east from the site (Mar 2016)

69 TN Ambient Air Monitoring Plan | 2016
Looking east from site
§58.10 (a)(1) Applicable measurements to any obstructions or trees

70 TN Ambient Air Monitoring Plan | 2016
PM2.5 Monitoring Site in Clarksville, TN
Location of current site and proposed new site.

71 TN Ambient Air Monitoring Plan | 2016
The following wind rose is presented to establish the representative wind directions based upon the Clarksville
station located at Clarksville Outlaw Field Airport.
5-Year Winds

72 TN Ambient Air Monitoring Plan | 2016
1-Year Winds (Most recent)

73 TN Ambient Air Monitoring Plan | 2016
EPA Approval Letter for the Loudon Pope Monitoring Site
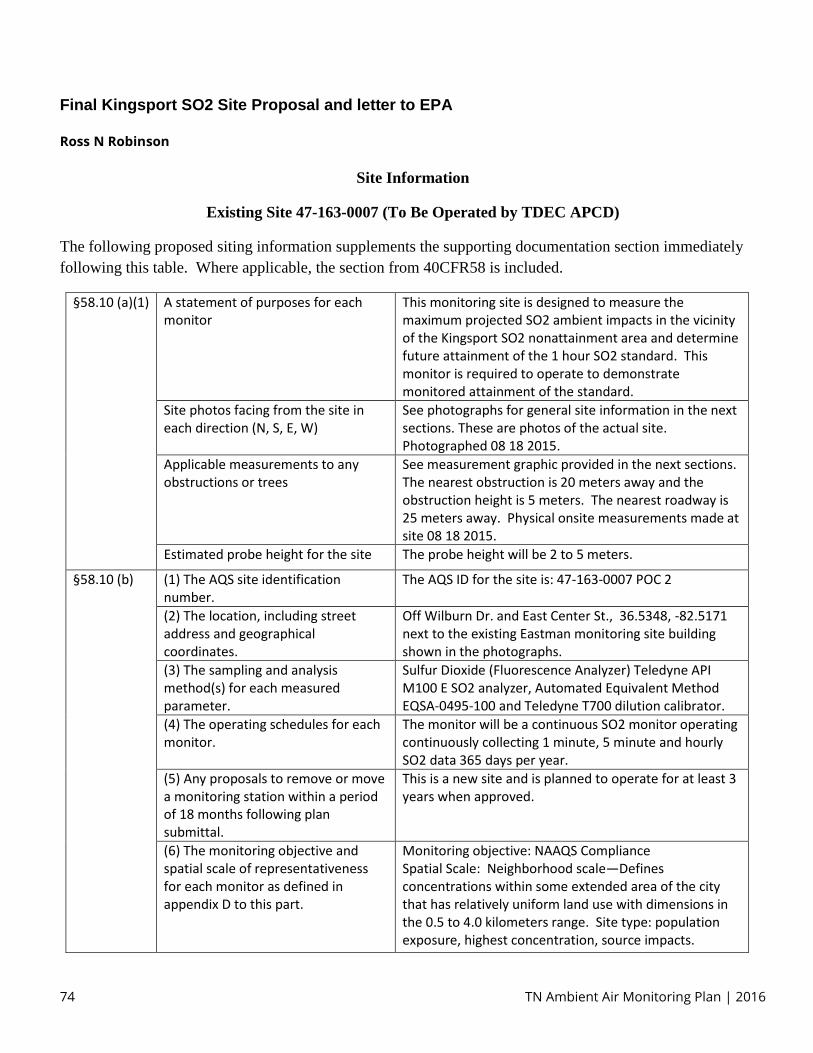
74 TN Ambient Air Monitoring Plan | 2016
Final Kingsport SO2 Site Proposal and letter to EPA
Ross N Robinson
Site Information
Existing Site 47-163-0007 (To Be Operated by TDEC APCD)
The following proposed siting information supplements the supporting documentation section immediately
following this table. Where applicable, the section from 40CFR58 is included.
§58.10 (a)(1) A statement of purposes for each monitor
This monitoring site is designed to measure the maximum projected SO2 ambient impacts in the vicinity of the Kingsport SO2 nonattainment area and determine future attainment of the 1 hour SO2 standard. This monitor is required to operate to demonstrate monitored attainment of the standard.
Site photos facing from the site in each direction (N, S, E, W)
See photographs for general site information in the next sections. These are photos of the actual site. Photographed 08 18 2015.
Applicable measurements to any obstructions or trees
See measurement graphic provided in the next sections. The nearest obstruction is 20 meters away and the obstruction height is 5 meters. The nearest roadway is 25 meters away. Physical onsite measurements made at site 08 18 2015.
Estimated probe height for the site The probe height will be 2 to 5 meters.
§58.10 (b) (1) The AQS site identification number.
The AQS ID for the site is: 47-163-0007 POC 2
(2) The location, including street address and geographical coordinates.
Off Wilburn Dr. and East Center St., 36.5348, -82.5171 next to the existing Eastman monitoring site building shown in the photographs.
(3) The sampling and analysis method(s) for each measured parameter.
Sulfur Dioxide (Fluorescence Analyzer) Teledyne API M100 E SO2 analyzer, Automated Equivalent Method EQSA-0495-100 and Teledyne T700 dilution calibrator.
(4) The operating schedules for each monitor.
The monitor will be a continuous SO2 monitor operating continuously collecting 1 minute, 5 minute and hourly SO2 data 365 days per year.
(5) Any proposals to remove or move a monitoring station within a period of 18 months following plan submittal.
This is a new site and is planned to operate for at least 3 years when approved.
(6) The monitoring objective and spatial scale of representativeness for each monitor as defined in appendix D to this part.
Monitoring objective: NAAQS Compliance Spatial Scale: Neighborhood scale—Defines concentrations within some extended area of the city that has relatively uniform land use with dimensions in the 0.5 to 4.0 kilometers range. Site type: population exposure, highest concentration, source impacts.

75 TN Ambient Air Monitoring Plan | 2016
(7) The identification of any sites that are suitable and sites that are not suitable for comparison against the “SO2 NAAQS”.
The proposed site will be suitable for comparison to the SO2 NAAQS. This site will be a SLAMs or SLAMs equivalent site.
(8) The MSA, CBSA, CSA or other area represented by the monitor.
The site is located in the Kingsport-Bristol-Bristol, TN-VA MSA CBSA # 28700. See PWEI table in the following sections that identifies the requirement for operation of a monitor in this area.
SO2 NAAQS Designations Source-Oriented Monitoring Technical Assistance Document
To adequately characterize the area going forward, and given the planned emissions controls/changes already in progress, your analysis should be based on modeling using future projected actual emissions.
The TDEC APCD modeling analysis includes the future case evaluation and results. The potential site locations and method for identification of potential max concentration sites are included in the modeling analysis provided that was done following the guidance provided in the TAD. The modeling employed to identify the locations of potential highest concentration receptors that might be suitable for monitoring site placement, will be re-evaluated based on the approved attainment case modeling demonstration to be submitted later. Relocation or addition of additional monitoring sites will be considered subject to significant changes in the maximum receptor locations identified in the approved attainment case modeling demonstration.
The criteria used to evaluate and select the proposed Ross N Robinson monitoring site were based in part on
the following siting criteria found in 40 CFR Part 58 Appdx E and included for reference below.
TABLE E–4 OF APPENDIX E TO PART 58—SUMMARY OF PROBE AND MONITORING PATH SITING CRITERIA
Pollutant Scale (maximum monitoring path length, meters)
Height from ground to probe,
inlet or 80% of monitoring path 1
(meters)
Horizontal and vertical distance from supporting structures 2 to probe, inlet or 90% of monitoring path1
(meters)
Distance from trees to probe, inlet or 90% of
monitoring path 1 (meters)
Distance from roadways to
probe, inlet or monitoring
path 1 (meters)
SO2 3 4 5 6 Middle (300 m)
Neighborhood Urban,
and Regional (1 km).
2–15 >1 >10 N/A
N/A—Not applicable. 1 Monitoring path for open path analyzers is applicable only to middle or neighborhood scale CO monitoring, middle, neighbor- hood, urban, and regional
scale NO2 monitoring, and all applicable scales for monitoring SO2, O3, and O3 precursors.
2 When probe is located on a rooftop, this separation distance is in reference to walls, parapets, or penthouses located on roof.
3 Should be greater than 20 meters from the dripline of tree(s) and must be 10 meters from the dripline when the tree(s) act as an obstruction.
4 Distance from sampler, probe, or 90 percent of monitoring path to obstacle, such as a building, must be at least twice the height the obstacle protrudes
above the sampler, probe, or monitoring path. Sites not meeting this criterion may be classified as middle scale (see text).
5 Must have unrestricted airflow 270 degrees around the probe or sampler; 180 degrees if the probe is on the side of a building or a wall.
6 The probe, sampler, or monitoring path should be away from minor sources, such as furnace or incineration flues. The separation distance is dependent on
the height of the minor source’s emission point (such as a flue), the type of fuel or waste burned, and the quality of the fuel (sulfur, ash, or lead content). This
criterion is designed to avoid undue influences from minor sources.
40 CFR Part 58 Appdx E (7–1–15 Edition)
5. SPACING FROM TREES
(a) Trees can provide surfaces for SO2, O3, or NO2 adsorption or reactions, and surfaces for particle
deposition. Trees can also act as obstructions in cases where they are located between the air pollutant sources
or source areas and the monitoring site, and where the trees are of a sufficient height and leaf canopy density to

76 TN Ambient Air Monitoring Plan | 2016
interfere with the normal air- flow around the probe, inlet, or monitoring path. To reduce this possible
interference/obstruction, the probe, inlet, or at least 90 per- cent of the monitoring path must be at least 10
meters or further from the drip line of trees.
(b) The scavenging effect of trees is greater for O3 than for other criteria pollutants. Monitoring agencies
must take steps to consider the impact of trees on ozone monitoring sites and take steps to avoid this problem.
(c) For microscale sites of any air pollutant, no trees or shrubs should be located between the probe and the
source under investigation, such as a roadway or a stationary source.
9. PROBE MATERIAL AND POLLUTANT SAMPLE RESIDENCE TIME
(a) For the reactive gases, SO2, NO2, and O3, special probe material must be used for point analyzers. Studies
have been conducted to determine the suitability of materials such as polypropylene, poly- ethylene, polyvinyl
chloride, Tygon, aluminum, brass, stainless steel, copper, Pyrex glass and Teflon for use as intake sampling lines.
Of the above materials, only Pyrex glass and Teflon have been found to be acceptable for use as intake sampling
lines for all the reactive gaseous pollutants. Further- more, the EPA 25 has specified borosilicate glass or FEP
Teflon as the only acceptable probe materials for delivering test atmospheres in the determination of reference
or equivalent methods. Therefore, borosilicate glass, FEP Teflon or their equivalent must be the only material in
the sampling train (from inlet probe to the back of the analyzer) that can be in contact with the ambient air
sample for existing and new SLAMs.
(c) No matter how nonreactive the sampling probe material is initially, after a period of use reactive
particulate matter is de- posited on the probe walls. Therefore, the time it takes the gas to transfer from the
probe inlet to the sampling device is also critical. Ozone in the presence of nitrogen oxide (NO) will show
significant losses even in the most inert probe material when the residence time exceeds 20 seconds. Other
studies indicate that a 10 second or less residence time is easily achievable. Therefore, sampling probes for
reactive gas monitors at NCore and at NO2 sites must have a sample residence time less than 20 seconds.
10. WAIVER PROVISIONS
Most sampling probes or monitors can be located so that they meet the requirements of this appendix. New sites
with rare exceptions, can be located within the limits of this appendix. However, some existing sites may not meet
these requirements and still produce useful data for some purposes. The EPA will consider a written request from
the State agency to waive one or more siting criteria for some monitoring sites providing that the State can
adequately demonstrate the need (purpose) for monitoring or establishing a monitoring site at that location.
10.1 For establishing a new site, a waiver may be granted only if both of the following criteria are met:
10.1.1 The site can be demonstrated to be as representative of the monitoring area as it would be if the
siting criteria were being met.
10.1.2 The monitor or probe cannot reasonably be located so as to meet the siting criteria because of
physical constraints (e.g., inability to locate the required type of site the necessary distance from roadways
or obstructions).
10.2 However, for an existing site, a waiver may be granted if either of the criteria in sections 10.1.1 and 10.1.2
of this appendix are met.
10.3 Cost benefits, historical trends, and other factors may be used to add support to the criteria in sections
10.1.1 and 10.1.2 of this appendix, however, they in themselves, will not be acceptable reasons for granting a
waiver. Written requests for waivers must be submitted to the Regional Administrator.

77 TN Ambient Air Monitoring Plan | 2016
§58.10 (a)(1) Site photos facing from the site in each direction (N, S, E, W)
47-163-0007 Ross N. Robinson Looking North
08 18 2015
47-163-0007 Ross N. Robinson Looking South
08 18 2015

78 TN Ambient Air Monitoring Plan | 2016
47-163-0007 Ross N. Robinson Looking East
08 18 2015
47-163-0007 Ross N. Robinson Looking West
08 18 2015

79 TN Ambient Air Monitoring Plan | 2016
Ross N
Robinson Area
Looking North
from site.
08 18 2015
Ross N
Robinson
Area Looking
East from
site.
08 18 2015

80 TN Ambient Air Monitoring Plan | 2016
Ross N
Robinson
Area Looking
South from
site.
08 18 2015
Ross N
Robinson
Area
Looking
West from
site.
08 18 2015

81 TN Ambient Air Monitoring Plan | 2016
Discussion of General and Specific Site Characteristics
The previous photographs provide details of the surrounding local terrain, urban development, location of
residences and roadways. The photographs also identify the presence of trees and other obstacles that may be
considered to be possible obstructions in the vicinity of the proposed sampling site for SO2. The following
analysis will identify the actual site conditions based on field measurements and field observations augmented by
the accompanying imagery to identify and address any possible obstructions. Please reference the sections from
40 CFR Part 58 Appdx E in the preceding section that actually presents the criteria that must be met in order to
meet the SLAMs siting criteria.
§58.10 (a)(1) Applicable measurements to any obstructions or trees

82 TN Ambient Air Monitoring Plan | 2016
Inlet Probe Estimated Height:
Location of
existing inlet
probe (4 to 5
meters).
New shelter
inlet probe will
be 2 to 5
meters.
The new shelter
is proposed to
be setup
immediately
next to the
existing
monitoring
building.

83 TN Ambient Air Monitoring Plan | 2016
Supporting Documentation for the Site Establishment Letter to EPA
An air quality history for the Ross N. Robinson monitoring site is provided below to describe the air quality data
resulting in the area being named nonattainment for SO2 by EPA. It must be noted that the air quality is
improving over the 2009 to 2011 dataset used to designate the area.
AQS ID Design Value
Year
3-Year Design Value
3-Year DV Validity
Indicator
471630007 2006 - 2008 169 Y
471630007 2007 - 2009 160 Y
471630007 2008 - 2010 191 Y
471630007 2009 - 2011 196 Y
471630007 2010 - 2012 198 Y
471630007 2011 - 2013 149 Y
471630007 2012 - 2014 136 Y
Discussion taken from EPA’s Draft TSD
http://www.epa.gov/so2designations/eparesp/04_TN_tsd.pdf
Geography/Topography (mountain ranges or other air basin boundaries)
Most of Sullivan County is located in the Ridge and Valley Geographic Region, which covers 7,703 square miles and
is situated between the Cumberland Plateau and the Unaka Mountains. Sullivan County is a rural area with urban
centers. The topography of this region consists of long linear ridges with elevations of 1100 to 1500 feet, and
parallel lowland valleys, where the elevations vary from 700 to 1000 feet. The ridges and valleys are typically
oriented from northeast to southwest. Generally, the ridges and valleys have a higher elevation in the northern
part of the region and slightly less elevated in the south.
0
50
100
150
200
250
PP
B S
O2
DV
471630007
3-Year Design Value
1 Hr Std 99% Tile 75PPB
Linear (3-Year DesignValue)

84 TN Ambient Air Monitoring Plan | 2016
Meteorology (weather/transport patterns)
Evidence of source-receptor relationships between specific emissions sources and high SO2 values at violating
monitors is another important factor in determining the appropriate contributing areas and the appropriate
extent of the nonattainment area boundary. For this factor, EPA considered recent hourly meteorological data
from the NWS site nearest to the violating monitor to determine which wind vectors were associated with 1-hour
SO2 exceedances. For the Sullivan Area, 2009-2011 meteorological data was evaluated from two NWS sites in the
area. The two sites are the Bristol/Tri City Airport (ID # 723183-13877) and the Virginia Highlands site (ID# 724058-
53818). The Bristol/Tri City Airport is approximately 12 km southeast of the violating monitor and the Virginia
Highlands site is approximately 50 kilometers northeast of the violating monitor. Data from the Virginia Highlands
site was evaluated because data was not available after July 2010 from the Bristol/Tri City Airport site. The primary
SO2 emissions source nearby is the Eastman Chemical Company facility, located approximately 2.5 kilometers
southwest from the violating monitor. Figures 4 and 5 show that the majority of the exceeding hours have winds
blowing from the southwest and west with generally moderate wind speeds. No other major sources are located
near the violating monitor in the southwest to west direction. Therefore, the Eastman Chemical facility is likely the
major contributor to the violations at the monitor.
(Figure 4 and 5. taken from EPA’s Draft TSD)

85 TN Ambient Air Monitoring Plan | 2016
Proposed SO2 Monitoring Site in Sullivan County, TN
The Ross N. Robinson School monitoring site has operated continuously since before 1981 by the Eastman
Company.
• Site location: Located about 2.5 km ENE of the Eastman facility (downwind).
The Ross N. Robinson School site is also the site used to name the area nonattainment for the 1 hour SO2
standard. Figure 1 below shows the relationship between the boundary of the nonattainment area and the
location of the proposed SO2 monitoring site in the north east quadrant of the circular area boundary. Given the
site location is the design value site and is also located within the nonattainment area boundary, it is believed that
this site should be considered a representative site for the area.
Figure 1

86 TN Ambient Air Monitoring Plan | 2016
The following wind rose is presented to establish the representative wind directions based upon actual onsite
meteorological data collected by the Eastman Company. (Figure 2).
Figure 2

87 TN Ambient Air Monitoring Plan | 2016
Figure 3 shows the general area around the Ross N. Robinson site and the population defined for the area by the
2010 Census. The block group population counts (total population), are identified by the yellow boundary lines
with the population reported for each in black text.
Figure 3

88 TN Ambient Air Monitoring Plan | 2016
The Ross N. Robinson site is located at approximately 1300 feet elevation as shown in the following topo map, Figure
4. In addition, the map also depicts the locations of the roads that surround the area.
Figure 4
The graphic shown in Figure 5 identifies the 2014 ADT counts for the area in and around the Ross N. Robinson site.
Figure 5

89 TN Ambient Air Monitoring Plan | 2016
PWEI Table for Tennessee MSA’s Including the Kingsport MSA
CBSA ID CBSA Name
2008 NEI
v1.5
so2 (tpy)
Population
(2010)
PWEI in
Million
persons-tpy
Required
Monitors
Population
(2009) Est.
PWEI in
Million
persons-tpy
Required
Monitors
34980 Nashville-Davidson--Murfreesboro--Franklin TN 41,476 1,589,934 65,944 1 1,582,264 65,626 1
28940 Knoxville TN 39,833 698,030 27,805 1 699,247 27,853 1
32820 Memphis TN-MS-AR 17,651 1,316,100 23,231 1 1,304,926 23,034 1
28700 Kingsport-Bristol-Bristol TN-VA 56,754 309,544 17,568 1 305,629 17,346 1
17300 Clarksville TN-KY 16,820 273,949 4,608 0 268,546 4,517 0
25340 Harriman TN 50,674 54,181 2,746 0 53,508 2,711 0
16860 Chattanooga TN-GA 2,178 528,143 1,150 0 524,303 1,142 0
27740 Johnson City TN 2,976 198,716 591 0 197,381 587 0
34100 Morristow n TN 4,004 136,608 547 0 137,612 551 0
27180 Jackson TN 2,894 115,425 334 0 113,629 329 0
17420 Cleveland TN 2,692 115,788 312 0 113,358 305 0
Population Weighted Emissions Index (PWEI) Calcuations - April 2012 - Using 2010 Census Data & 2008 NEI v1.5 (no f ires included)

90 TN Ambient Air Monitoring Plan | 2016
Skyland Drive
Site Information
Existing Site 47-163-0018 (20) (To Be Operated by TDEC APCD)
The following proposed siting information supplements the supporting documentation section immediately
following this table. Where applicable, the section from 40CFR58 is included.
§58.10 (a)(1) A statement of purposes for each
monitor This monitoring site is designed to measure the maximum projected SO2 ambient impacts in the vicinity of the Kingsport SO2 nonattainment area and determine future attainment of the 1 hour SO2 standard. This monitor is required to operate to demonstrate monitored attainment of the standard.
Site photos facing from the site in each direction (N, S, E, W)
See photographs for general site information in the next sections. These are photos of the actual site. Photographed 01 07 2016.
Applicable measurements to any obstructions or trees
See measurement table and graphics provided in the next sections. Physical onsite measurements made at site 01 07 2016.
Estimated probe height for the site The probe height will be between 10 to 13 meters when installed (per siting criteria). Existing manifold is glass. New manifold will be Teflon.
§58.10 (b) (1) The AQS site identification number. The proposed AQS ID for the site is: 47-163-0020.
(2) The location, including street address and geographical coordinates.
Off Skyland Drive, 36.5209, -82.5025 at the existing Eastman monitoring site.
(3) The sampling and analysis method(s) for each measured parameter.
Sulfur Dioxide (Fluorescence Analyzer) Teledyne API M100 E SO2 analyzer, Automated Equivalent Method EQSA-0495-100 and Teledyne T700 dilution calibrator.
(4) The operating schedules for each monitor.
The monitor will be a continuous SO2 monitor operating continuously collecting 1 minute, 5 minute and hourly SO2 data 365 days per year.
(5) Any proposals to remove or move a monitoring station within a period of 18 months following plan submittal.
This is a new site and is planned to operate for at least 3 years when approved.
(6) The monitoring objective and spatial scale of representativeness for each monitor as defined in appendix D to this part.
Monitoring objective: NAAQS Compliance Spatial Scale: Neighborhood scale—Defines concentrations within some extended area of the city that has relatively uniform land use with dimensions in the 0.5 to 4.0 kilometers range. Site type: population exposure, highest concentration, source impacts.
(7) The identification of any sites that are suitable and sites that are not suitable for comparison against the “SO2 NAAQS”.
The site will be suitable for comparison to the SO2 NAAQS. The site is proposed to be a SLAMs or SLAMs equivalent site.
(8) The MSA, CBSA, CSA or other area represented by the monitor.
The site will be located in the Kingsport-Bristol-Bristol, TN-VA MSA CBSA # 28700. See PWEI table in the following sections that identifies the requirement for operation of a monitor in this area.

91 TN Ambient Air Monitoring Plan | 2016
SO2 NAAQS Designations Source-Oriented Monitoring Technical Assistance Document
To adequately characterize the area going forward, and given the planned emissions controls/changes already in progress, your analysis should be based on modeling using future projected actual emissions
The TDEC APCD modeling analysis includes the future case evaluation and results. The potential site locations and method for identification of potential max concentration sites are included in the modeling analysis provided that was done following the guidance provided in the TAD. The modeling employed to identify the locations of potential highest concentration receptors that might be suitable for monitoring site placement, will be re-evaluated based on the approved attainment case modeling demonstration to be submitted later. Relocation or addition of additional monitoring sites will be considered subject to significant changes in the maximum receptor locations identified in the approved attainment case modeling demonstration.
The criteria used to evaluate and select the proposed Skyland Drive monitoring site were based in part on the
following siting criteria found in 40 CFR Part 58 Appdx E and included for reference below.
TABLE E–4 OF APPENDIX E TO PART 58—SUMMARY OF PROBE AND MONITORING PATH SITING CRITERIA
Pollutant Scale (maximum monitoring path length, meters)
Height from ground to probe, inlet or
80% of monitoring path 1 (meters)
Horizontal and vertical distance from supporting structures 2 to probe, inlet or 90% of monitoring path1
(meters)
Distance from trees to probe, inlet or 90% of
monitoring path 1
(meters)
Distance from roadways to
probe, inlet or monitoring path
1 (meters)
SO2 3 4 5 6 Middle (300 m)
Neighborhood Urban,
and Regional (1 km).
2–15 >1 >10 N/A
N/A—Not applicable. 1 Monitoring path for open path analyzers is applicable only to middle or neighborhood scale CO monitoring, middle, neighbor- hood, urban, and regional scale NO2
monitoring, and all applicable scales for monitoring SO2, O3, and O3 precursors.
2 When probe is located on a rooftop, this separation distance is in reference to walls, parapets, or penthouses located on roof.
3 Should be greater than 20 meters from the dripline of tree(s) and must be 10 meters from the dripline when the tree(s) act as an obstruction.
4 Distance from sampler, probe, or 90 percent of monitoring path to obstacle, such as a building, must be at least twice the height the obstacle protrudes above the
sampler, probe, or monitoring path. Sites not meeting this criterion may be classified as middle scale (see text).
5 Must have unrestricted airflow 270 degrees around the probe or sampler; 180 degrees if the probe is on the side of a building or a wall.
6 The probe, sampler, or monitoring path should be away from minor sources, such as furnace or incineration flues. The separation distance is dependent on the height of
the minor source’s emission point (such as a flue), the type of fuel or waste burned, and the quality of the fuel (sulfur, ash, or lead content). This criterion is designed to
avoid undue influences from minor sources.

92 TN Ambient Air Monitoring Plan | 2016
40 CFR Part 58 Appdx E (7–1–15 Edition)
5. SPACING FROM TREES
(a) Trees can provide surfaces for SO2, O3, or NO2 adsorption or reactions, and surfaces for particle
deposition. Trees can also act as obstructions in cases where they are located between the air pollutant sources
or source areas and the monitoring site, and where the trees are of a sufficient height and leaf canopy density to
interfere with the normal air- flow around the probe, inlet, or monitoring path. To reduce this possible
interference/obstruction, the probe, inlet, or at least 90 per- cent of the monitoring path must be at least 10
meters or further from the drip line of trees.
(b) The scavenging effect of trees is greater for O3 than for other criteria pollutants. Monitoring agencies
must take steps to con- sider the impact of trees on ozone monitoring sites and take steps to avoid this problem.
(c) For microscale sites of any air pollutant, no trees or shrubs should be located between the probe and the
source under investigation, such as a roadway or a stationary source.
9. PROBE MATERIAL AND POLLUTANT SAMPLE RESIDENCE TIME
(a) For the reactive gases, SO2, NO2, and O3, special probe material must be used for point analyzers. Studies
have been conducted to determine the suitability of materials such as polypropylene, poly- ethylene, polyvinyl
chloride, Tygon, aluminum, brass, stainless steel, copper, Pyrex glass and Teflon for use as intake sampling lines.
Of the above materials, only Pyrex glass and Teflon have been found to be acceptable for use as intake sampling
lines for all the reactive gaseous pollutants. Further- more, the EPA 25 has specified borosilicate glass or FEP
Teflon as the only acceptable probe materials for delivering test atmospheres in the determination of reference
or equivalent methods. Therefore, borosilicate glass, FEP Teflon or their equivalent must be the only material in
the sampling train (from inlet probe to the back of the analyzer) that can be in contact with the ambient air
sample for existing and new SLAMs.
(c) No matter how nonreactive the sampling probe material is initially, after a period of use reactive
particulate matter is de- posited on the probe walls. Therefore, the time it takes the gas to transfer from the
probe inlet to the sampling device is also critical. Ozone in the presence of nitrogen oxide (NO) will show
significant losses even in the most inert probe material when the residence time exceeds 20 seconds. Other
studies indicate that a 10 second or less residence time is easily achievable. Therefore, sampling probes for
reactive gas monitors at NCore and at NO2 sites must have a sample residence time less than 20 seconds.
10. WAIVER PROVISIONS
Most sampling probes or monitors can be located so that they meet the requirements of this appendix. New sites
with rare exceptions, can be located within the limits of this appendix. However, some existing sites may not meet
these requirements and still produce useful data for some purposes. The EPA will consider a written request from
the State agency to waive one or more siting criteria for some monitoring sites providing that the State can
adequately demonstrate the need (purpose) for monitoring or establishing a monitoring site at that location.
10.1 For establishing a new site, a waiver may be granted only if both of the following criteria are met:
10.1.1 The site can be demonstrated to be as representative of the monitoring area as it would be if the siting
criteria were being met.

93 TN Ambient Air Monitoring Plan | 2016
10.1.2 The monitor or probe cannot reasonably be located so as to meet the siting criteria because of physical
constraints (e.g., inability to locate the required type of site the necessary distance from roadways or
obstructions).
10.2 However, for an existing site, a waiver may be granted if either of the criteria in sections 10.1.1 and 10.1.2
of this appendix are met.
10.3 Cost benefits, historical trends, and other factors may be used to add support to the criteria in sections
10.1.1 and 10.1.2 of this appendix, however, they in themselves, will not be acceptable reasons for granting a
waiver. Written requests for waivers must be submitted to the Regional Administrator.
58.10 (a)(1) Proposed SO2 site location and area. (Photos facing in the direction noted.

94 TN Ambient Air Monitoring Plan | 2016
Proposed new
Skyland Dr. site
location looking
North from area
selected. 01 07 2016
Proposed new
Skyland Dr. site
location looking
East from area
selected. 01 07 2016

95 TN Ambient Air Monitoring Plan | 2016
§58.10 (a)(1) Discussion of Applicable measurements to any obstructions or trees
Proposed new
Skyland Dr. site
location looking
South from area
selected. 01 07 2016
Proposed new
Skyland Dr. site
location looking
West from area
selected. 01 07 2016

96 TN Ambient Air Monitoring Plan | 2016
Discussion of General and Specific Site Characteristics
The previous photographs provide details of the surrounding local terrain, urban development, location of
residences and roadways. The photographs also identify the presence of trees and other obstacles that may be
considered to be possible obstructions in the vicinity of the proposed sampling site for SO2. The following
analysis will identify the actual site conditions based on field measurements and field observations augmented by
the accompanying imagery to identify and address any possible obstructions. Please reference the sections from
40 CFR Part 58 Appdx E in the preceding section that actually presents the criteria that must be met in order to
meet the SLAMs siting criteria.
The imagery provided in the following graphic “General Site Quadrants and Site Layout” present the overall
proposed monitoring site area and show general landscape features that need to be addressed according to the
referenced siting criteria. It should be noted in the graphic that the major industrial source of SO2 is located on
the western side of the proposed monitoring site and is relatively open to air movement in that direction.
General Site Quadrants and Site Layout

97 TN Ambient Air Monitoring Plan | 2016
The following graphic “Site Layout with 30 Degree Sectors Identified” is presented to help identify any potential
obstruction and compare that obstruction with the required footnote 5 “Must have unrestricted airflow 270
degrees around the probe or sampler; 180 degrees if the probe is on the side of a building or a wall.“ found
in Table E 4 of 40 CFR Part 58 Appdx E. It is clear that of the 360 degree area around the proposed sampling site,
an existing water storage tank (tower) is present and creates a 30 degree obstruction in the NNW quadrant (360 –
30 results in 330 degrees unobstructed). It is also clear that a nearby tree line located on the SSE and SE presents
an obstruction which collectively create another 60 degrees of obstruction (330 – 60 results in 270 degrees
unobstructed). The exact language in Table E4 states that the site must have “unrestricted airflow 270 degrees
around the probe or sampler”. The calculations and imagery presented demonstrate this as the language in
table E 4 does not state that the 270 degrees must be a contiguous or co-joined open area without breaks or
interruptions.
Site Layout with 30 Degree Sectors Identified

98 TN Ambient Air Monitoring Plan | 2016
The following photographs and direct site measurements were made to establish conformance with the siting
criteria found in 40 CFR Part 58 Appdx E. The view depicted in the following photograph shows the proposed
sampling site in the foreground and an evergreen conifer tree in the background. This tree is also depicted in the
west view photograph taken from the roof of the proposed sampling site building. The tree dripline is 20 meters
from the proposed sample inlet and meets both (a) and almost meets the (b) criteria in the table below. The
height measurements were made using a sample inlet height of about 1 meter above the surface of the
existing building (current height of existing manifold assembly which will be replaced) which is also
approximately 3.8 meters above ground level. The tree is currently far enough away to satisfy the “must be >10
meters” and almost meets the “should be >20 meters” from the sample inlet without any other modifications to
the existing manifold. In order to address the potential for future growth of the tree and to ensure the (b) criteria
are currently met and no growth related encroachment on the distance requirements occurs, the property
owners have agreed to allow the tree to be pruned by an arborist to ensure these requirements are met now
and in the future.
Feature to
Evaluate
Height
Meters
Tree
Dripline
Meters
(Radius)
Distance from
Dripline or
Object to
Sample Inlet
Meters
(a) Tree
Dripline
Must Be >10
Meters
(b) Tree
Dripline
Should Be
>20 Meters
Twice
Height
Above
Inlet
Meters
Obstruction
(Yes or No)
Conifer Tree 6.7 4.0 20.0 Yes No 13.4 Yes
View looking toward the plant.
Main sampling direction would be
considered clear with no
obstructions.
Photographed 01 07 2016

99 TN Ambient Air Monitoring Plan | 2016
The view depicted in the following photograph shows the proposed sampling site in the foreground and an
“evergreen tree” in the background along with a utility water tank. The “evergreen tree conifer tree” was
previously discussed. The photograph is facing west north-west taken from the ground. The height
measurements were made using a sample inlet height of about 1 meter above the surface of the existing building
(current height of existing manifold assembly which will be replaced) which is also approximately 3.8 meters
above ground level. The water tank is an obstruction and is approximately 17.1 meters from the existing sample
probe inlet and is 15 meters above the existing sample probe inlet.
Feature to
Evaluate
Height
Meters
Distance from
Dripline or
Object to Sample
Inlet Meters
Twice
Height
Above
Inlet
Meters
Obstruction
(Yes or No)
Water
Tower
15.2 17.1 30.5 Yes
Photographed 01 07 2016

100 TN Ambient Air Monitoring Plan | 2016
The view depicted in the following photograph shows the proposed sampling site in the foreground and a “tree
line” in the background. The “tree line” consists of a principal tree that is closest to the proposed site with all of
the trees actually growing on property not controlled by the site owner and overhanging the property line. The
trees are located south and south east of the proposed site. The photograph was taken from the ground looking
across the roof of the proposed site building. The height measurements were made using a sample inlet height
of about 1 meter above the surface of the existing building (current height of existing manifold assembly which
will be replaced) which is also approximately 3.8 meters above ground level. The tree dripline is 12 meters from
the proposed sample inlet and meets (a) but does not meet the (b) criteria in the table below. The property owner
will be contacted for permission to allow the tree to be pruned by an arborist to ensure these requirements
are met now and in the future.
Feature to
Evaluate
Height
Meters
Tree
Dripline
Meters
(Radius)
Distance from
Dripline or
Object to Sample
Inlet Meters
(a) Tree
Dripline
Must Be
>10
Meters
(b) Tree
Dripline
Should Be
>20 Meters
Twice
Height
Above
Inlet
Meters
Obstruction
(Yes or No)
Closest
Tree
21.0 8.0 12.0 Yes No 42.1 Yes
Photographed 01 07 2016

101 TN Ambient Air Monitoring Plan | 2016
Another tree is located on the south south-west of the proposed site which is located on property owned by the
site owner in a utility easement at the entrance driveway on Bagwell Street. This tree will be removed by the
property owner. In the following imagery, the tree is 13 meters from the proposed site and is currently far
enough away to satisfy the (a) but does not meet the (b) criteria from the sample inlet without any other
modifications to the existing manifold. Because this tree will be removed, it will not be an obstruction for
sampling.
Height
Meters
Tree
Dripline
Meters
(Radius)
Distance from
Dripline or
Object to Sample
Inlet Meters
(a) Tree
Dripline
Must Be
>10
Meters
(b) Tree
Dripline
Should Be
>20 Meters
Twice
Height
Above
Inlet
Meters
Obstruction
(Yes or No)
Tree at
Drive
5.3 4.0 13.0 Yes No 10.7 Yes
TABLE E–4 OF APPENDIX E TO PART 58—SUMMARY OF PROBE AND MONITORING PATH SITING CRITERIA

102 TN Ambient Air Monitoring Plan | 2016
Pollutant
Scale (maximum
monitoring path
length, meters)
Height from ground
to probe, inlet or 80%
of monitoring path 1
(meters)
Horizontal and vertical
distance from supporting
structures 2 to probe, inlet or
90% of monitoring path1
(meters)
Distance from trees
to probe, inlet or 90%
of monitoring path 1
(meters)
Distance from
roadways to probe,
inlet or monitoring
path 1 (meters)
SO2 3 4 5 6 Middle (300 m) Neighborhood Urban, and Regional (1 km).
2–15 >1 >10 N/A
N/A—Not applicable.
1 Monitoring path for open path analyzers is applicable only to middle or neighborhood scale CO monitoring, middle, neighbor- hood, urban, and regional scale NO2
monitoring, and all applicable scales for monitoring SO2, O3, and O3 precursors.
2 When probe is located on a rooftop, this separation distance is in reference to walls, parapets, or penthouses located on roof.
3 Should be greater than 20 meters from the dripline of tree(s) and must be 10 meters from the dripline when the tree(s) act as an obstruction.
4 Distance from sampler, probe, or 90 percent of monitoring path to obstacle, such as a building, must be at least twice the height the obstacle protrudes above the
sampler, probe, or monitoring path. Sites not meeting this criterion may be classified as middle scale (see text).
5 Must have unrestricted airflow 270 degrees around the probe or sampler; 180 degrees if the probe is on the side of a building or a wall.
6 The probe, sampler, or monitoring path should be away from minor sources, such as furnace or incineration flues. The separation distance is dependent on the height of
the minor source’s emission point (such as a flue), the type of fuel or waste burned, and the quality of the fuel (sulfur, ash, or lead content). This criterion is designed to
avoid undue influences from minor sources.
In order to address the concerns associated with the potential obstructions identified in the above discussions, a
10 meter met tower is proposed to be installed on site immediately behind the existing monitoring building
between the building and the existing water tank superstructure at ground level. Depending on spacing issues
associated with lowering the tower to the ground for NPAP audit purposes, the tower may be required to be
located on the north east side of the existing monitoring building. The met tower will also be equipped with an
extension support pole 3 to 5 meters in length, as shown in the following photograph to further enhance the
height of the met tower and to better satisfy the need for optimum vertical distance where the (a) or (b) distance
criteria are not being met.

103 TN Ambient Air Monitoring Plan | 2016
10 Meter met tower mockup at Skyland Dr. monitoring site. Location of
tower will be immediately next to the monitoring shelter building.

104 TN Ambient Air Monitoring Plan | 2016
Supporting Documentation for the Site Establishment Letter to EPA
Discussion taken from EPA’s Draft TSD
http://www.epa.gov/so2designations/eparesp/04_TN_tsd.pdf
Geography/Topography (mountain ranges or other air basin boundaries)
Most of Sullivan County is located in the Ridge and Valley Geographic Region, which covers 7,703 square miles and
is situated between the Cumberland Plateau and the Unaka Mountains. Sullivan County is a rural area with urban
centers. The topography of this region consists of long linear ridges with elevations of 1100 to 1500 feet, and
parallel lowland valleys, where the elevations vary from 700 to 1000 feet. The ridges and valleys are typically
oriented from northeast to southwest. Generally, the ridges and valleys have a higher elevation in the northern
part of the region and slightly less elevated in the south.

105 TN Ambient Air Monitoring Plan | 2016
Meteorology (weather/transport patterns)
Evidence of source-receptor relationships between specific emissions sources and high SO2 values at violating
monitors is another important factor in determining the appropriate contributing areas and the appropriate
extent of the nonattainment area boundary. For this factor, EPA considered recent hourly meteorological data
from the NWS site nearest to the violating monitor to determine which wind vectors were associated with 1-hour
SO2 exceedances. For the Sullivan Area, 2009-2011 meteorological data was evaluated from two NWS sites in the
area. The two sites are the Bristol/Tri City Airport (ID # 723183-13877) and the Virginia Highlands site (ID# 724058-
53818). The Bristol/Tri City Airport is approximately 12 km southeast of the violating monitor and the Virginia
Highlands site is approximately 50 kilometers northeast of the violating monitor. Data from the Virginia Highlands
site was evaluated because data was not available after July 2010 from the Bristol/Tri City Airport site. The primary
SO2 emissions source nearby is the Eastman Chemical Company facility, located approximately 2.5 kilometers
southwest from the violating monitor. Figures 4 and 5 show that the majority of the exceeding hours have winds
blowing from the southwest and west with generally moderate wind speeds. No other major sources are located
near the violating monitor in the southwest to west direction. Therefore, the Eastman Chemical facility is likely the
major contributor to the violations at the monitor.
(Figure 4 and 5. taken from EPA’s Draft TSD)

106 TN Ambient Air Monitoring Plan | 2016
TDEC APCD Proposed SO2 Monitoring Site in Sullivan County, TN
The Skyland Drive monitoring site was operated previously by Tennessee Eastman during the recent modeling
study by the Eastman Company. TDEC APCD proposes to operate a new SO2 monitor at the existing monitoring
site.
• Site location: Located about 2.9 E of the Eastman facility (downwind).
Figure 1 and 1(a) below shows the relationship between the boundary of the nonattainment area and the location
of the proposed SO2 monitoring site in the east quadrant of the circular area boundary. Given the site location is
located within the nonattainment area boundary; it is believed that this site should be considered a
representative site for the area.
Figure 1
Figure 1 (a)

107 TN Ambient Air Monitoring Plan | 2016
The following wind rose is presented to establish the representative wind directions based upon actual onsite
meteorological data collected by the Eastman Company. (Figure 2).
Figure 2

108 TN Ambient Air Monitoring Plan | 2016
Figure 3 shows the general area around the Skyland Drive site and the population defined for the area by the
2010 Census. The block group population counts (total population), are identified by the yellow boundary lines
with the population reported for each in black text.
Figure 3

109 TN Ambient Air Monitoring Plan | 2016
The Skyland Drive site is located at approximately 1738 feet elevation as shown in the following topo map, Figure
4. In addition, the map also depicts the locations of the roads that surround the area.
Figure 4

110 TN Ambient Air Monitoring Plan | 2016
The graphic shown in Figure 5 identifies the 2014 ADT counts for the area in and around the Skyland Drive site.
Figure 5

111 TN Ambient Air Monitoring Plan | 2016
PWEI Table for Tennessee MSA’s Including the Kingsport MSA
CBSA ID CBSA Name
2008 NEI
v1.5
so2 (tpy)
Population
(2010)
PWEI in
Million
persons-tpy
Required
Monitors
Population
(2009) Est.
PWEI in
Million
persons-tpy
Required
Monitors
34980 Nashville-Davidson--Murfreesboro--Franklin TN 41,476 1,589,934 65,944 1 1,582,264 65,626 1
28940 Knoxville TN 39,833 698,030 27,805 1 699,247 27,853 1
32820 Memphis TN-MS-AR 17,651 1,316,100 23,231 1 1,304,926 23,034 1
28700 Kingsport-Bristol-Bristol TN-VA 56,754 309,544 17,568 1 305,629 17,346 1
17300 Clarksville TN-KY 16,820 273,949 4,608 0 268,546 4,517 0
25340 Harriman TN 50,674 54,181 2,746 0 53,508 2,711 0
16860 Chattanooga TN-GA 2,178 528,143 1,150 0 524,303 1,142 0
27740 Johnson City TN 2,976 198,716 591 0 197,381 587 0
34100 Morristow n TN 4,004 136,608 547 0 137,612 551 0
27180 Jackson TN 2,894 115,425 334 0 113,629 329 0
17420 Cleveland TN 2,692 115,788 312 0 113,358 305 0
Population Weighted Emissions Index (PWEI) Calcuations - April 2012 - Using 2010 Census Data & 2008 NEI v1.5 (no f ires included)
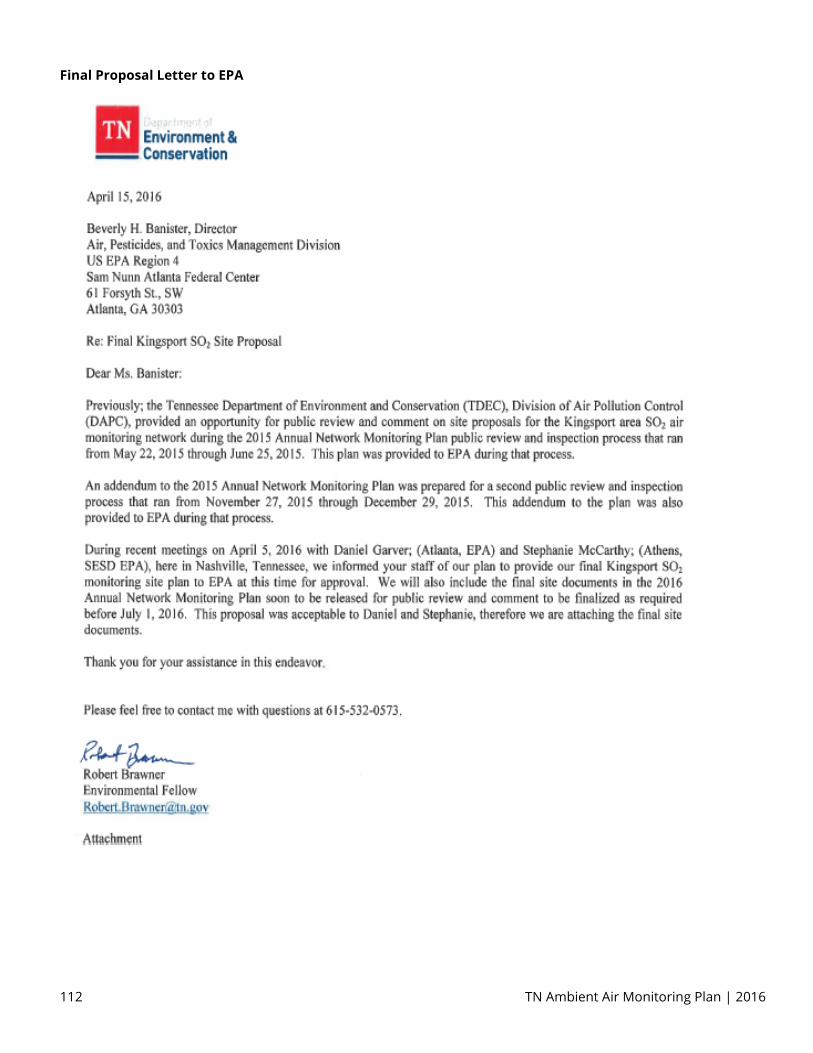
112 TN Ambient Air Monitoring Plan | 2016
Final Proposal Letter to EPA