Embed Size (px)
Citation preview

IDENTIFYING FACTORS CONTROLLING CELL SHAPE AND VIRULENCE GENE
EXPRESSION IN BORRELIA BURGDORFERI
Amberly Nicole Grothe
Submitted to the faculty of the University Graduate School
in partial fulfillment of the requirements
for the degree
Master of Science
in the Department of Microbiology and Immunology,
Indiana University
August 2019

ii
Accepted by the Graduate Faculty of Indiana University, in partial
fulfillment of the requirements for the degree of Master of Science.
Master's Thesis Committee
______________________________________
X. Frank Yang, Ph.D. - Chair
______________________________________
Stacey Gilk, Ph.D.
______________________________________
David Nelson, Ph.D.

iii
© 2019
Amberly Nicole Grothe

iv
ACKNOWLEDGEMENTS
There are many people without whom this work would not be possible. An endeavor
like this is not one to be done without inspiration, without motivation, or without
determination. To all of those who have encouraged me and supported me on my
scientific journey, thank you.
To my parents and James, thank you for constantly pushing me forward and for
believing in me even when I didn’t believe in myself. Your love and encouragement kept
me stable and kept me motivated.
To my fellow lab members, thank you for your collaboration and your patience.
Thank you for fulfilling the roles as friends, coworkers, and teachers all at once. And
thank you to DJ and Sajith, whose troubleshooting work helped me tremendously.
Thank you to my committee members, Dr. Stacey Gilk and Dr. David Nelson, for
your advice and your insight. Thank you for motivating me and helping to guide my
project alongside my mentor.
And to my mentor, Dr. Frank Yang, thank you for all the help and guidance you
provided throughout my time in the lab. Despite numerous fallbacks, you never said an
unkind word and you always motivated us to keep going, to keep trying. Your patience
and encouragement have been invaluable to me.
And last but most importantly, I would like to thank God for blessing me with this
opportunity to learn and grow, both as a scientist and a person, and for giving me the
strength to persevere when times got tough. It is through Him that all things are possible.

v
Amberly Nicole Grothe
IDENTIFYING FACTORS CONTROLLING CELL SHAPE AND VIRULENCE GENE
EXPRESSION IN BORRELIA BURGDORFERI
Lyme disease is a multi-system inflammatory disorder that is currently the fastest
growing arthropod-borne disease in the United States. The Lyme disease pathogen,
Borrelia burgdorferi, exists within an enzootic cycle consisting of Ixodes tick vectors and
a variety of vertebrate hosts. Borrelia lies within a distinct clade of microorganisms
known as spirochetes which exhibit a unique spiral morphology. The underlying genetic
mechanisms controlling for borrelial morphologies are still being discovered. One
flagellar protein, FlaB, has been indicated to affect both spiral shape and motility of the
organisms and significantly impacts the organism’s ability to establish infection. Due to
the potential connection between morphological characteristics and pathogenesis, we
sought to screen and identify morphological mutants in an attempt to identify genes
associated with morphological phenotypes of Borrelia burgdorferi.
Among Borrelia’s unique features is the presence of abundant lipoproteins making up
its cellular membrane as opposed to the typical lipopolysaccharides. These proteins
confer a wide variety of functions to the microorganism, among which include the
abilities to circulate between widely differing hosts and to establish infection. Two
important outer surface proteins, OspC and OspA, are found to be inversely expressed
throughout the borrelial life cycle. OspC, in particular, becomes highly expressed during
tick-feeding and transmission to the mammalian host. It has been found to be essential for
establishment of infection. A global regulatory pathway has been shown to control for
OspC, however there are missing links in this pathway between the external stimuli (such

vi
as temperature, pH, and cell density) and the regulatory pathway. We have performed a
screening process to identify OspC expression mutants in order to identify novel genes
associated with this pathway.
X. Frank Yang, Ph.D. - Chair

vii
TABLE OF CONTENTS
List of Tables.................................................................................................................. ix
List of Figures ................................................................................................................. x
List of Abbreviations ...................................................................................................... xi
Introduction ..................................................................................................................... 1
Lyme Disease History ................................................................................................ 1
Stages, Symptoms, and Treatments ............................................................................ 5
Phylum Spirochaetes and the Borrelia genus ............................................................. 5
Borrelia Morphology ............................................................................................... 10
Enzootic Cycle......................................................................................................... 13
Lipoproteins and OspC ............................................................................................ 17
Transposon Mutagenesis and the Mutant Library ..................................................... 22
Research Goals ........................................................................................................ 26
Materials and Methods .................................................................................................. 28
Bacterial Strains and Culture Conditions ................................................................. 28
Morphology Screening ............................................................................................. 28
OspC Screening ....................................................................................................... 29
Growth Curves......................................................................................................... 29
SDS-PAGEs ............................................................................................................ 30
Cloning .................................................................................................................... 30
Identification of Transposon Insertion Site ............................................................... 31
Statistical Methods................................................................................................... 31

viii
Results ........................................................................................................................... 32
Morphology Screening ............................................................................................ 32
OspC Screening ....................................................................................................... 56
Sequencing and Identification of Tn Insertion Site ................................................... 66
Discussion ..................................................................................................................... 80
Appendices .................................................................................................................... 85
Appendix A ............................................................................................................. 85
References ..................................................................................................................... 96
Curriculum Vitae

ix
LIST OF TABLES
Table 3.1: Identified Morphology Mutants by Type ....................................................... 34
Table 3.2: Measurements and P-values for Elongated Mutants ....................................... 41
Table 3.3: Measurements and P-values of Aggregate Mutants........................................ 47
Table 3.4: List of OspC Expression Mutant Types and Identified Samples ..................... 58
Table 3.5: List of Sequenced Samples and their Transposon Insertion Sites ................... 68
x
LIST OF FIGURES
Figure 1.1: Incidence of Lyme Disease from 1997 to 2017 .............................................. 3
Figure 1.2: Borrelia burgdorferi Strain B31 Genome ....................................................... 8
Figure 1.3: Enzootic Life Cycle of B. burgdorferi and Ixodes ticks ................................ 15
Figure 1.4: RpoN-RpoS Pathway Controlling OspC Expression .................................... 20
Figure 1.5: Transposon Mutagenesis and the pGKT Plasmid ......................................... 24
Figure 3.1: Representative Images of Elongated Mutants ............................................... 37
Figure 3.2: B. burgdorferi Elongated Mutants ................................................................ 39
Figure 3.3: Representative Images of Aggregate Mutants .............................................. 43
Figure 3.4: B. burgdorferi Aggregate Mutants ............................................................... 45
Figure 3.5: Potential B. burgdorferi Growth Mutants ..................................................... 49
Figure 3.6: Individual Growth Curves of Slow-Growing Mutants .................................. 51
Figure 3.7: Representative Images of Defective Spiral Mutants ..................................... 54
Figure 3.8: SDS-PAGEs of Plate 46 Samples ................................................................. 60
Figure 3.9: SDS-PAGE of Potential OspC Deficient Mutants ........................................ 62
Figure 3.10: Conditional SDS-PAGEs of Potential OspC-Lacking Mutants ................... 64
Figure 3.11: Transposon Insertion Sites of Sequenced Mutants ...................................... 71
xi
LIST OF ABBREVIATIONS
BadP – Borrelia host adaptation protein
BadR – Borrelia host adaptation regulator
BosR – Borrelia oxidative stress regulator
BSK – Barbour-Stoenner Kelly
CDC – Center for Disease Control
CheA – Chemotaxis protein CheA
CheB – Chemotaxis protein CheB
CheR – Chemotaxis protein methyltransferase
CheW – Chemotaxis protein CheW
CheX – Chemotaxis protein CheX
CheY – Chemotaxis protein CheY
Cp – Circular plasmid
Cpf – Cells per field
CsrA – Carbon storage regulator A
DbpA – Decorin-binding protein A
DhhP – DHH-DHHA1 domain protein
ECM – Erythema Chronicum Migrans
EM – Erythema Migrans
FlaA – Flagellin A
FlaB – Flagellin B
FlgE – Flagellar hook protein FlgE

xii
FliF – Flagellar M-ring protein
FliG2 – Flagellar motor switch protein
Gen – Gentamycin
Hfq – RNA chaperone protein
Kan - Kanamycin
Kb – Kilobases
LB – Luria-Bertani (media)
Lp – Linear plasmid
LuxS – S-ribosylhomocysteine lyase
MCP – Methyl-accepting Chemotaxis Protein
MotA – Motility protein A
MotB – Motility protein B
OspA – Outer Surface Protein A
OspC – Outer Surface Protein C
PBS – Phosphate buffered saline
pGKT – plasmid Gentamycin Kanamycin Transposase
PTLD – Post-Treatment Lyme Disease
ResT – Telomere resolvase ResT
RpoN – Alternative sigma factor 54
RpoS – Alternative sigma factor S
Rrp2 – Response regulatory protein 2
SD – Standard Deviation
SDS – Sodium Dodecyl Sulfate

xiii
SDS-PAGE – Sodium Dodecyl Sulfate-Polyacrylamide Gel Electrophoresis
Tn - Transposon
Wt – Wild-type

1
INTRODUCTION
Lyme Disease History
Lyme disease is a multi-system inflammatory disorder that is currently the fastest
growing vector-borne disease in the U.S. Lyme disease was initially recognized in Lyme,
Connecticut in 1976 when a large incidence of children was found exhibiting symptoms
of juvenile arthritis. The occurrence of the characteristic bulls-eye rash now associated
with Lyme disease was apparent in 25% percent of the cases (Steere et al, 1977). This led
to an investigation of the disease, with the hypothesis that it was caused by an infectious
agent. Due to the increased prevalence of this disease in rural, wooded areas, it was
further hypothesized that the clinical agent may be transmitted via an arthropod vector
(Steere et al, 1978). Six years later, in 1982, spirochetal bacteria were isolated from the
midgut of an Ixodes tick by Willy Burgdorfer and his research team. At this point,
Borrelia burgdorferi was identified as the disease-causing pathogen (Burgdorfer et al,
1982).
The principal species responsible for infection in the US is Ixodes scapularis,
formerly known as Ixodes dammini, which is responsible for the transmission of disease
in the Northeastern and Upper Midwestern regions of the U.S. Milder forms of Lyme
disease may be found on the western coast, which are caused by Ixodes pacificus
(Schmid, 1985) (Figure 1.1A, 1.1B). A dramatic geographical expansion of reported
Lyme disease cases, particularly in the Northeast and Midwestern regions, can be seen in
Figures 1.1A and 1.1B. Lyme disease also occurs in Europe and parts of Asia and Africa,
with I. persulcatus the major tick vector in Eastern Europe and Asia and I. ricinus a
major vector in Northern Europe and Africa (Gray, 1998).

2
The initial incidence of Lyme disease in the United States was low but as knowledge
of the disease expanded and detection methods improved, the reports of the disease have
markedly increased. Lyme disease became a reportable disease in the U.S. in 1991 with
an original incidence of 9465 cases per year. Over the last 30 years, incidence rates have
nearly tripled with approximately 30,000 confirmed cases in 2017 (Figure 1.1C).
Additionally, two studies performed by the CDC suggest that that Lyme disease
diagnoses may be closer to 300,000 per year (CDC, 2018).

3
A
B
C

4
Figure 1.1: Incidence of Lyme Disease from 1997 to 2017
A, geographical incidence of Lyme Disease by county of residence in 2001. B,
geographical incidence of Lyme Disease by county of residence in 2017. C, confirmed
and probable cases reported per year to CDC from 1997 to 2017.
Source: CDC Lyme disease maps – Historical data; CDC Lyme disease chart and figures
– Historical data

5
Stages, Symptoms, and Treatments
There are three defined stages of the infection. The initial stage of the disease is
characterized by a localized infection found at the site of the tick bite. This stage typically
presents as a characteristic bulls-eye rash, known as erythema migrans (EM) and flu-like
symptoms. The next stage of the infection is disseminated infection, which occurs when
the bacteria has spread to the circulatory system. Symptoms of this stage include
secondary erythema migrans, which arises in areas of the body unassociated with tick bite
site, and flu-like symptoms. If left untreated, Borrelia can localize into many different
organs throughout the body. This stage is referred to as late or persistent infection and
most commonly results in Lyme arthritis (Wright et al, 2012). However, rarer and more
severe symptoms can occur such as myocarditis and neuroencephalitis (Burgdorfer, 1991;
CDC, 2018; Cooke and Dattwyler, 1992; Steere, 2001; Steere et al, 2004).
Treatment is available for Lyme disease. This is typically an intense antibiotic
regimen consisting of Doxycycline, Amoxicillin, and/or Cefuroxime axetil. Antibiotics
usually are taken for several weeks/months (CDC, 2018). However, another rare stage
can occur, known as Post-Treatment Lyme Disease syndrome or Chronic Lyme disease,
in which recurring Lyme disease symptoms appear in patients who have already
undergone Lyme disease treatment (Marques, 2008; Steere et al, 2004). Little is known
about this syndrome and studies are currently being done to understand it.
Phylum Spirochaetes and the Borrelia genus
Borrelia burgdorferi lies within the family Spirochaetes, a unique and
phylogenetically distinct group of bacteria. This family contains the well-known

6
pathogens Treponema pallidum, the causative agent of syphilis, and Leptospira
interrogans, the causative agent of leptospirosis (McBride et al, 2005; Radolf, 1996;
Tilly et al, 2007). The most distinctive feature of this group of bacteria is their spiral or
wavelike morphology (Tilly et al, 2007). This spiral morphology is believed to confer
increased speed and motility for the bacteria and allow for movement within more
viscous environments (Motaleb et al, 2015; Yang et al, 2016). The bacteria within this
family are also interesting because they are extremely invasive but contain little to no
known toxins (Fraser et al, 1997; Hyde et al, 2011a). Based on this, it is believed that the
pathogenesis is due to bacterial burden and the host immune response rather than
bacterial toxicity (Fraser et al, 1997; Steere, 2001).
Borrelia burgdorferi is a bloodborne, microaerophilic, obligate parasite. They can
range from 4 to 30um in length and .2 to .3 um in helices width (Johnson et al, 1984;
Barbour, 1986). They are considered gram-negative-like spirochetes due to their similar
dual-membrane system. However, they differ widely from true gram-negative bacteria
because they do not contain lipopolysaccharides in their membrane (Takayama et al,
1987). Instead, they contain abundant lipoproteins (Fraser et al, 1997). Furthermore, they
contain an endoflagella, as opposed to the typical external flagella, that resides in the
periplasmic space and is attached to both ends of a protoplasmic cylinder. The flagella
are composed of seven flagellar proteins that are wrapped around the protoplasmic
cylinder, providing its unique spiral shape as well as its motility (Johnson, 1977; Barbour,
1986; Sultan et al, 2013). B. burgdorferi also exist solely within an enzootic cycle
featuring Ixodes ticks as the vector and small vertebrates, typically mammals and birds,
as hosts (Radolf et al, 2012).

7
The Borrelia genome consists of 1 linear chromosome and up to 21 linear and circular
plasmids, typically with 12 linear and 9 circular. The linear chromosome is
approximately 910 kb in size while the plasmids range from 5 to 56 kb (Fraser et al,
1997; Casjens et al, 2002). Only the linear chromosome and one circular plasmid, cp26,
are essential for borrelial growth (Chaconas and Kobryn, 2010; Kobryn and Chaconas,
2002); however, the plasmids cp26, cp32, lp25, lp28-1, and lp54 have been shown to be
essential within the enzootic cycle (Labandeira-Rey and Skare, 2001; Purser et al, 2003;
Stewart et al, 2004a)(Figure 1.2). Because several of the plasmids are not essential for
basic borrelial growth, in vitro propagation can lead to spontaneous loss of some
plasmids, which can make genetic work difficult (Rosa et al, 2005). While the entirety of
the B. burgdorferi genome has been sequenced, approximately 30% of the chromosome
and much of the plasmids shared no significant homology with any previously identified
genes (Fraser et al, 1997; Brisson et al, 2012), indicating areas of interest for future
genetic work for Borrelia.

8

9
Figure 1.2: Borrelia burgdorferi Strain B31 Genome.
All plasmids from the B. burgdorferi strain B31 genome. All plasmids essential for
virulence are indicated in red. The remaining plasmids are unessential for virulence,
though the chromosome and cp26 are essential for survival, and are indicated in green.
Source: Stewart et al, 2004a.

10
Borrelia Morphology
Cell shape has been shown to contribute to bacterial pathogenesis. For instance, the
curvature of Caulobacter crescentus was found to enhance colonization within aquatic
environments with moderate flow in comparison to a rod-shaped version (Persat et al,
2014). Flagella are also important contributors to an organism’s pathogenesis. Both the
number and location of the flagella can affect the speed and the form of movement of a
microbe, conferring a variety of potential advantages and disadvantages to its
pathogenicity. For example, having multiple flagella may allow a pathogen to maneuver
more quickly through its environment as opposed to a uniflagellar organism (Yang et al,
2016). Spiral shapes are believed to allow greater motility and speed for bacteria in more
viscous environments (Motaleb et al, 2015; Yang et al, 2016), which would be ideal for
bloodborne pathogens such as B. burgdorferi.
Since its discovery, many studies have attempted to understand the mechanisms
responsible for the morphology of B. burgdorferi. Borrelia contains a bundle of 7 to 11
periplasmic flagella that are wrapped around the protoplasmic cylinder and attached at
the two ends of the protoplasmic cylinder (Barbour and Hayes, 1986; Charon and
Goldstein, 2002). Due to its unique placement in the cell, the borrelial flagella is
responsible for both cell shape and cell motility (Motaleb et al, 2000). This tight
connection between cell shape and motility can make it difficult to identify genetic
factors responsible for specific morphological characteristics.
With advancement in genetic tools, parts of this morphological system have been
elucidated. As of 2013, 24 genes had been identified associated with the flagella,
chemotaxis, motility, or overall morphology gene regulation (Charon et al, 2012). FlaB, a

11
major flagellar filament protein, and FlaA, a minor flagellar filament protein, are
important contributors to the flagellar makeup. FlaB in particular created straight rod
phenotypes when mutated and was non-motile (Charon and Goldstein, 2002; Charon et
al, 2012; Ge et al, 1998; Motaleb et al, 2000). Other genes important for imparting spiral
shape and motility to the organism were flgE, fliF, and fliG2 (Charon and Goldstein,
2002; Li et al, 2010; Sal et al, 2008). A carbon storage regulator gene, csrA, is
responsible for repressing FlaB and causes straight rod phenotype and elongation of cells
when overexpressed (Sze et al, 2012).
B. burgdorferi also contain several copies of chemotaxis genes typically found in
other bacteria, including 6 mcp, 2 cheA, 3 cheY, 2 cheB, 2 cheR, and 3 cheW genes
(Charon et al, 2012; Fraser et al, 1997). Of these, the known borrelial chemotaxis
pathway currently consists of MCPs, CheW3, CheA2, CheY3, and CheX. CheA2
phosphorylates CheY3, a key chemotaxis response regulator, to form CheY3-P. CheX,
identified as essential for chemotaxis, is responsible for dephosphorylating CheY3-P
(Charon et al, 2012; Motaleb et al, 2005; Motaleb et al, 2011). Two genes, motA and
motB, are responsible for forming part of the motor complex and are both essential for
motility in B. burgdorferi (Sultan et al, 2015).
A variety of other factors are involved in Borrelia morphology. Elongated cells can
arise naturally when cells get old or when they are in nutritionally inadequate media
(Barbour and Hayes, 1986). Several genes have been linked to a variety of other
morphological phenotypes as well. CsrA mutants resulted in organisms that not only had
flat-wave morphology but were elongated. The periplasmic flagella from these mutants
were tightly bound to the protoplasmic cylinder and is a potential explanation for why

12
longer cells tend to have flat-wave shape with small wavelength and less amplitude (Sze
et al, 2011; Charon et al, 2012). Hfq, a global regulatory RNA-binding protein, and
DhhP, a DHH-DHHA binding protein, have both been implicated as elongation-causing
mutants (Lybecker et al, 2010; Ye et al, 2014).
While several plasmids have been noted as essential for virulence, only the
chromosome and cp26 have been required for basic borrelial growth in vitro. Originally,
only the resT gene was identified as essential for growth, as it was responsible for
encoding the telomere resolvase gene (Byram et al, 2004). Hfq and DhhP have recently
been shown to either significantly enhance borrelial growth or be essential for growth
(Lybecker et al, 2010; Ye et al, 2014).
B. burgdorferi has been seen forming biofilm-like aggregates, typically well into
stationary phase. Thus far, these aggregates have not been shown to confer any
advantages or disadvantages in clinical consequences; however, there are speculations
that these aggregates may enhance the binding of the pathogen to host tissues or may
contribute to spirochetal successful transmission to the mammalian host and to ensuing
disease (Barbour and Hayes, 1986; Dunham-Ems et al, 2009; Merilainen et al, 2015).
This biofilm-like aggregation may also play an important role in neuroborreliosis (Di
Domenico, 2018). Not much has been shown conclusively to explain the mechanisms or
purpose behind these aggregates, but it is believed that the RpoN-RpoS-LuxS pathway is
responsible for controlling aggregate formation. Mutations in all three of these genes led
to the formation of smaller, looser aggregates than Wild-type (Di Domenico, 2018; Sapi,
2016). This pathway will be described in greater detail at a later point.

13
Enzootic Cycle
B. burgdorferi exists within an enzootic cycle consisting of Ixodes tick vectors and a
variety of hosts, including small mammals, birds, and deer. There are several species
responsible for transmission of B. burgdorferi and Lyme disease throughout the world;
however, the main agent for transmission in the U.S. is Ixodes scapularis, the
blacklegged or deer tick. Infection occurs predominantly in the Northeastern and
Midwestern U.S. with 95% of infections occurring in 14 states consisting of Connecticut,
Delaware, Maine, Maryland, Massachusetts, Minnesota, New Hampshire, New Jersey,
New York, Pennsylvania, Rhode Island, Vermont, Virginia, and Wisconsin (Figure 1.1A,
1.1B). Ixodes pacificus, a species found on the Western coast of the US, has been found
to transmit Lyme disease on rare occasions (only 1% rate of infection) (CDC, 2019).
The cycle for Borrelia features small mammals and birds as reservoir hosts, but large
vertebrates such as domesticated pets and humans who become infected are considered
accidental hosts as they typically prevent both the tick and the Borrelia from continuing
through the cycle. Because Borrelia is not transmitted transovarially, larval ticks hatch
from the eggs borrelia-free (Figure 1.3). During the late spring and early summer, the
larval ticks have their first blood meal. If they feed on a reservoir host containing the
bacteria, they become a vector. After this first blood meal, the larvae drop to the ground
and molt into nymph forms. In the following spring, the nymph has a second bloodmeal.
The typical hosts for this bloodmeal are small mammals and birds, creating a reservoir
host that is unaffected by the bacteria. However, humans that get bitten by the infected
tick get infected and become accidental hosts. After this bloodmeal, the nymphal tick
drops to the ground and molts into an adult tick. In the fall, the adult tick seeks a deer to

14
use as both a third bloodmeal and a breeding ground. After this bloodmeal, they drop to
the ground, lay eggs, and the cycle begins again (Radolf, 2012) (Figure 1.3).

15

16
Figure 1.3 Enzootic Life Cycle of B. burgdorferi and Ixodes ticks
Ixodes tick larvae hatch spirochete-free and feed on first host. Feeding on a spirochete
reservoir host results in the creation of a Borrelia-containing tick vector. After molting
into nymph form, a second feeding occurs which creates more reservoir hosts or an
infection in an accidental host. The ticks then molt into adults, feed on the third host, and
breed.
Source: Radolf et al, 2012.
17
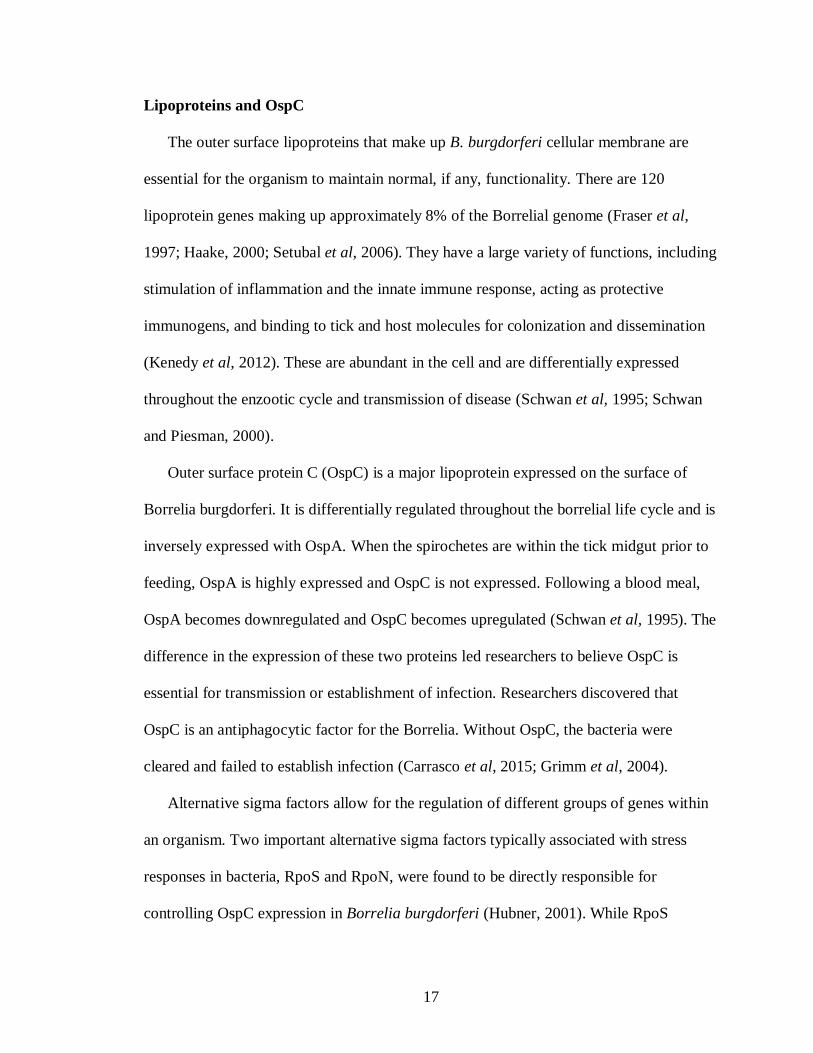
Lipoproteins and OspC
The outer surface lipoproteins that make up B. burgdorferi cellular membrane are
essential for the organism to maintain normal, if any, functionality. There are 120
lipoprotein genes making up approximately 8% of the Borrelial genome (Fraser et al,
1997; Haake, 2000; Setubal et al, 2006). They have a large variety of functions, including
stimulation of inflammation and the innate immune response, acting as protective
immunogens, and binding to tick and host molecules for colonization and dissemination
(Kenedy et al, 2012). These are abundant in the cell and are differentially expressed
throughout the enzootic cycle and transmission of disease (Schwan et al, 1995; Schwan
and Piesman, 2000).
Outer surface protein C (OspC) is a major lipoprotein expressed on the surface of
Borrelia burgdorferi. It is differentially regulated throughout the borrelial life cycle and is
inversely expressed with OspA. When the spirochetes are within the tick midgut prior to
feeding, OspA is highly expressed and OspC is not expressed. Following a blood meal,
OspA becomes downregulated and OspC becomes upregulated (Schwan et al, 1995). The
difference in the expression of these two proteins led researchers to believe OspC is
essential for transmission or establishment of infection. Researchers discovered that
OspC is an antiphagocytic factor for the Borrelia. Without OspC, the bacteria were
cleared and failed to establish infection (Carrasco et al, 2015; Grimm et al, 2004).
Alternative sigma factors allow for the regulation of different groups of genes within
an organism. Two important alternative sigma factors typically associated with stress
responses in bacteria, RpoS and RpoN, were found to be directly responsible for
controlling OspC expression in Borrelia burgdorferi (Hubner, 2001). While RpoS

18
typically acts as a stress response regulator in many bacteria, it does not in the case of B.
burgdorferi. However, it does control the expression of key lipoproteins and virulence
factors within the genome, including ospC, dbpA, and luxS (Caimano et al, 2004; Hubner
et al, 2001; Sapi et al, 2016), allowing it to affect many aspects of the organism’s
infectivity and possibly morphology. In turn, RpoS expression is directly controlled by
alternative sigma factor 54, or RpoN, both of which are required to establish infection in
mammals (Fisher et al, 2005; Hubner et al, 2001; Smith et al, 2007) (Figure 1.4).
Various other proteins have been identified that help regulate this pathway. Borrelia
oxidative stress response regulator (BosR) is a Zn-dependent transcriptional activator that
activates rpoS transcription by binding to an upstream promoter site (Boylan et al, 2003;
Hyde et al, 2009; Ouyang et al, 2009; Ouyang et al, 2011). It works in concert with
response regulatory protein 2 (Rrp2), a σ54-dependent transcriptional activator, to
transcriptionally activate RpoS expression (Blevins et al, 2009; Boardman et al, 2008;
Burtnick et al, 2007; Yang et al, 2003). Borrelia host adaptation regulator, BadR, is more
highly expressed in conditions similar to the midgut of unfed ticks and become
downregulated in conditions mimicking fed ticks. This protein was the first identified
transcriptional repressor of the RpoN-RpoS pathway (Miller et al, 2013) (Figure 1.4).
Mutations in the BadR gene were associated with failure to colonize in mice, growth
defects in in vitro conditions, and increases levels of RpoS, BosR, OspC, and DbpA,
indicating its potential role as a repressor of the RpoN-RpoS pathway (Miller et al, 2013).
Overall, the RpoN-RpoS pathway and OspC expression are regulated by external
stimuli including temperature, CO2, cell density, pH, growth rate, and presence of blood,
nutrients, metals, host signals. Lower temperatures, higher pH, and lower cell densities

19
are associated with the midgut of an unfed tick, at which point the RpoN-RpoS pathway
and the associated virulence factors are downregulated. As these external stimuli shift to
match that of a fed tick, featuring higher temperature, lower pH, and increasing cell
densities, the expression levels of the RpoN-RpoS pathway and its targets become
elevated (Yang et al, 2002). Despite the increasing knowledge of the pathway controlling
OspC expression, no genetic factors have been found that link these external stimuli with
their expression-modifying effects.

20

21
Figure 1.4: RpoN-RpoS Pathway Controlling OspC Expression
The RpoN-RpoS pathway is directly responsible for controlling levels of OspC.
Expression levels are controlled by RpoS, which in turn is directly activated by RpoN.
This pathway has two known activators, BosR and Rrp2, and one known
repressor, BadR. There is currently no known factor connecting the environmental
stimuli with this pathway.
Source: Dr. Frank Yang

22
Transposon Mutagenesis and the Mutant Library
Novel genetic tools have allowed researchers to delve deeper into genomic and
proteomic studies of Borrelia. Transposon mutagenesis was used to create a mutant
library of Borrelia burgdorferi in order to perform screening analyses. Strain B31
contains restriction and modification enzymes on plasmids lp25 and lp56, causing
reduced transformation efficiency. These plasmids are still required for infectivity so
strain 5A18NP1 was engineered to contain these plasmids while lacking the
restriction/modification enzymes, allowing for higher transformation efficiency (Stewart
and Rosa, 2008).
Cultures of this B. burgdorferi strain underwent transformation with an engineered
plasmid called pGKT. This pGKT plasmid contains a mariner-based transposase
gene, himar1, followed by a Kanamycin resistance marker (Figure 1.5B). These two
genes are located outside of the two inverted terminal repeats that demarcate the
transposon sequence of the plasmid. Within this transposon sequence lies a Gentamycin-
resistance marker, aacC1, and a high-copy origin of replication, ColE1 (Figure 1.5B). At
this stage, the transposase will work to insert the plasmid into the borrelial genome at a
random site. Upon transposition into the genome, himar1 and kan become spliced out
while conferring Gentamycin resistance and the high-copy origin of replication, ColE1.
This plasmid design allows for a single transposon mutagenesis to occur randomly within
the borrelia genome (Stewart et al, 2004; Stewart and Rosa, 2008). Using this method, a
library of B. burgdorferi mutants could be created and used for further genetic analysis.
Using a limiting dilution, calculated to obtain approximately 1 mutant per well, the
samples were aliquoted into 96-well plates and grown in BSKII media. Over time, any

23
wells contain successfully transformed and mutagenized borrelia should have changed
from red to yellow. These samples were then taken and placed into another 96-well plate.
The library consists of 72, 96-well plates.
Upon identification of a successful mutant transformant, the transposon sequence can
be isolated from the mutant and transformed into E. coli, where ColE1 will enable the
bacteria to express the gentamycin-resistance gene. Conferring gentamycin-resistance
allows for antibiotic selection of both mutagenized borrelia sample and E. coli
transformed with the transposon-containing plasmid. This plasmid can be isolated from
the E. coli sample. Sequencing of the plasmid should consist of the transposon sequence
as well as flanking regions from the borrelial genome, allowing identification of the
transposon insertion site into the borrelial genome (Figure 1.5A) (Stewart et al, 2004;
Stewart and Rosa, 2008).

24
A B

25
Figure 1.5: Transposon Mutagenesis and the pGKT Plasmid
A, the engineered plasmid is transformed into B. burgdorferi. The transposon is
inserted randomly into the genome while the transposase and kan genes are spliced out.
DNA is extracted from the mutants of interest, digested with restriction enzyme, ligated
to form plasmids. These are transformed into E. coli to be isolated and sequenced. B, the
pGKT plasmid engineered for creation of the mutant library. This plasmid is used in
place of pMargent, shown in Figure 1.5A.
Source: Stewart et al, 2004; Stewart and Rosa, 2008

26
Research Goals
Using the extensive mutant library created by former lab members, our lab seeks to
execute two different research goals. The first is to identify novel genes responsible for B.
burgdorferi morphology. While some factors have been identified relating to the shape,
movement, and aggregation of the borrelial spirochetes, there is much left to be
understood. Furthermore, there is evidence that morphological characteristics of bacteria
can contribute to the pathogenesis of an organism. Our aim is to observe and confirm
morphological mutants within the mutant library and identify the genes responsible for
the given phenotype. The phenotypes that we can expect to see are elongated,
decrease/lack of spiral, altered motility, enhanced aggregation, slow-growing, or any
combination of those listed. In our search for novel morphology-related genes, it is likely
that previously identified genes will arise in this screening process. These genes include
those described previously: flaB, flaA, flgE, fliF, fliG2, and csrA for defective spiral
mutants; mcp, cheW, cheA, cheY, cheX, motA, and motB for motility mutants; csrA, hfq,
and DhhP for elongated mutants; and rpoN, rpoS, and luxS for aggregate mutants.
The second goal is to identify novel genes associated with the control of OspC
expression. OspC has been identified as an antiphagocytic factor that is essential for
establishing Lyme disease infection in mammals. It is in our interest to find and
understand the mechanisms involved in regulating this protein. As discussed previously,
the RpoN-RpoS regulatory pathway is directly responsible for OspC expression levels
(Figure 1.4). Additional regulators, such as BadR, BosR, and rrp2, have been found to
activate or repress this pathway. However, no links have been found between this
pathway and the environmental stimuli that affect it. We hope to find not only novel

27
RpoN-RpoS-associated factors but genetic factors responsible for linking the external
stimuli, such as temperature and pH, to this expression pathway.

28
MATERIALS AND METHODS
Bacterial Strains and Culture Conditions
Strain 5A18NP1 was engineered to lack restriction/modification enzymes found in
B31. 5A18NP1 is the parent strain of the mutant library and is used as the Wild-type (Wt)
sample in all experiments. BSK-II media from Barbour et al (1984) was used to culture
B. burgdorferi. Cultures were made with or without Gentamycin and Kanamycin and at
pH 7 or pH7.5, depending on purpose. All cultures were incubated at 37°C. Samples for
morphology screening were grown for approximately 3 days in 1.8 mL of pH 7.5 BSKII
with no antibiotics. After morphology checks, half of each sample was saved to make
backstock. The remaining half was combined in 1:1 ratio with fresh BSKII (pH 7, with
Gen and Kan) and grown for 5-7 days or until stationary phase. All stock samples of B.
burgdorferi were stored in 15% BSKII-glycerol. DH5α competent cells were used for E.
coli transformation. E. coli cultures were grown in LB media or on selective LB agar
plates.
Morphology Screening
Dark field microscopy was used to observe borrelial phenotypes. All microscopy
observations and imaging were performed at 40x using OlympusTM BX43 and
OlympusTM CX41 microscopes. 6.8uL of sample was placed on glass microscope slide.
Infinity AnalyzeTM was used to obtain and analyze images. Cell concentrations were
determined by counting cells in field and multiplying by a constant of 3x10⁵. Possible
morphology results include elongated mutants, defective/lost spiral, decreased motility,
increased motility, aggregates, and slow-growing mutants.

29
OspC Screening
The samples from the morphology screenings were grown for 5-7 days until the
samples reached stationary phase. At this point they were harvested via centrifugation at
8000 x g for 10 minutes in a tabletop centrifuge. The supernatant was discarded, and the
cell pellets were washed in 500 ul of 1x PBS buffer. The centrifugation and wash steps
were repeated once. After final centrifugation, the PBS was removed, and the cell pellet
was re-suspended in 50 ul of 1x SDS buffer. The samples were then boiled in 100°C
water for 5 minutes. The boiled samples were spun down for 1 min to collect any
condensation and to ensure full dissolution of the pellet.
SDSPAGEs were performed using precast 12% polyacrylamide gels. Samples were
loaded at 12 ul each. 3ul of ladder was loaded. Gels were run at 15 mA per gel. Gels were
removed from casing and stained with Coomassie blue stain for 15-60 minutes. Gels were
removed from stain and placed in de-stain buffer for 2-14 hours. Gels imaged using an
HP Scanjet 4890 scanner. Identified mutants were tested again under differential
conditions: pH 7-high density, pH 7.5-high density, and pH 7.5-low density.
Growth Curves
Growth curves were created by reviving samples in BSKII media. Upon reaching a
desirable cell concentration, they were re-inoculated into 1.8mL of media at a starting
concentration of 1x10⁴ cells/ml. Samples were observed every day. Resulting counts are
the averages of 10 fields of view. Statistical analysis was performed using GraphPad
Prism 8.0TM.

30
SDS-PAGEs
Samples were revived in 1.8 mL of pH 7.5 BSKII media. Once reaching a desirable
concentration for re-inoculation, Borrelial samples were re-inoculated at a 1:1 ratio into
pH 7 BSKII media containing Gentamycin and Kanamycin. Samples were grown well
into stationary phase to induce OspC expression. Pellets were harvested by centrifugation
at 8000 x g for 10 minutes and washed twice with 500 uL of 1x PBS buffer. Washed
pellets were re-suspended in 50 uL of 1x SDS buffer and placed in 100C water for 5
minutes. Samples identified as potential OspC mutants followed this same procedure
except they were re-inoculated under 3 different conditions: pH 7.5 high concentration,
pH 7.5 low concentration, and pH 7.5 high concentration.
12 uL samples for SDS-PAGEs were loaded into precast gels (Bio-Rad, 12%, 15-
well) and run at 15mA/well for approximately an hour. Gels for SDS-PAGE were
removed from cassette and stained with 1x SDS stain for 15 minutes. Then SDS stain was
removed and the gels were placed in de-stain buffer for approximately 2-4 hours. Images
were obtained using desktop scanner.
Cloning
Identified mutant samples were revived in 1.8 mL of BSKII media. Upon reaching
appropriate concentration for re-inoculation, 1 mL of sample was inoculated into 40 mL
of BSKII containing Gentamycin and Kanamycin. Samples were grown for
approximately 4-5 days, or until sample reaches mid to late log phase. Samples were
harvested by centrifugation at 8000 x g for 10 minutes. Genomic DNA was extracted
using Wizard Genomic DNA extraction kit (Promega). DNA concentrations were

31
determined using nanodrop. Using the appropriate amount of gDNA, Genomic DNA was
digested with HindIII-HF restriction enzyme at 37°C for 2.5 hours.
The digested product was purified using phenol-chloroform extraction. Digested
fragments were ligated using T4 Ligase. The ligated product was transformed into
competent DH5α E. coli cells and plated on selective LB plates containing Gentamycin.
After overnight incubation, a colony is isolated and inoculated into 5 ml LB media and
grown overnight. The E. coli was harvested via centrifugation and underwent miniprep
using Thermo Fisher GeneJET Miniprep KitTM. The plasmid DNA is then sent for
sequencing using flg and col primers.
Identification of Transposon Insertion Site
Flg and col reads contain sequences from the regions flanking the transposon
insertion. Sequencing reads were analyzed using NCBI Blast and compared to identify
the Tn insertion site. NCBI Blast was also used to identify the gene in which the Tn was
inserted.
Statistical Methods
All statistical analyses were made using GraphPad Prism 8.0TM. Unpaired t-tests were
used on all length, aggregate, and growth curve mutants. All p-values for the identified
mutants can be found in the Results section.

32
RESULTS
Morphology Screening
Former members of the lab performed multiple transposon mutagenesis procedures
on Borrelia burgdorferi cultures and the resulting transformants were isolated and
transferred to wells within 96-well plates. They formed a substantial mutant library
consisting of 72 96-well plates. During the project described here, a total of 14 of these
plates were screened resulting in approximately 1350 individual samples undergoing
screening. From these, 85 samples have been noted as potential morphology mutants. 37
of these samples have been double-checked and have undergone the appropriate analyses
to confirm their phenotype, while 48 remain unconfirmed (Table 3.1).
The potential morphology mutations are Elongated, Defective spiral, Decreased
motility, Increased motility, Aggregate, or Slow-growing. Elongated mutants and
aggregate mutants were identified visually and confirmed using t-tests (Figures 3.1 –
3.4). All length measurements and statistical values for elongated mutants are detailed in
Table 3.2. All measurements and statistical values for aggregate mutants are detailed in
Table 3.3. Figure 3.5 shows growth curve results of several potential slow-growing
mutants. This initial test eliminated all but six of the tested samples as potential mutants.
These samples were initially identified as either “slow-to-grow” mutants, indicating a
mutant that initially grew slowly but increases in growth rate partway through the curve,
or “failure to thrive” mutants, indicating mutants that grew much more slowly throughout
the curve and/or failed to reach stationary phase. Through statistical analysis, we
discovered that all the “slow-to-grow” mutants (1E10, 5C2, and 48G5) were only
statistically different from wild-type on 1 or 2 of the twelve-day curve and none of which

33
were at the beginning of the growth curve. Though the statistics marked a small
difference, the phenotype was not strong enough for us to pursue further processing of
these mutants. The remaining mutants (1B5, 48G9, and 52G10) had growth curves that
clearly differed from the Wt and so were confirmed as slow-growing mutants (Figure
3.6).
Defective spiral mutants were defined as mutants whose spiral shape appeared
reduced or lost. Many of the defective spiral morphologies were found in tandem with
elongated phenotype and occasionally appeared in segments rather than throughout the
organism. Images were obtained of these samples; however higher magnification is
needed to perform adequate analysis on these samples (Figure 3.7).
Increased and decreased motility mutants are defined as mutants who appear to move
or “twitch” at rates higher or lower than typical Wt mutants. Motility mutants have not
yet undergone any quantitative analysis and thus are only identified on a visual basis.
They are listed here only as a list of potential mutants. It should be noted that several
samples have been identified as having combinations of mutant phenotypes. Thus, all
mutants conveying any defective spiral or motility morphologies have not been fully
confirmed, though their lengths and aggregate morphologies may have been.

34
Morphology Samples Total Samples
confirmed
Total
confirmed
Samples unconfirmed Total
unconfirmed
Elongated 1A8, 1H12, 2D1, 2E7,
3B5, 3D10, 3E8, 3H2,
5D2, 5D4, 5F11, 7D8,
7D11, 7H11, 45F12,
45H11, 46F5, 46F10,
47B3, 48C1, 52D9,
52H8, 54E3, 54G1, 56E9,
62A6, 62B2, 62C4, 62G5,
62H4
30 1A8, 1H12, 2D1,
2E7, 3E8, 3H2,
5D2, 5D4, 5F11,
7D8, 7D11, 7H11,
46F5, 47B3, 48C1,
52H8, 56E9
17 3B5, 3D10, 45F12, 45H11,
46F10, 52D9, 54E3, 54G1,
62A6, 62B2, 62C4, 62G5,
62H4
13
Defective Spiral 3E12, 28B8, 28E12,
62C7, 62C8
5 N/A 0 3E12, 28B8, 28E12, 62C7,
62C8
5
Decreased
motility
3C6, 52A11 2 N/A 0 3C6, 52A11 2
Increased
motility
1E12, 2B1, 3E9, 28C4,
45C7, 45H9, 47G11,
56F9, 62C5, 62F6
10 N/A 0 1E12, 2B1, 3E9, 28C4,
45C7, 45H9, 47G11, 56F9,
62C5, 62F6
10
Aggregate 1G4, 45B3, 47E11 3 1G4, 45B3, 47E11 3 N/A 0
Slow-growing 1E10, 5C2, 7B12, 47A9,
48H5, 54A1, 54A2
7 1E10, 5C2, 48H5 3 7B12, 47A9, 54A1, 54A2 4
Elongated and
Defective spiral
2H1, 3B4, 3E5, 3F3,
3F10, 7F7, 7F10, 45D5,
45D7
9 2H1, 3F10, 45D5,
45D7
4 3B4, 3E5, 3F3, 7F7, 7F10 5
Elongated and
Aggregate
7A10, 54G6, 54H10,
56A12, 56D12, 62A5,
62B6, 62C6
8 7A10, 62A5, 62C6 3 54G6, 54H10, 56A12,
56D12, 62B6
5
Elongated and
Slow-growing
1B5, 2C1 2 1B5 1 2C1 1
Defective spiral 28C11, 62D5 2 N/A 0 28C11, 62D5 2

35
and Increased
Motility
Defective spiral
and Decreased
motility
48D4 1 N/A 0 48D4 1
Elongated,
Defective
Spiral, and
Decreased
Motility
5G11 1 5G11 1 N/A 0
Elongated,
Defective
Spiral, and
Aggregate
56F5, 56H2 2 56F5, 56H2 2 N/A 0
Elongated,
Defective
Spiral, and
Slow-growing
5A7, 48G9, 52E10 3 5A7, 48G9, 52E10 3 N/A 0
TOTAL: 85 37 48

36
Table 3.1: Identified Morphology Mutants by Type
All potential morphology mutants categorized by type and marked as confirmed or unconfirmed. Samples that have undergone
sequencing are listed in bold.

37
A C E
B D F

38
Figure 3.1: Representative Images of Elongated Mutants
A and B, images of wild-type strain, 5A18NP1, with and without measurements. C and E, elongated mutants 1B5 and 46F10,
without measurements. D and F, elongated mutants 1B5 and 46F10 with measurements.

39

40
Figure 3.2: B. burgdorferi Elongated Mutants
Dot plot representing the length measurements, means, and SDs of the Wt (5A18NP1) and identified elongated samples. All
samples listed were compared with the Wt samples via t-test and had p-values lower than .05. All numerical data can be found in
Appendix A.

41
Sample Avg Length (µm) n p-value *
Wt 18.16 94 N/A N/A
1A8 33.01 22 <0.0001 ****
1B5 29.50 38 <0.0001 ****
1H12 52.40 5 <0.0001 ****
2D1 55.26 6 <0.0001 ****
2E7 35.07 6 <0.0001 ****
2H1 57.49 9 <0.0001 ****
3E8 23..47 10 .0100 *
3F10 51.63 13 <0.0001 ****
3H2 43.87 11 <0.0001 ****
5A7 108.1 3 <0.0001 ****
5D2 35.47 6 <0.0001 ****
5D4 31.03 17 <0.0001 ****
5F11 32.99 5 <0.0001 ****
5G11 27.76 7 .0003 ***
7A10 181.4 6 <0.0001 ****
7D8 59.96 5 <0.0001 ****
7D11 75.89 3 <0.0001 ****
47B3 22.98 20 .0011 **
45D5 47.82 5 <0.0001 ****
45D7 41.69 14 <0.0001 ****
46F5 43.99 15 <0.0001 ****
48C1 50.83 19 <0.0001 ****
48G9 43.66 14 <0.0001 ****
52E10 49.95 10 <0.0001 ****
52H8 48.57 28 <0.0001 ****
56E9 40.61 14 <0.0001 ****
56F5 29.29 56 <0.0001 ****
56H2 35.08 33 <0.0001 ****
62A5 30.83 89 <0.0001 ****
62C6 36.05 16 <0.0001 ****

42
Table 3.2: Measurements and P-values for Elongated Mutants
All elongated mutants were measured using Infinity AnalyzeTM and statistics analyses
were performed using GraphPad Prism 8.0.

43
A C E
B D F

44
Figure 3.3: Representative Images of Aggregate Mutants
A and B, images of wild-type strain, 5a18NP1, with and without measurements. C and E, aggregate mutant strains 1G4 and 47E11
without measurements. D and F, aggregate mutant strains 1G4 and 47E11 with measurements.

45

46
Figure 3.4: B. burgdorferi Aggregate Mutants
Dot plot representing the measurements, means, and SDs of the diameters of the
Borrelial aggregates. All samples listed were compared with Wt (5A18NP1) via t-test.
Not all samples had p-values lower than .05. Samples considered significant are marked
with * and **. All numerical data can be found in Appendix A.

47
Sample Diameter (um) n P-value *
Wt 7.19 3 N/A N/A
1A8 9.28 2 .3914 N/A
1B5 19.86 2 .0342 *
1G4 18.83 2 .0086 **
3F10 13.16 2 .1557 N/A
3H2 9.88 2 .2684 N/A
7D9 14.84 6 .1250 N/A
45B3 27.12 4 .0023 **
47B5 19.10 8 .0643 N/A
47E11 31.34 6 .0133 *
56F5 15.43 6 .0436 *
62A5 19.90 8 .0158 *
62C6 15.92 14 .1021 N/A

48
Table 3.3: Measurements and P-values of Aggregate Mutants
All aggregate mutants were measured using Infinity AnalyzeTM and statistics analyses
were performed using GraphPad Prism 8.0.

49
.

50
Figure 3.5: Potential B. burgdorferi Growth Mutants
Growth curve data of all samples originally identified as slow-growing mutants. Not
all samples tested presented mutant phenotype. Slow-growing mutants identified from
this experiment are represented in individual growth curves in Figure 3.4.

51
51

52
52

53
53
Figure 3.6: Individual Growth Curves of Slow-Growing Mutants
The growth curves of the possible slow-growing mutants were isolated from the curves in Figure 3.3. From these we identified
which samples showed strong slow-growing phenotype. Samples 1B5, 48G9, and 52E10 differ significantly from the Wt curve and is
the most noticeable during the mid- to late-stages of the curve. 1E10, 5C2, and 48H5, however, are only noted to be statistically
different on Days 9 and 10, which does not match our proposed “slow-to-grow” phenotype.

54
54
A B C
D E F

55
55
Figure 3.7: Representative Images of Defective Spiral Mutants
A, Image of wild-strain, 5A18NP1. B-F, images of potential defective spiral mutants 2E7, 7F7, 45D5, 48G9, and 52E10,
respectively.

56
OspC Screening
SDS-PAGEs were used to run preliminary screenings on all the mutant library
samples. Figure 3.8 shows the SDS-PAGEs run on Plate 46 to represent the screenings
run on all the mutant library plates. Only one OspC expression mutant, 46A2, was found
from this plate and was marked as a complete OspC deficient mutant. From all of the
screenings, 66 potential OspC expression mutants were found. Of these, 13 were
identified as complete knockouts of OspC expression while 22 and 31 were identified as
underexpressed and overexpressed, respectively (Table 3.4). Because the focus in this
experiment has been on those samples completely lacking OspC expression, the
underexpressed and overexpressed samples have not yet been confirmed. 8 of the 13
mutants proposed to be lacking OspC were re-grown and the SDSPAGES were repeated
(Table 3.4; Figure 3.9). The samples 28C2, 28F7, 45C4, 46A2, 52G11, and 56H11 were
confirmed complete OspC deficient mutants. 45B3 and 52G10 have also been confirmed
as lacking OspC; however, they were not run in the procedure shown in Figure 3.9.
Of the confirmed OspC depleted mutants, 6 samples had undergone conditional SDS-
PAGE in which they were grown in different pH’s (7 and 7.5) and to different
concentrations (low and high) in order to further affirm their mutant OspC expression
(Figure 3.10). Due to the effects of differing pH and cell densities on OspC expression
levels in Wt, three conditions are used to confirm OspC expression phenotype. Low cell-
density and higher pH (7.5) is used somewhat like a negative control, high cell density
with pH 7.5 matches standard culture conditions, and high cell density with lower pH (7)
is used to enhance OspC expression. Samples 52G10, 52G11, and 56H11 were

57
successfully tested under these conditions and showed clear depletion of OspC, while
samples such as 52B7, 52F1, and 52F11 did not (Figure 3.10).

58
58
OspC
Expression
Samples Total Samples
confirmed
Total
confirmed
Samples unconfirmed Total
unconfirmed
No expression 28C2, 28F7, 45B3, 45C4,
45F5, 46A2, 52G10,
52G11, 56H11, 62A2,
62B3, 62E3, 62H5
13 28C2, 28F7,
45B3, 45C4,
46A2, 52G10,
52G11, 56H11
8 45F5, 62A2, 62B3, 62E3,
62H5
5
Underexpression 1F5, 3F10, 45A5, 45B11,
45B12, 45C2, 45C8,
45C9, 45D1, 45E7, 45E9,
45E11, 45H4, 47A6,
47B5, 47D11, 47E5,
47F1, 47F6, 48H12,
56D1, 56G5
22 N/A N/A 1F5, 3F10, 45A5, 45B11,
45B12, 45C2, 45C8, 45C9,
45D1, 45E7, 45E9, 45E11,
45H4, 47A6, 47B5, 47D11,
47E5, 47F1, 47F6, 48H12,
56D1, 56G5
22
Overexpression 1D12, 2A6, 2A9, 2A10,
2A12, 2B6, 2B11, 2B12,
2D12, 2G11, 2H7, 2H12,
3B2, 3D2, 3D3, 3F12,
3H3, 28A8, 28C4, 28G9,
45B2, 45C7, 45C10,
52D1, 52D12, 52E12,
52G7, 62B4, 62F3, 62F4,
62H1
31 N/A N/A 1D12, 2A6, 2A9, 2A10, 2A12,
2B6, 2B11, 2B12, 2D12,
2G11, 2H7, 2H12, 3B2, 3D2,
3D3, 3F12, 3H3, 28A8, 28C4,
28G9, 45B2, 45C7, 45C10,
52D1, 52D12, 52E12, 52G7,
62B4, 62F3, 62F4, 62H1
31
Total 66 8 58

59
Table 3.4: List of OspC Expression Mutation Types and Identified Samples
All of the potential OspC mutants are listed according their mutation type. Confirmed
mutants had undergone secondary SDSPAGE testing while unconfirmed mutants have
not. Because the focus was on complete OspC knockouts, only these have undergone
confirmatory testing thus far. Samples that have undergone sequencing are listed in bold.

60
Plate 46
lad Wt A1 A2 A3 A4 A5 A6 A7 A8 A9 A10 A11 A12 B1 B2 lad B3 B4 B5 B6 B7 B8 B9 B10 B11 B12 C1 C2 C3 C4 C5 lad C6 C7 C8 C9 C10 C11 C12 D1 D2 D3 D4 D5
D6 D7 D8 lad D9 D10 D11 D12 E1 E2 E3 E4 E5 E6 E7 lad Wt E8 E10 E11 E12 F1 F2 F3 F4 F5 G6 G11 H5 H10

61
Figure 3.8: SDS-PAGEs of Plate 46 Samples
Preliminary OspC screening of samples from Plate 46 via SDS-PAGE. These are
representative of the screenings performed on all of the samples within the OspC
screening process.

62
3 28 45 46 47 52 56
lad Wt C8 C2 F7 B3 B8 C4 D4 E4 A2 F4 G11 H11

63
Figure 3.9: SDS-PAGE of Potential OspC Deficient Mutants
The potential OspC mutants were regrown and used in a second SDS-PAGE to verify
OspC-lacking phenotype. Samples 3C8, 45B8, 45D4, 45E4, and 47F4 identified as false
mutants, however 47F4 may be underexpressed. The remaining samples were confidently
labeled as OspC deficient mutants.

64
Lad 5A18NP1 52B7 52F1 52F11
pH 7 7.5 7.5 7 7.5 7.5 7 7.5 7.5 7 7.5 7.5
Conc. H L H H L H H L H H L H
5A18NP1 52G10 52G11 56H11
pH 7 7.5 7.5 7 7.5 7.5 7 7.5 7.5 7 7.5 7.5
Conc. H L H H L H H L H H L H

65
Figure 3.10: Conditional SDS-PAGEs of Potential OspC-Lacking Mutants
Samples were checked under three different conditions. Low-density, pH 7.5 samples
act as negative controls because they are sub-optimal for OspC expression. High-density,
pH 7 samples are the most optimal for OspC expression and thus act as a positive control.
High-density, pH 7.5 samples are representative of conditions similar to in vivo
conditions. Samples 52B7, 52F1, and 52F11 were found to be false mutants while
52G10, 52G11, and 56H11 were confirmed.
66
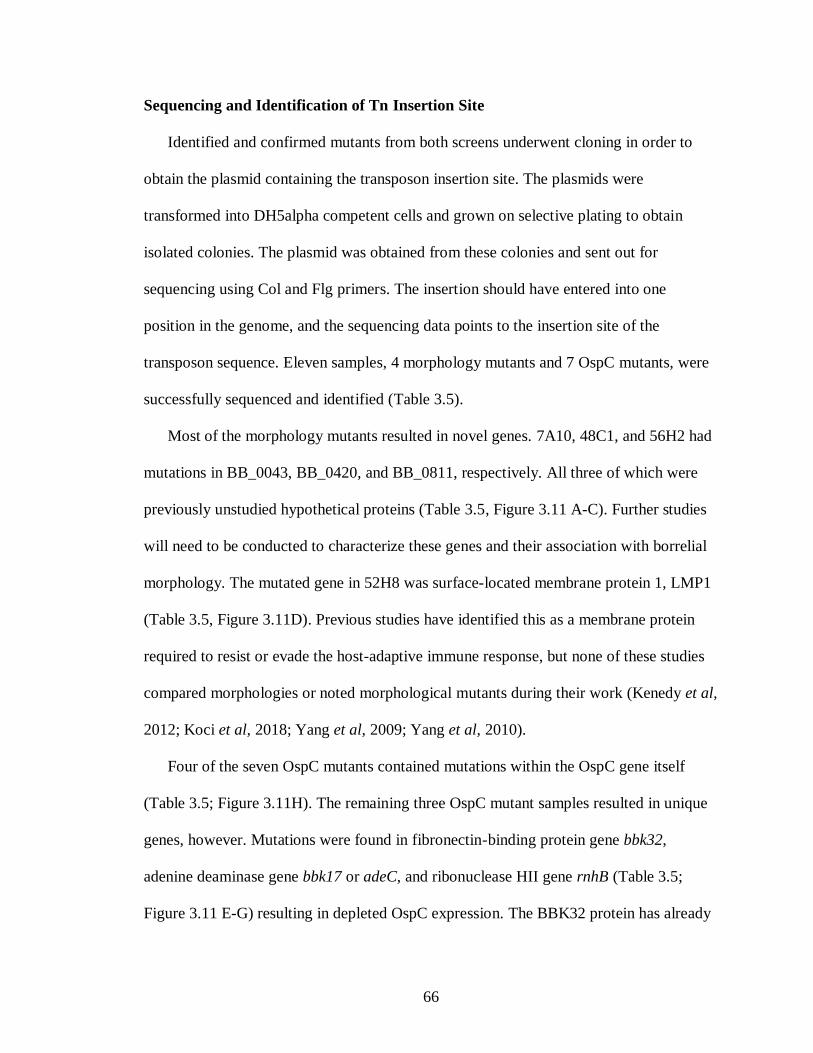
Sequencing and Identification of Tn Insertion Site
Identified and confirmed mutants from both screens underwent cloning in order to
obtain the plasmid containing the transposon insertion site. The plasmids were
transformed into DH5alpha competent cells and grown on selective plating to obtain
isolated colonies. The plasmid was obtained from these colonies and sent out for
sequencing using Col and Flg primers. The insertion should have entered into one
position in the genome, and the sequencing data points to the insertion site of the
transposon sequence. Eleven samples, 4 morphology mutants and 7 OspC mutants, were
successfully sequenced and identified (Table 3.5).
Most of the morphology mutants resulted in novel genes. 7A10, 48C1, and 56H2 had
mutations in BB_0043, BB_0420, and BB_0811, respectively. All three of which were
previously unstudied hypothetical proteins (Table 3.5, Figure 3.11 A-C). Further studies
will need to be conducted to characterize these genes and their association with borrelial
morphology. The mutated gene in 52H8 was surface-located membrane protein 1, LMP1
(Table 3.5, Figure 3.11D). Previous studies have identified this as a membrane protein
required to resist or evade the host-adaptive immune response, but none of these studies
compared morphologies or noted morphological mutants during their work (Kenedy et al,
2012; Koci et al, 2018; Yang et al, 2009; Yang et al, 2010).
Four of the seven OspC mutants contained mutations within the OspC gene itself
(Table 3.5; Figure 3.11H). The remaining three OspC mutant samples resulted in unique
genes, however. Mutations were found in fibronectin-binding protein gene bbk32,
adenine deaminase gene bbk17 or adeC, and ribonuclease HII gene rnhB (Table 3.5;
Figure 3.11 E-G) resulting in depleted OspC expression. The BBK32 protein has already

67
been extensively studied and identified a surface protein that is important for enhancing
infectivity potential in B. burgdorferi and is regulated by the Rrp2-RpoN-RpoS pathway
(He et al, 2007; Seshu et al, 2006). However, current studies have only suggested that it
is co-regulated with OspC. None so far have studied whether BBK32 plays any role in
controlling OspC levels.
Bbk17, or adeC, has also been shown to contribute to mammalian infectivity (Jewett
et al, 2007). It encodes an adenine deaminase and is required for the direct deamination
of adenine to hypoxanthine, a purine important for the salvage of adenine in many
prokaryotic species (Jewett et al, 2007; Nygaard et al, 1996). Unlike BBK32, the
mechanisms controlling AdeC levels have not yet been studied. The protein’s affiliation
with the RpoN-RpoS pathway and OspC regulation remain to be seen. The product of the
third gene, rnhB, was determined based off of sequence homology (Fraser et al, 1997),
but no further studies have been conducted to characterize the gene or its protein product.

68
68
Sample
ID
Phenotype Confirmation Gene ID Gene
Name
Gene Product Insertion
Site
7A10 Elongated, aggregate Via imaging and
statistical analysis
BB_0043 unnamed Unknown, predicted protein
coding gene
42392,
42393
48C1 Elongated Via imaging and
statistical analysis
BB_0420 unnamed Sensory transduction
histidine kinase, putative
433448,
433449
52H8 Elongated Via imaging and
statistical analysis
BB_0210 LMP1 Surface-located membrane
protein 1
212916,
212917
56H2 Elongated, defective
spiral, aggregate
Via imaging and
statistical analysis
BB_0811 unnamed Conserved hypothetical
protein
858615,
858616
28F7 Complete OspC
deficiency
Via repeated SDS-
PAGE
BB_K32 bbk32 Fibronectin-binding protein 21036,
21037
45B3 Complete OspC
deficiency
Via repeated SDS-
PAGE
BB_B19 OspC Outer surface protein C 17213,
17214
45C4 Complete OspC
deficiency
Via repeated SDS-
PAGE
BB_K17 bbk17 Adenine deaminase C 11791,
11792
46A2 Complete OspC
deficiency
Via repeated SDS-
PAGE
BB_0046 rnhB Ribonuclease HII 45787,
45788
52G10 Complete OspC
deficiency
Via repeated SDS-
PAGE
BB_B19 OspC Outer surface protein C 16946,
16947
52G11 Complete OspC Via repeated SDS- BB_B19 OspC Outer surface protein C 16946,

69
69
deficiency PAGE 16947
56H11 Complete OspC
deficiency
Via repeated SDS-
PAGE
BB_B19 OspC Outer surface protein C 16946,
16947

70
70
Table 3.5: List of Sequenced Samples and their Transposon Insertion Sites
All samples to be successfully cloned and sequenced, with morphology mutants listed first followed by OspC mutants. Imaging
and statistical analysis can be found in the Morphology Screening section. SDS-PAGEs can be found in the OspC screening section.
Gene ID refers to the original name/location of the gene according to the sequencing performed in strain B31.

71
71
A

72
72
B

73
73
C

74
74
D

75
75
E F E

76
76
F

77
77
G

78
78
H

79
Figure 3.11: Transposon Insertion Sites of Sequenced Mutants
Col and flg reads were used with NCBI Blast to identify flanking regions of the
transposon sequence. A-D, sequenced morphology mutants. E-H, sequenced OspC
expression mutants. E-G: 28F7, 45C4, and 46A2 are indicated in red in the
accompanying SDS-PAGE image. Multiple OspC expression mutants contained
mutations in the ospC gene. 52G10 represents the sequencing results for these mutants.
52G11 and 56H11 had transposon insertion sites identical to 52G10.

80
DISCUSSION
From screening of approximately 1350 mutagenized samples, 85 potential
morphology mutants and 66 potential OspC expression mutants have been found. While
not all of these have a confirmed phenotype, they lay the groundwork for future
investigations. The unconfirmed elongated, aggregate, and/or slow-growing mutants can
undergo further microscopy analyses to provide visual and statistical evidence to their
phenotypes. While only 40x magnification was used in this procedure, further endeavors
can include higher magnification or enhanced microscopy procedures to characterize
potential defective spiral mutants. Swarm agar assays in BSKII agar can be used to obtain
quantifiable comparisons between Wt and potential motility mutants.
Of the OspC expression mutants, the main focus of the study was to identify mutants
with complete OspC depletion. With over half of the OspC depleted mutants containing
transposon insertions in the ospC gene itself (Table 3.5), the focus may shift to those with
underexpressed or overexpressed OspC phenotypes. Further work will be conducted to
verify the OspC expression phenotypes of the remaining OspC depleted mutants as well
as the underexpressed and overexpressed phenotypes. This work includes repeated SDS-
PAGEs and conditional SDS-PAGEs.
Of the 37 confirmed morphology mutants and the 8 confirmed OspC expression
mutants, eleven samples have been successfully identified, cloned, and sequenced,
resulting in the identification of both novel and previously discovered genes. As detailed
earlier, three of the morphology mutants resulted in putative/hypothetical proteins (Table
3.5). These samples will undergo complementation to confirm the relationship between
the gene and its observed phenotype. Plasmid profiling will be used to confirm the

81
observed phenotypes are not due to loss of any plasmids. Upon confirmation of genotypic
link to the phenotype, studies should be performed to characterize the structure of the
protein and potential biochemical interactions. Information obtained from these studies
may help determine how these proteins function and produce the observed phenotype
within the organism.
LMP1, the mutated gene in 52H8 (Table 3.5, Figure 3.11D), has been identified in
other studies as a membrane protein required to resist or evade the host-adaptive immune
response (Kenedy et al, 2012; Koci et al, 2018; Yang et al, 2009; Yang et al, 2010).
However, none of these studies compared morphologies or noted morphological mutants
during their work. As morphologies of B. burgdorferi can be affected by various changes
in environment, such as inadequate nutritional media (Barbour et al, 1986), careful
analysis of morphology is suggested while continuing knock-out/complementation work
on this gene.
The four identified genes from the OspC depleted mutants consist of bbk32, bbk17
(also known as adeC), rnhB, and ospC. The BBK32 protein has already been extensively
studied and identified as a surface protein of B. burgdorferi that plays an important role
in the attachment of the spirochetes to the extracellular matrix and is required for optimal
infectivity of the organism (Fischer et al, 2006; Hyde et al, 2011b; Probert and Johnson,
1998). It is more highly expressed during tick feeding and mammalian infection and has
lower expression in flat, unfed ticks (Fikrig et al, 2000; Li et al, 2006). More importantly,
it has been found to illicit protective host immune activity and its inactivation decreases
the infectivity of B. burgdorferi (Fikrig et al, 1997; Seshu et al, 2006). The combination
of all these factors led to the discovery that BBK32 is in fact controlled by the Rrp2-

82
RpoN-RpoS pathway alongside OspC (He et al, 2007). While the mechanisms
controlling for BBK32 have been studied, no studies have been performed to identify if
BBK32 controls expression of OspC. Experiments should be performed to distinguish if
the loss of OspC is indeed controlled by loss of BBK32. If so, further experimentation
should be done to determine the molecular processes behind this control.
BBK17 has also been previously studied, though not to the extent of BBK32. BBK17,
or adeC, was identified as an important contributor to mammalian infectivity and its
inactivation attenuates B. burgdorferi infection in mice (Jewett et al, 2007). Unlike
BBK32, no connection has been made between adeC and the RpoN-RpoS pathway. It has
so far only been characterized as an adenine deaminase required for the direct
deamination of adenine to produce hypoxanthine, a purine derivative important for the
salvage and metabolism of adenine in many prokaryotic species (Jewett et al, 2007;
Nygaard et al, 1996). Hypoxanthine is the most abundant purine in mammalian blood and
its transport may be critical during the initial stages of Borrelial infectivity (Hartwick et
al, 1979; Jain et al, 2012). Further studies would need to be performed in order to
establish a relationship between adeC and the OspC expression phenotype, to establish a
relationship between adeC and the RpoN-RpoS pathway, and to identify any effects of
adeC on infectivity and pathogenesis of the organism.
The third gene found associated with depleted OspC expression was rnhB,
ribonuclease HII, that has been predicted to specifically degrade the RNA of RNA-DNA
hybrids (Ohtani et al, 1999). The gene product and its function in B. burgdorferi has so
far only been predicted from sequence homology (Fraser et al, 1997) and has not been
studied further. Ribonucleases have a wide variety of potential functions involving

83
bacterial RNA metabolism, such as switching pre-RNA to functional RNAs, mRNA
regulation, mRNA degradation, or controlling regulatory RNAs (Deutscher, 2006; 2015;
Esquerre et al, 2014). Ribonuclease HII, or RNase HII, is a temperature-sensitive enzyme
whose activity is dependent on the presence of Mn2+ (Ohtani et al, 1999). This is
particularly intriguing as Mn2+ plays a critical role in the regulation of the RpoS pathway
controlling OspC expression (Troxell et al, 2013). However, it should be noted that
activity of RNase HII is positively correlated with the presence of Mn2+ while the
presence of Mn2+ is inversely correlated with the presence of OspC. This makes our
findings particularly confusing as the loss of RNase HII results in depletion of OspC.
In terms of physiological roles, RNase H’s have been widely studied in E. coli but
with stronger focus on RNase HI as opposed to RNase HII. Thus far, researchers have
hypothesized that RNase HII is responsible for excising misincorporated ribonucleotides
in DNA as a type of DNA repair (Rydberg and Game, 2002). This role may hold true in
some cases, but it does not adequately explain the link between the enzyme and OspC
expression seen here. RNase HII is also believed to constitute a significant part of the
RNA degradosome complex in E. coli. Its primary role appears to be the degradation of
mRNA (Lu and Taghbalout, 2014). It is possible that RNase HII holds a similar role in B.
burgdorferi, either on its own or in conjunction with a previously undiscovered
degradosome complex, in order to aid in RNA processing and/or degradation.
As with the rest of the identified genes, complementation would be used to ensure a
link between the observed phenotype and the rnhB gene. With the tendency for RNases
to regulate gene expression, this gene will be particularly interesting to explore in relation
to RpoN, RpoS, and OspC levels. Due its strong association with other degradosome

84
proteins in E. coli, it may be a good idea to search for other degradosome proteins present
in B. burgdorferi. Any that are found should be analyzed for associations with RNase HII
and effects on OspC expression. Immunofluorescence experiments would be
recommended regardless of the presence of other degradosome proteins in order to
identify which factors in the RpoN-RpoS pathway may be affected by this enzyme.
Studies should be performed to characterize biochemical and molecular interactions of
this enzyme that effect this pathway.
For all identified mutants, procedures such as Western blots and plasmid profiling
would be necessary to confirm the causal relationship of the genotype to the phenotype.
Using complementation procedures with Western blotting would allow for evaluation of
the role of the identified gene in relation to its protein expression. Plasmid profiling is an
essential step in verifying a genotype-phenotype link due to B. burgdorferi’s spontaneous
loss of plasmids when growing in vitro. This process allows us to visualize all the
plasmids present within the sample compared to wildtype and allows us to verify that the
observed phenotype is not due to a missing plasmid. The plasmid profiling process can
also lead to novel discoveries involving plasmids, rather than genes, found responsible
for certain phenotypes. For example, preliminary data from Dr. Raghunandanan in the
Yang Lab has shown that at least three OspC deficient mutants are missing plasmid lp21.
Additionally, the genes identified from sequencing did not return Wt phenotype after
complementation. This discovery is intriguing as lp21 has previously been thought to be
unnecessary.

85
APPENDIX A: List of All Potential Mutants by Plate Number
Sample Phenotype Confirmation Insertion Site/Gene
Plate 1
1A8 Elongated Via imaging and stats analysis n/a
1B5 Elongated and slow-growing Via imaging, growth curves, and stats
analysis
n/a
1D12 OspC Overexpression Unconfirmed n/a
1E10 Slow-growing Via growth curves and stats analysis n/a
1E12 Increased motility Unconfirmed n/a
1F5 OspC Underexpression Unconfirmed n/a
1G4 Aggregate Via imaging and stats analysis n/a
1H12 Elongated Via imaging and stats analysis n/a
Plate 2
2A6 OspC Overexpression Unconfirmed n/a
2A9 OspC Overexpression Unconfirmed n/a
2A10 OspC Overexpression Unconfirmed n/a
2A12 OspC Overexpression Unconfirmed n/a
2B1 Increased motility Unconfirmed n/a
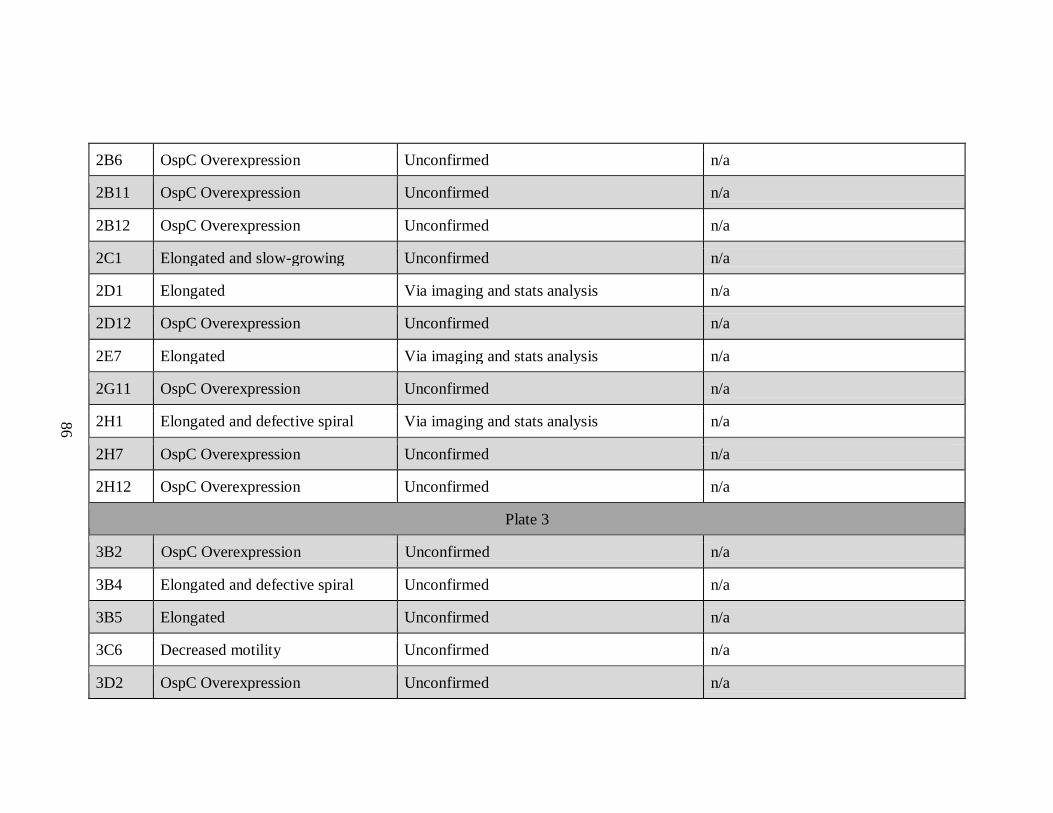
86
2B6 OspC Overexpression Unconfirmed n/a
2B11 OspC Overexpression Unconfirmed n/a
2B12 OspC Overexpression Unconfirmed n/a
2C1 Elongated and slow-growing Unconfirmed n/a
2D1 Elongated Via imaging and stats analysis n/a
2D12 OspC Overexpression Unconfirmed n/a
2E7 Elongated Via imaging and stats analysis n/a
2G11 OspC Overexpression Unconfirmed n/a
2H1 Elongated and defective spiral Via imaging and stats analysis n/a
2H7 OspC Overexpression Unconfirmed n/a
2H12 OspC Overexpression Unconfirmed n/a
Plate 3
3B2 OspC Overexpression Unconfirmed n/a
3B4 Elongated and defective spiral Unconfirmed n/a
3B5 Elongated Unconfirmed n/a
3C6 Decreased motility Unconfirmed n/a
3D2 OspC Overexpression Unconfirmed n/a

87
3D3 OspC Overexpression Unconfirmed n/a
3D10 Elongated Unconfirmed n/a
3E5 Elongated and defective spiral Unconfirmed n/a
3E8 Elongated Via imaging and stats analysis n/a
3E9 Increased motility Unconfirmed n/a
3E12 Defective spiral Unconfirmed n/a
3F3 Elongated and defective spiral Unconfirmed n/a
3F10 Elongated and defective spiral
OspC Underexpression
Via imaging and stats analysis
Unconfirmed
n/a
3F12 OspC Overexpression Unconfirmed n/a
3H2 Elongated Via imaging and stats analysis n/a
3H3 OspC Overexpression Unconfirmed n/a
Plate 5
5A7 Elongated, defective spiral, slow-
growing
Via imaging and stats analysis; Slow-growth
phenotype unconfirmed
n/a
5C2 Slow-growing Via growth curve and stats analysis n/a
5D2 Elongated Via imaging and stats analysis n/a
5D4 Elongated Via imaging and stats analysis n/a

88
5F11 Elongated Via imaging and stats analysis n/a
5G11 Elongated, defective spiral, and
decreases motility
Via imaging and stats analysis; Motility
phenotype unconfirmed
n/a
Plate 7
7A10 Elongated and aggregate Via imaging and stats analysis BB_0043: unknown predicted protein
coding gene
7B12 Slow-growing Unconfirmed n/a
7D8 Elongated Via imaging and stats analysis n/a
7D11 Elongated Via imaging and stats analysis n/a
7F7 Elongated and defective spiral Unconfirmed n/a
7F10 Elongated and defective spiral Unconfirmed n/a
7H11 Elongated Via imaging and stats analysis n/a
Plate 28
28A8 OspC Overexpression Unconfirmed n/a
28B8 Defective spiral Unconfirmed n/a
28C2 Complete OspC deficiency Via repeated SDS-PAGE n/a
28C4 Increased motility
OspC Overexpression
Unconfirmed
Unconfirmed
n/a

89
28C11 Defective spiral Unconfirmed n/a
28E12 Defective spiral Unconfirmed n/a
28F7 Complete OspC deficiency Via repeated SDS-PAGE Bbk32: Fibronectin-binding protein
28G9 OspC Overexpression Unconfirmed n/a
Plate 45
45A5 OspC Underexpression Unconfirmed n/a
45B2 OspC Overexpression Unconfirmed n/a
45B3 Aggregate
Complete OspC deficiency
Via imaging and stats analysis
Via repeated SDS-PAGE
BB_B19: Outer surface protein C
45B11 OspC Underexpression Unconfirmed n/a
45B12 OspC Underexpression Unconfirmed n/a
45C2 OspC Underexpression Unconfirmed n/a
45C4 Complete OspC deficiency Via repeated SDS-PAGE BB_K17: Adenine deaminase C
45C7 Increased motility
OspC Overexpression
Unconfirmed
Unconfirmed
n/a
45C8 OspC Underexpression Unconfirmed n/a
45C9 OspC Underexpression Unconfirmed n/a

90
45C10 OspC Overexpression Unconfirmed n/a
45D1 OspC Underexpression Unconfirmed n/a
45D5 Elongated and defective spiral Via imaging and stats analysis n/a
45D7 Elongated and defective spiral Via imaging and stats analysis n/a
45E7 OspC Underexpression Unconfirmed n/a
45E9 OspC Underexpression Unconfirmed n/a
45E11 OspC Underexpression Unconfirmed n/a
45F5 Complete OspC deficiency Unconfirmed n/a
45F12 Elongated Unconfirmed n/a
45H4 OspC Underexpression Unconfirmed n/a
45H9 Increased motility Unconfirmed n/a
45H11 Elongated Unconfirmed n/a
Plate 46
46A2 Complete OspC deficiency Via repeated SDS-PAGE BB_0046: Ribonuclease HII
46F5 Elongated Via imaging and stats analysis n/a
46F10 Elongated Via imaging and stats analysis n/a

91
Plate 47
47A6 OspC Underexpression Unconfirmed n/a
47A9 Slow-growing Unconfirmed n/a
47B3 Elongated Via imaging and stats analysis n/a
47B5 OspC Underexpression Unconfirmed n/a
47D11 OspC Underexpression Unconfirmed n/a
47E5 OspC Underexpression Unconfirmed n/a
47E11 Aggregate Via imaging and stats analysis n/a
47F1 OspC Underexpression Unconfirmed n/a
47F6 OspC Underexpression Unconfirmed n/a
47G11 Increased motility Unconfirmed n/a
Plate 48
48C1 Elongated Via imaging and stats analysis BB_0420: Sensory transduction
histidine kinase, putative
48D4 Defective spiral and decreased
motility
Unconfirmed n/a
48G9 Elongated, defective spiral, and
slow-growing
Via imaging, growth curves, and stats
analysis
n/a
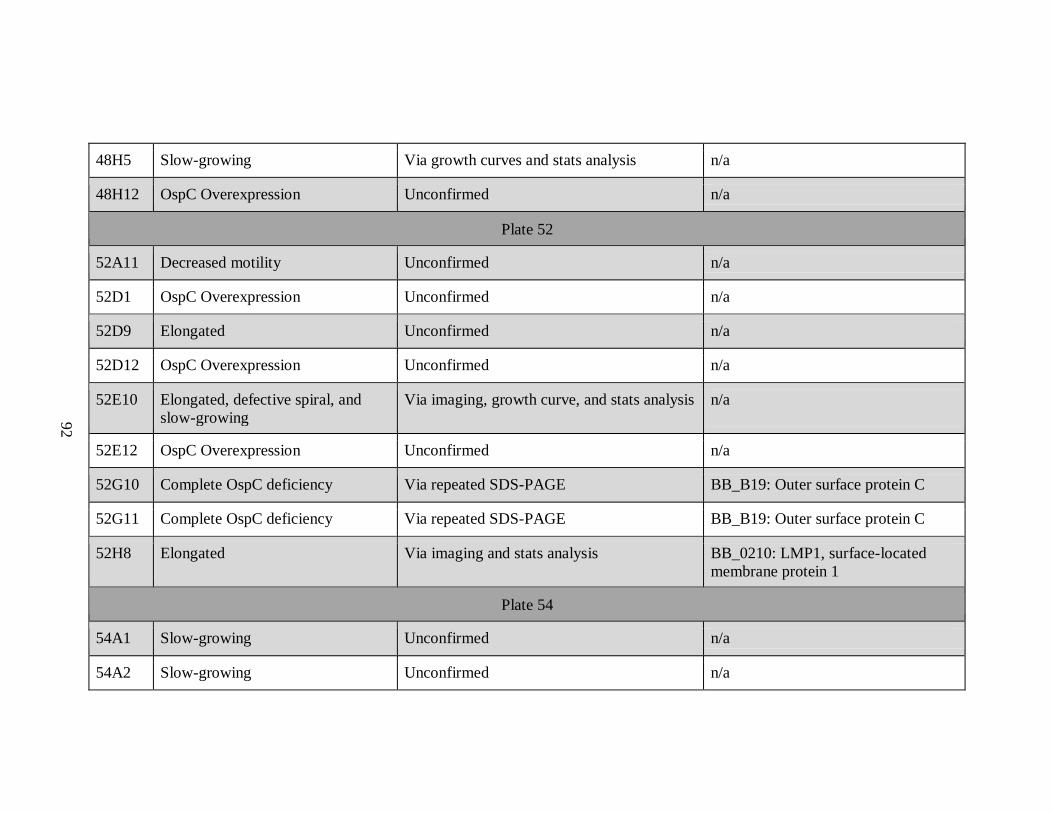
92
48H5 Slow-growing Via growth curves and stats analysis n/a
48H12 OspC Overexpression Unconfirmed n/a
Plate 52
52A11 Decreased motility Unconfirmed n/a
52D1 OspC Overexpression Unconfirmed n/a
52D9 Elongated Unconfirmed n/a
52D12 OspC Overexpression Unconfirmed n/a
52E10 Elongated, defective spiral, and
slow-growing
Via imaging, growth curve, and stats analysis n/a
52E12 OspC Overexpression Unconfirmed n/a
52G10 Complete OspC deficiency Via repeated SDS-PAGE BB_B19: Outer surface protein C
52G11 Complete OspC deficiency Via repeated SDS-PAGE BB_B19: Outer surface protein C
52H8 Elongated Via imaging and stats analysis BB_0210: LMP1, surface-located
membrane protein 1
Plate 54
54A1 Slow-growing Unconfirmed n/a
54A2 Slow-growing Unconfirmed n/a

93
54E3 Elongated Unconfirmed n/a
54G1 Elongated Unconfirmed n/a
54G6 Elongated and aggregate Unconfirmed n/a
54H10 Elongated and aggregate Unconfirmed n/a
Plate 56
56A12 Elongated and aggregate Unconfirmed n/a
56D12 Elongated and aggregate Unconfirmed n/a
56E9 Elongated Via imaging and stats analysis n/a
56F5 Elongated, defective spiral, and
aggregate
Via imaging and stats analysis n/a
56F9 Increased motility Unconfirmed n/a
56H2 Elongated, defective spiral,
aggregate
Via imaging and statistical analysis BB_0811: Conserved hypothetical
protein
56H11 Complete OspC deficiency Via repeated SDS-PAGE BB_B19: Outer surface protein C
Plate 62
62A2 Complete OspC deficiency Unconfirmed n/a
62A5 Elongated and aggregate Via imaging and stat analysis n/a
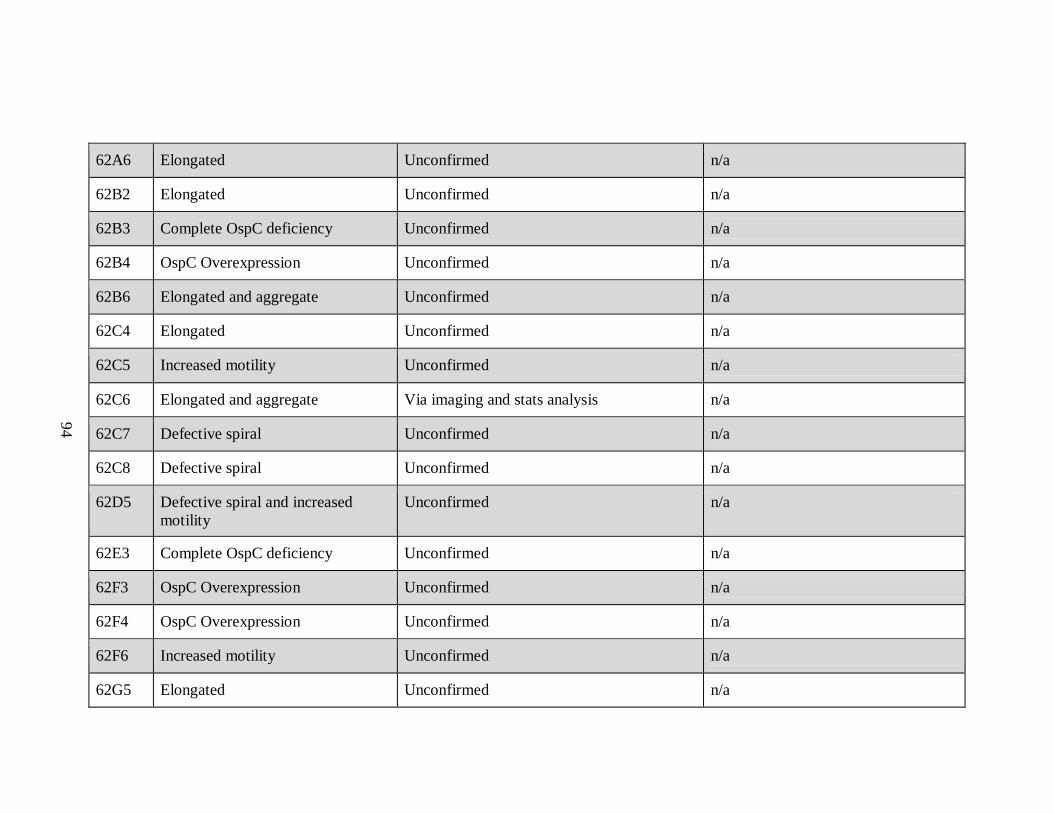
94
62A6 Elongated Unconfirmed n/a
62B2 Elongated Unconfirmed n/a
62B3 Complete OspC deficiency Unconfirmed n/a
62B4 OspC Overexpression Unconfirmed n/a
62B6 Elongated and aggregate Unconfirmed n/a
62C4 Elongated Unconfirmed n/a
62C5 Increased motility Unconfirmed n/a
62C6 Elongated and aggregate Via imaging and stats analysis n/a
62C7 Defective spiral Unconfirmed n/a
62C8 Defective spiral Unconfirmed n/a
62D5 Defective spiral and increased
motility
Unconfirmed n/a
62E3 Complete OspC deficiency Unconfirmed n/a
62F3 OspC Overexpression Unconfirmed n/a
62F4 OspC Overexpression Unconfirmed n/a
62F6 Increased motility Unconfirmed n/a
62G5 Elongated Unconfirmed n/a

95
62H1 OspC Overexpression Unconfirmed n/a
62H4 Elongated Unconfirmed n/a
62H5 Complete OspC deficiency Unconfirmed n/a

96
REFERENCES
1. Barbour AG. 1984. Isolation and cultivation of Lyme disease spirochetes. Yale J Biol
Med 57: 521-525.
2. Barbour AG, Hayes SF. 1986. Biology of Borrelia Species. Microbiol Rev 50: 381-
400.
3. Blevins JS, Xu H, He M, Norgard MV, Reitzer L, Yang XF. 2009. Rrp2, a σ54-
Dependent Transcriptional Activator of Borrelia burgdorferi, Activates rpoS in an
Enhancer-Independent Manner. J Bacteriol 191: 2902-2905.
4. Boardman BK, He M, Ouyang Z, Xu H, Pang X, Yang XF. 2008. Essential Role of the
Response Regulator Rrp2 in the Infectious Cycle of Borrelia burgdorferi. Infect
Immun 76: 3844-3853.
5. Boylan JA, Posey JE, Gherardini FC. 2003. Borrelia oxidative stress response
regulator, BosR: A distinctive Zn-dependent transcriptional activator. Proc Natl Acad
Sci USA 100: 11684-11689.
6. Brisson D, Drecktrah D, Eggers CH, Samuels DS. 2012. Genetics of Borrelia
burgdorferi. Annu Rev Genet 46: 515-536.
7. Burgdorfer W, Barbour AG, Hayes SF, Benach JL, Gurnwaldt E, David JP. 1982.
Lyme disease—a tick-borne spirochetosis? Science 216: 1317-1319.
8. Burgdorfer W. 1991. Lyme borreliosis: ten years after discovery of the etiologic agent,
Borrelia burgdorferi. Infection 19: 257-62.
9. Burtnick MN, Downey JS, Brett PJ, Boylan JA, Frye JG, Hoover TR, Gherardini FC.
2007. Insights into the complex regulation of rpoS in Borrelia burgdorferi. Mol
Microbiol 65: 277-293.
10. Caimano MJ, Eggers CH, Hazlett KRO, Radolf JD. 2004. RpoS Is Not Central to the
General Stress Response in Borrelia burgdorferi but Does Control Expression of One
or More Essential Virulence Determinants. Infect Immun 72: 6433-6445.
11. Carrasco SE, Troxell B, Yang Y, Brandt SL, Li H, Sandusky GE, Condon KW,
Serezani CH, Yang XF. 2015. Outer surface protein OspC is an antiphagocytic factor
that protects Borrelia burgdorferi from phagocytosis by macrophages. Infect Immun
83: 4848-4860.
12. Casjens S, Palmer N, Van Vugt R, Huang WM, Stevenson B, Rosa P, Lathigra R,
Sutton G, Peterson J, Dodson RJ, Haft D, Hickey E, Gwinn M, White O, Fraser CM.

97
2002. A bacterial genome in flux: the twelve linear and nine circular
extrachromosomal DNAs in an infectious isolate of the Lyme disease spirochete
Borrelia burgdorferi. Mol Microbiol 35: 490-516.
13. CDC. 2018a. How many people get Lyme disease? Accessed: Jan 21, 2019.
https://www.cdc.gov/lyme/stats/humancases.html
14. CDC. 2018b. Lyme Disease Chart and Figures: Historical Data. Accessed: Jan 21,
2019. https://www.cdc.gov/lyme/stats/graphs.html
15. CDC. 2018c. Lyme Disease: Signs and symptoms. Accessed: Jan 19, 2019.
https://www.cdc.gov/lyme/signs_symptoms/index.html
16. CDC. 2018d. Lyme Disease Treatment. Accessed: April 3, 2019.
https://www.cdc.gov/lyme/treatment/index.html
17. CDC. 2019. Lyme Disease: Data and Surveillance. Accessed: January 21, 2019.
https://www.cdc.gov/lyme/datasurveillane/index.html
18. Chaconas G, Kobryn K. 2010. Structure, function, and evolution of linear replicons in
Borrelia. Annu Rev Microbiol 64: 185-202.
19. Charon NW, Goldstein SF. 2002. Genetics of Motility and Chemotaxis of a
Fascinating Group of Bacteria: The Spirochetes. Annu Rev Genet 36: 47-73.
20. Charon NW, Cockburn A, Li C, Liu J, Miller KA, Miller MR, Motaleb MD,
Wolgemuth CW. 2012. The unique paradigm of spirochete motility and chemotaxis.
Annu Rev Microbio 66: 349-370.
21. Cooke WD, Dattwyler RJ. 1992. Complications of Lyme Borreliosis. Ann Rev Med
43: 93-103.
22. Deutscher MP. 2006. Degradation of RNA in bacteria: comparison of mRNA and
stable RNA. Nucleic Acids Res 34: 659-666.
23. Deutscher MP. 2015. How bacterial cells keep ribonucleases under control. FEMS
Microbiol Rev 39: 350-361.
24. Di Domenico EG, Cavallo I, Bordignon V, D’Agosto, Pontone M, Trento E, Gallo
MT, Prignano G, Pimpinelli F, Toma L, Ensoli F. 2018. The Emerging Role of
Microbial Biofilm in Lyme Neuroborreliosis. Front Neurol 9: 1048.
25. Dunham-Ems SM, Caimano MJ, Pal U, Wolgemuth CW, Eggers CH, Balic A, Radolf
JD. 2009. Live imaging reveals a biphasic mode of dissemination of Borrelia
burgdorferi within ticks. J Clin Invest 119: 3652-3665.

98
26. Esquerre T, Laguerre S, Turlan C, Carpousis AJ, Girbal L, Cocaign-Bousquet M.
2014. Dual role of transcription and transcript stability in the regulation of gene
expression in Escherichia coli cells cultured on glucose at different growth rates.
Nucleic Acids Res 42: 2460-2472.
27. Fikrig E, Barthold SW, Sun W, Feng W, Telford III SR, Flavell RA. 1997. Borrelia
burgdorferi P35 and P37 proteins, expressed in vivo, elicit protective immunity.
Immunity 6: 531-539.
28. Fikrig E, Feng W, Barthold SW, Telford III SR, Flavell RA. 2000. Arthropod- and
Host-Specific Borrelia burgdorferi bbk32 Expression and the Inhibition of Spirochete
Transmission. J Immunol 164: 5344-5351.
29. Fischer JR, LeBlanc KT, Leong JM. 2006. Fibronectin Binding Protein BBK32 of the
Lyme Disease Spirochete Promotes Bacterial Attachment to Glycosaminoglycans.
Infect Immun 74: 435-441.
30. Fisher MA, Grimm D, Henion AK, Stewart PE, Rosa PA, Gherardini FC. 2005.
Borrelia burgdorferi σ54 is required for mammalian infection and vector transmission
but not for tick colonization. Proc Natl Acad Sci USA 102: 5162-5167.
31. Fraser CM, Casjens S, Huang WM, Sutton GG, Clayton R, Lathigra R, White O,
Ketchum KA, Dodson R, Hickey EK, Gwinn M, Dougherty B, Tomb JF,
Fleischmann RD, Richardson D, Peterson J, Kerlavage AR, Quackenbush J, Salzberg
S, Hanson M, van Vugt R, Palmer N, Adams MD, Gocayne J, Weidman J, Utterback
T, Watthey L, McDonald L, Artiach P, Bowman C, Garland S, Fujii C, Cotton MD,
Horst K, Roberts K, Hatch B, Smith HO, Venter JC. 1997. Genomic sequence of a
Lyme disease spirochaete, Borrelia burgdorferi. Nature 390: 580-586.
32. Ge Y, Li C, Corum L, Slaughter CA, Charon NW. 1998. Structure and Expression of
the FlaA Periplasmic Flagellar Protein of Borrelia burgdorferi. J Bacteriol 180: 2418-
2425.
33. Gray, JS. 1998. Review: The ecology of ticks transmitting Lyme borreliosis.
Experimental & Applied Acarology 22: 249-258.
34. Grimm D, Tilly K, Byram R, Stewart PE, Krum JG, Bueschel DM, Schwan TG,
Policastro PF, Elias AF, Rosa PA. 2004. Outer-surface protein C of the Lyme disease
spirochete: A protein induced in ticks for infection of mammals. PNAS 101: 3142-
3147.
35. Haake DA. 2000. Spirochaetal lipoproteins and pathogenesis. Microbiology 146:
1491-1504.
36. Hartwick RA, Assenza SP, Brown PR. 1979. Identification and quantitation of
nucleosides, bases, and other UV-absorbing compounds in serum, using reversed-

99
phase high-performance liquid chromatography. I. Chromatographic methodology. J
Chromatogr 186: 647-658.
37. He M, Boardman BK, Yan D, Yang XF. 2007. Regulation of Expression of the
Fibronectin-Binding Protein BBK32 in Borrelia burgdorferi. J Bacteriol 189: 8377-
8380.
38. Hubner A, Yang XF, Nolen DM, Popova TG, Cabello FC, Norgard MV. 2001.
Expression of Borrelia burgdorferi OspC and DbpA is controlled by a RpoN-RpoS
regulatory pathway. PNAS 22: 12724-12729.
39. Hyde JA, Shaw DK, Smith III R, Trzeciakowski JP, Skare JT. 2009. The BosR
regulatory protein of Borrelia burgdorferi interfaces with the RpoS regulatory
pathway and modulates both the oxidative stress response and pathogenic properties
of the Lyme disease spirochete. Mol Microbiol 74: 1344-1355.
40. Hyde JA, Weening EH, Skare JT. 2011a. Genetic Manipulation of Borrelia
burgdorferi. Curr Protocol Microbiol 20: 12C.4.1-12C.4.17.
41. Hyde JA, Weening EH, Chang M, Trzeciakowski JP, Hook M, Cirillo JD, Skare JT.
2011b. Bioluminescent imaging of Borrelia burgdorferi in vivo demonstrates that the
fibronectin-binding protein BBK32 is required for optimal infectivity. Mol Microbiol
82: 99-113.
42. Jain S, Sutchu, S, Rosa PA, Byram R, Jewett MW. 2012. Borrelia burgdorferi
Harbors a Transport System Essential for Purine Salvage and Mammalian Infection.
Infect Immun 80: 3086-3093.
43. Jewett MW, Lawrence K, Bestor AC, Tilly K, Grimm D, Shaw P, VanRaden M,
Gherardini F, Rosa PA. 2007. The critical role of the linear plasmid lp36 in the
infectious cycle of Borrelia burgdorferi. Mol Microbiol 64: 1358-1374.
44. Johnson RC. 1977. The Spirochetes. Ann Rev Microbiol 31: 89-106.
45. Johnson RC, Schmid GP, Hyde FW, Steigerwalt AG, Brenner DJ. 1984. Borrelia
burgdorferi sp. nov.: Etiologic Agent of Lyme Disease. Int J Syst Bacteriol 34: 496-
497.
46. Kenedy MR, Lenhart TR, Akins DR. 2012. The Role of Borrelia burgdorferi Outer
Surface Proteins. FEMS Immunol Med Microbiol 66: 1-19.
47. Kobryn K, Chaconas G. 2002. ResT, a telomere resolvase encoded by the Lyme
disease spirochete. Mol Cell 9: 195-201.
100
48. Koci J, Bernard Q, Yang X, Pal U. 2018. Borrelia burgdorferi surface protein Lmp1
facilitates pathogen dissemination through ticks as studies by an artificial membrane
feeding system. Sci Rep 8: 1910.
49. Labandeira-Ray M, Skare JT. 2001. Decreased infectivity in Borrelia burgdorferi
strain B31 is associated with loss of linear plasmid 25 or 28-1. Infect Immun 69: 446-
455.
50. Li X, Liu X, Beck DS, Kantor FS, Fikrig E. 2006. Borrelia burgdorferi Lacking
BBK32, a Fibronectin-Binding Protein, Retains Full Pathogenicity. Infect Immun 74:
3305-3313.
51. Li C, Xu H, Zhang K, Liang FT. 2010. Inactivation of a putative flagellar motor
switch protein FliG1 prevent Borrelia burgdorferi from swimming in highly viscous
media and blocks its infectivity. Mol Microbiol 75: 1563-1576.
52. Lu F, Taghbalout A. The Escherichia coli major exoribonclease RNase II is a
component of the RNA degradosome. Biosci Rep 34: e00166.
53. Lybecker MC, Abel CA, Feig AL, Samuels DS. 2010. Identification and function of
the RNA chaperone Hfq in the Lyme disease spirochete Borrelia burgdorferi. Mol
Microbiol 78: 622-635.
54. Marques A. 2008. Chronic Lyme Disease: An appraisal. Infect Dis Clin North Am
22: 341-360.
55. McBride A, Athanazio D, Reis M, Ko A. 2005. Leptospirosis. Current Opinion in
Infectious Diseases. 18: 376-386.
56. Merilainen L, Herranen A, Schwarzbach A, Gilbert L. 2015. Morphological and
biochemical features of Borrelia burgdorferi pleomorphic forms. Microbiology 161:
516-527.
57. Miller CL, Rajasekhar Karna SL, Seshu J. 2013. Borrelia host adaptation Regulator
(BadR) regulates rpoS to modulate host adaptation and virulence factors in Borrelia
burgdorferi. Mol Microbiol 88: 105-124.
58. Motaleb MA, Corum L, Bono JL, Elias AF, Rosa P, Samuels DS, Charon NW. 2000.
Borrelia burgdorferi periplasmic flagella have both skeletal and motility functions.
Proc Natl Acad Sci U S A 97: 10899-10904.
59. Motaleb MA, Miller MR, Li C, Bakker RG, Goldstein SF, Silversmith RE, Bourret
RB, Charon NW. 2005. CheX is a phosphorylated CheY phosphatase essential for
Borrelia burgdorferi chemotaxis. J Bacteriol 187: 7963-7969.

101
60. Motaleb MA, Sultan SZ, Miller MR, Li C, Charon NW. 2011. CheY3 of Borrelia
burgdorferi Is the Key Response Regulator Essential for Chemotaxis and Forms a
Long-Lived Phosphorylated Intermediate. J Bacteriol 193: 3332-3341.
61. Motaleb MA, Liu J, Wooten RM. 2015. Spirochetal motility and chemotaxis in the
natural enzootic cycle and development of Lyme disease. Current Opinion in
Microbiology 28: 106-13.
62. Nygaard P, Duckert P, Saxild HH. 1996. Role of adenine deaminase in purine salvage
and nitrogen metabolism and characterization of the ade gene in Bacillus subtilis. J
Bacteriol 178: 846-853.
63. Ohtani N, Haruki M, Morikawa M, Crouch RJ, Itaya M, Kanaya S. 1999.
Identification of the Genes Encoding Mn2+-Dependent RNase HIII from Bacillus
subtilis: Classification of RNases H into Three Families. Biochemistry 38: 605-618.
64. Ouyang Z, Kumar M, Kariu T, Hag S, Goldberg M, Pal U, Norgard MV. 2009. BosR
(BB0647) governs virulence expression in Borrelia burgdorferi. Mol Microbiol 74:
1331-1343.
65. Ouyang Z, Deka RK, Norgard MV. 2011. BosR (BB0647) Controls the RpoN-RpoS
Regulatory Pathway and Virulence Expression in Borrelia burgdorferi by a Novel
DNA-Binding Mechanism. PLoS Pathog 7: e1001272.
66. Persat A, Stone HA, Gitai Z. 2014. The curved shape of Caulobacter crescentus
enhances surface colonization in flow. Nat Commun 5: 3824.
67. Probert WS, Johnson BJ. 1998. Identification of a 47 kDa fibronectin-binding protein
expressed by Borrelia burgdorferi isolate B31. Mol Microbiol 30: 1003-1015.
68. Purser JE, Lawrenz MB, Caimano MJ, Howell JK, Radolf JD, Norris SJ. 2003. A
plasmid-encoded nicotinamidase (PncA) is essential for infectivity of Borrelia
burgdorferi in a mammalian host. Mol Microbiol 48: 753-64.
69. Radolf JD. Treponema. In: Baron S, editor. Medical Microbiology. 4th edition.
Galveston (TX): University of Texas Medical Branch at Galveston; 1996. Chapter
36. Available from: https://www.ncbi.nlm.nih.gov/books/NBK7716/
70. Radolf JD, Caimano MJ, Stevenson B, Hu LT. 2012.Of ticks, mice, and men:
understanding the dual-host lifestyle of Lyme disease spirochaetes. Nat Rev
Microbiol 10: 87-99.
71. Rosa PA, Tilly K, Stewart PE. 2005. The burgeoning molecular genetics of the Lyme
disease spirochete. Nature Review Microbiology 3: 129-143.

102
72. Rydberg B, Game J. Excision of misincorporated ribonucleotides in DNA by RNase
H (type 2) and FEN-1 in cell-free extracts. Proc Natl Acad Sci USA 99: 16654-
16659.
73. Sal MS, Li C, Motalab MA, Shibata S, Aizawa SI, Charon NW. 2008. Borrelia
burgdorferi Uniquely Regulates Its Motility Genes and Has an Intricate Flagellar
Hook-Basal Body Structure. J Bacteriol 190: 1912-1921.
74. Sapi E, Theophilus PA, Pham TV, Burugu D, Luecke DF. 2016. Effect of RpoN,
RpoS, and LuxS Pathways on the Biofilm formation and Antibiotic Sensitivity of
Borrelia burgdorferi. Eur J Microbiol Immunol 6: 272-286.
75. Schmid GP. 1985. The global distribution of Lyme disease. Reviews of Infectious
Diseases 7: 41-50.
76. Schwan TG, Piesman J, Golde WT, Dolan MC, Rosa PA. 1995. Induction of an outer
surface protein on Borrelia burgdorferi during tick feeding. Proc Natl Acad Sci USA
92: 2909-2913.
77. Schwan TG, Piesman J. 2000. Temporal changes in outer surface proteins A and C of
the Lyme disease-associated spirochete, Borrelia burgdorferi, during the chain of
infection in ticks and mice. J Clin Microbiol 38: 382-388.
78. Seshu J, Esteve-Gessent MD, Labandeira-Rey M, Kim JH, Trzeciakowski JP, Hook
M, Skare JT. 2006. Inactivation of the fibronectin-binding adhesin gene bbk32
significantly attenuates the infectivity potential of Borrelia burgdorferi. Mol
Microbiol 59: 1591-1601.
79. Setubal JC, Reis M, Matsunaga J, Haake DA. 2006. Lipoprotein computational
prediction in spirochetal genomes. Microbiology 152: 113-121.
80. Smith AH, Blevins JS, Bachlani GN, Yang XF, Norgard MV. 2007. Evidence that
RpoS (σS) in Borrelia burgdorferi is Controlled Directly by RpoN (σ54/σN). J
Bacteriol 189: 2139-2144.
81. Steere AC, Malawista SE, Snydman DR, Shope RE, Andiman WA, Ross MR, Steele
FM. 1977. An epidemic of oligoarticular arthritis in children and adults in three
Connecticut communities. Arthritis & Rheumatism 20: 7-17.
82. Steere AC, Broderick TF, Malawista SE. 1978. Erythema chronicum migrans and
Lyme arthritis: epidemiologic evidence for a tick vector. American Journal of
Epidemiology 108: 312-321.
83. Steere AC. 2001. Lyme Disease. N Engl J Med 345: 115-125.

103
84. Steere AC, Coburn J, Glickstein L. 2004. The emergence of Lyme disease. J Clin
Invest 113: 1093-1101.
85. Stewart PE, Byram R, Grimm D, Tilly K, Rosa PA. 2004a. The plasmids of Borrelia
burgdorferi: essential genetic elements of a pathogen. J Bacteriol 186: 3561-3569.
86. Stewart PE, Hoff J, Fischer E, Krum JG, Rosa PA. 2004b. Genome-Wide Transposon
Mutagenesis of Borrelia burgdorferi for Identification of Phenotypic Mutants. Appl
Environ Microbiol 70: 5973-5979.
87. Stewart PE, Rosa PA. 2008. Transposon mutagenesis of the Lyme disease agent
Borrelia burgdorferi. Methods Mol Biol 431: 85-95.
88. Sultan SZ, Manne A, Stewart PE, Bestor A, Rosa PA, Charon NW, Motaleb MA.
2013. Motility is Crucial for the Infectious Life Cycle of Borrelia burgdorferi. Infect
Immun 81: 2012-2021.
89. Sultan SZ, Sekar P, Zhao X, Manne A, Liu J, Wooten RM, Motaleb MA. 2015.
Motor Rotation Is Essential for the Formation of the Periplasmic Flagellar Ribbon,
Cellular Morphology, and Borrelia burgdorferi Persistence within Ixodes scapularis
Tick and Murine Hosts. Infect Immun 83: 1765-1777.
90. Sze CW, Morado DR, Jun L, Charon NW, Hongbin X, Chunhao L. 2011. Carbon
storage regulator A (CsrABb) is a repressor of Borrelia burgdorferi flagellin protein
FlaB. Mol Microbiol 82: 851-864.
91. Takayama K, Rothenburg RJ, Barbour AG. 1987. Absence of Lipopolysacchairde in
the Lyme disease Spirochete, Borrelia burgdorferi. Infect Immun 55: 2311-2313.
92. Tilly K, Rosa PA, Stewart PE. 2008. Biology of Infection with Borrelia burgdorferi.
Infect Dis Clin North Am 22: 217-234.
93. Troxell B, Ye M, Yang Y, Carrasco SE, Lou Y, Yang XF. 2013. Manganese and Zinc
Regulate Virulence Determinants in Borrelia burgdorferi. Infect Immun 81: 2743-
2752.
94. Wright WF, Riedel DJ, Talwani R, Gilliam BL. 2012. Diagnosis and Management of
Lyme Disease. American Family Physician 85: 1086-1093.
95. Yang DC, Blair KM, Salama NR. 2016. Staying in Shape: the Impact of Cell Shape
on Bacterial Survival in Diverse Environments. Microbiol Mol boil Rev 80: 187-203.
96. Yang XF, Goldberg MS, Popova TG, Schoeler GB, Wikel SK, Hagman KE, Norgard
MV. 2002. Interdependence of environmental factors influencing reciprocal patterns
of gene expression in virulent Borrelia burgdorferi. Mol Microbiol 37: 1470-1479.

104
97. Yang XF, Alani SM, Norgard MV. 2003. The response regulator Rrp2 is essential for
the expression of major membrane lipoproteins in Borrelia burgdorferi. Proc Natl
Acad Sci USA 100: 11001-11006.
98. Yang X, Coleman AS, Anguita J, Pal U. 2009. A Chromosomally Encoded Virulence
Factor Protects the Lyme Disease pathogen against Host-Adaptive Immunity. PLoS
Pathog 5: e1000326.
99. Yang X, Lenhart TR, Kariu T, Anguita J, Akins DR, Pal U. 2010. Characterization of
Unique Regions of Borrelia burgdorferi Surface-Located Membrane Protein 1. Infect
Immun 78: 4477-4487.
100. Ye M, Zhang JJ, Fang Z, Lawlis GB, Troxell B, Zhou Y, Gomelsky M, Lou Y,
Yang XF. 2014. Dhhp, a cyclic di-AMP phosphodiesterase of Borellia burgdorferi, is
essential for cell growth and virulence. Infect Immun 82: 1840-1849.

CURRICULUM VITAE
Amberly Nicole Grothe
Education
M.S. Microbiology & Immunology
IUPUI, Indianapolis, IN
August 2019
B.S. Biology
Abilene Christian University, Abilene, TX
May 2017
Honors and Awards
Phi Eta Sigma Honor Society
Abilene Christian University
2014
Research
IUSM Dept. of Microbiology & Immunology
Graduate Researcher in Dr. Frank Yang lab, 2017-2019
Project: “Identifying factors controlling cell shape and virulence gene expression
in Borrelia burgdorferi”
ACU Dept. of Biology
Undergraduate Researcher in Dr. Qiang Xu lab, 2016-2017
Project: Analysis and detection of viral DNA within local mosquitoes
ACU Dept. of Biology
Undergraduate Researcher in Dr. Joshua Brokaw lab
Project: Formation and analysis of phylogenies of rat genus, Thomasomys,
through DNA sequencing and analysis
Presentations and Publications
ACU Undergraduate Research Festival 2017
Poster Presentation
“Investigation of potential viral DNA and RNA genes in Abilene-area
mosquitoes”
Evolution Conference 2016, Austin, TX
Poster Presentation
“Nuclear markers for phylogeny reconstruction in Thomasomys (Rodentia:
Cricetidae)”
ACU Undergraduate Research Festival 2016
Poster Presentation
“Phylogeny of rodent genus Thomasomys (Rodentia: Cricetidae) based on the
nuclear gene recombination activating gene 1”
ACU Undergraduate Research Festival 2015
Poster Presentation
“Patterns of D-loop sequence variation in Thomasomys (Rodentia: Cricetidae)”
ACU Undergraduate Research Festival 2014
Poster Presentation
“Reconstruction of phylogenetic relationships in Thomasomys (Rodentia:
Cricetidae) based on cytochrome C oxidase subunit 1”