Embed Size (px)
Citation preview

Shannon L. Risacher,PhD
Wesley H. Anderson, MSArnaud Charil, PhDPeter F. Castelluccio, MSSergey Shcherbinin, PhDAndrew J. Saykin, PsyDAdam J. Schwarz, PhDFor the Alzheimer’s
Disease NeuroimagingInitiative
Correspondence toDr. Saykin:[email protected] Dr. Schwarz:[email protected]
Supplemental dataat Neurology.org
Alzheimer disease brain atrophy subtypesare associated with cognition and rate ofdecline
ABSTRACT
Objective: To test the hypothesis that cortical and hippocampal volumes, measured in vivo fromvolumetric MRI (vMRI) scans, could be used to identify variant subtypes of Alzheimer disease(AD) and to prospectively predict the rate of clinical decline.
Methods: Amyloid-positive participants with AD from the Alzheimer’s Disease Neuroimaging Initia-tive (ADNI) 1 and ADNI2 with baseline MRI scans (n 5 229) and 2-year clinical follow-up (n 5 100)were included. AD subtypes (hippocampal sparing [HpSpMRI], limbic predominant [LPMRI], typical AD[tADMRI]) were defined according to an algorithm analogous to one recently proposed for tau neuro-pathology. Relationships between baseline hippocampal volume to cortical volume ratio (HV:CTV)and clinical variables were examined by both continuous regression and categorical models.
Results: When participants were divided categorically, the HpSpMRI group showed significantlymore AD-like hypometabolism on 18F-fluorodeoxyglucose-PET (p , 0.05) and poorer baselineexecutive function (p , 0.001). Other baseline clinical measures did not differ across the3 groups. Participants with HpSpMRI also showed faster subsequent clinical decline thanparticipants with LPMRI on the Alzheimer’s Disease Assessment Scale, 13-Item Subscale(ADAS-Cog13), Mini-Mental State Examination (MMSE), and Functional Assessment Questionnaire(all p, 0.05) and tADMRI on the MMSE and Clinical Dementia Rating Sum of Boxes (CDR-SB) (bothp , 0.05). Finally, a larger HV:CTV was associated with poorer baseline executive function and afaster slope of decline in CDR-SB, MMSE, and ADAS-Cog13 score (p , 0.05). These associationswere driven mostly by the amount of cortical rather than hippocampal atrophy.
Conclusions: AD subtypes with phenotypes consistent with those observed with tau neuropathol-ogy can be identified in vivo with vMRI. An increased HV:CTV ratio was predictive of faster clinicaldecline in participants with AD who were clinically indistinguishable at baseline except fora greater dysexecutive presentation. Neurology® 2017;89:2176–2186
GLOSSARYAb 5 b-amyloid; AD 5 Alzheimer disease; ADAS-Cog13 5 Alzheimer’s Disease Assessment Scale, 13-Item Subscale;ADNI 5 Alzheimer’s Disease Neuroimaging Initiative; CDR-SB 5 Clinical Dementia Rating Sum of Boxes; CTV 5 corticaltotal volume; EOAD5 early-onset Alzheimer disease; FAQ5 Functional Assessment Questionnaire; FDG5 18F-fluorodeoxy-glucose; GMV 5 gray matter volume; HCI 5 hypometabolic convergence index; HpSp 5 hippocampal sparing; HV 5 hippo-campal volume; LOAD 5 late-onset Alzheimer disease; LP 5 limbic predominant; MMSE 5 Mini-Mental State Examination;NFT 5 neurofibrillary tangle; tAD 5 typical Alzheimer disease; TMT 5 Trail Making Test; vMRI 5 volumetric MRI.
When tracked longitudinally with cognitive or functional instruments, people with Alzheimerdisease (AD) exhibit varying rates of clinical decline. Emerging evidence links this heterogeneityto differences in the underlying biomarker and neuropathology profiles. Recent neuropathologystudies have sought to formalize one aspect of this variability by defining AD subtypes on thebasis of the different relative densities of pathologic tau deposits in cortical and hippocampalregions of participants with equivalently staged AD.1,2 These categorical Murray-Dickson sub-types, called hippocampal sparing (HpSp), typical AD (tAD), and limbic predominant (LP),
From the Department of Radiology and Imaging Sciences (S.L.R., A.J. Saykin, A.J. Schwarz), Indiana Alzheimer Disease Center (S.L.R., A.J.Saykin), and Department of Biostatistics (P.F.C.), Indiana University School of Medicine; Eli Lilly and Company (W.H.A., A.C., S.S., A.J.Schwarz), Indianapolis; and Department of Psychological and Brain Sciences (A.J. Schwarz), Indiana University, Bloomington.
Data used in preparation of this article were obtained from the Alzheimer’s Disease Neuroimaging Initiative (ADNI) database (adni.loni.usc.edu).As such, the investigators within the ADNI contributed to the design and implementation of ADNI and/or provided data but did not participate inanalysis or writing of this report. A complete listing of ADNI investigators can be found in the coinvestigators list at Neurology.org.
Go to Neurology.org for full disclosures. Funding information and disclosures deemed relevant by the authors, if any, are provided at the end of the article.
2176 © 2017 American Academy of Neurology
ª 2017 American Academy of Neurology. Unauthorized reproduction of this article is prohibited.
were associated with differences in age at diag-nosis and death, clinical presentation, and rateof antemortem clinical progression, with indi-viduals with the HpSp variant being younger,more commonly showing an atypical clinicalpresentation, and declining faster.1,2 In vivobrain atrophy measurements have shown vary-ing anatomic patterns and degree of atrophyacross participants, with increased corticalatrophy in a subgroup associated with moreexecutive dysfunction reminiscent of theHpSp subtype.3–5 Moreover, a within-participant comparison demonstrated thatthe ratio of cortical to hippocampal volumes(HVs) from antemortem volumetric MRI(vMRI) correlates with the postmortem tauneuropathologic variant.6
The goal of this study was to test thehypothesis that measures of regional corticaland HV, measured in vivo from vMRI, canbe used to define disease subtypes with pheno-types consistent with those based on tau neuro-pathology and that these features wouldprospectively predict differential clinical pre-sentations and rates of clinical decline in partic-ipants with AD, explaining part of thevariability in symptomatology and progression.
METHODS Participant sample. Data used in the prepara-
tion of this article were obtained from the Alzheimer’s Disease
Neuroimaging Initiative (ADNI) database (http://adni.loni.usc.
edu). Appendix e-1 and table e-1 at Neurology.org, http://www.
adni-info.org, http://adni.loni.usc.edu, and previous reports7–20
give more information.
Standard protocol approvals, registrations, and patientconsents. Written informed consent was obtained according to
the Declaration of Helsinki, and procedures were approved by
site-specific Institutional Review Boards for the Protection of
Human Subjects.
We selected amyloid-positive participants with AD from ADNI,
diagnosed as previously described (http://www.adni-info.org), with
baseline 3-dimensional T1 magnetization-prepared rapid acquisition
gradient echo vMRI scans (n 5 229). Amyloid positivity was
defined as having a CSF b-amyloid1-42 (Ab1-42) ,192 pg/mL
on the University of Pennsylvania assay.21 If CSF was not avail-
able, a 18F-florbetapir-PET cortical standardized uptake value
ratio.1.11 based on the University of California, Berkeley quan-
tification was used.22 This cohort was used to define the AD
subtypes and to assess baseline demographics, age at onset, mem-
ory, and executive function.23,24 In addition, the mean hypome-
tabolic convergence index (HCI),25 a measure of the severity of an
AD-like hypometabolism pattern on 18F-fluorodeoxyglucose
(FDG)-PET provided in the ADNI database, was assessed.
To characterize longitudinal changes, we also evaluated a sub-
cohort of participants with AD with 2-year clinical follow-up
scores on the Mini-Mental State Examination (MMSE), Alz-
heimer’s Disease Assessment Scale, 13-Item Subscale (ADAS-
Cog13), Clinical Dementia Rating Sum of Boxes (CDR-SB),
executive and memory composite, and Functional Assessment
Questionnaire (FAQ). These tests were administered as previ-
ously described (http://www.adni-info.org). The rate of change
in these scales was estimated as the slope of change from baseline
to the 2-year visit, including all intermediate visits. Longitudinal
analyses were completed only for those who had complete data (at
baseline and 6, 12, and 24 months), including n5 100 for CDR-
SB and FAQ, n5 99 for MMSE and memory composite, n5 97
for executive function composite, and n5 88 participants for the
ADAS-Cog13. Those excluded from the longitudinal analysis for
missing data (n 5 119) were not different from those included
except they had a higher baseline ADAS-Cog13 and a shorter
disease duration and were more likely not to be non-Hispanic
white (p , 0.05, data not shown).
CSF measures. CSF amyloid and tau analytes were collected
and processed as described15 and downloaded from the Labora-
tory of Neuro Imaging site (http://adni.loni.usc.edu).
vMRI analysis and endpoints. Volumetric measures were
calculated from the 3-dimensional T1 images with Free-
Surfer (version 5.1). Specifically, left and right gray matter
volumes (GMVs) from lateral frontal (caudal and rostral
midfrontal, pars opercularis, pars triangularis), superior tem-
poral, and lateral parietal (inferior parietal, superior parietal,
supramarginal) cortices in both cerebral hemispheres were
summed to provide a measure of bilateral cortical total volume
(CTV)1,6 (appendix e-1, Freesurfer Regions). HVs were also
summed to create a bilateral total. Both the CTV and HV
measures were preadjusted for the effects of intracranial vol-
ume, scanner strength (1.5T vs 3T), age, and sex with b co-
efficients estimated with a regression model estimated on all
amyloid-negative, stable, cognitively normal controls from
ADNI (see appendix e-1, Pre-adjustment Formula for Volu-
metric Measures). The residual values for CTV and HV were
then used to calculate the HV:CTV ratio (see appendix e-1,
equation 3).
Definition of AD subtypes. In the original presentation of thesubtype algorithm, the HpSp, tAD, and LP subtypes were
defined with a 2-step procedure based on the neurofibrillary
tangle (NFT) counts in the hippocampus and cortical regions.1 In
our study, the HV:CTV ratio was first split (stage 1) at the 25th
and 75th percentiles. Participants with HV:CTV ratios below the
25th percentile were provisionally designated as having LPMRI
(HV:CTV ratio #0.0408, n 5 57); those with HV:CTV ratios
above the 75th percentile were provisionally designated as having
HpSpMRI (HV:CTV ratio$0.0501, n5 57); and the remainder
were considered to have tADMRI (n 5 115). In a second step
(stage 2), only participants with HpSpMRI whose HV was greater
than the median adjusted HV (median 5 5,726.20 cm3) and
CTV was less than the median adjusted CTV (median 5
128,916.82 cm3) were considered as definitively having HpSpMRI
(n 5 33). Furthermore, only participants with LPMRI whose
CTV was greater than the median adjusted CTV and HV was less
than the median adjusted HV were retained as having LPMRI
(n 5 38). The remainder of participants were reclassified as
tADMRI (n 5 158). Note that in our study, designations are
reversed to reflect that MRI volumes decrease with disease
severity, in contrast to counts of NFT pathology, which increase.
Figure 1A displays the relative hippocampal to cortical atrophy in
the 3 subtypes.
Because a single-step procedure would be logistically simpler
to operationalize and because in a direct comparison of antemor-
tem MRI to postmortem pathologic subtypes the simple ratio of
Neurology 89 November 21, 2017 2177
ª 2017 American Academy of Neurology. Unauthorized reproduction of this article is prohibited.
hippocampal-to-cortical GMWwas found to significantly predict
the postmortem neuropathologic tau subtype,6 we also assessed
the subgroups obtained after stage 1 only of the algorithm.
Statistical analyses. Relationships between subtype categories
and age at onset, continuous demographic variables, and baseline
clinical, cognitive, CSF Ab1-42, total tau, and phosphorylated
tau181 and FDG HCI variables were assessed with a 1-way
analysis of covariance. The relationship between subtype cate-
gory and 2-year change on clinical and cognitive measures was
assessed with a repeated-measures analysis of covariance with
correction for sphericity. The relationships of subtype category
and categorical demographic and genetic variables were evaluated
with a x2 test. Finally, the linear relationships between baseline
HV, CTV, or HV:CTV as continuous variables and slope of the
2-year change in clinical and cognitive measures were assessed
with a stepwise linear regression model. Significant associations
between HV:CTV and clinical and cognitive measures were then
evaluated with a partial Pearson correlation. Age, sex, and years of
education were included in all models when appropriate.
A threshold of a 5 0.05 was used for statistical significance, and
post hoc pairwise comparisons between categories were corrected
for multiple comparisons with Bonferroni adjustment. SPSS
version 24.0 (SPSS Inc, Chicago, IL) was used for all statistical
analyses.
RESULTS Demographics. The characteristics of thesample by atrophy subtypes are summarized in table 1.The prevalence of the atypical subtypes was 31%(14.4% for HpSpMRI and 16.6% for LPMRI) afterstage 2 of the algorithm. People assigned to theHpSpMRI subtype were on average younger than
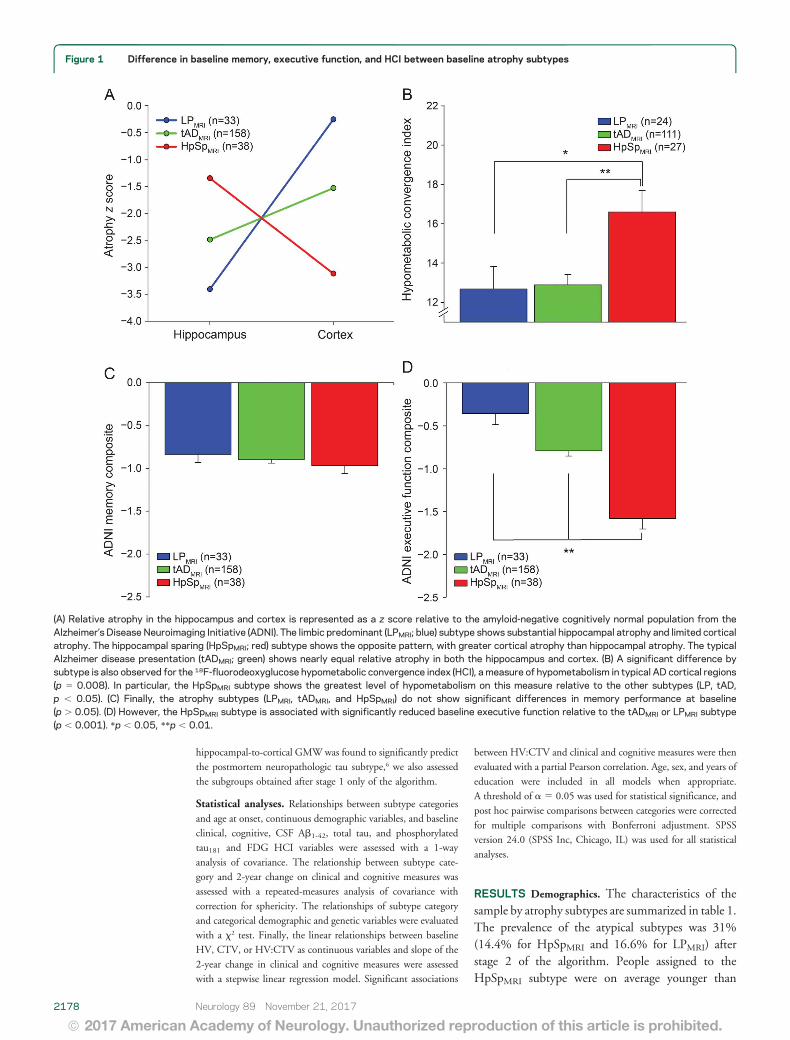
Figure 1 Difference in baseline memory, executive function, and HCI between baseline atrophy subtypes
(A) Relative atrophy in the hippocampus and cortex is represented as a z score relative to the amyloid-negative cognitively normal population from theAlzheimer’s Disease Neuroimaging Initiative (ADNI). The limbic predominant (LPMRI; blue) subtype shows substantial hippocampal atrophy and limited corticalatrophy. The hippocampal sparing (HpSpMRI; red) subtype shows the opposite pattern, with greater cortical atrophy than hippocampal atrophy. The typicalAlzheimer disease presentation (tADMRI; green) shows nearly equal relative atrophy in both the hippocampus and cortex. (B) A significant difference bysubtype is also observed for the 18F-fluorodeoxyglucose hypometabolic convergence index (HCI), a measure of hypometabolism in typical AD cortical regions(p 5 0.008). In particular, the HpSpMRI subtype shows the greatest level of hypometabolism on this measure relative to the other subtypes (LP, tAD,p , 0.05). (C) Finally, the atrophy subtypes (LPMRI, tADMRI, and HpSpMRI) do not show significant differences in memory performance at baseline(p . 0.05). (D) However, the HpSpMRI subtype is associated with significantly reduced baseline executive function relative to the tADMRI or LPMRI subtype(p , 0.001). *p , 0.05, **p , 0.01.
2178 Neurology 89 November 21, 2017
ª 2017 American Academy of Neurology. Unauthorized reproduction of this article is prohibited.
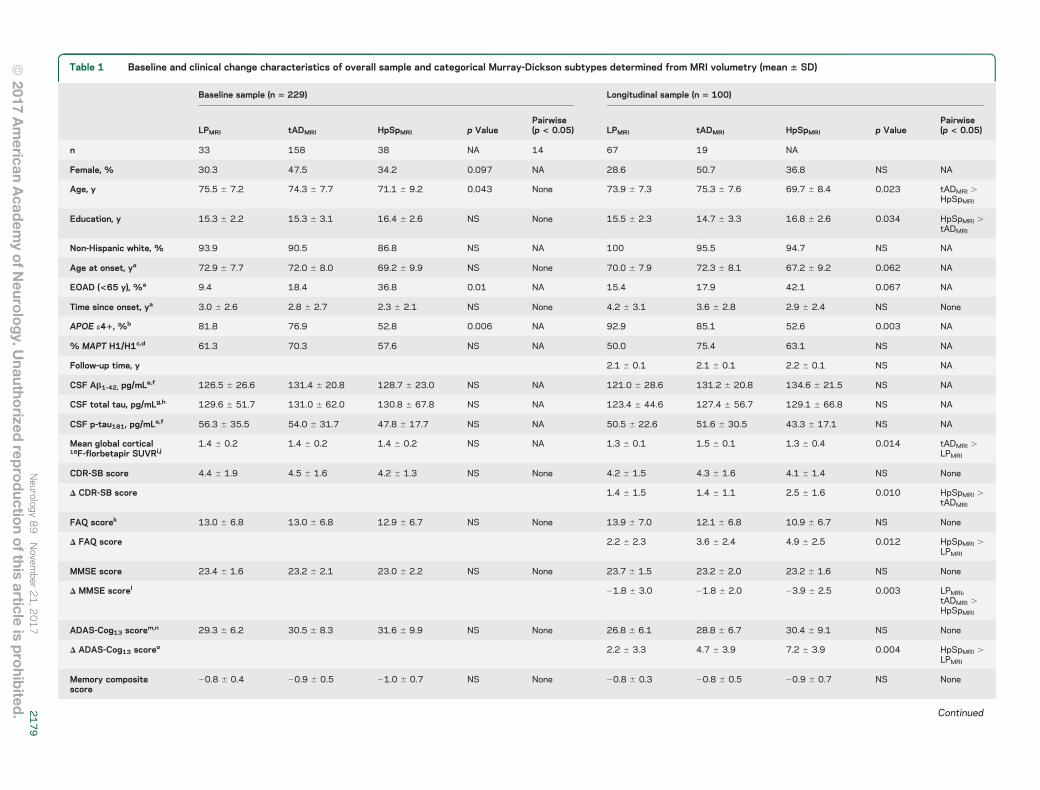
Table 1 Baseline and clinical change characteristics of overall sample and categorical Murray-Dickson subtypes determined from MRI volumetry (mean 6 SD)
Baseline sample (n 5 229) Longitudinal sample (n 5 100)
LPMRI tADMRI HpSpMRI p ValuePairwise(p < 0.05) LPMRI tADMRI HpSpMRI p Value
Pairwise(p < 0.05)
n 33 158 38 NA 14 67 19 NA
Female, % 30.3 47.5 34.2 0.097 NA 28.6 50.7 36.8 NS NA
Age, y 75.5 6 7.2 74.3 6 7.7 71.1 6 9.2 0.043 None 73.9 6 7.3 75.3 6 7.6 69.7 6 8.4 0.023 tADMRI .HpSpMRI
Education, y 15.3 6 2.2 15.3 6 3.1 16.4 6 2.6 NS None 15.5 6 2.3 14.7 6 3.3 16.8 6 2.6 0.034 HpSpMRI .tADMRI
Non-Hispanic white, % 93.9 90.5 86.8 NS NA 100 95.5 94.7 NS NA
Age at onset, ya 72.9 6 7.7 72.0 6 8.0 69.2 6 9.9 NS None 70.0 6 7.9 72.3 6 8.1 67.2 6 9.2 0.062 NA
EOAD (<65 y), %a 9.4 18.4 36.8 0.01 NA 15.4 17.9 42.1 0.067 NA
Time since onset, ya 3.0 6 2.6 2.8 6 2.7 2.3 6 2.1 NS None 4.2 6 3.1 3.6 6 2.8 2.9 6 2.4 NS None
APOE e41, %b 81.8 76.9 52.8 0.006 NA 92.9 85.1 52.6 0.003 NA
% MAPT H1/H1c,d 61.3 70.3 57.6 NS NA 50.0 75.4 63.1 NS NA
Follow-up time, y 2.1 6 0.1 2.1 6 0.1 2.2 6 0.1 NS NA
CSF Ab1-42, pg/mLe,f 126.5 6 26.6 131.4 6 20.8 128.7 6 23.0 NS NA 121.0 6 28.6 131.2 6 20.8 134.6 6 21.5 NS NA
CSF total tau, pg/mLg,h 129.6 6 51.7 131.0 6 62.0 130.8 6 67.8 NS NA 123.4 6 44.6 127.4 6 56.7 129.1 6 66.8 NS NA
CSF p-tau181, pg/mLe,f 56.3 6 35.5 54.0 6 31.7 47.8 6 17.7 NS NA 50.5 6 22.6 51.6 6 30.5 43.3 6 17.1 NS NA
Mean global cortical18F-florbetapir SUVRi,j
1.4 6 0.2 1.4 6 0.2 1.4 6 0.2 NS NA 1.3 6 0.1 1.5 6 0.1 1.3 6 0.4 0.014 tADMRI .LPMRI
CDR-SB score 4.4 6 1.9 4.5 6 1.6 4.2 6 1.3 NS None 4.2 6 1.5 4.3 6 1.6 4.1 6 1.4 NS None
D CDR-SB score 1.4 6 1.5 1.4 6 1.1 2.5 6 1.6 0.010 HpSpMRI .tADMRI
FAQ scorek 13.0 6 6.8 13.0 6 6.8 12.9 6 6.7 NS None 13.9 6 7.0 12.1 6 6.8 10.9 6 6.7 NS None
D FAQ score 2.2 6 2.3 3.6 6 2.4 4.9 6 2.5 0.012 HpSpMRI .LPMRI
MMSE score 23.4 6 1.6 23.2 6 2.1 23.0 6 2.2 NS None 23.7 6 1.5 23.2 6 2.0 23.2 6 1.6 NS None
D MMSE scorel 21.8 6 3.0 21.8 6 2.0 23.9 6 2.5 0.003 LPMRI,tADMRI .HpSpMRI
ADAS-Cog13 scorem,n 29.3 6 6.2 30.5 6 8.3 31.6 6 9.9 NS None 26.8 6 6.1 28.8 6 6.7 30.4 6 9.1 NS None
D ADAS-Cog13 scoreo 2.2 6 3.3 4.7 6 3.9 7.2 6 3.9 0.004 HpSpMRI .LPMRI
Memory compositescore
20.8 6 0.4 20.9 6 0.5 21.0 6 0.7 NS None 20.8 6 0.3 20.8 6 0.5 20.9 6 0.7 NS None
Continued
Neurology
89
Novem
ber21,2
017
2179
ª2017
American
Acad
emyof N
eurology. U
nauthorized
reproductio
nof this
articleis
prohib
ited.

Table 1 Continued
Baseline sample (n 5 229) Longitudinal sample (n 5 100)
LPMRI tADMRI HpSpMRI p ValuePairwise(p < 0.05) LPMRI tADMRI HpSpMRI p Value
Pairwise(p < 0.05)
D Memory compositescorep
20.1 6 0.2 20.2 6 0.2 20.3 6 0.2 0.041 None
Executive functioncomposite score
20.4 6 0.8 20.8 6 0.8 21.6 6 0.7 ,0.001 LPMRI .tADMRI .HpSpMRI
20.3 6 1.0 20.8 6 0.7 21.5 6 0.7 ,0.001 LPMRI,tADMRI .HpSpMRI
D Executive functioncomposite scoreq
20.2 6 0.3 20.3 6 0.3 20.3 6 0.3 NS None
Abbreviations: Ab 5 b-amyloid; ADAS-Cog13 5 Alzheimer’s Disease Assessment Scale–13-Item Subscale; APOE 5 apolipoprotein E; CDR-SB 5 Clinical Dementia Rating Scale–Sum of Boxes; EOAD 5 early-onsetAlzheimer disease (age ,65 years); FAQ 5 Functional Assessment Questionnaire; HpSpMRI 5 hippocampal sparing; LPMRI 5 limbic predominant; MAPT 5 microtubule associated protein tau; MMSE 5 Mini-MentalState Examination; NA 5 not available; p-tau181 5 tau phosphorylated at threonine 181; SUVR 5 standardized uptake value ratio (normalized to whole cerebellum); tADMRI 5 typical AD.For p values: female, non-Hispanic white, APOE e41, and MAPT haplotype based on x2 test; all others based on analysis of covariance.aOne participant missing age at onset, percent EOAD, and years since onset from both cross-sectional (CS) and longitudinal analysis (1 LPMRI).b Four participants missing APOE genotype from CS analysis (2 tADMRI, 2 HpSpMRI).c Seventeen participants missing MAPT genotype from CS analysis (1 LPMRI, 10 tADMRI, 5 HpSpMRI).d Two participants missing MAPT genotype from longitudinal analysis (2 tADMRI).e Fifteen participants missing CSF Ab1-42 and p-tau from CS analysis (2 LPMRI, 9 tADMRI, 4 HpSpMRI).f One participant missing CSF Ab1-42 and p-tau from longitudinal analysis (1 tADMRI).g Twenty-two participants missing CSF total tau from CS analysis (5 LPMRI, 13 tADMRI, 4 HpSpMRI).h Three participants missing CSF total tau from longitudinal analysis (1 LPMRI, 2 tADMRI).i Ninety-five participants missing 18F-florbetapir SUVR from CS analysis (10 LPMRI, 63 tADMRI, 12 HpSpMRI).j Seventy-four participants missing 18F-florbetapir SUVR from longitudinal analysis (8 LPMRI, 49 tADMRI, 17 HpSpMRI).kOne participant missing baseline FAQ from CS analysis (1 LPMRI).l One participant missing Δ MMSE from longitudinal analysis (1 HpSpMRI).mFour participants missing baseline ADAS-Cog13 from CS analysis (3 tADMRI, 1 HpSpMRI).nOne participant missing baseline ADAS-Cog13 from longitudinal analysis (1 tADMRI).o Seven participants missing Δ ADAS-Cog13 from longitudinal analysis (2 LPMRI, 2 tADMRI, 3 HpSpMRI).pOne participant missing Δ memory composite from longitudinal analysis (1 LPMRI).q Three participants missing Δ executive function composite from longitudinal analysis (1 tADMRI, 2 HpSpMRI).
2180
Neurology
89
Novem
ber21,2
017
ª2017
American
Acad
emyofN
eurology.U
nauthorized
reproductio
nofthis
articleis
prohib
ited.

those in both the tADMRI and LPMRI subtypes. Theprevalence of APOE e4 was significantly lower in theHpSpMRI subtype, while MAPT H1/H1 haplotypeprevalence was not different between subtypes.Finally, the HpSpMRI subtype tended to have anearlier age at onset, but this difference was not signif-icant. However, the percentage of individuals classi-fied as having early-onset AD (EOAD; onset before65 years of age) was different across the groups in thecross-sectional sample, with the HpSpMRI groupshowing the highest percentage of individuals withEOAD (table 1).
Cross-sectional analyses. Baseline CSF measures ofAb1-42, total tau, and phosphorylated tau181 werenot different between groups (table 1). Furthermore,
no differences between subtypes were observed atbaseline in the MMSE, ADAS-Cog13, CDR-SB,FAQ, or memory composite score (table 1 andfigure 2C), but the HpSpMRI subtype scored worseon the executive function composite (table 1 andfigure 2D). The FDG HCI, an index of AD-likehypometabolism, was different between atrophysubtypes, with HpSpMRI showing a greater hypo-metabolic pattern (figure 2B).
Longitudinal analyses. Mean follow-up time was notdifferent across groups (table 1). Subtype categorywas associated with 2-year decline on the CDR-SB,FAQ, ADAS-Cog13, and MMSE (table 1 and figure3) but not in the memory or executive functioncomposite scores. In post hoc comparisons, the
Figure 2 Relationship between baseline atrophy subtype and subsequent 2-year change in clinical and cognitive measures
Two-year changes in clinical and cognitive measures differed significantly between the atrophy subtypes (limbic predominant [LPMRI], typical AD [tADMRI],and hippocampal sparing [HpSpMRI]). Participants with HpSp decline more quickly than those with the other subtypes, including a significantly greater rate ofincreasing (A) clinical dementia severity (Clinical Dementia Rating [CDR] Sum of Boxes, p 5 0.013) and (B) functional impairment (Functional AssessmentQuestionnaire [FAQ], p 5 0.020), as well as (C) faster cognitive decline on the Mini-Mental State Examination (MMSE ) (p 5 0.002) and (D) Alzheimer’sDisease Assessment Scale, 13-Item Subscale (ADAS-Cog13, p , 0.001). a 5 ΔHpSp . ΔtAD, p , 0.05; b 5 ΔHpSp . ΔLP, p , 0.05; c 5 LP, tAD . HpSp,p , 0.05; d 5 ΔtAD, ΔLP . ΔHpSp, p , 0.05; and e 5 HpSp . LP, p , 0.01.
Neurology 89 November 21, 2017 2181
ª 2017 American Academy of Neurology. Unauthorized reproduction of this article is prohibited.

HpSpMRI group declined more rapidly than theLPMRI group on the FAQ, ADAS-Cog13, and MMSEand more rapidly than the tADMRI group on theCDR-SB and MMSE (p , 0.05).
We repeated all analyses using stage 1 definitionsof the classification algorithm. The results were verysimilar to those with stage 2 classification (table e-1).
Regression analyses. Finally, we examined associationsbetween HV:CTV and clinical phenotypes. At base-line, HV:CTV was not associated with any of theglobal scales (MMSE, ADAS-Cog13, CDR-SB, orFAQ) or the memory composite score but was asso-ciated with the executive function composite score,for which a higher HV:CTV ratio (reflecting
increased cortical relative to hippocampal atrophy)was associated with poorer executive function (figure3A and table 2).
The HV:CTV ratio was also associated with2-year change on the CDR-SB, MMSE, andADAS-Cog13, with higher HV:CTV ratio associatedwith a faster rate of decline (figure 3, B–D, and table2). Two-year change in the FAQ was not associatedwith either HV:CTV or any demographic variable,while 2-year change in the memory and executivecomposite scores was associated only with age andsex, respectively (table 2).
When HV and CTV were entered into the modelsas additional independent predictors, each was eachindependently associated with baseline CDR-SB,
Figure 3 Relationship between HV:CTV ratio and baseline and 2-year change in clinical and cognitive measures
Significant linear relationships between the hippocampal volume to cortical volume (HV:CTV) ratio and baseline executive function and 2-year change inclinical and cognitive measures were observed. (A) Specifically, baseline HV:CTV ratio was significantly associated with baseline executive function(rp 5 20.294, p , 0.001). Baseline HV:CTV ratio was associated with (B) a faster 2-year increase in Clinical Dementia Rating Sum of Boxes (CDR-SB,rp 5 0.283, p 5 0.003) score, (C) a faster decline in Mini-Mental State Examination (MMSE, rp 5 20.303, p 5 0.001) score, and (D) a faster increase inAlzheimer’s Disease Assessment Scale, 13-Item Subscale (ADAS-Cog13) score (rp 5 0.370, p, 0.001). Dotted lines represent the atrophy subtype cutoffsfor LPMRI vs tADMRI (lower bound) and HpSpMRI vs tADMRI (higher bound).
2182 Neurology 89 November 21, 2017
ª 2017 American Academy of Neurology. Unauthorized reproduction of this article is prohibited.

ADAS-Cog13, and MMSE scores, with decreased vol-umes associated with an increased CDR-SB andADAS-Cog13 and decreased MMSE scores (table 2).CTV alone was independently associated with thebaseline FAQ score and the executive function com-posite (and in this case HV:CTV was no longer sig-nificant), with decreased CTV associated withincreased FAQ and reduced executive function score(table 2). Both CTV and the HV:CTV ratio wereindependently associated with the baseline memorycomposite, with a lower CTV and lower HV:CTVratio associated with poorer memory (table 2). In theassessment of 2-year change and with HV and CTVincluded in the model, the HV:CTV ratio remainedsignificantly independently associated with increasingclinical dementia severity (CDR-SB), with anincreased HV:CTV ratio associated with a faster
increase in CDR-SB score (table 2). Two-year changein ADAS-Cog13 score was independently associatedwith both CTV and HV (table 2), while change inMMSE score was associated only with CTV (table 2).Similar to the findings in the models including onlyHV:CTV, the slope of change in FAQ score was notassociated with any atrophy or demographic variableand change in the memory and executive functioncomposite scores was associated only with age andsex, respectively (table 2).
DISCUSSION We found that subtypes of AD consis-tent with those identified with postmortem NFTcounts1 could be identified in vivo from vMRI incases with relatively mild dementia (mean MMSE[SD] score 23.2 [2.0], range 19–27). Specifically,an analog of the Murray-Dickson algorithm,
Table 2 Associations between continuous atrophy metrics and clinical and cognitive performance
R2
Variable 1 Variable 2 Variable 3
Name b p Value Name b p Value Name b p Value
Including demographic variables and HV:CTV ratio only
Baseline CDR-SB score NA None
Baseline FAQ score NA None
Baseline ADAS-Cog13 score NA None
Baseline MMSE score NA None
Baseline memory score NA None
Baseline executive function score 0.102 HV:CTV 233.704 ,0.001 Educ 0.035 0.047 NA
Slope of D in CDR-SB score 0.080 HV:CTV 46.351 0.004 NA NA
Slope of D in FAQ score NA None
Slope of D in ADAS-Cog13 score 0.195 HV:CTV 164.998 0.002 Age 20.124 0.013 NA
Slope of D in MMSE score 0.092 HV:CTV 289.170 0.002 NA NA
Slope of D in memory score 0.166 Age 0.011 ,0.001 NA NA
Slope of D in executive function score 0.042 Sex 20.121 0.044 NA NA
Including demographic variables, HV, CTV, and HV:CTV ratio
Baseline CDR-SB score 0.069 HV 23.9 3 1024 0.003 CTV 21.7 3 1025 0.036 NA
Baseline FAQ score 0.038 CTV 21.0 3 1024 0.003 NA NA
Baseline ADAS-Cog13 score 0.193 CTV 22.8 3 1024 ,0.001 Age 0.251 0.001 HV 20.002 0.005
Baseline MMSE score 0.102 CTV 5.0 3 1025 ,0.001 Age 20.059 0.001 HV 23.6 3 1024 0.029
Baseline memory score 0.122 CTV 2.0 3 1025 ,0.001 HV:CTV 16.147 0.002 Age 20.014 0.003
Baseline executive function score 0.296 CTV 3.9 3 1025 ,0.001 Age 20.025 ,0.001 Educ 0.033 0.039
Slope of D in CDR-SB score 0.080 HV:CTV 46.351 0.004 NA NA
Slope of D in FAQ score NA None
Slope of D in ADAS-Cog13 score 0.244 CTV 21.7 3 1024 ,0.001 HV 0.001 0.041 NA
Slope of D in MMSE score 0.181 CTV 8.6 3 1025 ,0.001 NA NA
Slope of D in memory score 0.166 Age 0.011 ,0.001 NA NA
Slope of D in executive function score 0.041 Sex 20.121 0.044 NA NA
Abbreviations: ADAS-Cog135 Alzheimer’s Disease Assessment Scale–13-Item Subscale; CDR-SB5 Clinical Dementia Rating Scale–Sum of Boxes; CTV5
cortical volume; Educ 5 education; FAQ 5 Functional Assessment Questionnaire; HV 5 hippocampal volume; MMSE 5 Mini-Mental State Examination; NA5 not available.
Neurology 89 November 21, 2017 2183
ª 2017 American Academy of Neurology. Unauthorized reproduction of this article is prohibited.

applied to hippocampal and cortical GMV to defineHpSpMRI, tADMRI, and LPMRI subtypes, yieldedclinical phenotypes consistent with those reported inthe autopsy study.1 The HpSpMRI group was youngerand declined more rapidly than both the tADMRI andLPMRI groups on measures of global cognition despitecomparable cognition at baseline. Moreover, theHpSpMRI subtype performed more poorly on a com-posite measure of executive function. When modeledas continuous variables, smaller CTV relative to HVwas predictive of decreased baseline executive func-tion and more 2-year clinical decline. When HV andCTV were modeled independently, CTV emerged asthe main driver of the baseline performance and dif-ferential rates of decline across the cohort, althoughthe ratio was independently predictive of 2-yearchange in dementia severity. Overall, given that thepatterns of AD subtypes and associated clinicalphenotypes were similar between those defined withatrophy measures from MRI and those defined withpostmortem NFT counts, these findings suggesta localized association between the amount of taupathology and the loss in GM consistent with a pre-vious report.6 Future studies with tau PET will helpto further elucidate this relationship.
Unlike at baseline, subtype did not affect 2-yeardecline in the executive function composite score.However, this finding may be due to a floor effect.Major components of the executive function scoreare Trail Making Test (TMT) A and B, which havemaximal scores for noncompletion (150 seconds forTMT A, 300 seconds for TMT B). Thus, if anindividual could not complete the TMT at baselineor at follow-up, decline in executive function couldnot be captured.
The atrophy signature and cognitive profiles asso-ciated with the different subtypes identified in thepresent study are similar to those associated with spo-radic EOAD. Specifically, increased cortical atrophy,especially in lateral and medial parietal areas, anda higher prevalence of atypical (dysexecutive, visuo-spatial) cognitive presentations have been reportedin EOAD, in contrast to atrophy predominantly inthe hippocampus and an amnestic cognitive profilein late-onset AD (LOAD).26–28 Thus, the HpSpMRI
subtype shows features similar to EOAD, whereasLOAD features are more similar to those of LPMRI.The fact that the subtype (or the continuous GMV)remained significantly associated with clinical presen-tation only when age was included in the statisticalmodel and was a stronger predictor than age itselfsuggests that while an EOAD/LOAD age cut pointprovides a simple diagnostic rule, the clinical profileand trajectory are driven by the different underlyingpatterns of neurodegeneration, which may providea more biologically driven basis for segregating
patients with AD into subtypes. Whereas a typicalAD sequence of atrophy, similar to the stereotypicalprogression of tau pathology,29,30 would show hippo-campal atrophy preceding a more widespread decreasein cortical GMV, the HpSpMRI group appears toshow the reversed sequence, with cortical atrophypreceding that of the hippocampus. The presence ofdistinct atrophy patterns in mild cognitive impair-ment and AD and the profiles of the subtypes iden-tified in the present study are also consistent withdata-driven cluster analyses, which identified differ-ential brain atrophy patterns that were dominatedeither by medial temporal atrophy or by widespreadcortical atrophy.3,31–33
The prevalence of the atypical Murray-Dicksonsubtypes found in the present study (14.4%HpSpMRI, 16.6% LPMRI) was comparable to thatfound in the original, substantially larger, autopsystudy.1 Subtypes defined solely after stage 1 of theMurray-Dickson algorithm (i.e., defined solely onthe basis of the HV:CTV ratio) exhibited phenotypicrelationships very similar to those obtained afterstage 2. In particular, the HpSpMRI group (stage 1)progressed more rapidly and performed worse onexecutive relative to memory tasks. This finding isalso consistent with the direct comparison of ante-mortem MRI to pathologic subtypes determinedpostmortem, in which the simple HV:GMV ratio(i.e., corresponding to step 1 of the algorithm) wasfound to significantly predict the postmortem neuro-pathologic tau subtype.6
To avoid selection bias, we calculated the subtypecutoffs from baseline data independently of whetherthe participants had follow-up data. If the subtypeswere calculated just on the subset of participants whohad 2-year follow-up data on all scales, the distributionof participants across the 3 subtypes was maintainedand the findings were not substantially altered (only4 participants showed different subtype categorizationin stage 1 or 2). Thus, the cutoff values to determinesubtype in the present study appear to be fairly consis-tent within the study population, supporting the pres-ence of phenotypic differences within the AD cohort.
One drawback of the Murray-Dickson algorithmis that it requires subdividing a cohort of patients(when applied to vMRI) on the basis of the distribu-tion of their hippocampal and cortical GMV andtheir ratio. Thus, this technique is not per se directlyapplicable prospectively to individual participants.However, the quartile and median values reportedin the present study may provide suitable cut pointsfor a decision tree to assign a subtype prospectivelyto new participants with mild AD with vMRI scansprocessed with the same processing pipeline and seg-mentation software. This hypothesis remains to bedetermined with replication in independent samples.
2184 Neurology 89 November 21, 2017
ª 2017 American Academy of Neurology. Unauthorized reproduction of this article is prohibited.

A few other limitations of the present study exist.Although AD pathology likely develops in preclinicaland prodromal stages over many years, we focusedonly on patients with clinical AD in this study. Futurestudies in prodromal populations (mild cognitiveimpairment, particularly amnestic vs nonamnestic),as well as preclinical AD, are warranted. Furthermore,the ADNI study recruits from primarily academicmedical institutions and may not be reflective of thebroader AD community. In addition, the study hasage (55–90 years only) and severity (mild AD or less)inclusion criteria and does not include atypical pre-sentations of AD. However, the fact that we sawdifferences by atrophy subtype despite the relativelystrict enrollment criteria suggests that these effects arerobust and generalizable. Future studies in a broaderAD population would help to better characterizethese differential atrophy profiles.
AD subtypes based on brain atrophy defined withan algorithm originally derived from postmortemNFT counts identified participants with varying clin-ical profiles, genetic background, and differential ratesof cognitive decline, consistent with those observed inthe original autopsy study. In particular, patients withthe HpSpMRI subtype, reflecting increased corticalrather than hippocampal atrophy, were generallyyounger, were less likely to be APOE e4 positive,and had both a more dysexecutive cognitive profileand a more rapid rate of clinical decline. The rate ofcognitive decline was driven primarily by corticalGMV loss. The ability to distinguish these subtypesand to determine neurodegenerative predictors ofdecline with in vivo imaging methods enables clinicaltrajectories to be predicted more accurately in livingpatients and points to the utility of considering atro-phy patterns beyond the hippocampus in the assess-ment of patients with AD.
AUTHOR CONTRIBUTIONSDr. Shannon Risacher completed the design, conceptualization, and exe-
cution of the study, performed analysis and interpretation of the data,
and was responsible for the drafting and revision of the manuscript.
Mr. Wesley Anderson and Mr. Peter Castelluccio were involved in the
analysis of the data contained in this manuscript and revision of the man-
uscript. Dr. Sergey Shcherbinin was involved in the interpretation of the
data contained in this manuscript and revision of the manuscript.
Dr. Andrew Saykin and Dr. Adam Schwarz were involved with the
design, conceptualization, and execution of the study, interpretation of
the data, and revision of the manuscript.
STUDY FUNDINGData collection and sharing for this project were funded by the ADNI
(NIH grant U01 AG024904) and Department of Defense ADNI
(Department of Defense award W81XWH-12-2-0012). ADNI is funded
by the National Institute on Aging, by the National Institute of Biomed-
ical Imaging and Bioengineering, and through generous contributions
from the following: AbbVie, Alzheimer’s Association; Alzheimer’s Drug
Discovery Foundation; Araclon Biotech; BioClinica, Inc; Biogen; Bristol-
Myers Squibb Co; CereSpir, Inc; Cogstate; Eisai Inc; Elan Pharmaceut-
icals, Inc; Eli Lilly and Company; EuroImmun; F. Hoffmann-La Roche
Ltd and its affiliated company Genentech, Inc; Fujirebio; GE Healthcare;
IXICO Ltd; Janssen Alzheimer Immunotherapy Research & Develop-
ment, LLC; Johnson & Johnson Pharmaceutical Research & Develop-
ment LLC; Lumosity; Lundbeck; Merck & Co, Inc; Meso Scale
Diagnostics, LLC; NeuroRx Research; Neurotrack Technologies;
Novartis Pharmaceuticals Corp; Pfizer Inc; Piramal Imaging; Servier;
Takeda Pharmaceutical Company; and Transition Therapeutics. The
Canadian Institutes of Health Research is providing funds to support
ADNI clinical sites in Canada. Private sector contributions are facilitated
by the Foundation for the NIH (www.fnih.org). The grantee organiza-
tion is the Northern California Institute for Research and Education, and
the study is coordinated by the Alzheimer’s Therapeutic Research Institute
at the University of Southern California. ADNI data are disseminated by
the Laboratory for Neuro Imaging at the University of Southern Califor-
nia. Additional support for analyses included in the present report was
provided by the following sources: National Institute on Aging R01
AG19771, P30 AG10133, K01 AG049050, the Alzheimer’s Association,
the Indiana University Health–Indiana University School of Medicine
Strategic Research Initiative, and the Indiana Clinical and Translational
Science Institute. This manuscript was also supported in part by a research
partnership between Indiana University School of Medicine and Eli Lilly.
DISCLOSURES. Risacher received support from the following NIH grants: P30
AG010133 and K01 AG049050, as well as the Alzheimer’s Association,
the Indiana University Health–Indiana University School of Medicine
Strategic Research Initiative, and the Indiana Clinical and Translational
Science Institute. W. Anderson is an employee and shareholder of Eli
Lilly and Company. A. Charil reports no disclosures relevant to the
manuscript. P. Castelluccio is a contractor assigned to Eli Lilly and
Company. S. Shcherbinin is an employee and shareholder of Eli Lilly and
Company. A. Saykin received support from the following NIH grants:
U01 AG032984, P30 AG010133, R01 AG019771, R01 LM011360,
R44 AG049540, and R01 CA129769. He also received collaborative
grant support from Eli Lilly during the conduct of the study. In addition,
PET tracer precursor support was provided by Avid Radio-
pharmaceuticals. Dr. Saykin also acknowledges support from Springer
Nature as editor-in-chief of Brain Imaging and Behavior. A. Schwarz is an
employee and shareholder of Eli Lilly and Company. Go to Neurology.
org for full disclosures.
Received April 25, 2017. Accepted in final form September 5, 2017.
REFERENCES
1. Murray ME, Graff-Radford N, Ross OA, Petersen RC,
Duara R, Dickson D. Neuropathologically defined subtypes
of Alzheimer’s disease with distinct clinical characteristics:
a retrospective study. Lancet Neurol 2011;10:785–796.
2. Janocko NJ, Brodersen KA, Soto-Ortolaza AI, et al. Neuro-
pathologically defined subtypes of Alzheimer’s disease differ
significantly from neurofibrillary tangle-predominant
dementia. Acta Neuropathol 2012;124:681–692.
3. Noh Y, Jeon S, Lee JM, et al. Anatomical heterogeneity of
Alzheimer disease: based on cortical thickness on MRIs.
Neurology 2014;18:1936–1944.
4. Zhang X, Mormino EC, Sun N, et al. Bayesian model
reveals latent atrophy factors with dissociable cognitive
trajectories in Alzheimer’s disease. Proc Natl Acad Sci
USA 2016;113:E6535–E6544.
5. Dickerson BC, Wolk DA. Alzheimer’s Disease Neuroi-
maging I: dysexecutive versus amnesic phenotypes of very
mild Alzheimer’s disease are associated with distinct
clinical, genetic and cortical thinning characteristics.
J Neurol Neurosurg Psychiatry 2011;82:45–51.
6. Whitwell JL, Dickson DW, Murray ME, et al. Neuro-
imaging correlates of pathologically defined subtypes of
Alzheimer’s disease: a case-control study. Lancet Neurol
2012;11:868–877.
Neurology 89 November 21, 2017 2185
ª 2017 American Academy of Neurology. Unauthorized reproduction of this article is prohibited.

7. Weiner MW, Aisen PS, Jack CR Jr, et al. The Alzheimer’s
Disease Neuroimaging Initiative: progress report and
future plans. Alzheimers Dement 2010;6:202–211.e7.
8. Aisen PS, Petersen RC, Donohue M, Weiner MW;
Alzheimer’s Disease Neuroimaging Initiative. Alzheimer’s
Disease Neuroimaging Initiative 2 clinical core: progress
and plans. Alzheimers Dement 2015;11:734–739.
9. Beckett LA, Donohue MC, Wang C, et al. The
Alzheimer’s Disease Neuroimaging Initiative phase 2:
increasing the length, breadth, and depth of our under-
standing. Alzheimers Dement 2015;11:823–831.
10. Franklin EE, Perrin RJ, Vincent B, et al. Brain collection,
standardized neuropathologic assessment, and comorbidity
in Alzheimer’s Disease Neuroimaging Initiative 2 partici-
pants. Alzheimers Dement 2015;11:815–822.
11. Hendrix JA, Finger B, Weiner MW, et al. The worldwide
Alzheimer’s Disease Neuroimaging Initiative: an update.
Alzheimers Dement 2015;11:850–859.
12. Jack CR Jr, Barnes J, Bernstein MA, et al. Magnetic
resonance imaging in Alzheimer’s Disease Neuroimaging
Initiative 2. Alzheimers Dement 2015;11:740–756.
13. Jagust WJ, Landau SM, Koeppe RA, et al. The
Alzheimer’s Disease Neuroimaging Initiative 2 PET core:
2015. Alzheimers Dement 2015;11:757–771.
14. Jones-Davis DM, Buckholtz N. The impact of the
Alzheimer’s Disease Neuroimaging Initiative 2: what role
do public-private partnerships have in pushing the bound-
aries of clinical and basic science research on Alzheimer’s
disease? Alzheimers Dement 2015;11:860–864.
15. Kang JH, Korecka M, Figurski MJ, et al. The Alzheimer’s
Disease Neuroimaging Initiative 2 biomarker core: a revie-
w of progress and plans. Alzheimers Dement 2015;11:
772–791.
16. Liu E, Luthman J, Cedarbaum JM, et al. Perspective: the
Alzheimer’s Disease Neuroimaging Initiative and the role
and contributions of the private partner scientific board
(PPSB). Alzheimers Dement 2015;11:840–849.
17. Saykin AJ, Shen L, Yao X, et al. Genetic studies of quan-
titative MCI and AD phenotypes in ADNI: progress,
opportunities, and plans. Alzheimers Dement 2015;11:
792–814.
18. Toga AW, Crawford KL. The Alzheimer’s Disease Neuro-
imaging Initiative informatics core: a decade in review.
Alzheimers Dement 2015;11:832–839.
19. Weiner MW, Veitch DP, Aisen PS, et al. Impact of the
Alzheimer’s Disease Neuroimaging Initiative, 2004 to
2014. Alzheimers Dement 2015;11:865–884.
20. Weiner MW, Veitch DP, Aisen PS, et al. 2014 Update of
the Alzheimer’s Disease Neuroimaging Initiative: a review
of papers published since its inception. Alzheimers
Dement 2015;11:e1–e120.
21. Shaw LM, Vanderstichele H, Knapik-Czajka M, et al.
Cerebrospinal fluid biomarker signature in Alzheimer’s
Disease Neuroimaging Initiative subjects. Ann Neurol
2009;65:403–413.
22. Landau SM, Breault C, Joshi AD, et al. Amyloid-beta
imaging with Pittsburgh compound B and florbetapir:
comparing radiotracers and quantification methods.
J Nucl Med 2013;54:70–77.
23. Crane PK, Carle A, Gibbons LE, et al. Development and
assessment of a composite score for memory in the
Alzheimer’s Disease Neuroimaging Initiative (ADNI).
Brain Imaging Behav 2012;6:502–516.
24. Gibbons LE, Carle AC, Mackin RS, et al. A composite
score for executive functioning, validated in Alzheimer’s
Disease Neuroimaging Initiative (ADNI) participants with
baseline mild cognitive impairment. Brain Imaging Behav
2012;6:517–527.
25. Chen K, Ayutyanont N, Langbaum JB, et al. Character-
izing Alzheimer’s disease using a hypometabolic conver-
gence index. Neuroimage 2011;56:52–60.
26. Migliaccio R, Agosta F, Possin KL, et al. Mapping the
progression of atrophy in early- and late-onset Alzheimer’s
disease. J Alzheimers Dis 2015;46:351–364.
27. Ossenkoppele R, Cohn-Sheehy BI, La Joie R, et al.
Atrophy patterns in early clinical stages across distinct
phenotypes of Alzheimer’s disease. Hum Brain Mapp
2015;36:4421–4437.
28. Frisoni GB, Pievani M, Testa C, et al. The topography of
grey matter involvement in early and late onset
Alzheimer’s disease. Brain 2007;130:720–730.
29. Braak H, Alafuzoff I, Arzberger T, Kretzschmar H, Del
Tredici K. Staging of Alzheimer disease-associated neuro-
fibrillary pathology using paraffin sections and immuno-
cytochemistry. Acta Neuropathol 2006;112:389–404.
30. Braak H, Braak E. Neuropathological stageing of Alzheimer-
related changes. Acta Neuropathol 1991;82:239–259.
31. Park JY, Na HK, Kim S, et al. Robust identification of
Alzheimer’s disease subtypes based on cortical atrophy
patterns. Sci Rep 2017;7:43270.
32. Dong A, Toledo JB, Honnorat N, et al. Heterogeneity of
neuroanatomical patterns in prodromal Alzheimer’s
disease: links to cognition, progression and biomarkers.
Brain 2017;140:735–747.
33. Na HK, Kang DR, Kim S, et al. Malignant progression in
parietal-dominant atrophy subtype of Alzheimer’s disease
occurs independent of onset age. Neurobiol Aging 2016;
47:149–156.
Our Guidelines. Your Language.Selected AAN evidence-based clinical practice guidelines are available in Arabic, Chinese, Hungarian,Japanese, Korean, Polish, Spanish, and Turkish languages, making it easier for you to providehigh-quality care for your patients. Visit AAN.com/view/MultipleLanguages.
2186 Neurology 89 November 21, 2017
ª 2017 American Academy of Neurology. Unauthorized reproduction of this article is prohibited.

DOI 10.1212/WNL.00000000000046702017;89;2176-2186 Published Online before print October 25, 2017Neurology
Shannon L. Risacher, Wesley H. Anderson, Arnaud Charil, et al. decline
Alzheimer disease brain atrophy subtypes are associated with cognition and rate of
This information is current as of October 25, 2017
ServicesUpdated Information &
http://n.neurology.org/content/89/21/2176.fullincluding high resolution figures, can be found at:
Supplementary Material
670.DC1http://n.neurology.org/content/suppl/2017/10/25/WNL.0000000000004
670.DC2http://n.neurology.org/content/suppl/2017/10/25/WNL.0000000000004Supplementary material can be found at:
References http://n.neurology.org/content/89/21/2176.full#ref-list-1
This article cites 33 articles, 3 of which you can access for free at:
Subspecialty Collections
http://n.neurology.org/cgi/collection/mriMRI
http://n.neurology.org/cgi/collection/alzheimers_diseaseAlzheimer's diseasefollowing collection(s): This article, along with others on similar topics, appears in the
Permissions & Licensing
http://www.neurology.org/about/about_the_journal#permissionsits entirety can be found online at:Information about reproducing this article in parts (figures,tables) or in
Reprints
http://n.neurology.org/subscribers/advertiseInformation about ordering reprints can be found online:
rights reserved. Print ISSN: 0028-3878. Online ISSN: 1526-632X.1951, it is now a weekly with 48 issues per year. Copyright © 2017 American Academy of Neurology. All
® is the official journal of the American Academy of Neurology. Published continuously sinceNeurology