Embed Size (px)
Citation preview

Walden UniversityScholarWorks
Walden Dissertations and Doctoral Studies Walden Dissertations and Doctoral StudiesCollection
2017
Aluminum Production Costs: A Comparative CaseStudy of Production StrategyJoseph Nloga NdjebayiWalden University
Follow this and additional works at: https://scholarworks.waldenu.edu/dissertations
Part of the Business Administration, Management, and Operations Commons, and theManagement Sciences and Quantitative Methods Commons
This Dissertation is brought to you for free and open access by the Walden Dissertations and Doctoral Studies Collection at ScholarWorks. It has beenaccepted for inclusion in Walden Dissertations and Doctoral Studies by an authorized administrator of ScholarWorks. For more information, pleasecontact [email protected].

Walden University
College of Management and Technology
This is to certify that the doctoral study by
Joseph Ndjebayi Nloga
has been found to be complete and satisfactory in all respects, and that any and all revisions required by the review committee have been made.
Review Committee Dr. Alen Badal, Committee Chairperson, Doctor of Business Administration Faculty
Dr. Scott Burrus, Committee Member, Doctor of Business Administration Faculty
Dr. Douglas Campbell, University Reviewer, Doctor of Business Administration Faculty
Chief Academic Officer Eric Riedel, Ph.D.
Walden University 2017

Abstract
Aluminum Production Costs: A Comparative Case Study of Production Strategy
by
Joseph Nloga Ndjebayi
MSM, CNAM of Lille, 2008
MSc, Yaoundé University, 2004
BSc, Yaoundé University, 1997
Doctoral Study Submitted in Partial Fulfillment
of the Requirements for the Degree of
Doctor of Business Administration
Walden University
December 2017

Abstract
Slumping world aluminum prices have energized some aluminum producers to institute
strategies to reduce product costs. This multiple comparative case study explored the
strategies used by 4 aluminum producers in Western Europe: 2 companies that have
successfully reduced production costs and 2 companies that have not. Wicksteed’s
economic theory of production and production costs was the conceptual framework for
this research. Data from the companies’ strategic and industry reports and from
interviews with 32 senior managers were analyzed using pattern finding and clustering, a
recursive approach to data gathering and analysis established by Miles, Huberman, and
Saldana. Six themes emerged: (a) upstream integration, (b) energy and price efficiency, (c)
carbon-manufacturing capability, (d) operational excellence and productivity, (e)
technological and research developmental abilities, and (f) circular economy. The
analysis of these themes indicated that the most significant opportunities for productivity
improvement include (a) minimizing energy and material use, specifically alumina,
cathodes, and carbon, (b) vertically integrating alumina production, (c) developing an
efficient circular economic model that integrates the material properties to expand the
recyclability of waste, and (d) increasing the electrolytic cell life cycle. Overall, vertical
integration provides a competitive advantage and gives the producer ability to control
costs. In-house carbon manufacturing capacity reduces a smelter’s operating cost.
Technological capabilities can minimize energy and material consumption rates.
Increased productivity and reduced energy and material use can yield positive social
changes, such as the preservation of natural resources, reduced emissions, and waste.

Aluminum Production Costs: A Comparative Case Study of Production Strategy
by
Joseph Nloga Ndjebayi
MSM, CNAM of Lille, 2008
MSc, Yaoundé University, 2004
BSc, Yaoundé University, 1997
Doctoral Study Submitted in Partial Fulfillment
of the Requirements for the Degree of
Doctor of Business Administration
Walden University
December 2017

Dedication
With God, emptiness shall be unthinkable! You have been my greatest
inspiration. I dedicate this doctoral completion study to the devotedness and love of my
wife, Monique, who has endured by me in affection in our union and beautiful family.
Your endurance has been incomparable throughout this educational journey. You stood
awake, as I did for four years; your support and belief in my ability provided me the
additional strength to accomplish this remarkable achievement. My mother, Mrs.
Cesarine Nloga: when I look at your face and think about your faith and trust, I am
invigorated; as such, I can even withstand the strongest hurricane ever confronted by a
human subject. My children—Maxime Ndejaby, Jonas Ndjebayi, Armel Ndjebayi,
Honorine Ndjebayi, and Larissa Ndjebayi—each one of you, unknowingly but
consciously, had a particular strategy to support me. Even in the turbulent times, you
were a great stimulant to my creativity. I will be infinitely appreciative for the
encouragement and patience you have granted towards the completion of this doctoral
research.

Acknowledgments
The pathway to becoming a doctor was rigorous and full of puzzles. I could not
have accomplished this journey without the help, support, and guidance of the doctoral
committee and the University Research Reviewer (URR). To my doctoral chair, Dr.
Allen Badal, I am graciously appreciative for all of your insightful thoughts, attention to
details, and the guidance you provided to me throughout this journey. Even when others
abdicated their support in trying times, you believed in the potential of the subject and my
aptitude to conduct ethical research to contribute knowledge. You upheld a continuous
support and challenged me to elevate my abilities to succeed. Your commitment to the
success of this doctoral research cannot be overstated. To my committee member, Dr.
Scott Burrus, thank you for believing that this milestone could be accomplished. Your
professionalism and your precious assessments provided an inspirational framework for
comprehensive exploration. Your contribution toward the completion of a quality
research was immense. To my URR, Dr. Douglass Campbell, you were inspirational;
your expertise and knowledge in the field of study enabled me to stay focused on the
central problem of interest. Without your expertise, my approach could have been
scattered. I believe that Walden University has given me a unique opportunity to work
with eminent staff. I am thankful for Walden students and faculty members who helped
in furthering the research quality. I will be infinitely appreciative to those who played a
role in this investigation, particularly my participants, who contributed valuable
knowledge to the aluminum production field and eventually intensified the protection of
natural resources and business sustainability.

i
Table of Contents
Section 1: Foundation of the Study ......................................................................................1
Background of the Problem ...........................................................................................1
Problem Statement .........................................................................................................3
Purpose Statement ..........................................................................................................3
Nature of the Study ........................................................................................................4
Justifying the Use of the Qualitative Methods ........................................................ 4
Competing Methods to Qualitative ......................................................................... 5
Selecting the Research Design ................................................................................ 7
Addressing Alternative Qualitative Designs ........................................................... 8
Addressing the Typologies of Case Study .............................................................. 9
Research Question .......................................................................................................10
Interview Questions .....................................................................................................11
Theoretical Framework ................................................................................................12
Operational Definitions ................................................................................................13
Assumptions, Limitations, and Delimitations ..............................................................15
Assumptions .......................................................................................................... 15
Limitations ............................................................................................................ 17
Delimitations ......................................................................................................... 18
Significance of the Study .............................................................................................19
Contribution to Business Practice ......................................................................... 19
Implications for Social Change ............................................................................. 20

ii
A Review of the Professional and Academic Literature ..............................................21
Discussion Summary ............................................................................................ 21
Strategy for Searching the Literature .................................................................... 26
Analysis and Synthesis of the Literature .............................................................. 27
Understanding the Economic Drivers in the Primary Aluminum Business ......... 30
Structural Analysis of the Production of Primary Aluminum Sector ................... 37
Economic Theory of Production and Production Costs ........................................ 42
Raising Technical Capabilities ............................................................................. 57
Summary ......................................................................................................................59
Transition .....................................................................................................................61
Section 2: The Project ........................................................................................................63
Purpose Statement ........................................................................................................64
Role of the Researcher .................................................................................................65
Data Collection Program....................................................................................... 67
Challenges in Data Collection .............................................................................. 68
Gaining Access to Participants ............................................................................. 69
Participant Selection ............................................................................................. 70
Addressing Issues of Risks and Discomfort ......................................................... 73
Benefits, Voluntary Participation, and Informed Consent .................................... 74
Research Method and Design ......................................................................................75
Research Method .................................................................................................. 76
Research Design.................................................................................................... 79

iii
Population and Sampling .............................................................................................86
Sampling Site Participants .................................................................................... 86
Sampling Participants ........................................................................................... 89
Interviewing and Location .................................................................................... 92
Duration of the Interview ...................................................................................... 93
Developing the Interviewing Scheme Based on the Flexibility of the
Qualitative Method ................................................................................... 93
Ethical Research...........................................................................................................96
Data Collection Instruments ........................................................................................98
Planning Data Collection ...................................................................................... 98
Data Collection Instrument ................................................................................... 99
Data Collection Technique ........................................................................................102
Data-Collection Steps ......................................................................................... 103
Interviewing ........................................................................................................ 103
Value Added from the Document Analysis ........................................................ 104
Data Organization Technique ............................................................................. 106
Concurrency of Data Collection and Analysis.................................................... 109
Data Analysis .............................................................................................................109
Philosophical Assumptions for the Data Analysis Technique ............................ 109
Steps to Analyzing Data...................................................................................... 110
Analyzing Data through a Comparative Approach ............................................. 115
Within-Case Analysis ................................................................................................118

iv
Data Validation: Triangulation Approach .......................................................... 118
Triangulating Two Data Sets .............................................................................. 119
Triangulating Four Datasets ................................................................................ 126
Thematic and Data Saturation Investigation ....................................................... 128
Reliability and Validity ..............................................................................................131
Reliability ............................................................................................................ 132
Validity ............................................................................................................... 134
Transition and Summary ............................................................................................140
Section 3: Application to Professional Practice and Implications for Change ................142
Introduction ................................................................................................................142
Presentation of the Findings.......................................................................................143
Case Analysis Company A ........................................................................................149
Case Description ................................................................................................. 149
Core Theme 1: Energy Management and Efficiency .......................................... 152
Core Concept 2: Upstream Integration and Geographical Location ................... 158
Core Concept 3: Productivity and Plant utilization ............................................ 160
Core Concept 4: Raw Material Consumption and Efficiency ............................ 165
Core Concept 5: Technology and R&D Capabilities .......................................... 169
Case Analysis Company B.........................................................................................171
Case Description ................................................................................................. 171
Core Concept 1: Sustainable Energy Management and Efficiency .................... 175
Core Concept 3: Material Attributes and the Circular Economy ........................ 183

v
Core Concept 4: Operational Excellence and Productivity ................................ 187
Core Concept 5: Material-Consumption Efficiency ........................................... 191
Core Concept 6: Technology and R&D Capabilities .......................................... 192
Case Analysis Company C.........................................................................................194
Case Description ................................................................................................. 194
Causal Condition 1: Energy Inefficiency ............................................................ 197
Causal Conditions 2: Missing Capability, Raw Material Acquisition ................ 201
Causal Condition 3: Carbon Anodes and Limited Manufacturing Capacity ...... 203
Causal Condition 4: Material Consumption ....................................................... 205
Core Concept 2: Operational Excellence and Productivity ................................ 207
Core Subtheme 2: Strategic Partnerships and Sourcing ..................................... 208
Core Concept 3: Sustainable Environment ......................................................... 210
Core Concept 4: Technology and R&D Capabilities .......................................... 212
Case Analysis Company D ........................................................................................213
Case Description ................................................................................................. 213
Causal Condition 1: Limited Anode Manufacturing Capacity Because of
Limited Facilities Capability................................................................... 217
Causal Condition 2: Energy Prices and Processing Inefficiencies ..................... 221
Core Concept 1: Improving Energy Efficiency .................................................. 224
Causal Condition 3: Raw Material Access, Disintegration ................................ 225
Core Concept 2: Circular Economy and the Material Attributes Selection ........ 226
Core Concept 3: Technology and R&D Capabilities .......................................... 230

vi
Cross-Case Analysis ..................................................................................................231
Cross-Case Analysis of Companies A and B ...................................................... 231
Cross-Case Analysis of Companies C and D ...................................................... 233
Cross-Case Analysis: Companies A_B Compared to Companies C_D ............. 236
Core Concept 1: Energy Consumption and Price Efficiency .............................. 243
Core Concept 2: Technological and Operational Efficiencies ............................ 247
Core Concept 3: Upstream Integration and Prices Efficiency ............................ 247
Core Concept 4: Material-Consumption Efficiency ........................................... 248
Core Concept 5: Sustainable Operation and Productivity Improvements .......... 251
Core Concept 6: Sustainable Environment and Circular Economy .................... 253
Literature review Analysis .........................................................................................255
Applications to Professional Practice ........................................................................257
Vertical Integration and Prices Efficiency .......................................................... 260
Technological and R&D Capabilities and Capacity Utilization ......................... 261
Energy Management and Efficiency ................................................................... 262
Energy Tariffs and Contracts .............................................................................. 265
Focusing on High-Returning Assets ................................................................... 266
Operational Excellence and Productivity ............................................................ 267
Circular Economy ............................................................................................... 268
Implications for Social Change ..................................................................................269
Recommendations for Action ....................................................................................270
Recommendations for Further Research ....................................................................273

vii
Reflections .................................................................................................................274
Summary and Study Conclusion ................................................................................276
References ........................................................................................................................280
Appendix A: Interview Protocol Form ............................................................................319
Appendix B: Documentary Analysis Process ..................................................................322
Appendix C: Within-Case Analysis Network ..................................................................323
Appendix D: Between-Case Analysis Network ...............................................................324
viii
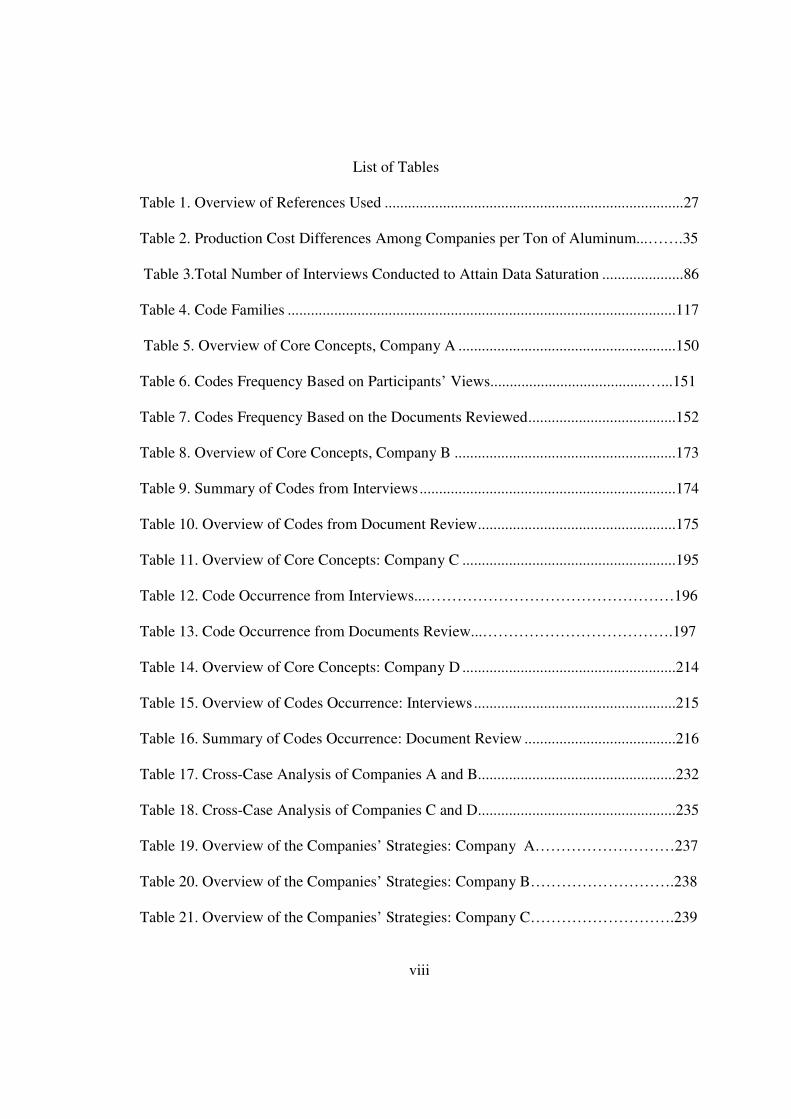
List of Tables
Table 1. Overview of References Used .............................................................................27
Table 2. Production Cost Differences Among Companies per Ton of Aluminum...…….35
Table 3.Total Number of Interviews Conducted to Attain Data Saturation .....................86
Table 4. Code Families ....................................................................................................117
Table 5. Overview of Core Concepts, Company A ........................................................150
Table 6. Codes Frequency Based on Participants’ Views........................................…...151
Table 7. Codes Frequency Based on the Documents Reviewed ......................................152
Table 8. Overview of Core Concepts, Company B .........................................................173
Table 9. Summary of Codes from Interviews ..................................................................174
Table 10. Overview of Codes from Document Review ...................................................175
Table 11. Overview of Core Concepts: Company C .......................................................195
Table 12. Code Occurrence from Interviews...…………………………………………196
Table 13. Code Occurrence from Documents Review...……………………………….197
Table 14. Overview of Core Concepts: Company D .......................................................214
Table 15. Overview of Codes Occurrence: Interviews ....................................................215
Table 16. Summary of Codes Occurrence: Document Review .......................................216
Table 17. Cross-Case Analysis of Companies A and B...................................................232
Table 18. Cross-Case Analysis of Companies C and D ...................................................235
Table 19. Overview of the Companies’ Strategies: Company A………………………237
Table 20. Overview of the Companies’ Strategies: Company B……………………….238
Table 21. Overview of the Companies’ Strategies: Company C……………………….239

ix
Table 22. Overview of the Companies’ Strategies: Company D……………………….241

x
List of Figures
Figure 1. Aluminum production stages. Adapted from interviews (Participants 1A, 3B,
4C, March 2017). ...................................................................................................... 32
Figure 2. Production cost distribution, according to participants interviewed. ................ 36
Figure 3. Systemic structures in the aluminum production sector adapted from .............. 38
Figure 4. Diminishing marginal productivity, adapted from Yao, S., & Liu, Z. (1998).. 53
Figure 5. The conceptual sampling structure of the site participants. .............................. 88
Figure 6. Sampling strategy for selecting participants. Adapted from Bornstein et al.
(2013). ....................................................................................................................... 91
Figure 7. Data organization technique, adapted from Huberman and Miles (1994). ..... 108
Figure 8. Data analysis method, adapted from “Application of case study research
(3rded.),” by Yin, R. K., 2012, Thousand Oaks, CA: Sage. ................................... 111
Figure 9. Strategy for triangulating two sources of data. Adapted from “Triangulation
2.0”, by Denzin, N. K., 2012. ................................................................................. 120
Figure 10. Thematic triangulation for Company A. ....................................................... 122
Figure 11. Thematic triangulation for Company B. ........................................................ 123
Figure 12. Thematic triangulation for Company C. ........................................................ 124
Figure 13. Thematic triangulation for Company D. ....................................................... 125
Figure 14. Strategy for triangulating four datasets. Adapted from “Triangulation 2.0,” by
Denzin, N. K., 2012. Journal of Mixed Methods Research, 6, 80–88.
doi:10.1177?1558689812437186............................................................................ 127
Figure 15. Hierarchical display of objects in Atlas.ti. .................................................... 144

xi
Figure 16. A sample memo derived from Atlas.ti. ......................................................... 145
Figure 17. A sample of the Atlas.ti Query Tool. ............................................................ 146
Figure 18. Conceptual network for Company A of energy cost minimization, derived
from Atlas.ti. ........................................................................................................... 153
Figure 19. Energy consumption efficiency, Company A exhibited................................ 157
Figure 20. The conceptual network for Company A of alumina cost minimization,
derived from Atlas.ti. .............................................................................................. 159
Figure 21. The conceptual network for Company A of operational excellence and
productivity to reduce costs, derived from Atlas.ti. ................................................ 163
Figure 22. The conceptual network for Company A of material efficiency to lower costs,
derived from Atlas.ti. .............................................................................................. 166
Figure 23. Carbon Consumption efficiency for Company A exhibited. ......................... 168
Figure 24. Energy consumption for Company B. ........................................................... 179
Figure 25. A conceptual network of Company B for energy cost minimization, derived
from Atlas.ti. ........................................................................................................... 180
Figure 26. The conceptual network for Company B of material cost reductions, derived
from Atlas.ti. ........................................................................................................... 183
Figure 27. The conceptual network of Company B for operational excellence and
productivity, derived from Atlas.ti. ................................................................................. 188
Figure 28. Environmental costs for Company B exhibited............................................. 190
Figure 29. Carbon consumption efficiency for Company B. .......................................... 192
Figure 30. Energy efficiency of Company C, according to a participant interviewed. .. 199

xii
Figure 31. Causal conditions for high production costs for Company C, derived from
Atlas.ti. .................................................................................................................... 201
Figure 32. Alumina costs for Company C, according to a participant interviewed. ....... 202
Figure 33. Carbon price inefficiency for Company C. ................................................... 204
Figure 34. Carbon consumption inefficiency for Company C. ....................................... 206
Figure 35. Causal conditions for high production costs in Company D, derived from
Atlas.ti. .................................................................................................................... 217
Figure 36. Carbon anode costs for Company D, derived from Atlas.ti. ......................... 220
Figure 37. Energy consumption efficiency for Company D, derived from Atlas.ti ....... 222
Figure 38. Energy price inefficiency for Company D, derived from Atlas.ti. ................ 223
Figure 39. Carbon consumption efficiency for Company D, derived from Atlas.ti. ...... 227
Figure 40. Alumina price efficiency for Company D, derived from Atlas.ti. ................. 228
Figure 41. Codes frequency of Companies A and B ...................................................... 233
Figure 42. Codes Occurrence Companies C and D Compared. ...................................... 236
Figure 43. Production strategies aluminum companies use to reduce costs, derived from
Atlas.ti. .................................................................................................................... 243
Figure 44. Energy efficiency of all four companies studied compared with the technical
requirement. ............................................................................................................ 244
Figure 45. Energy cost efficiency of all four companies compared with a benchmark or
baseline. .................................................................................................................. 246
Figure 46. Alumina costs of all four companies compared with technical requirements.
................................................................................................................................. 249

xiii
Figure 47. Carbon expenses of all four companies compared: components of carbon cost
(left); the difference between the theoretical and observed consumption (right). .. 250
Figure 48. Productive hour (left) and production capacity (right) of all four companies
compared. ................................................................................................................ 253
Figure 49. Aggregate strategies of all four companies, as derived from Atlas.ti. .......... 259
Figure 50. Seasonal energy management/modulation for aluminum producers. ............ 265

1
Section 1: Foundation of the Study
Since the 2008 world financial crisis, many aluminum producers have been
challenged by decreased profitability, a slump in company valuations, and downswings in
aluminum prices (Kvande & Drabløs, 2014; World Bank, 2013). Researchers have
attempted to determine the factors that contributed to these price slumps. Factors
considered have included decreasing aluminum market demand and high aluminum
outputs from China (Behmiri & Manera, 2015; Blomberg & Söderholm, 2011; Radetzki,
2013). Price slumps have had a significant impact on the viability of higher cost
aluminum production companies (World Bank, 2013). Reduced profitability in aluminum
production has affected the return on investment some shareholders expected and the
ability of some businesses to remain competitive (Blomberg & Söderholm, 2011). Given
the continued profitability challenges that aluminum producers confront, reducing costs is
becoming crucial to staying competitive (Behmiri & Manera, 2015; European
Commission, 2013; Ping, Tang, Yao, & Chen, 2013).
The European Commission (2013) found that aluminum production costs differ
from one producer to another. Additionally, World Bank (2013) found that low-cost
benchmarks exist within the aluminum production sector. Dissimilarities in companies'
production costs provided the motivational basis for the development of this case study.
Background of the Problem
In the European Union (EU), the primary aluminum industry represents a
component of production output (Blomberg & Söderholm, 2011; Götz, 2014). Most
aluminum producers must confront a changing competitive environment, including

2
monetary policies, accelerated technological changes, and a concentrated stream of
aluminum supply from China (Bianxia, Sharon, & Zesheng, 2013). Aluminum producers
based in Western European are experiencing lower profitability in their production
processes (European Commission, 2013; World Bank, 2013). Although worldwide
aluminum demand and production have risen in the last decade, Götz, (2014) found that
European-aluminum production output has declined by over 30% through plant
shutdowns and production curtailments between 2007 and 2012. Aluminum production is
a resource-intensive industry that requires profits to sustain business competition
(Blomberg & Söderholm, 2011; Hao, Geng, & Hang, 2016; Wei-Qiang & Lei Shi, 2012).
Bianxia et al. (2013), Kvande and Drabløs (2014), and Wei-Qiang and Lei Shi
(2012) have studied the profitability of aluminum producers to determine the contributing
factors leading to the price slump. Bianxia et al. found that China’s production output
increased from 12% to 40% between 2000 and 2010, an increase that affected the
equilibrium of the market’s supply and demand of the raw material and aluminum
commodity. Kvande and Drabløs found that raw material and energy constitute the main
elements of aluminum production costs in Europe. Wei-Qiang and Lei Shi discussed how
aluminum production is a resource-intensive industry that requires profits for the viability
of production plants.
A limited body of literature is available about the pattern of internal cost drivers
for aluminum production (Blomberg & Söderholm, 2011) and related production
strategies. These drivers of production costs are found throughout the aluminum
production sector. The purpose of this qualitative, multiple comparative case study was to
3
identify the strategies some aluminum producers might implement to reduce production
costs.
Problem Statement
The market prices of the primary aluminum commodity influence an aluminum
producer’s revenue and profitability (Behmiri & Manera, 2015). Aluminum commodity
prices fell by 24% from January 2008 through January 2012, and the prices remained
below marginal production costs for many producers because of persistent global
aluminum outputs that continued to surpass demand (World Bank, 2013). The general
business problem was that some aluminum producers experienced declining profitability
because of decreasing aluminum sale prices and adverse production costs (World Bank,
2013). The specific business problem was that some aluminum producers lacked the
strategies to reduce production costs.
Purpose Statement
The purpose of this qualitative, multiple comparative case study was to explore
the strategies that some aluminum producers might implement to reduce production costs.
The targeted population included aluminum production senior managers in Western
Europe. I studied a purposeful sample of four companies to compare production
strategies: two companies that were achieving sustained production costs and two that
were not. I interviewed a purposeful sample of experienced senior production managers
and analyzed documents to identify core themes and concepts that producers may
develop into strategies to reduce production costs.

4
This research has implications for positive change because the findings may help
companies increase their business sustainability and job security, domestically and
internationally, as well as in the industrial sectors that rely on aluminum within their
supply chains. Companies may also use the study findings to optimize their use of
resources and energy and to contribute to environmental protection. According to the
European Commission (2013), aluminum production is essential to maintaining a
continuous supply of semifinished products to small- and medium-sized enterprises
downstream. High-cost producers may put business sustainability and job security at risk
in the local community.
Nature of the Study
Justifying the Use of the Qualitative Methods
The goal of the qualitative method is to explore insights and practices from the
participant perspectives (Yilmaz, 2013) and a researcher’s observations (Merriam, 2014).
Pearson, Albon, and Hubball (2015) recommended that a researcher use a methodology
relevant to the context of the problem under study as well as the research goals. The
qualitative methodology is rooted in both the constructivist and interpretive
epistemologies (Corbin & Strauss, 2014; Gläser & Laudel, 2013; Guba & Lincoln, 1994;
Merriam, 2014). Researchers using the epistemological approaches to constructivism and
interpretivism believe that events facing organizations are dynamic and contextually
dependent (Merriam, 2014) and that the causal relationships between events are dynamic.
I applied the qualitative methodology in this case study because I aimed to collect data by

5
interviewing experienced senior managers to obtain insights and information power on
the strategies that might reduce production costs.
Klein and Myers (1999) recognized that organizations are not static systems; as
such, the relationships between human actions, technological capabilities, and company
strategies and performances also change. Complex systems, such as aluminum
production, may draw from constructivist and interpretive epistemologies to understand
the driving forces underpinning production cost minimization. Because a quantitative
analysis may fail to provide reliance in finding reality in a complex environment,
interpretive practices were appropriate to provide an understanding of the differences
between strategies companies use to reduce production costs. The importance of finding
contextually related business solutions and the ability to adapt solutions to new realities
aligns with the epistemological stance supported by the constructivist approach; hence,
the qualitative method was appropriate for this research.
Competing Methods to Qualitative
A scholar uses the quantitative methodology to evaluate quantifiable measures of
variables, test a hypothesis or a theory under a single reality (Yilmaz, 2013), or assess an
intervention (Pearson et al., 2015) through a representative sample selected from a given
population. A researcher uses random sampling logic in the quantitative method to
generalize findings (Yilmaz, 2013). In this qualitative study, the objective was not to
generalize findings beyond the business context given the contextual and unique
characteristics of each case (Merriam, 2014; Morse & McEvoy, 2014). Given the
purposive nature of this research, the use of a random-sampling method could have

6
contradicted the selection of (a) qualified senior managers to answer the interview
questions and (b) two categories of companies exhibiting different production-cost
performance.
Positivism underlies quantitative methods (Venkatesh, Brown, & Bala, 2013).
Positivist researchers have stated that a researcher can predict the future of events by
assuming that patterns observed in the past will replicate in the future (Klein & Myers,
1999). Klein and Myers (1999) also mentioned that a researcher examining the
relationship between factors assumes the existence of a priori fixed associations between
events and outcomes. In the case under study, the forces driving the production costs
were also contextually dependent; hence, the qualitative method allowed the data
gathering while considering both the contextual and global cost drivers.
Mixed-methods research is a combination of qualitative and quantitative methods.
A researcher uses the mixed method to investigate multiple viewpoints derived from both
the qualitative and quantitative methods (Caruth, 2013). However, given the
methodological difference between positivism and constructivism (Birchall, Murphy, &
Milne, 2016), the use of mixed methods could have introduced a contradiction to my
sampling strategy, a situation that could have jeopardized the consistency. For example,
the purposive sample of qualified senior managers was essential for providing
information power to answer the RQ. Similarly, the purposive samples of companies
exhibiting lower production costs and those facing higher production costs were critical
for the comparison.

7
Selecting the Research Design
A comparative case study was my choice of research design for exploring the
strategies that some aluminum companies might implement to reduce production costs. A
researcher can use the case study design to add to the existing body of knowledge for
organizational performance (Merriam, 2014) and to describe complex events (Baškarada,
2014). A researcher may use the case study design to gather in-depth, purposive data to
strengthen understanding of the problem (Yin, 2012). Stake (1995) argued that case
studies may be suitable for contextual analyses that are established based on multiple
sources of data.
As a company’s context is often part of the business model, various intervening
and causal conditions might overlap. I used two sources of data, including interviews and
document analysis, to apply data triangulation for producing consistency and reducing
potential biases, as recommended by Denzin (2012). Klein and Myers (1999) described
principles for interpretive research such as case studies: (a) the contextualization of the
analysis to the cultural and economic reality of the problem, (b) the principle of
interaction between the researcher and the participants, (c) dialogical reasoning, (d)
multiple interpretations, and (e) sensitivity to possible biases. In this study, interacting
with aluminum production managers required understanding the context of aluminum
production. The principle of contextualization implied investigating aluminum-
production strategies in the companies’ cultural, economic, and technological settings.
Multiple interpretations necessitated the sensitivity to possible rival explanations (i.e., by
comparing input efficiency to the theoretical baseline).

8
Several arguments motivated the decision to use the case study design in this
study. First, I collected data with attention to the context of the case. Second, case study
researchers can draw information from multiple sources and use data or method
triangulation as a way of increasing the credibility of the findings (Denzin, 2012;
Fielding, 2012; Hyett, Kenny, & Dickson-Swift, 2014; Pearson et al., 2015) and the
sensitivity to rival explanations. The use of multiple data sources in production systems is
essential for enhancing the quality of decisions that address industrial problems. Third,
increased production costs in the aluminum production field was a contemporary
industrial problem (Behmiri & Manera, 2015) requiring reflection on contextual factors
such as facilities, competencies, and other capabilities that might impact production costs.
Addressing Alternative Qualitative Designs
Alternative designs to case study include grounded theory, ethnography, narrative,
and phenomenology. Grounded theory is a systematic approach used to develop a new
theory that arises from data gathering (Compton & Barrett, 2016). This study was applied
research, and, as such, theory building was not its purpose. A researcher uses the
phenomenological design to yield an understanding of a social phenomenon based on the
participants’ lived experiences (Blom, Gustavsson, & Sundler, 2013; Olausson, Lindahl,
& Ekebergh, 2013; Sáenz, Bukoski, & Rodriguez, 2013). Investigating aluminum-
production strategies to reduce production costs was neither a social phenomenon nor a
meaning-making analysis. Therefore, the phenomenological design was not appropriate
for use in this study.

9
Higginbottom, Pillay, and Boadu (2013) defined ethnography as a social science
of communities, cultures, social interactions, and perceptions. An ethnographic design
enables researchers to study a community and the cultural patterns that are widespread
within the community (Higginbottom et al., 2013). I planned the current investigation of
strategies to reduce production costs to go beyond cultural aspects and the analysis of
social interactions; hence, an ethnographic design could not have provided a decisive
advantage in this study because the purpose was to find solutions to industrial problems.
Baškarada (2014) and Potter (2013) characterized narrative design as being a
primary method of analyzing and learning about social phenomena. Narrative design is a
form of qualitative analysis associated with the theory of representation, and it can be
used to explore social cognition (Lucic, Daiute, & Khan, 2015) or to portray how people
derive meaning from events (Robert & Shenhav, 2014). The narrative design focuses on
the structure of human knowledge (Robert & Shenhav, 2014) rather than on gathering
and processing data for discovering solutions to address technical problems. Thus, the
narrative design was inappropriate for use in this research.
Addressing the Typologies of Case Study
Stake (1995) identified the fundamental or intrinsic case study and the
instrumental case study. The intrinsic case study is appropriate for understanding a
unique case that might be longitudinal, critical, or revelatory (Yin, 2012, 2013). I selected
the instrumental case study to investigate many cases with the potential to yield literal
and theoretical replication (Yin, 2012). The instrumental case study design allowed

10
gathering data from four companies and multiple sources, which might contribute a
compelling understanding of the problem (Yazan, 2015) of production costs.
Because the companies selected for the study exhibited distinct production cost
performance (European Commission, 2013), the multiple comparative design provided an
advantage as opposed to the single case study design. The multiple comparative case
study design allowed the yielding of comparable conclusions (literal replication) and
discrete findings (logical replication; Yin, 2012). Literal and theoretical replications were
essential paradigms for discerning strategies and concepts that affect aluminum
production costs within and beyond contexts.
Research Question
Forming an appropriate RQ is fundamental to frame an inquiry and to provide
adequate solutions to the problem under study (Neri de Souza, Neri, & Costa, 2016;
White, 2013). The central RQ of this qualitative multiple comparative case study was the
following: What strategies might aluminum managers implement to reduce production
costs? The following served as a subquestion: How can a manager develop core
capabilities in production units to decrease production costs? In this study, the production
strategy is a set of patterned decisions that take into account stakeholders’ requirements
and all production factors available including operational capabilities, technology, and
the raw material accessibility to yield an optimal set of changes needed to produce
aluminum at an economical cost.

11
Interview Questions
The purpose of data collection from interviews was to provide a framework for
data analysis that I could employ to identify the strategies that aluminum companies
might implement to reduce production costs. Scholars have defined profit margins as
follows: net profit (USD) = sales revenue (USD) - total costs (USD). Therefore, two
relevant, actionable components comprise net profit: (a) sales revenue and (b) total costs
(Lohri, Camenzind, & Zurbrügg, 2014; Novy-Marx, 2013).
The manager evaluates the performance of his or her production function by the
way it adds to the corporate net profit, mainly by optimizing resources use. The questions
outlined below served as the interview framework.
1. What are the resources of production necessary for reducing production costs?
2. How do you use the resources of production to reduce production costs?
3. What strategy of production related to production costs does your company use to
minimize resource use?
4. What strategy does your company use to maximize the production output while
reducing the use of resources?
5. In line with production cost minimization, by what measurement do you consider
that you have reached the maximum limit attainable for resource use?
6. In line with production cost minimization, what strategy does your company use
to allocate resources?
7. What material management strategy does your business use to reduce production
costs?

12
8. What are your purchasing and procurement strategies to reduce production costs?
9. What level of technology do you use to minimize production costs?
10. What level of process engineering does your company use to reduce production
costs?
11. What other production capability do you use to help your business reduce its
production costs?
Theoretical Framework
The economic theory of production and production costs originates from work
conducted by Wicksteed (1894), the first economist to establish the function of
production in mathematical terms. The economic theory of production is the study of
production focusing on converting inputs into outputs through a production function
while measuring the production costs (Cobb & Douglas, 1928). The production function
describes the outputs (Fx) that a company might obtain by applying inputs into
production. Scholars mathematically establish the function of production in the form Fx =
F (f1, f2 … fn), where Fx is a productive function and f1, f2,…, and fn are productive
factors (Cobb & Douglas, 1928).
Wicksteed (1894) used the economic theory of production to identify productive
factors in a production system and described how variable resources of a production
system could influence production costs. Cobb and Douglas (1928) extended Wicksteed’s
work and suggested that a company can adjust resources of production to improve
performance. A company can develop the capabilities required to yield an efficient
production system that allows minimizing production costs in the long-term.

13
Nevertheless, Cobb and Douglas did not consider soft capabilities—such as quality,
skills, innovation, and manufacturing flexibility—as inputs that could minimize inputs
and maximize outputs.
Operational Definitions
Benchmarking strategy: Hua and Lee (2014) described benchmarking as an
efficient market-based learning process that uses best practice identification and its
replication to a business of interest. Benchmarking is an approach by which a company
identifies potential gaps between the current business performance and the desired
objective to improve performance.
Data envelopment analysis (DEA): DEA is an analytical research instrument used
in operational research to estimate and rank the efficiency of various decision-making
units when the production process exhibits many inputs and outputs (Olesen & Petersen,
2016). Using DEA, a researcher can analyze items such as allocative and economic
efficiency of decision-making units by providing adequate resources employed in a
production system (Amini, Kazemi, & Marzban, 2015; Aristovnik, Seljak, & Mencinger,
2013, 2014).
Primary aluminum: Primary aluminum is a semifinished product obtained from
the reduction of metallurgical aluminum oxide (alumina) through an electrolytic process
(Sverdrupa, Ragnarsdottirb, & Kocac, 2015).
Production costs: Numerous definitions of production costs exist in the literature;
for instance, Miltenburg (2005) defined production costs as the total expenses to the
production line to acquire and convert inputs into outputs. Govindan, Khodaverdi, and

14
Jafarian (2013) described production costs as the final price of a product. In this
definition, elements of the final price include purchasing costs, processing costs,
maintenance costs, and warranty costs (Govindan et al., 2013). The European
Commission (2013) identified elements of production expenses in the production of
primary aluminum as comprising costs for raw materials, electricity, and conversion.
In this study, production costs refer to expenditures incurred when acquiring
goods or services and processing inputs into outputs in the production of primary
aluminum. Operationally, production costs included the following cost components: (a)
the costs of procuring and transporting raw materials (e.g, alumina, carbon, and other
additives) to production plants, (b) conversion costs that included overhead expenses to
transform the raw material into semifinished products, (c) regulatory costs, and (d)
electricity costs. I excluded costs for marketing and sales.
Rival explanation: In data analysis, the rival explanation is a plausible alternative
that differs from the study’s stipulated premises (Yin, 2012).
Strategic flexibility: Scholars have described strategic flexibility as the ability to
acknowledge a change in the marketplace, allocate resources for new directions, and
thereby realize higher performance (Zhang, Juan, & Xiao, 2015). Zhang et al. (2015)
found that firms could generate strategic flexibility by adapting resources to an
exogenous development that alters the competitive position of the business.

15
Assumptions, Limitations, and Delimitations
Assumptions
The assumptions made in scientific research matter, especially when a researcher
makes arguments about reality. These thoughts are believed to be true, although a
researcher cannot prove them along the research process (Ravenek & Rudman, 2013).
Qualitative inquiries start with both the philosophical assumption about the nature of
reality (ontology) and the way researchers understand and construct knowledge to
discover reality (epistemology; Merriam, 2014; Schraw, 2013). Ontology and
epistemology constitute the basis of research (axiology); from them, a methodology
develops (Teddlie & Tashakkori, 2012). The researchers’ views about reality and the
production of knowledge rest on their epistemological and ontological inclinations
(Yazan, 2015). The first assumption in this research was that each researcher has his or
her epistemic beliefs that manifest inherently (Yazan, 2015) throughout the research
process; these ideas drive the holistic perspectives of the methodology.
According to Merriam (2014), the reality is complex and context-dependent. The
focus of this qualitative, multiple comparative case study was to identify production
strategies that companies might use to reduce production costs in their cultural and
economic contexts. The second assumption was the epistemological, ontological,
axiological, and methodological approaches to this case study offered the flexibility to
gather relevant data to explore the contextually developed production strategies to reduce
production costs. The third assumption was, through the two intertwined philosophical
stances of constructivism and interpretivism about the nature of knowing (Gorski, 2013),

16
and through interactionist-based practices between people and their experiences, I could
provide a methodological framework for discovering some elements of reality. Ritchie,
Lewis, Nicholls, and Ormston (2013) advocated the principle of interpretivism as being
fundamental to the qualitative research tradition; this approach allows exploring a
problem through different epistemologies while working beyond empiricism.
The fourth assumption was that, based on its flexibility (Yilmaz, 2013), the
qualitative research methodology allowed me to investigate diverse views of the problem
under study. Because the reality is complex and not self-evident (Gorski, 2013), these
industrial complex issues needed exploration and analysis beyond empiricism to include
different epistemologies for discovering varying folds of reality. Yanow (as cited in
Owen, 2014) found that document analysis constitutes evidence that a researcher may use
for clarity and that may corroborate interview data. The fifth assumption was that using
text analysis in combination with semistructured interviews permitted me to gain a rich
understanding of the strategies production managers used to reduce production costs and
the impact of causal conditions on businesses’ efficiency.
The sixth assumption was that when individuals understand reality, they might
consolidate it into an already existing context without changing it or considering new
facts. Given this understanding, a participant’s answers to the interview questions might
have introduced unintentional bias. I reflected such a rendition of reality as being related
to people’s intrinsic descriptions of the constructs and their interdependency or their
misinterpretations of reality. The seventh assumption was that there might be different
views and ways to address strategies to reduce production costs in aluminum production.

17
A comprehensive interpretive approach should involve various forms of contextualization
(Gorski, 2013).
Given the quantity of information required, using Computer-Assisted, Qualitative
Data Analysis Software (CAQDAS) supported qualitative analytic strategies while
providing a systematic approach to locating evidence and counterevidence within the text
to analyze (Gläser & Laudel, 2013). Cornish, Gillespie, and Zittoun (2013) and Tummons
(2014) suggested that computer-assisted programs such as Atlas.ti provide an efficient
and effective way of analyzing data that a researcher had coded previously. The eighth
assumption was that when compared to a manual data analysis technique, Atlas.ti
provides the exactness of data analyzing and organizing techniques essential to ensure
consistency throughout the propositional network of codes developed.
Limitations
All methods of inquiry have strengths, weaknesses, and limitations. Limitations
are restrictions in a study and constitute threats that may affect the quality of research
(Kirkwood & Price, 2013). Kirkwood and Price (2013) discussed how limitations might
alter the essence of an analysis and the subsequent findings. Connelly (2013) considered
that limitations concern threats to internal and external validity. Internal validity refers to
the robustness of a study’s policy. External validity focuses on the generalizability of the
conclusions to a different context.
McAreavey and Das (2013) recommended using gatekeepers as mediators to
obtain permission for entry and conduct observations. The first limitation was that I could
not negotiate the permission for entry to perform site observations because most

18
companies were reluctant about issues of confidentiality. These restrictions limited the
possibility to observe core processes and assets. Another limitation was that participants’
unintentional bias might have restricted the quality of answers to the interview questions
because the reality is complex and not self-evident to apprehend (Gorski, 2013). Such
bias might be inherent to (a) the participants' inability to acknowledge the content, (b)
their representation of reality, or (c) their failure to recall accurately historical events.
Some participants had discomfort when disclosing delicate information about their
company’s strategies.
Delimitations
Delimitations, as defined by Merriam (2014), were the boundaries I considered in
conducting this research. Operationally, delimitations specify the parameters of the
investigation and the sphere of activity in conducting the study. Delimiting parameters
include the RQ, the objectives of the study, the population under study, and the practical
factors that a researcher decides to explore.
The central RQ of this qualitative, multiple comparative case study was What
strategies might aluminum managers implement to reduce production costs? The
following served as a subquestion: “How can a manager develop core capabilities in
production units to decrease production costs?
Five main streams or segments constituted the value chain in the production of
primary aluminum (European Commission, 2014a; Tabereaux & Peterson, 2014; U.S.
Energy Information Administration, 2012). First, the upstream segment consists of the
production of raw material (alumina) through bauxite ore sources. To obtain alumina,

19
producers refine the bauxite ore through the Bayer Process. Second, alumina producers
endeavor to segregate alumina into distinct grades or quality products with the objective
to yield varietal purity. In the midstream segment or third stage, the raw material was
procured (e.g., aluminum oxide, coke, tar pitch, and other additives) and transported by
intermodal means to production facilities, where primary aluminum was produced
through the Hall-Héroult electrolytic process. Producers cast the molten aluminum tapped
from electrolytic cells to produce a range of semifinished commodities such as ingots,
slabs, billets, and casting alloys. Next, producers supply the semifinished products to
customers and the industry downstream. Finally, semifinished products are manufactured,
extruded, rolled, and transformed into high-value-added goods.
In this study, I focused on the following segments: the strategies for procuring
alumina and the production of primary aluminum and the supply of semifinished products
to the industry downstream. These were the units of analysis. The other three steps were
outside the delimiting parameters of this study.
Significance of the Study
Contribution to Business Practice
In the production and operational systems, managers often consider production
cost structure and production efficiency as core indicators of the business’s profitability.
In this qualitative multiple comparative case study, I identified the driving forces for a
sustainable aluminum business, as well as the opportunities to enhance competitiveness
through productive efficiency and the circular economic model, which is the opposite of
the linear model currently in use. I outlined areas of further exploration to improve

20
material- and energy consumption efficiencies. Furthermore, I provided a portfolio of
strategies that companies might use to reduce costs.
Implications for Social Change
Business uncertainty entails that under certain market conditions, existing
production practices might become inadequate to meet production requirements and
stakeholder expectations. Under particular pressures, stakeholder dissatisfaction might
arise. Dissatisfaction can manifest in diverse ways, including altering the sustainability of
job security (Bach & Bordogna, 2013) in local communities. The goal of this applied
research was to produce practical knowledge, with the expectation to carry better returns
for stakeholders. This study allowed me to generate concrete actions that might allow
aluminum companies to lower material consumption and to contribute to a sustainable
environment. The study also paved a new way of thinking about regenerative resources to
enhance productivity, while enabling the continuity of the community ecosystem.
Torrie, Stone, and Layzell (2016) and Valero, Valero, and Calvo (2015)
highlighted the significant role that aluminum production plays in a country’s economic
growth. The aluminum business occupies one of the most prominent positions in a
country’s economic development (European Commission, 2013, 2014b; Götz, 2014). As
such, the EU’s aluminum industry directly represents a workforce of approximately
255,000 people (European Commission, 2014b). Aluminum production’s durability,
which depends in part on the sustainability of its production costs, becomes prominent
when considering the downstream, upstream, small-, and medium-sized companies that
are all connected to the production of primary aluminum.

21
A Review of the Professional and Academic Literature
Discussion Summary
Three streams of literature were available for this study. In papers from the first
stream, I explored aluminum production from a historical perspective and outlined
production cost drivers using Porters’ five competitive forces that shape an industry. I
discussed some strategies for addressing production system performance from a
production cost perspective. The concepts covered were economies of scale and forward
and backward integration. The second stream of literature derived from the economic
theory of production and was connected to the current study’s RQ. In some of the
relevant papers from this stream, I focused on critical performance determinants of
production cost minimization. These determinants involved technical efficiency,
production flexibility, innovation, and allocative efficiency. I also discussed the
conditions under which factors of production can be used to minimize production costs
and maximize outputs. The minimization of resources to reduce production costs may be
grouped into five main strategies: (a) technology-based, (b) resources-based, (c) energy-
use-based, (d) innovative-based, and (e) operational-flexibility-based. The third stream of
literature focused on developing the capabilities required to yield an efficient production
system that can allow minimizing production costs in the long-term.
In the current market context, production companies endeavor to customize
production strategies that help meet internal performance to gain competitive advantage
(Jean-François, Boiral, Marie-Josee, & Roy, 2016). Internal production functions should
exhibit both the quality (Cant, Wiid, & Kallier, 2015) and the efficiency required to

22
reduce production costs within the design and technological limits (Herrmann & Kayasa,
2012; Miltenburg, 2005). Numerous factors affect production costs, including machine
capability, labor skills (Chauhan & Singh, 2013), quality (Herrmann & Kayasa, 2012),
processing efficiency (Farrell, 1957), and resource allocation and use (Bartelsman,
Haltiwanger, & Scarpetta, 2013; Cobb & Douglass, 1928).
Herrmann and Kayasa (2012), Miltenburg (2005), and Oke (2013) found that a
production system provides many outputs against which to measure performance.
Bartelsman et al. (2013) and Farrell (1957) showed that when optimally designed, a
production function could exhibit the efficiency required to reduce production costs.
Productive efficiency is a system’s financial contingency in which a company realizes the
maximum possible outputs from its resources (Farrell, 1957).
Restuccia and Rogerson (2013) and Jones (2011) noted that the optimal
combination of production factors depends on the efficiency of the allocative resources at
each operational level and the alignment between organizational units. With this
understanding, a complete analysis of a production-function efficiency to reduce costs
includes two principal-efficiency components: allocative and technical (Haelermans &
Ruggiero, 2013; Jones, 2011; Restuccia & Rogerson, 2013). Farrell (1957) further
decoupled technical efficiency into two constituents: input and output. Input-output
efficiency is the ratio of the total value of the products and services obtained from a
production process to the set of resources used given technological capabilities (Fang,
Guan, Lu, Zhou, & Deng, 2013). Jones (2011), Farrell (1957), and Fang et al. (2013)
found that a higher input-output efficiency refers to an efficient allocation and a rational

23
use of inputs. Tovar and Wall (2015) conceptualized productive efficiency as the capacity
inherent in a production function to allow a manager to increasing production outputs and
decreasing variable inputs while sustaining quasi-fixed resources.
Farrell (1957) and Yang, Shi, Qiao, Shao, and Wang (2016) defined the maximum
output realizable, given a set of inputs as a production frontier. The frontier technique,
which is also termed the “directional distance function” (Tovar & Wall, 2015), can be
suitable for comparing the production performance of different companies. The frontier
analysis helps to determine the extent to which a production manager can stretch inputs
and yield allocative resources to reduce production costs. Baik, Chae, Choi, and Farber
(2013) found that managers could use the production function analysis to monitor the
firm’s efficiency. Researchers can use production costs as a variable to analyze and
compare the performance of different activities within and between companies. Govindan
et al. (2013) defined production costs as the total price for the production line to acquire
and convert inputs into outputs.
As Porter (1980) and Miltenburg (2005) outlined, different strategies exist for
lowering production costs, including upstream and downstream integration, economies of
scale, innovation, and flexible production and operational modes (Ajmal, Hussain,
Kristianto, & Tenkorang, 2012). Tukker (2015) mentioned that the circular economy
allows improving the productivity of resources, which contributes to business
productivity and reduced resource depletion. Liu, Dong, Lohse, Petrovic, and Gindy
(2014); Dockendorf and Paxson (2013); and Lucio, Wendell de Queiroz, and Rubens de
Camargo (2013) found that strategic energy management in production systems could

24
reduce production costs. Strategic energy management in a production system contributes
to improving electricity consumption and cost through flexible operations and option-
pricing methods (Liu et al., 2014).
Based on the real options model for value developed by Dockendorf and Paxson
(2013), and given the complexity of the aluminum electrolytic process, the interruption of
energy input might involve significant structural and infrastructural costs. Interrupting
power in an aluminum smelter for an extended period can be financially prohibitive for
both the aluminum producer and the power provider. Finances are not the only risk
involved in curtailing a production line and restarting it; operational risks to people and
assets also exist (Bastian-Pinto, Brandão, & Ozório, 2015). Park, Simar, and Zelenyuk
(2015) found that data envelopment analysis could allow an assessment of the technical
efficiency in using the real options practice. Managers must consider asymmetric costs in
switching from the full production mode to the partial interruption of outputs and vice
versa.
Ozorio, Bastian-Pinto, Baidya, and Brandão (2013) also mentioned the
application of switching between production options. Ozorio et al. evaluated the
possibility of switching the output option from full production mode to the partial
interruption of outputs and vice versa in the steel industry for reducing production costs
under uncertain conditions. Ozorio et al. considered the different prices of the steel
produced and the production expenses incurred as inputs to evaluate the opportunity of
curtailing the production of steel and trading the available energy.

25
Cobb and Douglas (1928) and Wicksteed (1894) provided a methodology for
analyzing production system performance depending on a company's cost structure and
profitability behavior. In the body of research, the scholars outlined three main stages of
production. These steps will be detailed in the subsection entitled “Economic Theory of
Production and Production Costs.”
Blomberg and Söderholm (2011) discussed how resource-processing firms, such
as aluminum production companies, face challenges in their production strategies owing
to the complexity of the business. First, the production of primary aluminum is the mass
production of standardized products. Second, aluminum production is classified as an
electro-intensive and capital-intensive industry (Bastian-Pinto et al., 2015; Blomberg &
Söderholm, 2011; Shrouf, Ordieres-Meré, García-Sánchez, & Ortega-Mier 2014; Wei-
Qiang & Lei Shi, 2012). These characteristics render the process challenging to adapt to
changing market environments.
I have organized the remainder of this literature review around four central
themes. First, I discussed aluminum production from a historical viewpoint. Second, I
outlined the dominant economic drivers underlying the aluminum production sector.
Third, based on Porter’s (1980) model of an industrial structural analysis, I described in
detail the five competitive forces affecting the aluminum production industry and its core
segments. Finally, I reviewed the economic theory of production (ETP) and production
costs.

26
Strategy for Searching the Literature
In the literature review, I analyzed 131 references. Of these references, 117 (89%)
were from peer-reviewed journals, and I sourced the remainder from seminal scholarly
works and authoritative reports. The most commonly used journals included periodicals
such as the International Journal of Strategic Change Management, Technological
Forecasting and Social Change, the International Journal of Operations and Production
Management, Organizational Dynamics, Resources, Conservation and Recycling,
Journal of Cleaner Production, Environmental Progress and Sustainable Energy, the
International Journal of Production Economics, Global Business and Organizational
Excellence, European Journal of Production Research, and Energy Policy. I compiled
the research list by using the following initial search keywords: aluminum production
costs, production strategy, production function, production costs, marginal productivity,
technical efficiency, productive efficiency, environmental protection, and data
envelopment analysis. Scholars published most of these articles between 1894 and 2016,
with roughly 91.6% published from 2013 onward. Searching articles using the above
terms yielded more than 550 results in numerous business and academic databases, such
as Science Direct, ABI/INFORM Complete, Emerald Management, Google Books, and
ProQuest Central. Table 1 outlines the distribution of the peer-reviewed and authoritative
references.

27
Table 1
Overview of References Used
< =5 years
> 5 years
Authoritative and books
Peer-Reviewed references
Total
Number of references used for the literature review
120 11 14 117 131
Percentage of references used for the literature review
91.6% 8.4% 11% 89% 100%
Total references 241 33 32 242 274
Overall ratios of references used
88% 12% 11.7% 88.3% 100%
I reviewed the abstract to determine the appropriateness and eligibility of a
source. Mainly, I considered how the article explained to the topics of production
efficiency, production function, and production cost minimization. I found 131 articles
that met the selected inclusion criteria. I chose these authors because they discussed
contemporary views for the economic theory of production, capabilities development
paradigms, and strategies to reduce production costs. These multiple perspectives
provided insight into identifying strategies some aluminum production managers might
implement to reduce production costs.
Analysis and Synthesis of the Literature
The purpose of this qualitative, multiple comparative case study was to identify
strategies some aluminum producers might implement to reduce production costs. The
central RQ of the study was the following: What strategies might aluminum producers

28
implement to reduce production costs? The following served as a secondary question:
How can a manager develop core capabilities in the production units to reduce production
costs?
The historical perspective of the primary aluminum production. Oersted first
isolated metallic aluminum in 1825 (Bray, 2013). Scientists considered aluminum a
semiprecious metal because its retail price in the early 19th century was high compared to
other minerals (Bray, 2013). Sverdrupa et al. (2015) reported that the production levels of
primary aluminum in the early 19th century were insignificant because scientists had not
yet learned ways to process it efficiently. In 1886, however, electrolytic reduction—also
known as the Hall-Héroult process—led to increased production (Bray, 2013). The
market demand for aluminum worldwide expanded further in the 1920s because the
automotive industry was growing and aluminum had new construction applications.
In 1939, the demand and production of aluminum grew significantly, spurred on
by extensive preparation for World War II, especially in the building of military aircraft
(Bray, 2013). The aluminum industry benefited from the metal’s price advantage over
other minerals (Bray, 2013). Bray (2013) also noted that the Korean War increased
demand for aluminum.
In the late 1970s, the price of aluminum was the result of balance in the market
between supply and demand in the absence of governmental regulation and allocation
(U.S. Geological Survey [USGS], 2013). According to Bray (2013), the industry at that
time faced high inventories, surplus capacities, and limited demand across the world,
conditions that led to falling prices worldwide. Another consideration that influenced the
29
market was the introduction of aluminum to futures markets that affected its price
(Blomberg & Söderholm, 2011). According to Blomberg and Söderholm (2011),
companies needed to adjust their production policies to the complex realities of the
market. Such strategies included production cutbacks to promote decreased inventories,
the creation of a deficit that could enhance demand, and a rebound in prices (Bray, 2013).
Blomberg and Söderholm highlighted that production cuts tended to reduce short-term
revenues and cash flows.
In addition to the market supply-demand pattern for the aluminum commodity,
the USGS (2014) also found that money supply was a determining factor influencing
aluminum commodity prices. Countries exhibiting high economic deposits and growth
affected the supply-demand distribution of the aluminum product (USGS, 2014). Because
only a few dominant countries across the world share a significant proportion of
aluminum commodity consumption, the USGS claimed that significant events in such
countries could have an impact on the product’s supply-demand and its global
commodity price (USGS, 2014).
The USGS (2014) found that the Chinese and the U.S. aluminum commodity
consumption account for 22% and 18%, respectively, of worldwide consumption. The
other primary consumers of the aluminum product include Japan and Germany, whose
aggregated consumption accounts for approximately 15% of the global consumption
(USGS, 2014). A significant change in Chinese or U.S. economic deposits or growth may
affect aluminum commodity prices worldwide. The USGS found that factors that
influenced aluminum commodity prices in the last century included such international

30
events as world wars, recessions, the dissolution of the Soviet Union in 1991, and
economic growth or recession in China.
In the last decade, aluminum has become essential because of new applications
for aluminum alloys in construction, automobile and airplane manufacturing, electrical
transmission, the generation of energy, and packaging (Pogue & Lukiw, 2014; Sverdrupa
et al., 2015). The overall global output of primary aluminum has grown in the last 2
decades because of the electrolytic technological improvement in aluminum production
(European Commission, 2013). The primary aluminum production sector is now
confronting issues of competition and profitability deterioration (Blomberg & Söderholm,
2011; European Commission, 2013).
Understanding the Economic Drivers in the Primary Aluminum Business The
production of primary aluminum is the process by which raw material (alumina) is
electrolyzed into the molten electrolyte to yield pure metallic aluminum in a liquid form
(European Commission, 2014b). Aluminum companies produce the liquid form of
aluminum in steps: first, bauxite must be refined into alumina (primary raw material).
Then, the alumina obtained is reduced electrodynamically into molten aluminum through
the Hall–Héroult electrolytic reduction process. An aluminum plant consists of
electrolytic cells connected through a circuit series in which the electrolysis takes place.
Plants vary widely, composed of 100–450 cells, through which the current is passed to
create electrolysis.
A plant’s productivity depends, among other things, on the size of its cells
(capacity) and its production efficiency. The production of primary aluminum uses a

31
batch process for its production flow, in which the molten aluminum deposited at the
cathode is tapped periodically and sent to the casting plant. Depending on the design,
electrolytic-cell cathodes are composed of anthracite or graphitized materials and
petroleum coke. These materials are mixed with coal-tar pitch to form a homogenous and
long-lasting cathode. Carbon cathodes and their lifecycles are critical components of the
electrolytic cell because the economic costs related to their acquisition account for a
significant portion of capital expenses. The material used must possess the necessary
attributes—such as strength, electrical conductivity, heat capacity, and high resistance to
both wear and sodium penetration—to maximize energy efficiency and minimize the
early failure rates that increase operating costs.
Cathodic carbon is not the only critical component of the electrolytic cell. Carbon
anodes, which also are made of petroleum coke mixed with coal-tar pitch, are elements of
interest in the analysis of production costs. The manufacturing quality of anodes has
significant environmental, and economic impacts on aluminum production performance
(Chevarin et al., 2016). For instance, the energy efficiency of a manufacturing plant
depends, in part, on the quality of anodes and the constituent materials. On the other
hand, based on the bauxite grade and the stoichiometric coefficients of the chemical
reaction governing the Hall–Héroult process, for every four tons of bauxite ore extracted
from the earth’s crust, producers obtain 50% alumina and 25% molten aluminum. Thus,
raw material efficiency is a primary driver in the analysis of production costs.

32
Figure 1. Aluminum production stages. Adapted from interviews (Participants 1A, 3B,
4C, March 2017).
In the Hall–Héroult process, aluminum oxide is dissolved in a bulk of molten
cryolite at approximately 17–19 cm depth, depending on the technological design.
Anodes made of carbon, which, from a cost perspective, are the second-most valuable
raw materials, are immersed into molten cryolite. High direct electric current, ranging
from 200–500KA is passed through the molten cryolite via carbon anodes to electrolyze
the aluminum oxide. The molten aluminum is siphoned periodically from electrolytic
cells and transferred to casting facilities, where operators mold it into semi-finished
products.
During the electrolysis process, oxygen atoms are dissociated from aluminum
ions and react with the carbon anodes to generate carbon dioxide. Occasionally, the lack

33
of dissolved alumina into the molten electrolyte will cause greenhouse gases that are
sources of energy consumption as well as environmental costs that companies must pay
to sovereign governments and neighboring communities. The alumina electrolysis
process uses direct current (DC) and consumes energy at the scale of 12.5–15 DC
kWh/kg Al depending on the plant’s technological and operational capabilities (Gutowski
et al., 2013). DC measures the energy use of the electrolysis that occurs after
rectification; it does not include the power required for casting.
The theoretical power consumption required, based on the enthalpy of the reaction
of the chemical elements, and heating, is approximately 9.03 MWh/ton Al (U.S. Energy
Information Administration, 2012). Because the annual aluminum production capacity
for most smelters ranges from 150,000–500,000 tons, energy efficiency becomes a
significant economic and cost driver for sustainability. The European Commission (2014)
found that energy represents approximately 23–43% of aluminum production costs. Other
costs include management, labor, and environmental costs. Freight and intermodal
transportation costs of materials, which depend on the geographic location of the
production plant, are also significant cost drivers.
Worldwide, energy consumption by aluminum production companies ranges from
DC 12.5–15MWh per ton of material produced (Gutowski et al., 2013). The difference
between the upper and lower energy consumption levels equals 2 MWh/ton of material
output, equivalent to a potential cost avoidance of USD90/ton produced. By studying the
energy-efficiency distribution curve, production managers might understand
34
discrepancies in production costs and pinpoint energy consumption difference between
companies.
The European Commission (2013) has analyzed the cost structure in the
production of primary aluminum and found that the competitiveness of producers in
Europe differs widely. The European Commission found that electricity and labor,
together with raw materials, constitute the primary components of production costs in
aluminum production. In Europe, direct operating expenditures are distributed as follow:
energy accounts for 36% of the production costs; alumina, 30%; other raw materials, 9%;
labor, more than 12%; and other expenses, 7% (European Commission, 2013; Kvande &
Drabløs, 2014). As of 2013, the European Commission found that the EU’s regulatory
and environmental policies constituted 8% of the total aluminum production costs. Other
cost elements include transportation, storage, marketing expenses, administration costs,
and taxes. According to the European Commission, the global production cost structures
are in the range of USD1300–1900 per metric ton aluminum produced (Al). At the same
time, latest aluminum electrolysis technologies deliver the industry's most
comprehensive efficiency than the old ones do (Gutowski, Sahni, Allwood, Ashby, &
Worrell, 2013).
Table 2 is a summary of differences in production costs among the companies
observed. Figure 2 outlines the primary drivers of production costs and the ratio of each
component in the production cost structure. Data indicated that the cumulative difference
between the regional benchmark and the highest cost producer could reach USD723 per

35
ton Al (see Figure 2). This gap is high, given the relatively reduced returns on investment
observed in recent years.
Table 2
Production Cost Differences Among Companies per Ton of Aluminum
Percentage Range Minimum Observed
(USD/Ton Al) Average Costs (USD/Ton Al)
Maximum Observed USD/Ton Al
Alumina 23—29 371 419 467
Electricity 23—45 371 548 725
Carbon Anodes 11—17 177 226 274
Management and Labor 8—11 129 153 177
Chemicals and Additives 8—10 129 145 161
Maintenance and Overhead Cost
8—10 129 145 161
Environmental Costs 8—12 129 161 193
Cumulative Difference 723*
Cost/Ton
Total Costs 1435 1797 2158
Note. The symbol * represents the cumulative difference between the regional benchmark and the highest cost producer (USD per ton Al). Census data derived from the participants interviewed.
As shown in Figure 2, electricity prices drive aluminum production costs,
followed by raw material. Whereas electricity is one significant component of an
aluminum producer’s business economic sustainability, most smelters depend entirely on
the supply and efficiency of carbon and alumina, often from different parts of the world.
Transportation, raw material, and environmental costs require similar attention from
aluminum producers. Some companies, such as Ma’aden Aluminium (MAA), the joint
venture between the Saudi Arabian Mining Company and Alcoa, have taken proactive
steps to integrate all activities along the aluminum production chain, according to
participants interviewed (Participants 5A, 4C, 1D, March 2017). MAA is located on the

36
Gulf Coast of Saudi Arabia and is one of the lowest cost aluminum producers in the
world.
Figure 2. Production cost distribution, according to participants interviewed.
The raw materials used to manufacture anodic and cathodic elements (e.g., carbon
and coal) are exposed to global oil prices, which might be related to the world economic
environment (World Bank, 2013). The energy use in aluminum production requires
significant amounts of fuel, which generates carbon dioxide (Gutowski et al., 2013),
adding costs due to environmental taxes. According to technical efficiency paradigms
(Farrell, 1957), companies may adjust their energy and raw material usages to minimize
the costs of inputs.

37
Both the fluctuations in aluminum prices and the production costs influence
production outputs and strategies for aluminum production. Casadesus and Zhu (2013)
found that technological superiority and innovative business models are critical business
performance factors to reduce production costs. Innovative companies are equipped with
the necessary capabilities for long-term survival and business profitability (Helm &
Conrad, 2015). Gutowski et al. (2013) recommended that companies should develop
technology roadmaps that identify key energy challenges to taking breakthrough energy-
efficiency steps to reduce production costs.
Structural Analysis of the Production of Primary Aluminum Sector
Using Porter’s (1980) concept of five competitive forces, the industry’s structure
and a competitor’s strengths and weaknesses can be analyzed to build a foundation for a
production strategy. The five competitive forces are interpreted through the framework of
the sector’s structural analysis. A manager uses the industry’s structural analysis to (a)
determine competition within an industry, (b) plan the future strategic position of the
business units (e.g., the production system), and (c) distinguish fundamental processes
and capabilities for achieving critical goals. For this qualitative, multiple comparative
case study, I did not analyze all industry forces at a granular level; instead, I focused on
identifying the underlying strengths of efficiency that production managers may use to
reduce production costs. Figure 3 is a philosophical summary of the five competitive
forces shaping an industry in the aluminum production sector.

38
Figure 3. Systemic structures in the aluminum production sector adapted from
Porter, M. E. (1980). Competitive Strategy: Techniques for analyzing industries and
competitors. New York, NY: The Free Press.
The threat from new entrants. New entrants may change the competitive
environment and influence the profitability behavior of companies in an industry (Porter,
1980; Ray, 2015). Porter (1980) found that new entrants to an industry or the market tend
to diversify their production strategies through the introduction of new technologies that
can reduce production costs. Porter showed that both economies of scale and product
strategies could allow companies to neutralize additional production costs that a new
Supplier Characteristics:
Bargaining power
Substitute Characteristics:
Substitute products or services
Buyer Characteristics:
Bargaining power
Potential Entrants (threats)
Primary Aluminum Industry
Current rivalry
Threat
Threat
Power Power
- Supplier-to-midstream concentration ratio might increase purchasing costs.
- Forward integration might induce additional costs in the midstream.
- Raw material costs.
Current Rivalry - Overcapacity - Product strategy - A lack of enterprise concentration
in the midstream - Economies of scale - Weakened global demand
- Information level on buyers - Buyers-to-suppliers concentration
ratio is low - Buyers switching costs vs.
suppliers switching costs ratio is high
- Aluminum future long hedge or derivative markets
- A lack of differentiated products
- Threat of backward integration
Aluminum recycling Composite material
- New technologies - Lower conversion costs - Internal production capabilities and
efficiency - Economies of scale - Breakthrough technologies - Governmental subsidies and politics

39
entrant might have induced. An economy of scale refers to decreased per-unit costs of an
operation when production volumes increase (Carvalho & Marques, 2014). Porter found
that a company could rationalize activities and increase production capacity to gain cost
benefits. Porter also found that rational businesses should combine functions to
streamline and achieve operational efficiency.
Miltenburg (2005) found that a company that vertically integrates activities along
the value chain could acquire economies of scale with upstream and downstream
businesses by operating in the successive stages of its production chain. For example,
removing redundancy and reordering functions can reduce production costs. Economies
of scale might also lower production costs if a company purchases products in more
significant quantities (Porter, 1980). Notwithstanding, producers must weigh the benefits
gained from economies of scale against the storage costs incurred. Excessive inventories
may be a source of additional expenses (Esmaeilikia et al., 2014).
Economies of scale can provide a production manager the cost advantage through
large-contract purchases, resulting in a better purchase price. Economies of scale in a
production system can also increase the production rate-per-unit of time and reduce the
marginal costs of production. An analysis of the value chain provides a distinction
between unproductive assets and the sources of low-cost advantage. A company can
derive a cost-benefit by integrating, revamping, and reorganizing critical activities in the
value chain.

40
Bargaining power of suppliers, relationship to production costs. In a value
chain, suppliers can exert power by increasing material prices or by reducing the quality
of the material (Miltenburg, 2005; Porter, 1980). An increased raw material price affects
the buying costs. Porter (1980) discussed that in an industry with intense competition,
dominant suppliers often are more concentrated than their buyers are; such an industry
structure (discrepancy in concentration ratio) may affect the profitability of purchasing
companies.
Miltenburg (2005), Radetzki (2013), and Porter (1980) identified conditions under
which the power of suppliers may affect the production costs of buying companies. First,
the industry downstream is disintegrated—that is, the supplier-to-downstream
concentration ratio is high (Radetzki, 2013). Second, no substitute products are available
for the buyers. Third, the supplier product is critical for the downstream industry. Finally,
the provider may decide to perform forward integration with a company downstream.
Forward integration occurs when a vendor decides to absorb a business operating
downstream in the same industry (Glock & Kim, 2015). Glock and Kim (2015) found
that forward integration affects vertical and horizontal competition as well as the price
structure of the product under consideration. Notwithstanding, vertical integration
provides such benefits as enhanced planning, improved forecasting predictability, and the
quality of replenishment (Glock & Kim, 2015; Jin, Amydee, & Fawcett, 2013). Planning,
forecasting, and replenishing influence production costs.
Jin et al. (2013) found that integration enhances a company’s productivity and
improves operational performance. Ping et al. (2013) reported that because prices of raw

41
materials for nonferrous metals have been rising worldwide, upstream integration in the
aluminum industry would make sense. Nevertheless, Lin, Parlaktürk, and Swaminathan
(2014) found that upstream and downstream integrations tend to intensify competition.
Backward integration occurs when a company in the downstream of a given
supply chain decides to integrate upstream activities in its business (Lin et al., 2014).
Backward integration can allow convenient access to the strategic raw material while
improving purchasing activities and production coordination (Miltenburg, 2005; Porter,
1980). Lin et al. (2014) found that a company that vertically integrates functions might
capture a premium by internalizing its supplies of high-quality resources.
Some drawbacks exist in highly vertically integrated businesses. For instance,
Lahiri and Narayanan (2013); Adamczak, Domanski, Hadas, and Cyplik (2016); and
Cardoso, Ana Paula, Barbosa-Povoa, and Relvas (2013) found that highly vertically
integrated companies exhibited limited profits in leveraging innovation compared with
their vertically specialized competitors. Adamczak et al. (2016) and Hadas, Cyplik, and
Adamczak (2014) found that the highest level of integration might lead to excessive costs
incurred under stable market conditions when contrasted with potential profits.
Conversely, cost and profitability levels followed a reverse pattern under uncertainty
(Adamczak et al., 2016).
Rivalry among competitors and relationship to production costs. Porter
(1980) found that factors that may intensify the competition include slow growth in the
industry (e.g., companies across the industry exhibit weak earnings), high fixed costs, and
small profit margins. As Porter outlined, some production strategies companies may use

42
to absorb fixed costs in the long-term include proprietary technology and outsourcing
strategies. A company may outsource non-core activities or functions in which it
demonstrates an inability to reduce costs. Outsourcing may involve both domestic and
international activities.
According to Ma, Chang, and Hung (2013), proprietary technology may be a
strategic resource or input in a production system and can provide an advantage in a
highly competitive environment. Porter (1980) argued that technological capability might
provide a production cost advantage in the long-term if it is inimitable, rare, and involves
some costs to access it. Gutowski et al. (2013) found that implementing low-cost capacity
machines or replacing high-cost technologies could provide high-energy efficiency.
Where production systems can provide the flexibility for differentiated products or modes
of production, Eckel, Iacovone, Javorcik, and Neary (2015) found that companies could
gain quality premium and lower production costs.
Structural analysis of an industry allows distinguishing fundamental strengths and
weaknesses in the face of competitive forces (Porter, 1980). A production strategy
requires the consideration of all options and the development of production capabilities to
reduce costs. Critical enablers for reducing costs include human competencies, facilities
strategy, material-based strategies, process technologies, sourcing, and production
planning (Miltenburg, 2005).
Economic Theory of Production and Production Costs
Stages of the production function and business profitability. Shepherd (2015)
and Wicksteed (1894) defined the production function as a combination of factors used in

43
a process to yield outputs. Cobb and Douglas (1928) and Wicksteed (1894) found that
each production function consists of different stages. Producers can increase or decrease
outputs by adjusting the inputs. Nevertheless, a manager may face increasing returns to
scale (IRS), constant returns to scale (CRS), or diminishing returns to scale (DRS;
Restuccia & Rogerson, 2013). CRS and DRS may arise in cases where input levels are
not controlled adequately—in such circumstances, production costs might increase
(Cook, Tone, & Zhu, 2014).
Cobb and Douglas (1928) and Wicksteed (1894) outlined three main stages of
production depending on production cost structure and profitability behavior. In stage
one, producers obtain maximum outputs proportional to increased inputs. At this point,
the production function exhibits increasing marginal returns to scale (Restuccia &
Rogerson, 2013). In production companies, however, economic considerations often
exist, as well as the quest for business growth and cost efficiency, both of which imply
that a firm cannot limit its performance or increase the use of resources indefinitely
(Jones, 2011). As a company increases inputs, production outputs change and follow a
different behavior in stage two. Outputs may not vary proportionally with the resources
used. Instead, the rate of production remains constant despite the level of the resources
used; then, the firm faces CRS. In addition, one characteristic of this stage of production
is that marginal returns and profitability continue to decrease (Cobb & Douglas, 1928;
Wicksteed, 1894) compared to stage one. An inflection point may occur, given the
convex nature of the model, for which the outputs stagnate despite increasing inputs
(Jones, 2011; Restuccia & Rogerson; 2013).
44
In stage three, the production cost structure changes, despite an intensifying use of
inputs—outputs decrease, while marginal costs increase (Cobb & Douglas, 1928). A
company faces the DRS. Production companies may overuse some resources in the DRS
if production managers fail to conduct adequate net present value analysis of choices. In
sum, companies need to know the boundaries of each production phase so they can
analyze production costs and identify when to start allocating resources (Jones, 2011;
Restuccia & Rogerson, 2013).
Factors of production and production costs. When a production manager
creates core activities for a firm, production is a central consideration. A method for
analyzing the performance of a decision-making unit (DMU) is monitoring the ratio of
outputs to inputs (Cobb & Douglas, 1928; Wicksteed, 1894). Cobb and Douglas (1928)
and Wicksteed (1894) analyzed aggregate factors of production and their influence on
production costs. Cobb and Douglas found that a manager might adjust inputs or
resources used in production to optimize the cost efficiency.
In economics, inputs are termed factors of production. Modern companies such
as aluminum plants often include raw material, energy, labor, technology, and financial
capital as inputs. Energy plays a critical role in aluminum production costs (Sverdrupa et
al., 2015). Chauhan and Singh (2013), Porter (1980), and Latham (2013) found that
skilled labor could be a source of competitive advantage for reducing costs and may
provide adaptability in a changing business context. Porter (1980) considered that
experienced R&D staff could be a source of creativity, simplicity, and reliability in the
quest for differentiation and cost minimization. Kvande (2015) found that production

45
costs for many aluminum production companies depend on their operational efficiency.
Resource utilization, technological capability, and processes design are variables of
production cost. Investments in technical capabilities provide the standard of efficiency in
production systems (Dosi, Grazzi, & Moschella, 2015).
The concept of efficiency. In aluminum production, economics refers to the
analysis of choices a manager makes under insufficient resources. A key measure of any
production system is its efficiency (Farrell, 1957). Miltenburg (2005) found that
efficiency in a production system requires high-quality facilities, process innovativeness
and flexibility, and technological capacity. Cobb and Douglas (1928) described the
production function in mathematical form as P = f (L, K, R), where P is the amount of
output; and L, K, and R represent the resources employed (e.g., energy, material, labor
skills, technologies). Production managers define the factors’ efficiency through their
respective ratios: L/P, K/P, and R/P. A manager can also measure the production
performance by tracking changes in the marginal product of operation (MPO). The MPO
is the rate at which total factor outputs change as a company modifies its inputs. In
mathematical terms, the MPO can be calculated as MPO = ΔP/ΔI, where ΔP is a change
in total outputs and ΔI is a change in overall factors used.
Ding (2014) found a curvilinear relationship between the production efficiency
and a firm’s cumulative experience. A curvilinear relationship indicates that not all input
combinations could yield cost efficiency. Notwithstanding, some managers have
difficulty finding the optimal mix of resources for lowering production costs. Porter
(1980) indicated that the experience curve concept could allow estimating the optimal

46
mix of resources. Candelise, Winskel, and Gross (2013) found that production costs
decreased in systems in which the production doubled given the technology and quasi-
fixed inputs. The experience curve view was supported elsewhere by MacGillivray,
Jeffrey, Winskel, and Bryden (2014) and Shepherd (2015) regarding the roles of dynamic
learning and allocative efficiency.
Weak productivity growth is the cause of poor economic performance in many
companies (Crespi & Zuniga, 2012). Innovative firms have higher labor productivity
when compared with noncreative companies (Crespi & Zuniga, 2012). Developing
economic and technological capabilities may allow producers using resources efficiently,
providing an economic advantage (Crespi & Zuniga, 2012; Dosi et al., 2015). Allocative
efficiency is the responsibility of a company’s leadership (Haelermans & Ruggiero,
2013) and might be a determinant for reducing production costs.
Designing efficient systems for aluminum production. Production companies
endeavor to gain a competitive advantage by creating customized production strategies to
meet market requirements and profitability goals. In production companies, a manager
makes decisions about the production strategy while evaluating the economic cost of
his/her options. According to Cobb and Douglas (1928), these decisions are complicated
because they involve various steps. First, producers should consider the design of the
production process, given its technical capability and expected outputs. The second step
consists of evaluating the technical efficiency and adapting inputs to promote low-
production costs for the long-term (Herrmann & Kayasa, 2012). Finally, a production
system provides various criteria against which to measure performance. Such criteria
47
include production costs, flexibility, delivery, quality, efficiency, and innovativeness
(Herrmann & Kayasa, 2012; Miltenburg, 2005; Oke, 2013).
Critical infrastructural and structural components to a product strategy include
business vision and direction (Burian & Maffei, 2013) as well as capacity, facility,
product technology, and process technology strategies (Alborzi, Khalili, Nazemi, &
Salimian, 2013). Herrmann and Kayasa (2012) and Reinartz and Schmid (2015)
recognized the need for production function flexibility, innovativeness, and efficiency to
minimize production costs. Marsillac and Jungbae (2014) found that innovation and
flexibility constitute moderating factors for reducing production costs.
Ballot, Fakhfakh, Galia, and Salter (2014) identified the complementarity between
innovativeness and process flexibility and the impact of both on cost minimization. Ballot
et al. (2014) found that innovation and flexibility could alter the use of inputs through
process engineering and technological capability, thereby allowing production cost
minimization. For instance, process design can allow energy and material management
through new production modes of reducing, recycling, and reusing (RRR) energy and
materials; methods that might generate cost benefits in waste disposal. Reh (2013)
idealized the concept of RRR as a circular economy, a practice that can affect production
outputs as well as material inputs use.
Davenport (2013) defined process innovativeness as the ability to redesign a
process to maximize quality, reduce costs, and provide additional flexibility to a
production function. Stanko, Molina‐Castillo, and Harmancioglu (2015) found that
innovation reduces production costs. Singh, Oberoi, and Ahuja (2014) and Miltenburg

48
(2005) concluded that the development of operational flexibility provides a superior
capacity to act appropriately and economically while satisfying variable markets. In
aluminum production, Liu et al. (2014) and Shrouf, Ordieres-Meré, García-Sánchez, and
Ortega-Mier (2014) found that energy efficiency could be achieved by optimizing energy
consumption and through the strategic and flexible energy management options, an
approach that can allow reducing costs. Caniëls and Rietzschel (2015) advocated
innovation as a determinant of competitiveness in production systems, particularly in a
business environment facing prices uncertainty.
Technical efficiency and allocative efficiency for reducing production costs.
In production systems, technical competence derives from the extent to which a manager
can operate a production function with the maximum achievable outputs (Bartelsman et
al., 2013; Farrell, 1957). Technical efficiency is a concept that describes the ability of a
production manager to reduce the level of the input use while maximizing outputs at the
lowest possible cost. Technical efficiency is also termed “productive efficiency”
(Bartelsman et al., 2013; Farrell, 1957; Tovar & Wall, 2015), which occurs when the
production function could not produce any more of one output without using another
input or altering another output (Koopmans, 1951). A technically efficient company
operates its production function close to the limits of the capacity of the resource
(Bartelsman et al., 2013; Farrell, 1957). Restuccia and Rogerson (2013) found that
productive efficiency in a production system could be achieved by implementing best
technological capabilities, material management capabilities, and strengthening
manufacturing processes and allocative efficiencies.

49
The difference in companies’ technical efficiencies is delineated in three ways.
First, the technical ability for mitigating production costs may be different due to
different technological capabilities (Moll, 2014; Restuccia & Rogerson, 2013). According
to Restuccia and Rogerson (2013), both the slow adoption of technology and its
inefficient use will influence production costs. Second, shortcomings in technological
capabilities may derive from the misallocation of resources and the lack of financial
capital. Furthermore, Restuccia and Rogerson found that failure to adopt appropriate
technical capabilities could affect a company’s ability to innovate, which might have
implications on production costs. Finally, structural and infrastructural systems may have
strategic implications on the characteristics and cost of production.
The measurement of technical efficiency in a production system. Researchers
estimated the technical efficiency of a production unit through the data-envelopment-
analysis model. For instance, Farrell (1957) provided a model consisting of two
approaches for measuring technical efficiency: input and output. The former is relative to
the ability to reduce inputs while maintaining fixed outputs unchanged. Some strategies
to cut resources of production include reducing waste, recycling, applying lean
manufacturing principles, reducing no-quality costs (Polansky, 2014), and analyzing
value (Bastič, Ivanišević, Leber, & Mavrič, 2014).
The output approach is the opposite of the input approach; in the former, a
manager aims to maximize outputs while maintaining fixed production factors (Farrell,
1957). These approaches are not mutually exclusive. Factors affecting technical
efficiency are considered from several angles, such as economies of scale, input
50
utilization, the geographic location of a production unit (Yang et al., 2016), and the return
to scale (Aristovnik et al., 2013; 2014).
From the analysis outlined above, practical reasons exist for considering that
some aluminum production companies have been inefficient given the difference in
companies’ production cost structures, as discussed by the European Commission
(2014b) and Gutowski et al. (2013). According to the European Commission (2014b),
global production cost structures currently range from USD1300–1900 /ton Al.
Although scholars provided some guidelines for evaluating the production
efficiency, only a few studies have provided the methodological framework for
measuring and analyzing the technical efficiency (Farrell, 1957). Because of such
deficiencies, many production companies lack qualitative and quantitative knowledge
about their technical efficiency and production frontier. Notwithstanding, industries, such
as steel, have made progress in this area (Yang et al., 2016). The methods used in those
industries could be transferred to aluminum.
Farrell (1957) emphasized the lack of suitable data as the cause of the technical
efficiency research insufficiency. Park et al. (2015) and Yang et al. (2016) recommended
performing technical efficiency analyses using nonparametric techniques, such as data
envelopment analysis (DEA). DEA is an analytical research instrument used in
operational research for estimating and ranking the efficiency of various DMUs when the
production process contains many inputs and outputs (Olesen & Petersen, 2016; Park et
al., 2015). DEA analysis can provide reports such as the allocative and economic
efficiency of DMUs by identifying the optimal combination of resources used in a

51
production system (Amini et al., 2015; Aristovnik et al., 2013, 2014). DEA allows the
simultaneous consideration of multiple inputs and outputs and requires no a priori
presuppositions to interpret the production frontier (Varabyova & Schreyögg, 2013; Yang
et al., 2016).
By using the DEA method, a production manager aims to identify cost-benefit
opportunities (Sherman & Zhu, 2013). Given that DEA is established based on
production assumptions, these assumptions must hold true (Park et al., 2015) to avoid
under- or overestimating a company’s level of efficiency. For example, the timeframe
and parameters of the analysis in relating outputs to inputs must be defined accurately
(Amini et al., 2015; Atici & Podinovski, 2015; Chian, 2013). Amini et al. (2015)
suggested that the unit of measure for a given parameter must be similar. Park et al.
(2015) also suggested the use of ratios to enhance the interpretation quality.
Technological capability to decrease production costs. Technology is a
determinant of success in a production system (Miltenburg, 2005). Shepherd (2015)
defined production techniques as additional arrangements distinct from traditional factors
of production that enable a manager to adapt production systems and fulfill critical
production requirements. Miltenburg (2005) and Shepherd (2015) found that inadequate
selection of production technology might increase production costs. In addition, the
adequate selection of technological capabilities, which is part of a manager’s
responsibility, involves allocative efficiency (Moll, 2014; Restuccia & Rogerson, 2013).
Challenges in production systems. Producers need to explore all available
options and ascertain the adequate combination of inputs given the changing business

52
context. Farrell (1957) and Zelenyuk (2015) found that the optimal combination of
resources depends on aggregate resources that a manager applies to a production system.
Farrell further stated that the optimal combination of resources refers to the desired
technical efficiency that a company expects to attain given technical considerations and
the production frontier within an industry. For example, Farrell found that long-term cost
performance could be compromised if a decision was made to increase or diminish inputs
to increase revenues without considering relative frontiers and marginal production costs.
The law of diminishing marginal returns and loss of profitability. According
to Cobb and Douglas (1928), under certain conditions, a production function can reach
the point of diminishing returns, a state that has a direct implication on a firm’s
production cost structure. Diminishing marginal returns in a production system is a state
in which the production function yields high production costs and decreased profitability
(Ellington, Dierdorff, & Rubin, 2014). Diminishing returns in a production system may
lead to diseconomies of scale, which refers to business circumstances in which
economies of scale no longer provide the benefits expected in a production system
(Ellington et al., 2014; Ray, 2015).
Farrell (1957) and Ellington et al. (2014) explored issues of optimization in
modern companies. As companies face market pressure, annual budgets often become
restricted (Caniëls & Rietzschel, 2015). On the other hand, questions about the use of
resources and the need for cost optimization emerge. Some managers evaluate the
production cost efficiency by comparing with the industry benchmark or the production
frontier (Farrell, 1957). Farrell found the production frontier outlines the marginal rate of

53
factor substitution, the resource allocation, or the adoption of sourcing capabilities. The
Law of Diminishing Marginal Returns (LDMR) becomes relevant when a manager seeks
to maximize outputs by adding resources to fixed factors (Ellington et al., 2014). Yao and
Liu (1998) found that diminishing marginal returns manifest in both rising marginal and
production costs (see Figure 4).
Marginal production cost
Productivity
Inputs (production factors)
Figure 4. Diminishing marginal productivity, adapted from Yao, S., & Liu, Z. (1998). Determinants of grain production and technical efficiency in China. Journal of
Agricultural Economics, 49, 171-184. doi:10.1111/j.1477-9552.1998.tb01262.x.
For a given combination of inputs, depreciating efficiency and profitability
constrain most optimization processes (Ellington et al., 2014). Ellington et al. (2014)
found that when a production unit nears maximum, its profitability decreases because
production costs increase with the level of inputs used. An increase or decrease of one
factor may require a company to trade off the direct and indirect costs of other inputs.
Researchers use the LDMR to analyze the productivity of a production function when
inputs change (Bennett & Vedder, 2014; Ellington et al., 2014).

54
Price inclusion in efficiency analysis. Although prices are considered exogenous
factors in the production performance analysis, managers should always consider options
offered in the market to reduce overall production costs (Farrell, 1957). For example, in
an electro-intensive industry such as aluminum production, Bastian-Pinto et al. (2015)
and Shrouf et al. (2014) considered improving production costs by reducing non-
production models. Shrouf et al. found that constant changes in energy prices had become
a constituent of output costs, requiring companies to adjust their production models.
Efficient and inefficient firms differ. Bertelsmann et al. (2013) stated that the
differences between companies’ technical efficiencies stem from their business models,
internal distortions, and the ability to minimize input usage. Dissimilarities might also
reflect a firm’s ability to innovate and develop efficient resource allocation with minimal
trade-offs among options. Price input could improve by combining materials purchases to
gain economies of scale. Notwithstanding, a production manager should evaluate the
storage costs to select the adequate approach. Price efficiency differs from low-quality
options that can have long-term bottom-line consequences.
The effect of misallocation on production costs. Jones (2011) found that the
misallocation of core resources leads to revenue differences among companies. For
example, companies adopting breakthrough technologies in production systems may
develop a competitive edge more swiftly than their rivals (Jones, 2011). Restuccia and
Rogerson (2013) also showed that many companies lose money because they fail to
operate their production function at the optimum level of efficiency. Miltenburg (2005)

55
found that the extent to which production efficiency differs across firms might explain
the size of internal distortions and managerial decisions.
Quality strategy to minimize excessive use of production factors. Quality is
the extent to which products or processes conform to a customer’s specifications and
expectations (Cant et al., 2015; Polansky, 2014). Polansky (2014) found that the
capability of a process to yield quality products within specification helps mitigate the
product fall-out rate and the production costs inherent to poor quality. Silva, Abellán-
Nebot, Siller, and Guedea-Elizalde (2014) proposed an adaptive control optimization
system for minimizing production costs. Selective and adaptive production systems allow
achieving technically efficient production (Herrmann & Kayasa, 2012; Silva et al., 2014).
Waste increases production costs. The zero-defect strategy for mitigating the costs of
poor quality is recommended by Herrmann and Kayasa (2012) through adaptive
production systems.
Taheri, Moghaddam, and Arami (2015) found that when applying the Taguchi
quality-loss function, producers could evaluate the costs of poor quality and thus
undertake actions to reduce production costs. According to Taheri et al., implementing
such an analysis requires assessing four fundamental parameters: (a) the process variance,
(b) the quantity output, (c) the target a manager intends to achieve, and (d) the production
costs per unit. Polansky (2014) indicated that companies might decrease production costs
through quality and by specializing in a particular business process. The specialization
guarantees that processes and products delivered would meet customer specifications, no

56
matter how much inputs might change. When quality improves, production costs
decrease (Polansky, 2014).
Some drawbacks of productive efficiency. Theoretical considerations suggest
that productive efficiency operates in tandem with technical efficiency (Huang, Ho, &
Chiu, 2014). Productive efficiency refers to the production of outputs at the lowest point
on the average cost curve in a given industry (Huang et al., 2014). Farrell (1957) found
that profit-maximizing companies attempt to operate their production function at the
lowest possible point on the cost curve by minimizing investments through budgetary
restrictions.
Budgetary limitations often manifest in downsizing labor, outsourcing non-core
activities, and disinvesting (Gallegos, Giskes, Ramsey, & Turrell, 2012). Miltenburg
(2005) cautioned that budgetary constraints influence long-term decision-making and
lead to a trade-off among options. Gallegos et al. (2012) discussed that inappropriate
budgets are a risk for businesses. Limited investments in production systems may lead to
insufficient production initiatives (Miltenburg, 2005). Gallegos et al. (2012) found that
although disinvestments can produce financial benefits in the short-term, the adverse
consequences may be overwhelming if a manager fails to integrate market potential and
variations to long-term production strategies. Contrary to the view of budgetary
limitations expressed by Gallegos et al. (2012), Scopelliti, Cillo, Busacca, and Mazursky
(2014) found that constrained financial resources might be beneficial to ideation and
creativity because they may lead to cost reduction. In practice, tension and perplexity
57
often occur between the short-term savings of budgetary restriction and the potential
long-term gains realized from financing innovative projects (Caniëls & Rietzschel, 2015).
Budgetary limitations may produce mixed effects on production costs. Production
companies should use such practices sparingly. Budgetary restrictions can limit a
company’s ability to respond to the variety of strategic options that may contribute to
increased profitability. Productive efficiency necessitates allocative efficiency of inputs
to meet production cost requirements (Chiang, Li, Choi, & Man, 2012; Haelermans &
Ruggiero, 2013). Managerial capability influences productive efficiency (Chiang et al.,
2012; Fu et al., 2012). Finally, Novy-Marx (2013) found that firms with productive assets
return on average greater profits when compared with companies whose assets are
unproductive.
Raising Technical Capabilities
Theorists of the RBV emphasize that some resources within an organization
contribute to business performance (Ahmed, Kristal, & Pagell, 2014; Kortmann, Gelhard,
Zimmermann, & Pillier, 2014; Wiengarten, Humphreys, Cao, & McHugh, 2013).
According to the RBV, a company might increase its profitability if it undertakes actions
that create value. Ahmed et al. (2014) expanded the analysis of the RBV to the study of
production systems. Ahmed et al. mentioned that companies create competitive
advantage by finding adequate ways to manage and operate their production systems.
Ahmed et al. and Kortmann et al. (2014) found that the degree to which managers
generate strategic capabilities drives the development of production efficiency by
minimizing production costs. Capability refers to any source of high levels of

58
competitiveness or expertise or to those processes or practices that can serve as an
advantage for performing core activities efficiently (Ahmed et al., 2014).
In production systems, misalignment in or shortage of resources can produce
unbalanced performance and a trade-off among functions (Achtenhagen, Melin, & Naldi,
2013; Camuffo & Wilhelm, 2013). Resource complementarity is critical in production
systems for developing efficiency that can affect production costs (Porter, 1980). Porter
found that complementarity could allow developing a holistic approach, as opposed to
strengthening a single unit in isolation.
Miltenburg (2005) found that most businesses in a given production field compete
using similar production systems and manufacturing capabilities. Top-performing
companies nevertheless are those that identify the value from the marketplace and
leverage their manufacturing capabilities to fulfill such value (Alborzi et al., 2013; Allen,
Fontaine, Pope, & Garmestani, 2011). Camuffo and Wilhelm (2013) found that the lack
of investment in a production system affects production abilities if a manager allows
trade-offs in core capabilities. This view corroborates the discussion about budgetary
limitations and potential trade-offs between production options. Miltenburg (2005)
explained that the higher a company’s operational capability is, the higher its overall
production function capacity will be to reduce production costs. In sum, researchers
found that companies balance cost efficiency and profitability through the proper
arrangement of their production function.

59
Summary
In this literature review, I outlined emerging developments and paradigms in the
economy of production and related them to aluminum production. In a competitive
business environment, reducing production costs is required to sustain business
performance. Researchers found that production cost differences among production
companies result from internal distortions, technical inefficiencies (Farrell, 1957;
Koopmans, 1951), managerial decisions, and production strategies (Miltenburg, 2005).
Scholars recommend various strategies that influence production function
performance including upstream and downstream integration, product differentiation,
economies of scale (Miltenburg, 2005; Porter, 1980), and flexible production capabilities
(Ajmal et al., 2012). Blair and Kaserman (2014) found that variations in prices to acquire
resources affect a company’s production cost structure; however, the impact of price
variation is reduced when such resources are integrated. Five overall strategies are
identified to improve performance in aluminum production: (a) technology-based
strategies, (b) resources-based strategies, (c) energy-efficiency-based strategies, (d)
innovative-based strategies, and (e) operational-flexibility-based strategies.
These strategies are not actions that production managers can implement routinely
in day-to-day production practices. Fundamental barriers to production cost minimization
exist, given the technical challenges involved and the characteristics of the aluminum
electrolytic process. Reducing production costs requires that a company be technically
efficient—a state of production that necessitates efficient allocation of resources at
distinct levels of production (Baik et al., 2013; Jones, 2011; Miltenburg, 2005) and a full

60
exploitation of economies of scale in a production system (Porter, 1980; Ray, 2015).
Scholars agreed that differences in firms’ production cost efficiency emerge from
resources usage (Farrell, 1957), misallocation of core resources at distinct functional
levels, and insufficiencies in the adoption of technology (Baik et al., 2013; Jones, 2011).
Selecting appropriate technical functions and procedures for a production system is
essential for minimizing production costs and input utilization (Herrmann & Kayasa,
2012).
Yang et al. (2016) recommended analyzing technical efficiency using
nonparametric techniques, such as DEA. DEA is an analytical research instrument used
in operational research to estimate the effectiveness of various DMUs when the
production process exhibits an arrangement of many inputs and outputs (Farrell, 1957;
Park et al., 2015). DEA can allow evaluation of capacity utilization, the minimum long-
run average costs, and the expected level of outputs (Ray, 2015); furthermore, it can
compare the performance of different companies within an industry.
A firms’ technical ability has implications for production costs. Efficient resource
allocation tends to minimize production costs (Miltenburg, 2005). Inefficient resource
allocation often leads to lower levels of production outputs, resulting in lower
productivity (Jones, 2011; Miltenburg, 2005; Shepherd, 2015). Camuffo and Wilhelm
(2013) found that misalignment in or shortage of resources can produce unbalanced
performance and a trade-off among functions in a production system. Resource
complementarity is critical in production systems for developing production efficiency
(Porter, 1985).

61
Transition
In Section 1, I provided the background to this qualitative comparative case study.
The purpose of the research was to identify the strategies some aluminum production
managers might implement to reduce production costs. I also outlined the conceptual
framework and provided insights about the lens through which I viewed the connection
between the economic theory of production and primary-aluminum-production strategies.
According to this literature review, strategies for reducing production costs are upstream
and downstream activity exploration; innovative production processes; and productive,
technical, and allocative efficiency. Innovation can contribute to the economy of
production by reducing costs. Creative leadership, change-oriented practices, external
monitoring, and workforce expertise are moderators of success (Latham, 2013) for
improving the production performance.
In the next section, I restated the purpose statement and outlined the role of the
researcher in the data collection process. I also discussed procedures for contacting
participants and gaining their consent with the aim of building a working connection with
the senior managers. Additionally, I identified measures to consider for guaranteeing the
ethical inclusion and protection of human subjects. In the remainder of the section, I
addressed the research method and design and provided a rationale for the data collection
procedure used throughout the collection process. Other components discussed included
the description of the population and the sampling strategy, data collection instruments,
and the data analysis technique recommended for this qualitative multiple comparative
case study. Because the participants and I might have induced bias in the data collection

62
and data interpretation processes, I outlined strategies for addressing potential threats to
reliability and validity.
In Section 3, I covered the results of the study with a thorough summary and
interpretation of the findings and evidence. I also illustrated the results by demonstrating
the evidence and linking the results to the conceptual framework because they all relate to
the RQ under study. Additionally, I provided a framework for the discussion, researcher
reflections, recommendations, and implications for business and social change.

63
Section 2: The Project
The purpose of this qualitative, comparative case study was to identify the
strategies some aluminum producers might use to reduce production costs. Mainstream
economic theoriests of production agree that most decisions in production management
are concerned with profit maximization by minimizing the inputs used to produce a given
amount of outputs. Reducing production costs requires that a company be technically
efficient—a state of production that necessitates both the efficient use of inputs (Farrell,
1957) and the allocative efficiency of resources at distinct levels of production (Baik et
al., 2013). Firms’ technical abilities have implications on production costs. Selecting
appropriate technical functions and procedures for a production system is essential for
cost minimization and resource consumption.
The preparation for data collection in developing a case study is challenging
because data gathering and analysis require the use of appropriate procedures for
producing ethical research. Should a researcher fail to address threats to reliability and
validity, the entire case study may be jeopardized (Yin, 2012). To develop this case
study, I ensured that the human participants engaged in the research were protected. After
guaranteeing that this research was ethical, I sought approval from the institutional
review board (IRB). Second, informed consent was administered from all research
participants, and I developed a case study protocol that provided a model for conducting
ethical research.
Additional policies I included in the data collection subsection comprised the data
collection plan, strategies for producing information saturation, the selection criteria for

64
both the participants and the sites under study, and the ethical research strategy I used to
protect human subjects. Finally, I provided the procedure for gathering and analyzing
data and for detailing the quality research criteria employed in this study. These quality
measures constituted the basis for guaranteeing the reliability and validity of the findings
as well as the researcher’s steps to preserve a high level of integrity.
Purpose Statement
The purpose of this qualitative, multiple comparative case study was to explore
the strategies that some aluminum producers might implement to reduce production costs.
The targeted population included aluminum production senior managers in Western
Europe. I studied a purposeful sample of four companies for comparing the production
strategies: two companies that were achieving sustained production costs and two that
were not. I interviewed experienced senior production managers and used documentary
analysis to identify core themes and concepts that producers may develop into strategies
for reducing production costs.
This research has implications for positive change because the findings may help
companies increase their business sustainability and job security, both domestically and
internationally, as well as helping other industries that rely on aluminum within the
supply chain. Companies may also use the findings of the study to optimize their use of
resources and contribute to protecting the environment. According to the European
Commission (2013), aluminum production is essential to maintaining a continuous
supply of semifinished products to small- and medium-sized enterprises downstream.

65
Aluminum companies that continue to yield high production costs and lower profitability
may put the job security of the local community at risk.
Role of the Researcher
My relationship with the subject of aluminum production strategies for reducing
production costs derived from the experience I have in the aluminum field, an experience
that has been at midstream for more than 2 decades. I understand that my knowledge and
my epistemological insights can help shed light on the selection of the theoretical
frameworks and methods that could lead to ethical research as well as to potential
implications for the aluminum production business. Hook (2015) stated that
epistemology, as a core ingredient of qualitative research, is at the forefront of the
theoretical direction of research. An adequate connection between my epistemological
insights, the conceptual orientation of this analysis, and the RQ was critical in this
research because this case study was applied research in a sector that was facing
contemporary industrial issues.
It was essential to write the correct RQ, select the appropriate theoretical
frameworks, and adopt an adequate approach to data gathering and analysis. The
epistemological wisdom for which I advocated could produce outcomes that were
trustworthy, reliable, and ethical, given their theoretical foundation. I ensured credibility
and validity in this case study so that the findings could result in conceptual and literal
replication. My goal in conducting this study was to seek to close the existing industrial
gap between the present state in which aluminum production companies are facing high
production costs, and the desired future business managers expect.

66
I aimed to maintain ethical research by ensuring that the four commonly used
qualitative criteria for rigor—trustworthiness (Perkins, Burton, Dray, & Elcock, 2013),
credibility (Guba & Lincoln, 1994), transferability (Houghton, Casey, Shaw, & Murphy,
2013), and confirmability (Noble & Smith, 2015) —were met throughout the research
process. The paradigmatic view I selected for gathering and analyzing data was
constructivism, and the type of data analysis and reporting was interpretivism.
Interpretivism and constructivism are two intertwined epistemological stances (Gorski,
2013) that acknowledge reality as contextually based and by which researchers seek to
understand phenomena by constructing meaning through interactionism and
interpretation (Huberman & Miles, 1994; Merriam, 2014; Onwuegbuzie & Byers, 2014).
During my professional life, I have experienced several commodity price cycles
in the production of primary aluminum, moving within explicit price upturns and
downturns (USGS, 2014). During these cyclical movements of aluminum commodity
prices, many companies have experienced profitability losses that led to smelter closing
or curtailments (Götz, 2014) as producers struggled to manage plunging prices. This
doctoral study stemmed from my frustration in searching for how some aluminum
managers might have failed to implement strategies to reduce production costs.
Therefore, I sought to explore strategic practices that might allow production expenses to
reduce in the production of primary aluminum.
I promoted an anticipatory method in this study, preferably to reactive responses
(Palmer, Fam, Smith, & Kilham, 2014) to manage potential ethical difficulties that may
arise. This approach was to read recently published peer-reviewed case studies to learn

67
from the experience of others. Learning from experience is fundamental to adaptation
(KC, Staats, & Gino, 2013). Prior successes and failures can help people overcome their
weaknesses (KC et al., 2013) and might provide a wealth of information.
Data Collection Program
Most scientific research involving human subjects have risks, particularly when a
researcher gathers information from companies and human subjects. The Council on
Population, Social Sciences, and National Research (2014) identified informational,
physical and psychological, and data protection among the many risks facing human
subjects in scientific research. Building on this premise, I took appropriate steps to
address the risks thereof.
Stake (1995) recommended a useful preparation method that requires writing a
protocol and developing a plan of action before data collection. The premise in
conducting ethical research was to raise my awareness and sensitivity about ethical issues
that might arise. I went through a training about protecting human subjects, as well as
reacting to unexpected situations and acting in a sound ethical manner.
CAQDAS capability provided a systematic approach to locating evidence and
counter-evidence within the text that was analyzed (Gläser & Laudel, 2013). I used
Atlas.ti software, which provided an efficient methodology of coding and linking
information (Cornish et al., 2013; Tummons, 2014) as well as extracting and analyzing
data from within and across cases.

68
Challenges in Data Collection
The main difficulties I encountered included the reluctance of the companies
selected to sign the letter of cooperation, creating a productive relationship with
participants, obtaining the quality of participants who fulfilled the qualitative criteria I
selected in the research and complying with the interview planning given the diverse
geographic locations of the participants. Rimando et al. (2015) also reported these
numerous data collection challenges in qualitative studies. The most commonly reported
problems were addressing the participants’ reluctance to participate, selecting the suitable
environment for the interview, a lack of experience in conducting interviews, and
obtaining informed consent.
This research was planned to follow ethical criteria from inception; I only
proceeded after I received approval from the IRB. I took appropriate steps to select
neutral locations for interviewing participants. Ashton (2014), Namageyo-Funa et al.
(2014), and Rimando et al. (2015) stated that the lack of neutrality in a place of a meeting
could influence the quality of details provided by a human subject. For example,
participants may provide biased responses to the interview questions if the location is not
neutral (Namageyo-Funa et al., 2014).
A researcher needs to protect the identity of the participants throughout the study
(Council on Population, Social Sciences, and National Research, 2014). The interview
protocol (see Appendix A) included the interview questions, the procedural nature of
interviewing, and the policies about maintaining the independence of the participants in
developing their thoughts (Van Wijk, 2014). Hannes and Parylo (2014) and Hall,

69
Prichard, Voogt, and Zuccato (2014) emphasized that a researcher must use a form to
obtain participant consent. Through this approach, I described the steps I used to assure
confidentiality.
Although Graham, Powell, and Taylor (2014) recommended that participants
must be guaranteed fair compensation, no ascertainable financial earnings were expected
in this study; therefore, no compensation was offered for participation. Furthermore, in
conformity with the suggestions proffered by Chan, Fung, and Chien (2013) about
eliminating personal judgment, I mitigated my potentially preconceived notions to temper
deleterious effects that might have influenced the analysis quality. Cruz (2015) argued
that failure to overcome personal belief in scientific research might foreground the
researcher’s subjectivity and undermine decisions made in a study.
Gaining Access to Participants
The sample population was senior managers in aluminum production from
Western Europe. I included four aluminum producers: two companies that are achieving
sustainable production costs and two that are not. Cleary, Horsfall, and Hayter (2014) and
the OHRP (2005) recommended selecting participants who meet ethical criteria of the
research. I selected senior managers who complied with the criteria for producing ethical
research. The Office for Human Research Protections (OHRP, 2005) stated that
participants must possess both the adequate age and the legal capacity to negotiate
consent as well as an appropriate understanding of the impact of engaging in the research.

70
Participant Selection
The U.S. Department of Health (2014) stressed that vulnerable populations who
may be coerced should not participate in research. Cleary et al. (2014) emphasized that
inappropriate participant selection could lead to decreased precision in explanations.
Cleary et al. commended the selection of participants according to their capacity to
inform the RQ and to illuminate the researcher’s understanding of the topic under study.
These authors acknowledged the richness and depth of analysis that experienced
participants might provide.
Before the data collection, I fulfilled the IRB’s requirements for conducting
ethical research and protecting human subjects. To enhance my knowledge on conducting
ethical research and to demonstrate my intent to comply with the IRB’s requirements, I
passed Human Research Protections training at the National Institutes of Health. I
obtained a completion certificate, which I presented to the IRB along with all the drafted
letters of confidentiality. These documents included the initial letter of contact addressed
to participants, the consent form, and the privacy agreement sent to the transcription
services that had access to the raw data. I described reasonable and foreseeable risks or
discomfort that the participants and sites might face. One of the eligibility criteria I
selected was that participants should be senior managers who had 10 years of experience
in the production of primary aluminum. I assumed that this population category had the
psychological, intellectual, and physical ability to understand, accept, or reject
arguments. I planned to provide additional protection to vulnerable populations that I
might have included unintentionally.

71
Apart from the doctoral graduation, there was no foreseeable benefit from the
researcher’s perspective; therefore, I disclosed in the consent form that no anticipated
benefits to subjects were planned. I had no conflicts of interest about the subject under
study or the participants; also, I included a statement that participation was voluntary so
discontinuing participation involved no penalty. I began recruiting participants (e.g.,
contacting senior managers, obtaining signed consent forms) only after the IRB approval.
Participants exhibited high responsiveness to the initial e-mails.
Because I encountered difficulties obtaining cooperation letters from companies, I
submitted a request for a change in procedures form to the IRB to drop site observations
because the companies I selected were stringent in confidentiality issues. Yin (2012)
advised that a researcher must stay adaptive if unanticipated events occur, and the
researcher should make minor changes when required. The IRB treated the request as an
expedited review because the proposed changes did not increase the level of minimal
risks identified in the initial application.
Data collection and analysis occurred concurrently. The data sources used in this
doctoral research included semistructured interviews, comprised of open-ended
questions, and documentary review. For the interviews, the first step was to select
participants based on the purposive eligibility criteria I had decided. For example, the
subject should be knowledgeable about aluminum production and operational practices
and should have a minimum of 10 years of experience in the field. These criteria were
challenging to meet given the number of participants required to attain data saturation.

72
More specifically, I read no less than 100 senior manager profiles in the network from
which I recruited the participants.
The purposeful sampling is justifiable in a study to yield substantial information
quality (Palinkas et al., 2015) in answering the RQ under study. After I had identified
eligible participants, I sent the initial letter of contact, which the IRB had approved. The
acceptance rate was approximately 85%. Upon acceptance, I planned the interviews in
agreement with the participants based on their availability.
Initially, it was arduous to establish the relationship with some senior managers as
a novice researcher for several reasons. For instance, some senior managers lacked the
motivation to provide data to a transient person. Potential cultural differences could
justify this reluctance. Nevertheless, the cultural susceptibilities needed cultural
competencies (e.g., developing awareness, knowledge, skills, and adaptability to each
personality) to overcoming reluctance within the same interview. Hoskins and White
(2013) recognized that new researchers might face challenges convincing potential
participants and putting them in a comfortable situation to converse openly. Bonevski et
al. (2014) argued that participants often have a concern about disclosing details to a
researcher. Nevertheless, the method of interviewing was managed as a collaborative
process in which I aimed to use the knowledge and positionality of the participant to
maintain the conversation active and exhaustive. Although I had the impression of facing
challenges connecting with some of the participants, the competencies I used to convince
one person did not necessarily succeed with another one; a quick adaptability to
personality was a decisive factor.

73
Addressing Issues of Risks and Discomfort
The first step in addressing potential risk and discomfort was to inform each
participant that there was no foreseeable risk or discomfort involved in this research. The
IRB approved this study (see approval # 01-06-17-0395650); as such, I took the
necessary steps for producing ethical research by guaranteeing trust and confidentiality. I
also informed the participants that I would protect their identifying details, if any, and
those of their company through anonymization of raw data.
The second step was to convince the participants to allow audio taping of the
interview. The argument I used to convince participants was that I needed to avoid losing
valuable information because each interview was vital in this process to capturing
contextual and intervening conditions to reduce production cost. Most senior managers
accepted the audio taping method. The relationship with the senior manager became more
open and trustful when I clarified these details and presented the purpose of the study as
well as how I would address issues of confidentiality. I appreciated the senior managers
for their experience in the aluminum production field. In using this approach, I assumed
that every individual might be grateful to receive a positive testimony, which
demonstrates sensitivity and respect as an evidence of a distinguished accomplishment. I
also discussed how I based the participant selection on their intensive experience in the
production area; therefore, I expected them to add significant value to the research
findings.
I was committed to protecting the identities of the human subjects. All written
information gathered from the interviews has been secured and will remain for at least
74
five years in a personal combination safe. Mitchell and Wellings (2013) recommended
that the researcher should be the only person to access participant details. I secured the
digital and electronic data by assigning specific codes to the companies' names (e.g.,
Company A, B, C, or D), aliases to participants' names (e.g., Participant #1A, #2A), and
by a personal password-protected computer flash drive.
Benefits, Voluntary Participation, and Informed Consent
Ethical issues may emerge when there is lack of trust and reciprocity regarding
benefits between the researcher and participants (Graham et al., 2014). Graham et al.
maintained that all members must profit from the research. Furthermore, Graham et al.
recommended ethical principles of fairness and respect among research members.
I discussed with each participant that apart from the doctoral graduation, I do not
expect financial benefits from this research; therefore, I will provide no compensation for
their participation. Conversely, there will be no costs incurred due to their engagement in
the study. Any refusal to answer questions will involve no objection of mine. I provided
the Walden University telephone number in case participants would like to talk privately
about their rights or have a further referral.
The process of obtaining informed consent. Participants who agree to engage in
the study must sign a consent form before interviews begin (Brown et al., 2012; Hannes
& Parylo, 2014). Gaining informed consent can be difficult should a researcher fail to
explain the purpose and content of the research to the participants (Wirshing, Wirshing,
Marder, Liberman, & Mintz, 2014). I informed the subjects about (a) the purpose of the
study, (b) their freedom to abandon the study, (c) the respect of their confidentiality, (d)

75
the length of time required for the interviews, and (e) the implied impact of the study. I
treated each participant decently. Wirshing et al. (2014) proposed conducting the process
of obtaining informed consent in steps. Before the interview, I provided by e-mail
information about the purpose of the study, its significance, and implied risks to
participants. I also took steps to choose a neutral location for the conversation in such a
way to guarantee the participants' confidentiality. The location and its environment were
planned to remain neutral because they can affect the quality of communication (Ashton,
2014; Namageyo-Funa et al., 2014; Rimando et al., 2015). At the beginning of the
interviews, every participant had to acknowledge that he or she understood all of the
potential risks involved.
Research Method and Design
Researchers use three types of research methods including quantitative,
qualitative, and mixed methods (Earley, 2014). This study was exploratory given the
contextual factors and the multiple variables that influenced production. A qualitative
methodology allowed identifying intervening and causal conditions that affected the
production cost. The use of the qualitative method was critical because of the complex
processes involved (Hoon, 2013) and the dynamic forces that affected production costs in
aluminum production (World Bank, 2013). Given these dynamic forces and complex
processes, I discovered diverse views in response to the RQ. I used the data saturation
principle to determine the adequate sample size.

76
Research Method
Qualitative researchers focus on the way a researcher and the participant interact
to understand the research problem (Holloway & Wheeler, 2013) in an economic, social,
and cultural context (Hazzan & Nutov, 2014). Merriam (2014) discussed that qualitative
studies also contribute to evidence-based practices, and through this contribution,
business people, among others, can make sense of their experiences. Qualitative studies
constitute an opportunity for scholars to interact, explore, understand, and interpret
research problems as lived by individuals in their business settings (Gioia, Corley, &
Hamilton, 2013; Holloway & Wheeler, 2013). Holloway and Wheeler (2013) explained
that the qualitative method is comprehensive and flexible for exploring information at a
granular level. Denzen (2012) concurred that qualitative researchers could draw on
distinct sources of information to triangulate data and to increase the credibility of the
findings.
Given this understanding, several benefits motivated the choice of the qualitative
method. First, based on its flexibility as discussed by Ritchie et al. (2013) and Yilmaz
(2013), the qualitative method was used to understand and answer this complex industrial
question by considering many views and epistemologies to address the problem of
production costs facing some companies. Second, I had the opportunity to interact with
experienced senior managers in the production of primary aluminum to gather relevant
data locally. Third, interactionist-based research emphasizes the value of investigating
events in their natural settings (Merriam, 2014), a method that has permitted aluminum
77
managers and the researcher to explore many views of the strategies that might reduce
costs.
Fourth, contrary to quantitative data collection methods, qualitative data gathering
is not restrained to a formal set of a questionnaire (Yilmaz, 2013). For instance, to shed
light on ambiguous and inconclusive answers of participants, I was able to reorient
questions in real time to capture granular details as the study unfolded. One concrete
example of the flexibility of the qualitative method was that I did not plan to use the
quantitative information; however, the flexibility of the method allowed collecting some
quantitative data on production costs and energy efficiencies. These quantitative data
permitted comparisons between companies’ performances. Klein and Myers (1999)
advocated interpretivism, which allows disambiguating complexity by delving into an
investigation with different prospects. Interpretive research is based on the hermeneutics’
underlying principles, which intimate that a researcher may learn to understand a
complex phenomenon by analyzing the meanings of its constituents and their
interdependence (Klein & Myers, 1999). Because multiple interconnected subunits and
processes were involved, disambiguating in this study increased the sensitivity to unique
details and differences in the companies’ business practices.
Alternative methods to qualitative research include quantitative and mixed
methods. The quantitative method neither offers the flexibility to interact with people
(Frels & Onwuegbuzie, 2013) nor allows reviewing documents to bring to light the
answers to this RQ. Quantitative and qualitative studies on the aluminum production
process are scarce (Blomberg & Söderholm, 2011; Boulamanti & Moya, 2016). Mollick

78
(2014) characterized exploratory studies as the studies conducted on problems exhibiting
a limited knowledge foundation of causes and effects. Quantitative analysis, applied in an
exploratory study, could be limited because the researchers could evaluate only the
relationships between or among variables, quantify the magnitude of the issue, or test a
theory (Yilmaz, 2013). As Frels and Onwuegbuzie (2013) and by Yilmaz (2013) stated,
the quantitative method is appropriate for correlational analysis, to test hypotheses and
theories, and to perform numerical modeling. My audience expected the answers to why
and how questions. A quantitative method could not provide these characteristics.
The use of mixed-methods research was inadequate given the likelihood of the
conflicting paradigms that might arise (Venkatesh et al., 2013). For example, the
purposeful sample of companies exhibiting high production costs and those that were not,
was essential to gather relevant data for comparing different strategies used in aluminum
production. Mixed-methods research is a combination of quantitative and qualitative
analyses in either a concurrent or a sequential scheme (Venkatesh et al., 2013). The
Mixed-methods could allow developing insights into complex phenomena that a
researcher might not be able to explain using a single method (Venkatesh et al., 2013). In
this case, mixed-methods research could have been challenging for many different
reasons.
First, given the potential conflicting paradigms between qualitative and
quantitative methods (Birchall et al., 2016), the use of mixed methods could have led to a
contradiction, a situation that might reduce the consistency and the rigor of the
procedures used to collect data. For example, senior production managers were sampled
79
purposefully, as were companies exhibiting high production costs and those that were
not. The purposeful sample enhanced information depth and increased the comparability
power of different strategies used in low- and high-cost production companies. The use of
mixed methods in this qualitative, multiple comparative case study involving a
purposeful sampling logic was inadequate. Second, from a practical point of view,
Venkatesh et al. (2013) affirmed that the time and costs involved in data collection could
be significant when using mixed-methods research. As a result, fewer practical benefits
were forthcoming from mixed-methods research.
Research Design
Yin (2012) suggested that a researcher should choose the case study design when
(a) the central RQ driving the study is exploratory, (b) the inquirer has limited power over
behavioral issues, (c) the focal point of the research is a contemporary problem, and (d)
the problem explored is complex. Aluminum production costs depended on numerous
constituents including external factors, intervening conditions, technological capabilities,
environmental and material consumption intensity. Few studies only referred to
production cost minimization in the primary aluminum production. Given that complex
and interrelated-cost components have not been studied explicitly to establish cause-
effect relationships, this research exhibits the exploratory characteristics. Stake (1995)
argued that case studies may be suitable for contextual analyses that are established based
on the observational conversion of implicit knowledge into explicit knowledge. Case
study design was used to understand and answer this complex industrial question by
considering many views and epistemologies to address the problem of high production

80
costs. Pearson et al. (2015), Hoon (2013), and Hyett et al. (2014) considered that one
crucial characteristic in a case study is the application of multiple data collection
strategies to permit in-depth inquiry of a complex phenomenon. The case study attributes
highlighted previously; and the evidence that high production cost in the aluminum
production field was a contemporary industrial problem (Behmiri & Manera, 2015),
made the case study an ideal design for investigation in this research.
Alternative designs to case study include grounded theory, ethnography, narrative,
and phenomenology. Grounded theory is a systematic approach used to develop a new
theory arising from data gathering (Compton & Barrett, 2016). This study is applied
research; as such, theory-building was not the purpose of the investigation. A researcher
uses the phenomenological design to yield some understanding of a social phenomenon
based on a participant's lived experience (Blom et al., 2013; Olausson et al., 2013; Sáenz
et al., 2013). Investigating aluminum strategies to reduce production costs is neither a
social phenomenon nor a meaning-making analysis; instead, it is applied research of an
acute industrial problem. Thus, the phenomenological design was inadequate in this
research.
Higginbottom et al. (2013) defined ethnographic design as the social science
research of communities, cultures, and social interactions. The ethnographic design is
focused on a community and the cultural patterns that are widespread within the
community (Higginbottom et al., 2013). This investigation went beyond cultural aspects
and the analysis of social interactions. The ethnographic design could not provide a
81
decisive advantage in this study because the purpose was to identify strategies used by
some senior managers to reduce production costs, not to investigate social issues.
Baškarada (2014) and Potter (2013) characterized narrative design as being the
structural method for analysis that is appropriate for learning about social phenomena.
The narrative design is a form of qualitative analysis associated with the theory of
representation. It can be used as a research design to explore social cognition (Lucic et
al., 2015), to portray a group of people, and learn how people organize and derive
meaning from events (Robert & Shenhav, 2014). Thus, the qualitative narrative design
focuses on the structure of human knowledge (Robert & Shenhav, 2014) rather than
gathering and processing data for discovering solutions to address complex industrial
problems, such as high aluminum production costs. Thus, the narrative design was
inappropriate for use in this research.
Benefits of using a comparative case study design. The case study can take the
form of a single or comparative design (Yin, 2012), depending on the intent of the
researcher. I selected the comparative case study design to produce data richness by
comparing the practices of two sets of aluminum companies, paired because they use
similar production processes with distinct production cost structures. A comparative case
study design can provide insights into both the historical perspective and the
contemporary view of the RQ (Yin, 2012) by looking at the problem from all angles in
different contexts. The comparative case study design provided both literal and
theoretical replications when addressing different aspects of the production cost study.
The single case study design could not provide sufficient knowledge of the business

82
problem under study because of the singularity of each case study and the uniqueness of
each context (Merriam, 2014).
Data and thematic saturation. Denzen (2012), O’Reilly and Parker (2012), and
Glaser and Strauss (1967) interpreted the concept of data saturation as being the point in
the data-gathering process when the researcher finds no new theme to develop different
aspects of the RQ. No commonly recognized formula exists for determining the point of
data saturation. Researchers have proposed some fundamental rules regarding the
argumentation driving to the data saturation point, nevertheless. For instance, Guest,
Bunce, and Johnson (2006) conducted semistructured interviews about socially desirable
behavior and the accuracy of self-reported sexual behavior. Guest et al. identified 97% of
the key codes after just 12 of their 61 interviews. Tribedy and Venugopalan (2012)
provided a statistical analysis of the number of interviews and Google Scholar annual
citations for single case studies. Tribedy and Venugopalan found that of the top Google
performers, the highest average impacts ranged from 15–30 interviews. Further, Tribedy
and Venugopalan showed that the Cronbach’s alpha rating for thematic prevalence was
higher than .75 in the 13-to-18 interview range. In an extensive analysis of the literature
regarding case studies, I found that a range of 8–20 interviews could yield a high
Cronbach’s alpha. This information was essential in planning the data collection program
and cost.
I conducted in-depth semistructured interviews, documents review, and member
checking to generate data saturation. The data collection and analysis were conducted
concurrently. After each interview or document collection, the material was transcribed

83
verbatim and uploaded to Atlas.ti for coding. The Atlas.ti query tool allowed exporting
the codes as well as the thematic frequencies to a spreadsheet. I outlined the number of
new codes and themes using the graphics method.
When all documents were coded, I assigned a similar prefix to the codes that were
similar semantically in meaning. Data grouping was an essential step to understand the
differences between various code-families. Besides, I achieved connectivity between the
families through using the Atlas.ti functionalities. For example, recycling material was
associated with the circular economy. The category, in this case, was the best fitting
concept from all codes in a given data set of a single case study. Primary categories were
those introduced by the greatest number of participants (high groundedness), secondary
themes were discussed by the next most significant number of individuals, and the
leftover themes were introduced by the least number of participants and documents.
Categories are the codes exhibiting similar meaning. Axial coding allowed reassembling
subcategories into essential concepts. From a hermeneutic standpoint, the aim of
conceptualizing data was to construct a reality from the interpretation of the text provided
by participants and the documents review. The RQ and the conceptual framework guided
the categorization scheme.
I sought saturation at two levels including interviews (data saturation) and
member checking (thematic saturation). These two approaches to data and thematic
saturation were used concurrently to maximize benefits from the synergy. In the first
level, I continued interviewing participants until there was a point where the information
from many participants started repeating and providing no new insights. Notwithstanding,

84
I assumed that participants might provide only surface level information in the interview
stage and, adding the researcher self-reporting bias (Stake,1995), I endeavored to solicit
member checking. In the second level, thematic saturation was sought from member
checking. I reviewed, interpreted the data, and synthesized the findings, which were sent
to participants via e-mails to corroborate and to add or remove information. I continued
this repeated and cross-verification process until there were no new themes to answer the
RQ and subquestion. Before the point of data saturation, most data (94.5% of the codes)
were similar repeatedly; this persistent similarity and negligible variability between
interviews provided reasonable confidence that the codes identified were saturated and
the description that the participants provided regarding the strategies to reduce production
costs were thick. Similarly, I stopped the member-checking process as I noticed that no
new intervening concepts or causal conditions emerged to answer the RQ and the
subquestion.
Given the multiple case study design, I sought data and thematic saturation for
each case, rather than the holistic saturation. I assumed that the holistic saturation of the
multiple cases could be achieved based on individual saturations. This characteristic was
of paramount importance from a qualitative interpretation perspective because I assumed
that each case study could exhibit a different business context, operational capabilities,
and intervening and causal conditions of the aluminum production strategy. The literature
review, the RQ, and the conceptual framework permitted the interconnection between
elements of the data analysis.

85
As the data analysis unfolded, I identified consensus of viewpoints on aluminum
production strategies to reduce cost among most participants interviewed and documents
reviewed. The consensus of views was measured based on the similarity and frequency of
codes from the two datasets. For instance, I considered the convergence of two similar
themes from different datasets when the aggregate frequency of codes composing each
theme was higher than 50%. This criterion was based on the homogeneity and quality of
participants I had selected in premises. By these rules, the alignment provided some
confidence that the minimal discrepancy of views observed in the data might not obscure
the saturation point.
Table 3 encapsulates the original codes isolated at a particular stage in the data-
gathering process to produce the saturation. I identified 94.5% of the primary themes
after six conducted semistructured interviews in each case. At this stage, I gathered an
aggregate of 24 interviews and 16 reports. I decided to carry out additional interviews
and member checking. The eight subsequent-conducted interviews yielded less than 5.5%
new codes, and 94.5% repeated answers. I achieved data saturation after 32 interviews
(eight in each case).

86
Table 3
Total Number of Interviews Conducted to Attain Data Saturation
Number of semi-
structured interviews Number of documents collected
Percentage of new codes identified
Subsequent interviews
Company A 6 4 97.2 2 Company B 6 4 95.7 2
Company C 6 4 92.9 2
Company D 6 4 94.1 2
Population and Sampling
The population for this case study consisted of senior production managers of
aluminum production companies in Western Europe. These companies all use similar
production processes, the production of primary aluminum through the Hall-Héroult
electrolytic process by electrolyzing the raw material (aluminum oxide) into semi-
finished products (European Commission, 2014b). Semistructured, open-ended
interviews provided rich information in addition to document review.
Sampling Site Participants
I used a purposeful sample of two companies employing production processes
that achieved sustained production costs and two companies that did not, to investigate
the strategies some aluminum producers might implement to reduce production costs.
This sampling procedure followed a nonprobability sampling logic because the objective
was not to generalize findings in a statistical sense. The purposeful sampling was suitable
for this case study to yield information-rich cases as suggested by (Palinkas et al., 2015).
The quality of sampling allowed identifying contextual, intervening, and causal
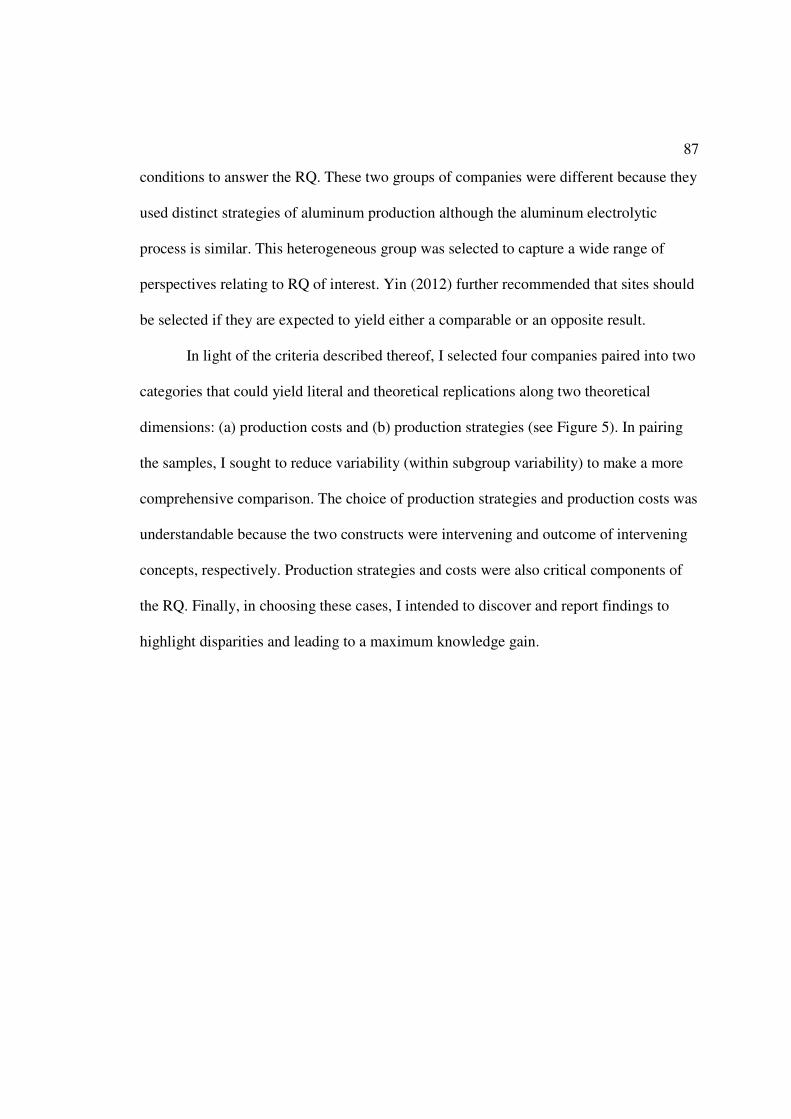
87
conditions to answer the RQ. These two groups of companies were different because they
used distinct strategies of aluminum production although the aluminum electrolytic
process is similar. This heterogeneous group was selected to capture a wide range of
perspectives relating to RQ of interest. Yin (2012) further recommended that sites should
be selected if they are expected to yield either a comparable or an opposite result.
In light of the criteria described thereof, I selected four companies paired into two
categories that could yield literal and theoretical replications along two theoretical
dimensions: (a) production costs and (b) production strategies (see Figure 5). In pairing
the samples, I sought to reduce variability (within subgroup variability) to make a more
comprehensive comparison. The choice of production strategies and production costs was
understandable because the two constructs were intervening and outcome of intervening
concepts, respectively. Production strategies and costs were also critical components of
the RQ. Finally, in choosing these cases, I intended to discover and report findings to
highlight disparities and leading to a maximum knowledge gain.
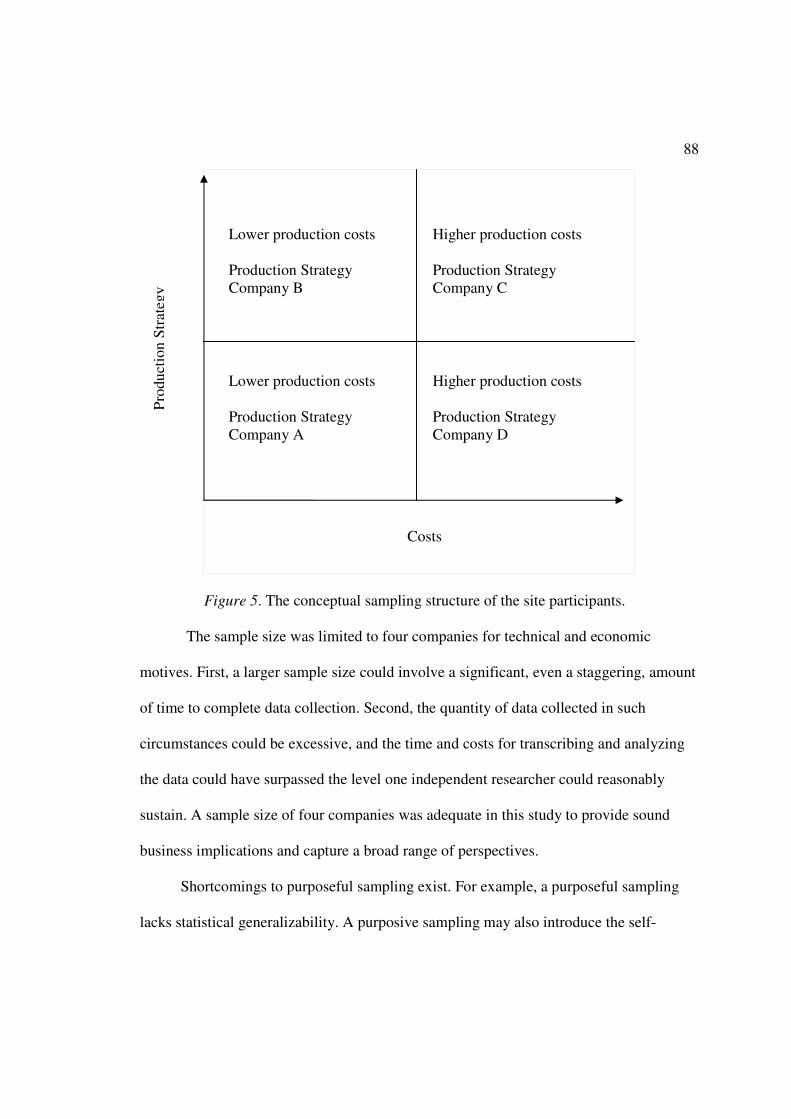
88
Figure 5. The conceptual sampling structure of the site participants.
The sample size was limited to four companies for technical and economic
motives. First, a larger sample size could involve a significant, even a staggering, amount
of time to complete data collection. Second, the quantity of data collected in such
circumstances could be excessive, and the time and costs for transcribing and analyzing
the data could have surpassed the level one independent researcher could reasonably
sustain. A sample size of four companies was adequate in this study to provide sound
business implications and capture a broad range of perspectives.
Shortcomings to purposeful sampling exist. For example, a purposeful sampling
lacks statistical generalizability. A purposive sampling may also introduce the self-
Higher production costs Production Strategy Company D
Lower production costs
Production Strategy Company B
Lower production costs Production Strategy Company A
Higher production costs Production Strategy Company C
Costs
Pro
du
ctio
n S
trat
egy
89
selection bias (Lucas, 2014). For instance, the sample might be thought to represent a
broad population when in fact, it does not. Addington et al. (2014) maintained that the
purposive sample strengthens the data quality. The data I collected were drawn from
experienced-senior managers in the aluminum production field, who faced the problem
firsthand. The purposive sample in this respect strengthened the data quality. As
mentioned by Cleary et al. (2014), a researcher must select the most productive sample to
answer the RQ adequately.
Sampling Participants
In qualitative research, the accuracy of the data sampling is a quality criterion and
the premise for credibility because the researcher intends to uncover conditions
associated with the problem and the context (Stake, 1995). The Council on Population,
Social Sciences, and National Research (2014) described how the participant population
is recognized, conceivably to manifest decisional vulnerabilities; hence, researchers must
take appropriate steps to produce informed consent before conducting the study.
McAreavey and Das (2013) maintained that there is no one way of gaining access to
participants, but a researcher needs to respond appropriately to ethical issues that may
arise. In this study, I used a professional network to identify senior managers (SMs).
Furthermore, I invited the SMs to participate by way of an initial personal e-mail. I used a
purposeful sample of senior production managers to gain information quality based on
their position in each company’s hierarchy.
For the sake of consistency, the targeted participants met uniform socio-
professional criteria. Homogeneous criteria allowed eliminating variations in responses

90
that might otherwise arise because of cognitive or social desirability bias (Bornstein,
Jager, & Putnick, 2013). Participant selection depended on socio-professional criteria
regarding (a) the participant’s level of responsibility in the aluminum production, (b) the
participant’s experience, and (c) the participant’s knowledge about aluminum production
strategies. All participants had at least 10 years of experience in the aluminum
production.
Rimando et al. (2015) indicated that low-literate participants might exhibit
difficulty understanding complex questions and answering questions adequately. A
cognitive bias pertains to a systematic deviation from rationality in understanding—a
situation in which judgments on a phenomenon might be illustrated illogically
(Croskerry, 2013; Williams, Blackwell, Mackenzie, Holmes, & Andrews, 2013).
Croskerry (2013) discussed how some individuals tend to provide particular information
based on perceptions, especially when the analysis involves ambiguous and complex
situations. In this study, cognitive bias might occur from limited understanding (e.g., a
lack of knowledge or experience) of the concepts of interest. Social desirability bias also
may influence a participant’s ability to answer with honesty and may be a significant
threat to the validity of data-self reporting (Kelly, Soler-Hampejsek, Mensch, & Hewett,
2013; Nolte, Elsworth, & Osborne, 2013). Both the cognitive bias (Croskerry, 2013) and
the social desirability bias (Kelly et al., 2013) may influence data integrity and validity.

91
Figure 6. Sampling strategy for selecting participants. Adapted from Bornstein et al.
(2013). Adapted from “Sampling in developmental science: Situations, shortcomings,
solutions, and standards,” by Bornstein, M. H., Jager, J., and Putnick, D. L., 2013.
Developmental Review, 33, 357–370. doi:10.1016/j.dr.2013.08.003
The quality of responses is critical to allow a researcher discover patterns within
and across cases and for searching connections across emerging themes (Jeong &
Othman, 2016). Given the wide range of purposive sampling techniques, it was critical to
select the variant that best fit the goal of this study. The integration of the two criteria—
purposive and homogeneous characteristics (see Figure 5), supported mitigating
responses bias. Palinkas et al. (2015) also considered the importance of a purposeful
sampling and the benefits of considering the sampling strategy by integrating its variants
in selecting participants.

92
Interviewing and Location
The environment and locations selected for the interview were neutral. In most
cases, the participant selected a restaurant or a public park to enhance the neutrality and
the quality of the conversation. A meeting's location influences the quality of both the
answers to the questions and the conversation (Bonevski et al., 2014; Bourne & Robson,
2015; Namageyo-Funa et al., 2014). In addition, the neutral location must be safe to
protect a participant’s details and his or her confidentiality (Rimando et al., 2015). The
locations selected were safe to provide confidence in protecting the participants’ details
as Rimando et al. (2015) recommended. The neutral locations for the interview also
allowed me to avoid the intimacy of the family. Haahr, Norlyk, and Hall (2014) found
that the closeness of a family is a situation that may disturb the conversation or the
concentration of a participant.
Given the geographically dispersed distance of the participants’ locations and the
timing of the interviews, I used a technology-mediated communication tool (Skype) in
some cases for higher efficiency. The use of Skype allowed overcoming availability
limitations. Hanna (2012) also supported that online-interviewing electronic device might
allow eliminating the costs of traveling without reducing the quality of the data-gathering
process. Bonevski et al. (2014) advocated the benefits of technology-based interviews
when collecting data from participants who are not readily available. Nevertheless, all
participants had to sign informant consent and send a scanned copy. Skype allowed
gathering information rapidly and to closing the availability gap between the participants
and the researcher.

93
Duration of the Interview
The length of the interview and the interview-question structure can influence the
data collection quality (Namageyo-Funa et al., 2014). Rosenthal (2016) found that
carefully constructed interview questions and the quality of participants might enhance
the quality of answers. The duration of the interview was limited to a maximum of 50
minutes, and the number of interviews in a day was limited to two due to the possibility
of fatigue. I found that some participants were interested and motivated to provide
answers to some topics more than others were. In some cases, I proposed a break for five
minutes and suggested having snacks or placing the commands to the restaurant’s
waitstaff. Participants proved their knowledge about the topic, and they suggested areas
of exploration. For example, some senior managers placed a significant emphasis on the
circular economy as a source of competitive advantage.
Developing the Interviewing Scheme Based on the Flexibility of the Qualitative
Method
Gibbins, Bhatia, Forbes, and Reid (2014) reported that semistructured, face-to-
face interviews are the most original interview setting for enriching the conversation and
generating qualitative data. Semistructured interviews can offer the flexibility to have a
provisional list of predetermined concepts or propositions to explore while allowing the
participants to communicate freely within topics (Irvine, Drew, & Sainsbury, 2012).
Face-to-face contacts promote an active exchange of ideas between a researcher and the
participants (Gibbins et al., 2014). As Irvine et al. (2012) discussed, a semistructured

94
interview is extensive; it allows the person interviewed producing new thoughts during
the interview.
The semistructured interview format was used to administer 10 initially planned
questions. In this open-ended interview format, I asked similar questions to all
participants. This approach allowed collecting answers efficiently, analyzing, and
comparing outcomes. I based the decision to use the semistructured interview format on
its flexibility and adaptability to new insights, which are characteristics of the exploratory
study. Furthermore, this interview format provided a degree of freedom and the flexibility
by adding ideas that produced a direct connection to the RQ. Semistructured interviews
also facilitated adding follow-up questions to seek convergent information (literal
replication) by probing interesting responses or completely different outcomes
(theoretical replication).
To maximize the quality of answers to the RQ, I organized the interview
questions in such a way to start the conversation with issues that participants could
respond with simplicity, followed by the ones that were more complex. The objective of
using this approach was to allow raising their level of self-confidence of the participants.
One week before the follow-up one-on-one semistructured interview, I sent the list of
questions to all potential participants along with the initial contact letter. I found that
most participants appreciated the format because they were allowed expanding and
exemplifying based on their experience, seldom from the perspectives that I might not
have considered highly influential.

95
After three interviews, I discovered that three of the 10 interview questions I
initially planned tended to produce redundant answers. Additionally, upon discussion
with a few participants, I observed that some quantitative information was needed for
comparing production costs between companies. I decided in agreement with the doctoral
chair to merge some questions into a single question focusing on providing substantive
information to answer the RQ. In the subsequent interviews, I requested the participants
to provide the quantitative numbers to allow differentiating the performance between
companies. As Ritchie et al. (2013) and Yilmaz (2013) discussed, the qualitative method
offered the flexibility to interact with people and to refine interview questions as the
interview unfolded.
Throughout the interviews, the ability to listen carefully to what participants were
saying without interrupting was essential for a constructive interaction. Doody and
Noonan (2013) suggested that a researcher must show understanding and remain an
active listener by maintaining eye contact during the interview. I maintained eye contact
and showed passion and respect to what the participants were saying while allowing the
conversation to flow without interruptions.
Although I wanted to remain attentive, the modest approach was not systematic,
because some probing or follow-up questions were needed to enhance consistency or
convergence or to establish clear divergence of viewpoints when required. Some
examples of follow-up questions included, “Could you clarify how operational excellence
allowed to reduce production costs?” Another probing question was, “When you
mentioned that cutting costs through capital expenses have saved USD150, 000,000,

96
could you identify some operational risks or quality issues that could have been induced
by cutting these costs and how did your company address them?”
Ethical Research
I attained a high level of integrity by protecting participant information and
maintaining trustworthiness throughout the data gathering and analysis. Oquendo,
Stanley, Ellis, and Mann (2014) suggested paying attention to both general and specific
ethical considerations. The OHRP (2005) recommended that the voluntary consent of the
research participants was of paramount importance for meeting the ethical criteria of
research. Besides, the participants should possess the adequate understanding of the
impact of their participation (OHRP, 2005).
Before accessing the participants, I obtained the research approval from the IRB
at Walden University and included the authorization code in the final manuscript. The
IRB provided guidance about how to manage ethical research and minimize the risks
involved. Criteria to yield ethical research covered (a) the ethically responsible
management of private information through new technologies, (b) handling informational
risk, (c) the general typologies of risk, and (d) the conventional solutions for managing
and minimizing risk (45 C.F.R. § 46.111). Furthermore, according to the U.S.
Department of Health and Human Services, mentioned in the Council on Population
(2014), the minimal risk implies that the likelihood and magnitude of the anticipated
discomfort in the study are less than or similar to quotidian risks. The characteristics of
minimal risk provided thereof, derived from regular, physical, and psychological
activities that a human subject might face during quotidian actions (Council on

97
Population, 2014). With this understanding, I considered the human subject protection
beyond those cited-minimal risks to ensure that I induced no discomforts (physical and
psychological) in the case study procedures, or if any exist, that they would be less than
typical minimal risks.
Wirshing et al. (2014) and Oquendo et al. (2014) suggested that a researcher
should administer informed consent properly. I applied this process in two stages. In
stage one, I provided information about the study’s significance and the risks to potential
participants. I wrote a letter inviting potential SMs to engage in the study. In this letter, I
included information such as (a) the purpose of the study, (b) a statement that participants
were free to quit the study at any time, (c) the potential risks involved, (d) the length of
time needed, and (e) the intended impact. In stage two, I prepared the data-gathering plan,
with the contingencies to dealing with any issues that may arise. At the outset of each
interview, I ensured that the participant understood the information detailed thereof and
that he or she has signed the consent form before data collection.
I also assured the participants that no physical or psychological harm from their
participation was expected. Stacey and Stacey (2012) stressed the need for a researcher to
produce accurate, honest, and reliable reporting of data as well as to maintain high-
quality relationships with all participants. I kept a high level of trust throughout the
research process by building genuine relationships with all SMs.
Stacey and Stacey (2012) maintained that the researcher should avoid any cultural
bias and unfair practices as well as conflicts of interest between the interpretations of
evidence and organizational goals. There was no discrimination toward human subjects

98
based on ethnicity, age, gender, race, national culture, sexual orientation, disability, or
socioeconomic status. Finally, I maintained the privacy, confidentiality, and anonymity of
the participants as recommended by Oquendo et al. (2014) and Stacey and Stacey (2012).
As suggested by Yin (2012), I have planned to store the raw data for at least five years so
that other scholars may retrieve them efficiently after the initial research.
Data Collection Instruments
Planning Data Collection
Data collection is a crucial step to ensuring a study’s reliability (Yin, 2013). To
achieve quality in scientific research, a researcher must create a methodological
framework that integrates ethics in data gathering and analysis (Rimando et al., 2015).
Anyan (2013) supported the use of various sources of evidence to provide in-depth
insights. The data collection planning was essential to develop, based on the requirement
to anticipate ethical issues. In developing the data collection plan, I aimed to (a) identify
the appropriate method to use, (b) assess all steps in gathering data, (c) plan resources
and make them available, (d) identify possible ethical issues, and (e) write the protocol to
access participants and data. The steps involved in the data collection included
identifying and gaining access to SMs, obtaining participant consent, collecting and
storing information, addressing implied constraints (Yin, 2012), and conducting member
checking (Simpson & Quigley, 2016). In this study, I built a positive relationship with
participants as a premise for successfully gathering data.

99
Data Collection Instrument
Yin’s (2012) interpretation of the data-gathering instruments considered the
methods associated with the utilization of any particular source of data. Yin advocated
the combination of multiple evidentiary sources to strengthen the credibility of the
findings. I used interviews and documentary analysis to triangulate information. I also
used the interview protocol to describe the background of the study and the quality
measures undertaken to protect participants. The interview protocol (see Appendix A)
included the interview questions, the procedural nature of interviewing, and the policies
of protecting and maintaining the independence of the participants as they develop their
thoughts (Van Wijk, 2014).
I used supplementary electronic instruments—a SONY Voice Recorder and
ATLAS.ti—for data recording and coding, respectively. The voice recording allowed me
to capture detailed information from the interviews that I might otherwise have
overlooked. The SONY Voice Recorder device allowed maintaining eye contact with the
person interviewed. Cornish et al. (2013) and Tummons (2014) claimed that the computer
program Atlas.ti is an efficient and effective data coding and analysis tool.
Leedy and Ormrod (2013) maintained that qualitative researchers often serve as
instruments for data gathering. I was the primary instrument, as a researcher, for the data
collection. The researcher, as a primary instrument of data collection, might threaten the
integrity of a study if he or she fails to have the appropriate self-awareness regarding
potential sources of bias during the data-collection process (Ritchie et al., 2013). To
mitigate these possible sources of bias, I reviewed the transcripts and allowed the senior

100
managers to do the same. According to Harper and Cole (2012) and Loh (2013), allowing
member checking can address the convoluted issue of trustworthiness. During the
member checking, the SMs had the opportunity to review their statements. Of 32
interviews, three SMs called for revisions of some answers to the interview questions.
Guba and Lincoln (1994) suggested that participant review should occur at the
end of each interview or near the end of the data-gathering process. According to Guba
and Lincoln, the researcher needs to review the transcripts, identify central themes,
synthesize the findings into few paragraphs, and submit the summary to participants for
reflection and authentication. Harper and Cole (2012) recommended that a researcher
summarize information at the end of each interview and ask the participant to
authenticate the accuracy of the summary.
Member checking can occur during the interviews or after data have been
gathered; these two approaches are not mutually exclusive. Because the data gathering
and analysis occurred concurrently, I used both methods in this research. I informed all
participants that the interview transcript would be sent to them by e-mail so that they
could reexamine the accuracy of the content. In doing so, I aimed to allow the
participants to make needed corrections. Participants were also told to make required
changes and return within two days to maintain the data analysis flow. Some SMs
voluntarily requested to perform the transcription review for correcting mismatches or
adjusting areas that might have been overlooked or to provide additional insights related
to the RQ.

101
I emailed the transcription to the concerned SMs immediately after anonymizing.
They made corrections that I classified into three categories. For example, in the first
category, Participant 2A provided additional quantitative details regarding the carbon
consumption efficiency. These details were overlooked in the initial interview. I
documented all revisions for further referral. The transcription review process was also
an approach to enhance trustworthiness and to demonstrate that I implemented the
confidentiality process as discussed in the consent form. For example, none of the
participants highlighted a violation of the identifying details, because the transcripts at
this stage were anonymized from threats to confidentiality. In category two, the interview
was transcribed incorrectly in one case. In the audio tape, the SM mentioned, “low-
energy consumption contributes to reducing costs.” The transcriber wrote, “low-energy
consumption efficiency contributes to reducing costs.” Operationally, these are two
opposing sentences. In the third category of amendments, the participant added insights
that he omitted in the initial statements. None of the participants removed valuable details
that could influence the quality of the initial data.
In conducting the process of transcription review, I was conscious of some
potential threats that participants might introduce. For instance, a participant might revise
the content to alter the accuracy of the original verbal dialogue, should threats to
confidentiality surface. I found that most senior managers added valuable details and new
insights to answer the RQ. For example, the code about increasing the electrolytic cell
lifespan emerged from the first transcription review. Increased asset lifespan can allow
capital expenses minimization and production cost savings. The transcription review

102
allowed me to improve data quality and provided more clarity to certain ambiguous
statements.
Furthermore, to confirm themes after data triangulation, I interpreted the data at
the end of the data-collection program, identified core themes, drafted a summary, and
submitted it to two SMs in each case study to provide reflection and authentication. I
used follow-up e-mail as a communication means to reach the SMs and to share the data
interpretation.
Data Collection Technique
Scholars such as O’Reilly and Parker (2012), Strauss and Corbin (1998) discussed
the importance of adequate sample size in qualitative research; however, no consensus
has been reached to guide researchers in determining the appropriate sample size. Some
researchers determine the appropriate sample size by using the concept of data saturation.
For instance, Strauss and Corbin (1998) defined data saturation as attaining a level of
information that answers the RQ such that no new information emerges. Based on the
recommendations of Guest et al. (2006) that data saturation occurs after 12 interviews, I
planned a range of 8–12 interviews for each case. After six interviews, however, I noticed
that information started repeating. I decided to continue collecting data until I witnessed
no new themes to develop the RQ and the subquestion. I achieved data saturation after 32
interviews (eight in each case). Additionally, 16 documents were collected (four in each
case) and the member checking was solicited.

103
Data-Collection Steps
A proper planning of the data-collection process must start with a case study
protocol (Yin, 2012). In addition to clarifying the purpose and the structure of the
interviews, the protocol was the document in which I identified potential issues that may
occur. I also used the case study protocol to develop strategies for addressing potential
ethical intricacies. Yin outlined steps required for the data-collection process. The steps
needed in this research included (a) writing the case study protocol; (b) identifying sites
and participants; (c) obtaining access to human subjects and administrating informed
consent; (d) resolving potential problems; and (e) interviewing, collecting, and storing
data. Interviews and document gathering constituted the primary data sources. Interviews
allowed direct interactions with SMs and permitted me to gain a deeper understanding of
the problem under study from the perspective of participants. After each interview, the
participants had the opportunity to review the summary of the most relevant points,
authenticate the accuracy of the answers, and make corrections where needed. The
saturation method and member checking increased the validity and credibility of the
findings (Guba & Lincoln, 1994).
Interviewing
Although face-to-face interviewing is the preferred method for discovering and
interacting with a participant to identify patterns (Bouchard, 2016), another strategy was
to use Skype and online interviewing to access some remote participants. Online
discussions allowed the participants to answer questions in an anonymous environment.
Online interviewing has advantages and drawbacks when compared to the traditional

104
method of interviewing (Bouchard, 2016; Ritchie et al., 2013). Some drawbacks
pertained to the network availability and a lack of direct interaction between the
interviewer and the interviewed. Notwithstanding, this interviewing setup allowed the
rapid deployment of the questionnaire and a faster return of the responses.
Value Added from the Document Analysis
According to Petty, Thompson, and Stew (2012), the document analysis involves
reviewing procedures, annual reports, meeting minutes, and the companies' trends. I
analyzed the documents that were prevailing to complement the interviews (see the
procedure located in Appendix B). Yanow (as cited in Owen, 2014) found that text
analysis constitutes the evidence a researcher may use for clarity and it can corroborate or
refute interview data. Using text analysis in conjunction with semistructured interviews
allowed distinguishing information convergence.
Fundamental to document analysis is that a document must be valid, decipherable,
original, authentic, and relevant to the context under study (Owen, 2014; Petty et al.,
2012). In this study, I used annual and strategic reports. These documents were all
available in the public domain and on the companies’ websites. I interpreted the material
through the methodology of constant comparative analysis (CCA) as recommended by
Glaser and Strauss (1967), to recognize central themes related to production cost
minimization. According to Elo et al. (2014), a prerequisite for the document analysis is
that a researcher must reduce data into categories and concepts that describe the RQ.
CCA is an approach to data analysis by which a researcher discovers core themes through

105
iterative reading, and by comparing new codes with the previously identified clusters
(Pinto et al., 2012).
Before coding, I anonymized and uploaded the document to Atlas.ti. Furthermore,
I read the report repeatedly before coding. Franzén and Brown (2013) recommended that
the analysis of the textual material require deconstructing each document into quotations
before identifying primary categories. As I reviewed the data and assigned a prefix to
each primary code, concepts matured gradually and became self-evident. Fram (2013)
suggested comparing new codes with existing codes in the dataset. I compared each new
code with the previously identified concepts in the dataset. As I gathered data
incrementally, I grouped similar codes into clusters to form subthemes and then the
concepts of interest. During this process, I wrote memos; provisional abstractions of
concepts or reflective notes about what I was learning from the data analysis, the
concepts that were unfolding, and the relationships among concepts.
The RQ was about identifying the strategies that some aluminum companies
might implement to reduce production costs. Pinto et al. (2012) considered primary
categorization as open coding. Supplementary reading of the code list allowed me to
refine the coding structure to yield the second level coding. Both the RQ and the
conceptual framework provided the categorization structure for coding.
Weishaar et al. (2012) recommended comparing themes within a document,
across documents, and with concepts within the existing literature. The second stage of
the thematic identification involved cross-linking categories and concepts based on the
potential relationship among them to generate emerging themes. Atlas.ti was helpful in

106
this cross-linking process. I linked categories with each other within the document and
across other documents through transitive relationships. In the data analysis realm, this
phase is termed axial coding (Weishaar et al., 2012). In the final stage, I grouped the
concepts to generate organizing themes. I further triangulated these organizing themes
with those identified from interviews to yield ideas held in unison. As proposed by Petty
et al. (2012), data collection and data analysis should occur concurrently, constructed via
an iterative process to building codes and to addressing diverse views as well as
competing explanations. I used the concurrent approach to data gathering and analysis to
gain incremental experience.
Data Organization Technique
I followed the methodology established by Huberman and Miles (1994) for
organizing data. According to Huberman and Miles, data organizing consists of (a)
conducting interviews, (b) obtaining the transcript of each interview, (c) anonymizing all
details, (d) writing memos to establish consistent criteria for coding, (e) coding, (f)
creating hierarchical network, and (g) clustering groups according to their similarities.
After each interview, I provided the electronic file to the audio transcription
services. The agency offered a full confidentiality package for all audio-to-text services
requested. Before the transcription, I signed the letter of compliance and privacy
protection with the transcription services. The transcriber transcribed each audiotaped
research file verbatim. The turnaround time for each transcription was approximately 24–
32 hours.
107
I anonymized each file received from the transcription services through removing
all identifying details. Similarly, I removed all possible identifying features from each
publicly held document collected before uploading it to Atlas.ti. To maintain
confidentiality, I assigned a pseudonym such as "Participant #1A" to each file name. The
Participant #1A denotes the name of the senior manager from Company A. Before coding
I prepared the data by organizing the files into distinct computer folders based on the
interview source; furthermore, I uploaded the files to Atlas.ti. In planning within- and
between-case analyses, files were named Company A, B, C, or D.

108
Figure 7. Data organization technique, adapted from Huberman and Miles (1994).
Adapted from “Data management and analysis methods. In N. K. Denzin & Y. S. Lincoln
(Eds.),” by Huberman, A. M., and Miles, M. B., 1994, Handbook of qualitative research
(pp. 428–44). Thousand Oaks, CA: Sage.
(1) Perform in-depth
semistructured interviews, site
observations, and documentary.
analysis
(7) Create hierarchical
classification of
codes/network.
(2) Obtain interview
transcripts from experts.
(3) Anonymize the transcribed
content.
(5) Write memos; identify
consistent criteria
(meanings) for coding.
(6) Code the text segments (concepts vs. the RQ).
.
(4) Upload the transcript into a CAQDAS (i.e. ATLAS.ti)
Cluster meanings as per their similarities and establish frequencies of codes through a CAQDAS (i.e. ATLAS.ti)

109
Concurrency of Data Collection and Analysis
Haas, Hermanns, and Melin-Johansson (2016) and Merriam (2014) elaborated on
the importance of the concurrence of the data collection and analysis. The concurrence of
the data gathering and analysis presents numerous advantages. For instance, as a
researcher develops codes using an iterative approach, further discussions with
participants become more focused and intense (Merriam, 2014; Petty et al. 2012). I used
this approach to enhance the coding quality because outcomes from all prior interviews
permitted to strengthen the subsequent discussions with participants.
As recommended by Merriam (2014), I considered that data gathering and
analysis was a recursive and dynamic process in which I composed codes iteratively by
interacting with participants, analyzing data via a qualitative-computerized software,
thinking about intervening and causal concepts, refining codes, and reversing to
interviews. I assigned codes based on the pertinence of the concept used by the
participants as well as the code convergence with the concepts underlying the RQ.
Data Analysis
Philosophical Assumptions for the Data Analysis Technique
Different strategies exist for analyzing qualitative data in case studies. Three
influential authors, Stake (1995) and Huberman and Miles (1994), have proposed
different approaches to analyzing qualitative data. More recently, methodologists, such as
Yin (2012) and Merriam (2014) have added approaches to the research on analyzing
qualitative data. Differences between these strategies depend on the epistemological
orientation of the authors (Yazan, 2015). In this qualitative, multiple comparative case

110
study, the methodology was rooted in constructivism and interpretivism, given both my
epistemological inclination and the exploratory nature of the study.
Merriam (2014) argued that qualitative studies are based on the philosophical
assumption that people interact with their social contexts to construct reality. Merriam’s
conception of constructivism through interactionism aligns with Huberman and Miles’
(1994) theory about bringing a construction of reality into the research situation.
Onwuegbuzie and Byers (2014) explained that knowledge is co-constructed by both the
researcher and the participant through interactionism. With this understanding, I followed
the data analysis approach proposed by Merriam (2014), Huberman and Miles (1994).
Merriam (2014) outlined analytic techniques and data management strategies in
qualitative research. According to this approach, data analysis is a process of producing
insight out of the gathered data through the course of reducing, merging, and interpreting
information received from interviews and documentary analysis.
Steps to Analyzing Data
Qualitative researchers often handle large quantities of information to make sense
of the data gathered to answer the RQ of interest. For practical reasons, researchers must
reduce and label the data and in the form that he or she can readily manipulate.
According to Huberman and Miles (1994), three phases constitute the data analysis
approach: (a) the data organizing process and indexing, (b) the data reduction and the
query process (data extracting), and (c) pattern identification.
I investigated four companies that I named Companies A, B, C, and D in this
study for maintaining anonymity. I based the selection criteria on the assumption that two

111
companies were achieving low production costs and two were not. Each case study
consisted of an entire study (see Figure 8), in which convergent evidence was sought with
other cases to write the final report and draw conclusions. The Atlas.ti query tool was
helpful in making within-case and across-case analyses. Figure 8 provides the approach
used for the data analysis within and across cases.
Figure 8. Data analysis method, adapted from “Application of case study research
(3rded.),” by Yin, R. K., 2012, Thousand Oaks, CA: Sage.
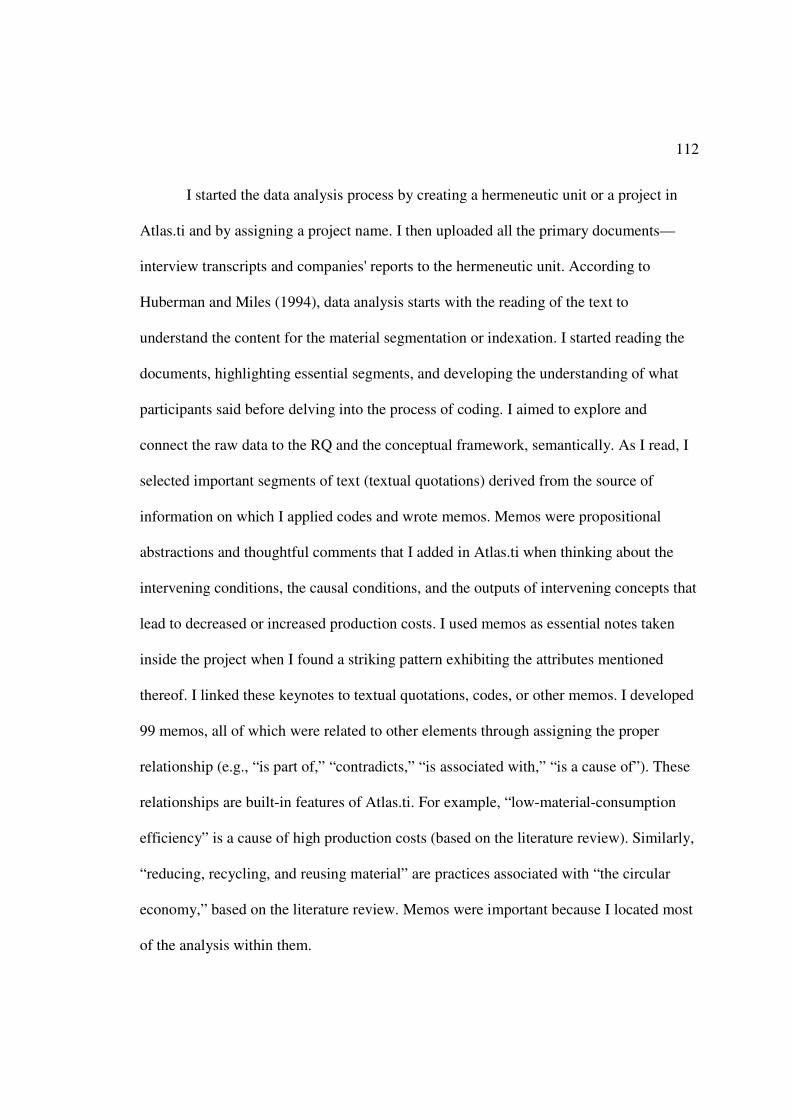
112
I started the data analysis process by creating a hermeneutic unit or a project in
Atlas.ti and by assigning a project name. I then uploaded all the primary documents—
interview transcripts and companies' reports to the hermeneutic unit. According to
Huberman and Miles (1994), data analysis starts with the reading of the text to
understand the content for the material segmentation or indexation. I started reading the
documents, highlighting essential segments, and developing the understanding of what
participants said before delving into the process of coding. I aimed to explore and
connect the raw data to the RQ and the conceptual framework, semantically. As I read, I
selected important segments of text (textual quotations) derived from the source of
information on which I applied codes and wrote memos. Memos were propositional
abstractions and thoughtful comments that I added in Atlas.ti when thinking about the
intervening conditions, the causal conditions, and the outputs of intervening concepts that
lead to decreased or increased production costs. I used memos as essential notes taken
inside the project when I found a striking pattern exhibiting the attributes mentioned
thereof. I linked these keynotes to textual quotations, codes, or other memos. I developed
99 memos, all of which were related to other elements through assigning the proper
relationship (e.g., “is part of,” “contradicts,” “is associated with,” “is a cause of”). These
relationships are built-in features of Atlas.ti. For example, “low-material-consumption
efficiency” is a cause of high production costs (based on the literature review). Similarly,
“reducing, recycling, and reusing material” are practices associated with “the circular
economy,” based on the literature review. Memos were important because I located most
of the analysis within them.

113
To define a code, Atlas.ti provided the flexibility to read the quotations in context
and assign a comment. A researcher might export comments at a later stage for further
referral. The Atlas.ti code manager allowed maintaining the consistency and the accuracy
of definitions. Gläser and Laudel (2013) and Pierre and Jackson (2014) discussed that
computerized data analyses provide the ability after the material is coded accurately, to
retrieve and interpret data as well as to outline the relationship between codes and
themes. At times, I printed out all definitions using the code manager to export the codes
as well as the quotations in a more readable format.
Friese (2014) suggested that a researcher might approach the process of data
analysis with a deductive framework using provisional coding, or an inductive approach
using open coding, or both. I approached the data analysis using both the inductive
approach and the deductive method. The combination of the two procedures was
appropriate, especially given the exploratory nature of the study and the case study
propositions outlined in the conceptual framework.
Three types of coding are available in Atlas.ti: (a) In vivo, (b) provisional, in
which codes derive from the literature, and (c) free coding. In vivo coding consisted of
labeling the segments of text by using the exact word from the text; it allows inductive
reasoning (Huberman & Miles, 1994). Inductive reasoning is a powerful approach to
domain-specific problem solving and solving multifaceted problems (Molnár, Greiff, &
Csapó, 2013). Free codes were the labels that I assigned based on my interpretation of
data and after thinking about what participants said and the significant points of the
documents. I created some codes by interconnecting the code’s content to the theory

114
underlying the RQ. For example, whereas “Energy_Management” was a provisional code
derived from the literature, “Operational_Excellence” was an in vivo-code, and
“Price_Efficiency” was a free code. The combination of these coding practices is the
evidence of the application of the three types of coding I applied in this case study.
Huberman and Miles (1994) and Strauss and Corbin (1998) defined a code as a
label assigned to a quotation to reduce the complexity of what a participant tries to say by
using many words. Codes reduce the complexity and provides the accurate summary of
the content; notwithstanding, the meaning must reflect the participant’s perspective.
Gläser and Laudel (2013) argued that indexing of the text segments should maintain the
original text unchanged. In coding, I analyzed three critical strategic and operational
aspects: (a) the causal conditions including contextual conditions (what influences high
production costs); (b) intervening conditions or strategies and capabilities identified by
participants or described in the documents, and (c) outcomes from intervening conditions
or procedures. I assigned a color to each code, depending on whether it represents an
intervening condition, a causal condition, or a result of an intervening condition.
Furthermore, the process of grouping codes or types of actions was straightforward.
A proactive approach from the early stage was critical in planning for the data
coding. For example, in labeling data, I took steps to structure the codes list in a
hierarchical pattern to develop a comprehensive picture of families and categories.
Organizing items into families allowed to produce clusters of codes, memos, and primary
documents for more comfortable handling. Each code was assigned a prefix based on its
semantic meaning. For example, all actions related to energy were prefixed by “Energy_”

115
(e.g., Energy_Exportation, Energy_Price, Energy_efficiency). Friese (2014) suggested
that a researcher must plan from the early stages the structure and the hierarchy of codes.
I saved time by anticipating the structure of the codes. The Atlas.ti software was powerful
in providing connections and links between elements.
In coding, the unit of analysis was not necessarily a paragraph, but a striking
statement that indicated a strategy or a factor that reduces production costs or causes high
cost. Textual quotations were strings of text (sentences, paragraphs) of an arbitrary size. I
repeated this process for all documents. From four interviews, I identified 168 codes,
created a drop-down code list, and a code matrix comprising all definitions; both were
used to maintain consistency. I kept the code names brief and succinct.
Fielding (2012) recommended using data integration, or triangulation, as an
approach to conceptualizing and strengthening construct validity. According to Fielding,
three fundamental reasons exist for using the data integration approach: (a) to produce
convergent validation, (b) to illustrate findings, and (c) to develop analytic density. Yin
(2012) and Chatfield, Cooper, Holden, and Macias (2014) recommended that the inquirer
should develop a within-case analysis supported by thematic analysis across cases to
identify similarities and differences. An interview lasting 50 minutes generated an
equivalent workload of 12–20 hours for the data analysis. For the central themes
identified, I ensured that member checking occurred.
Analyzing Data through a Comparative Approach
The qualitative comparative analysis was the preferred method for the cross-
analysis to describe and examine the four cases under investigation. Olson, McAllister,

116
Grinnell, Gehrke-Walters, and Appunn (2016) argued that qualitative comparative
analysis (QCA) can draw on different sources of data; notwithstanding, a researcher
should focus on the analytic approach that best investigates the connection among themes
and their context (case-based knowledge). This method is distinct from the traditional
model of analysis that focuses on a single variable and its relationship to the RQ.
After coding, I identified categories based on the codes similarity and assigned a
subtheme. The category, in this case, was the best fitting concept from all codes in a
given data set of a single case study. The subthemes, which were the combination of
categories, underlay the concepts. Subthemes derived from the categories that most
participants introduced or themes that exhibited a core meaning to answer the RQ. I
developed groups in the form of networks of subthemes. Each concept identified was
compared with other concepts within the network of concepts that was unfolding.
Networks facilitated the conceptualization and the visualization of the structure and
permitted interconnecting assortments of similar categories in-context.
Gale, Heath, Cameron, Rashid, and Redwood (2013) and Corbin and Strauss
(2014) recommended rearranging the data into subcategories and building the
relationships between these subcategories by employing thematic guidelines. I used
intervening concepts, contextual factors, causal conditions, strategies, and inter-relational
between concepts (axial coding) to rearrange the network of subcategories. Axial coding
was about reassembling the subcategories into more meaningful categories. After axial
coding, I grouped the leading categories systematically to obtain a cluster that led to the

117
concept of interest (see Table 4). Atlas.ti provided the capability to display relationships
between elements in the networks' views.
Table 4
Code Families
Primary Theme/Cluster Subtheme Open Code
Energy consumption efficiency
- Energy management
- Price efficiency
- Type of energy
- Technology efficiency
- Energy processing efficiency
- Reduce, recycle, and reuse (circular economy)
- Reduce energy consumption
- Retrofit old assets
- Divest old assets
- Reduce electrolytic cell voltage
- Material attributes
- Theoretical consumption
Raw material consumption intensity and acquisition
- Price efficiency
- High level of vertical integration
- Technology efficiency
- Processing efficiency Increasing
- Material management
- Theoretical consumption
- Material handling
- Material quality
Carbon manufacturing capability and consumption efficiency
- Price efficiency
- Anode manufacturing capability
- Reduce, recycle, reuse (circular economy)
- Operational practices
- Anode quality
- Process capability
- Reduce sulfur content
Environmental Sustainability
- Operational excellence
- Technological capability
- Material attributes
- Increased lifecycle
- Circular economy
- Reduce emissions
- Minimize greenhouse gases
- Processing efficiency
- Reduce transportation costs
- SPLM management
According to Yin (2012), a researcher needs to describe multiple perspectives and
outline potential rival explanations. Stake (1995) recommended that when a large number
of dissimilarities are present as the main effects of individual cases facing similar
external forces, a researcher must scrutinize the contextual characteristics. The

118
comparison of the companies’ business practices required defining critical measurable
factors. I related these factors to quantifiable measures of energy and material
consumption intensities and costs, as well as the capabilities used to reduce production
costs. The strategies I used to minimize the probability of misinterpretation covered (a)
addressing the rival explanations, (b) triangulating the data, and (c) comparing critical
indicators of performance based on the theoretical requirements for the aluminum oxide
electrolysis. For example, to disambiguate the competing explanations potential about the
energy costs, I deconstructed all possible components of energy costs, including
processes, technological, and price efficiencies. I also endeavored to understand the
impact of electricity contract in each case.
Within-Case Analysis
Data Validation: Triangulation Approach
Data triangulation is an approach to facilitate validation of the information
gathered from different sources (Denzin, 2012). Denzin (2012) classified three types of
data triangulation: (a) time, (b) space, and (c) person. Denzin defined time-based
triangulation as a methodological approach to gathering data on a phenomenon at
different points in time. Space-based triangulation concerns the collection of data on the
same event at separate places. Denzin (2012) further provided critical characteristics of
triangulation; according to these characteristics, triangulation involves combining at least
two or more data sources, theoretical viewpoints, methodological strategies, or
investigators to seek convergence of findings. The two data sources I used in this study
included in-depth, semistructured interviews and document analysis. Convergent

119
validation refers to determining whether the results from different sources provide
similarities (Fielding, 2012). According to Stake (1995), a researcher needs to confirm
each key finding by at least two cross-sources that establish similar outputs. The average
convergence of core themes from the two data sources was 71%, confirming principal
findings.
Huberman and Miles (1994) suggested classifying categories into concepts or
themes by constant comparison and linking them to the matrix of concepts that evolves.
The constant comparison approach allows merging or grouping similar codes (Brailas,
2014). I used this method to group families. First, I displayed the list of codes using the
code- manager tool in Atlas.ti. Second, I outlined the definition of all codes without
exception. I based the definition of codes on my understanding and interpretation of what
the participants said. Finally, I assigned a prefix to each code depending on its similarity
with others. The prefix was a root for all similar codes.
Triangulating Two Data Sets
Data analysis from semistructured interviews and documentary analysis formed
the core axes of information triangulation. Person- and time-based triangulations were the
methodological strategies I selected to gather and analyze information. The assumption
for triangulating data was based on the premise that no one method considered
individually could provide the confidence and the reliability to answer this RQ. Using
two data sources might help increase the confidence in data. Through data triangulation, I
assessed whether the themes identified in interviews and document analysis exhibited
sound similarity. The Venn diagram displayed in Figure 9 provided the methodological

120
framework and the logic I used to triangulate the two sources of information and to
validate the convergence.
Semi-Structured Interviews: Notice concepts, production strategies, core capabilities, intervening conditions to reduce cost, and causal conditions.
Document Analysis: Notice concepts from annual and strategic reports, companies’ websites, and Industry
reports. Data Validation: Information Convergence
Convergence
Figure 9. Strategy for triangulating two sources of data. Adapted from “Triangulation
2.0”, by Denzin, N. K., 2012. Journal of Mixed Methods Research, 6, 80–88.
doi:10.1177?1558689812437186
The Atlas.ti query tool facilitated extracting and exporting data from the software
to an Excel spreadsheet so that I could chart the frequency of codes in the radar form. The
radar chart is a graphical method beneficial when displaying multivariate data in a two-
dimensional form. I operationalized the data convergence through grouping similar codes
under one category while considering interviews and documents separately. As it can be

121
seen in Figures 10–13, I sought and applied the convergence approach separately to each
company’s dataset. The convergence strategy was implemented with two distinctive
components: the qualitative and quantitative similarities of themes. I compared both the
content (e.g., types of themes) and the frequency of the core themes from the two datasets
(see Figures 10–13). There was alignment between the themes isolated from the
documents analysis on the one hand and the interviews on the other.
The relative position, representing the frequency of each category identified, was
informative of the convergence or divergence of views on a given class. Because each
case consisted of eight interviews and only four documents analyzed, it was imperative to
proportionate the number of the reports that I reviewed with the interviews for a greater
comparability of the themes’ frequency. The dotted line is a characteristic of such an
approach because it extrapolates themes derived from the four documents as if the
samples size were balanced. Time- and person-based triangulation provided apparent
convergence of the topics of interest because the categories generated from the reports
and interviews tended toward alignment of views. Notwithstanding, the theme
“Purchasing_Strategies,” showed a discrepancy in views between the two datasets in
Company A. Similarly, the theme “Missing_Capability_Alumina” exhibited a difference
because this concept frequently was mentioned in the documents but only by few
participants in Company D. For these divergences, I sought corroboration and
confirmation from senior managers. For example, in the case of Company D, although
most senior managers recognized that internalized-alumina acquisition was a critical

122
component of cost minimization, the vertical integration of the raw material was not
implemented in this company.
In most cases, the information from the two data sources converged with
approximately 71% similarity (the average similarity between the extrapolated lines with
the blue lines). I obtained this number by comparing the average frequency of core
concepts from interviews and documents analysis if the number of interviews and
documents collected was similar. Finally, most themes introduced during the interviews
were also reported in the documents. In the convergence approach, I assumed that the
frequent use of a concept reflected a strategic intent, an intervening concept, a causal
concept, or a condition. Given this assumption, the difference between what people said
and what they reported in the documents was essential to measure. Convergent validity
was established because the two data sources provided similar outputs.
0
5
10
15
20
25
30RQ1_Energy_Efficiency
RQ1_Raw_material_acq
uisition (Vertical
integration)
RQ1_Productivity_Plant_
utilization
RQ1_Purchasing_Strateg
ies
RQ1_Sourcing
RQ1_Strategic_Partners
RQ1_Strategies: Material
Consumption Efficiency
RQ2_Capabilities
(technology, design,
financial)
Composit Codes from Interviews Company A
Composit Codes From Documents (A)
Composit Codes Form Documents
Proportionally to Interviews (Company A)
Figure 10. Thematic triangulation for Company A.
123
02468
1012141618
RQ1_Energy_Effici
ency
RQ1_Capability_R
aw_material_acqu
isition
RQ1_Capability_C
arbon_Capability&
efficiency
RQ1_Operational
Excellence
(efficiency)
RQ2_Capability
(technology)
RQ1_Productivity_
Plant_utilization
RQ1_Strategic_Par
tners
RQ1_Sustainable_
Environment Composit Codes from
Interviews Company B
Composit Codes From
Documents (B)
Composit Codes Form
Documents Proportionally to
Interviews (Company B)
Figure 11. Thematic triangulation for Company B.

124
0
5
10
15
20
25
RQ1_Missing_action
_Energy_manageme
nt
RQ1_Missing_Action
(volume, Technology
refurbishing)
RQ1_Operational
Excellence
(efficiency)
RQ1_Productivity_Pl
ant_utilization
RQ1_Missing_Capab
ility_RawMaterial
RQ1_Sourcing_Nonc
ore_Activities
RQ1_Strategic_Part
ners
RQ1_Strategies
(environmental
Sustainability)
RQ2_Missing_Capab
ilities (Carbon
manufacturing,
financial)Composit Codes from Interviews
Company C
Composit Codes from Documents
Company C
Composit Codes from Documents
Proportionally to interviews
(Company C)
Figure 12. Thematic triangulation for Company C.

125
02468
101214161820
RQ1_Missing_Act
ion_Energy_Effici
ency
RQ1_Missing_Car
bon_manufacturi
ng
RQ1_Operational
Excellence
(efficiency)
RQ1_Productivity
_Plant_utilization
RQ1_Missing_Ca
pability_Alumina
_Integration
RQ1_Sourcing_w
orkforce
RQ1_Strategic_P
artners
RQ1_Strategies_s
ustainable_envir
onment)
RQ2_Missing_Ca
pabilities
(Technology) Composit Codes From
Interviews Company D
Composit Codes Documents
Company D
Composit Codes (D) From
Documents Analysis
Proportionally to interviews
Figure 13. Thematic triangulation for Company D.
Whereas Companies A and B considered the raw material integration, carbon
manufacturing capability, and reliable technology as core capabilities to reduce costs,
Companies C and D acknowledged these capabilities as enablers to lower costs, but they
faced shortcomings in developing them (see Figures 11 and 12). Most senior managers
recognized that these components were the driving forces in production systems to reduce
production costs. As a researcher, I also found them relevant to the RQ based on the
literature review as Ping et al. (2013), Porter (1980), Miltenberg (2005), and Cobb and
Douglas (1928) outlined. Ping et al. (2013) found that because the prices of raw materials
for nonferrous metals have been rising worldwide, upstream integration in this industry

126
would make sense. Porter (1980) and Miltenberg (2005) found that dominant suppliers
might influence the price of a commodity if it is a valuable input in production
downstream or if no substitute products exist. Cobb and Douglas (1928) found that the
production function efficiency derives from inputs and outputs efficiency. The raw
material is a critical input in the primary aluminum production as it accounts for 30-35%
of the production cost. Consequently, I decided to thematize “raw material integration” in
the list of core concepts.
Triangulating Four Datasets
I used the Venn diagram paradigm to connect the four sets of emerging themes
characterizing companies A, B, C, and D (see Figure 14). Venn diagrams are
diagrammatic representations used to display juxtapositions and the diversity of all
conceivable logical relationships among datasets (Bardou, Mariette, Escudié, Djemiel, &
Klopp, 2014; Cai et al., 2013). The area in the middle of the dotted-red line is the field of
perfect convergence; that is, all companies use a similar strategy. For example, most
participants considered “Operational_Excellence” and productivity as a strategy to reduce
production costs. The overall dotted-red line outlines the area of partial convergence in
which three or four companies applied a similar approach to reduce cost. For example,
most companies used capacity creep as a strategy to increase the productivity of the plant
and to reduce the fixed cost per ton Al. The dotted-blue lines outline the commonality of
intervening or causal conditions between two different companies. For instance, whereas
Companies C and D incurred high carbon costs and inefficient alumina prices,

127
Companies A and B used upstream integration to reduce the alumina costs and, these
companies exhibited sufficient production capacity of manufacturing carbon anodes.
Input emerging themes
Input emerging themes
Input emerging themes
Input emerging themes
Area of information
Convergence
Figure 14. Strategy for triangulating four datasets.
Adapted from “Triangulation 2.0,” by Denzin, N. K., 2012. Journal of Mixed Methods
Research, 6, 80–88. doi:10.1177?1558689812437186
Yanow (as cited in Owen, 2014) found that text analysis constitutes a shred of
evidence a researcher uses for clarity and may corroborate or refute observational and
interview data. Using the text analysis in conjunction with semistructured interviews
allowed the identification of the intervening and causal concepts as well as the outcomes
128
of these concepts on production costs. These intervening concepts and conditions were
outlined in strategic and annual reports. One fundamental element of the document
analysis is that the document must be valid, decipherable, original, authentic, and relevant
to the context under study (Owen, 2014). Elo et al. (2014) recommended that the content
of the document to be analyzed must have a direct connection with the themes underlying
the RQ. In this study, I used only valid documents, written between the year 2013 and
2016. The type of records explored included annual and strategic reports and companies'
websites. Strategic reports had extensive information and enhanced data quality.
Thematic and Data Saturation Investigation
Glaser and Strauss (1967) interpreted that data saturation implies the point in the
data collection process when the researcher finds no new theme to develop aspects of the
RQ. According to Denzen (2012) and O’Reilly and Parker (2013), the theoretical
saturation of data implies that a researcher reaches a point in the data collection and
analysis at which no additional data are found to develop new insights to the RQ. No
commonly recognized formula exists for determining the point of data saturation.
Notwithstanding, researchers have proposed some fundamental rules regarding the point
of data saturation. For instance, Guest et al. (2006) conducted semistructured interviews
about socially desirable behavior and the accuracy of self-reported sexual behavior. Guest
et al. identified 97% of the critical codes after just 12 of their 61 interviews. Tribedy and
Venugopalan (2012) provided a statistical analysis of the number of interviews of Google
Scholar Annual Citations for single case studies. Tribedy and Venugopalan found that of
the top Google performers, the highest average impacts ranged from 15–30 interviews.

129
Furthermore, Tribedy and Venugopalan showed that the Cronbach’s alpha rating for
thematic prevalence was higher than .75 in the 13-to-18 interview range. In an extensive
analysis of the literature regarding case studies, I found that a range of 6–20 interviews
could yield a high Cronbach’s alpha (Tribedy & Venugopalan, 2012) for a single case
study. This information was essential in planning the interviews and related costs.
In-depth semistructured interviews were conducted to generate data saturation. In
this study, I gathered data and made data analysis concurrently in an iterative process.
After each interview, the material was transcribed verbatim, uploaded to Atlas.ti, coded,
and interpreted. All codes and themes had equal attention in the analytic and coding
procedures. I organized codes into families according to their semantic definition and
connection to intervening concepts to yield organizing themes. I compared any new code
to the organizing themes and assigned a prefix based on its attributes. I also established
transitive relationships between codes (e.g., “is part of,” “is associated with,” and “is a
cause of”). Furthermore, I was able to use the functionalities built-in the Atlas.ti query
tool to export the code families and the thematic frequencies to a spreadsheet. A two-
dimensional matrix was formed subsequently, comprising intervening and causal
concepts as well as causal conditions in the rows and cost factors in the columns. All
themes isolated (see Table 3) were introduced in the matrix.
I sought saturation at two levels including interviews (data saturation) and
member checking (thematic saturation). These two approaches to data saturation were
used concurrently to maximize benefits from the synergy. In the first level, I continued
interviewing participants until there was a point where the information from many

130
participants started repeating and providing no new insights. Notwithstanding, I assumed
that participants might provide only surface level information in the interview stage and,
adding the researcher self-reporting bias (Stake, 1995), I endeavored to solicit member
checking. In the second level, thematic saturation was sought from member checking. I
reviewed, interpreted the data, and synthesized the findings, which were sent to
participants via emails to corroborate and to add or remove information. I continued this
repeated and cross-verification process until there were no new themes to answer the RQ
and subquestion.
Before the point of data saturation, most data were similar repeatedly in the
matrix; this persistent similarity and negligible variability between documents provided
reasonable confidence in the data that the categories identified were saturated and that the
description that the participants provided about the strategies to reduce production costs
were thick and rich. Fusch and Ness (2015) suggested that thick is about quantity, and
rich is about quality. The similarity level of the new codes versus existing codes in the
matrix as mentioned thereof was higher than 95%. The quality of the documents used, the
consistency of the data analysis, and the member-checking process provided maximum
benefits for the data and thematic saturation.
Given the multiple case study design, I sought saturation for each case, rather than
a holistic saturation. I assumed that the holistic saturation of the multiple cases could be
accomplished when I reached individual saturations. This characteristic was necessary
from the qualitative interpretation perspective because I assumed that each case study
could exhibit a different business context and operational capabilities of the aluminum
131
production strategy. The context was an element of the production cost variance between
companies.
Table 3 is a summary of the original codes isolated at a particular stage in the data
collection process to produce saturation. Practically, I identified 94.5% of the principal
codes after six semistructured interviews and four primary documents analyses in each
case. At this stage, I gathered a total of 26 interviews and 16 reports. As most subsequent
documents revealed only fewer additional new codes, I decided to conduct additional
interviews. After eight subsequent interviews, two in each case study, I isolated less than
5.5% new codes.
Dependability and credibility are two criteria that influence the confidence of
qualitative data (Elo et al., 2014; Noble & Smith, 2015). The consistency of analytical
methods and the information quality can improve dependability (Malterud, Siersma, &
Guassora, 2016). Thematic saturation might improve dependability. The depth of the data
was of paramount importance to provide the information quality. The documents I
used—for instance, strategic and annual reports were the repository of vital details that
increased the information quality. The use of Atlas.ti facilitated the data analysis quality,
its repeatability, and reproducibility.
Reliability and Validity
Different authors have differing views on data validation regarding the validity
and reliability of the qualitative investigation. A divergence of views is evidence of the
variation in the authors’ epistemological perspectives (Yazan, 2015). Whereas the authors
holding positivistic or post-positivistic views recognize the need to produce validity and

132
reliability by capturing absolute knowledge (Yazan, 2015), constructivists maintain that
knowledge is interpreted between the researcher and participants through what is already
known (Merriam, 2014). The conceptualization of validity and reliability differs in the
qualitative and quantitative inquiries (Merriam, 2014). Guba and Lincoln (1994)
proposed four criteria that researchers should consider to increase reliability and validity
in qualitative research: dependability and confirmability (reliability), and credibility and
transferability (validity).
Reliability
One principle that a researcher needs to follow in informing and designing a
qualitative inquiry is reliability or dependability (Noble & Smith, 2015). Reliability is
synonymous with believability, consistency, and trustworthiness, all of which are core
components of this concept (Elo et al., 2014). Data dependability and findings
confirmability are two additional components of reliability (Guba & Lincoln, 1994;
Houghton et al., 2013).
Dependability. Guba and Lincoln (1994) claimed that dependability involves
findings that can be repeatable and reproducible. The procedure adopted to collect and
analyze data in this case study can be reproducible by other authors. First, I endeavored
to increase dependability by providing consistency in the analytical methods as
recommended by Elo et al. (2014) and Noble and Smith (2015). A researcher can
improve dependability by ensuring trustworthiness of the integrated process of data
collection and analysis (Malterud et al., 2016). Second, companies’ strategic and annual
reports were the repository of critical details that increased the information quality. In

133
addition, the use of CAQDAS (Atlas.ti) facilitated the data analysis consistency and
quality, allowing improving the repeatability and reproducibility of the procedures used
in this study. Next, I aimed to increase the coherence of the data-gathering and analysis
procedures by building trustworthy processes and transparency with the participants. I
followed a systematic and replicable approach, in that I used a case study protocol and
developed a database for further referral. The former allowed strengthening the
participants’ preparedness for a cognitive interview process. Finally, the position of
senior managers in the companies' hierarchy enhanced the quality of information
gathered and the answers to the interview questions. To promote integrity, I allowed the
participants to review the transcripts before writing the final report. The transcript review
was a factor in maintaining neutrality and trustworthiness as recommended by Guba and
Lincoln (1994) and Loh (2013).
Confirmability. Houghton et al. (2013) stated that confirmability is a qualitative
research criterion associated with the degree to which a different researcher can
authenticate the results and the methods of a study. To increase confirmability, I ensured
that themes emerging from this study were the views of the participants and the
documents review, not from my perceptions. According to Noble and Smith (2015) and
Tarrozzi (2013), a researcher may improve confirmability by maintaining a high level of
neutrality throughout the data collection and interpretation process. I endeavored to stay
close to the data throughout the data gathering and analysis process and to produce data
saturation. Similar to dependability, I aimed to increase the confirmability of the results
by documenting the procedures for the data collection process and the data analysis (see

134
Appendixes B). I submitted the findings to some selected senior managers for review and
authentication. Finally, I used two sources of data as an approach to seek information
convergence for promoting confirmability within a case study. In addition, I triangulated
subthemes from the four datasets of Companies A, B, C, and D to obtain core themes of
interest. According to Stake (1995), data triangulation allows reducing bias from both a
researcher's self-reporting and the interactions with participants because it allows
integrating data from different sources and using information convergence as a criterion
for validation. Follow-up questions were persuasive as they contributed to verify the
reliability and validity of what the senior managers said by comparing two different
responses to the same interview question. Finally, the follow-up questions supported my
exploration for exceptions that permitted disconfirmation or confirmation of data in the
interpretation stage. For instance, follow-up questions allowed the clarification that, yet
the energy recovery was not implemented on a large-industrial scale to provide
significant returns. In using the follow-up questions, I assumed that I could not capture
information, detailed at a granular level from a set of predefined questions. Instead, the
granular description might prevail in the follow-up questions. Finally, the follow-up
questions allowed differentiating contextual factors of costs and identifying additional
subthemes that were constituents of the central themes.
Validity
Addressing credibility and transferability relates to decreasing the variability of
the data interpretation (Harper & Cole, 2012). Credibility and transferability both
enhance research validity (Harper & Cole, 2012). Transcript review and member

135
checking are fundamental criteria and increase benefits for validity (Simpson & Quigley,
2016). Simpson and Quigley (2016) recommended that a researcher use the member
checking approach as a dialogical and flexible way to enhance the validity. The member
checking approach implies that a researcher should have interview findings authenticated
by the participants. In this study, I used SMs to review the results; I also used the
literature review as a means of corroboration to increase validity. The SMs used the
member checking approach to guaranteeing trust of the procedures and the results of the
study. As Quigley (2016) recommended, I used this procedure as a reflective step on the
findings by identifying inconsistencies and correcting errors while maximizing the
truthfulness of the conclusions.
Another strategy for increasing validity was to reach data saturation. I reached the
data saturation after eight interviews in each case study. Saturation was noticed when
information started repeating and when no new concepts occurred to enrich the themes
already isolated in the datasets or the aspects of the RQ. Saturation was sought at two
levels including interviews (data saturation) and member checking (thematic saturation).
These two approaches to data and thematic saturation were used concurrently to
maximize benefits from the synergy. In the first level of the data saturation process, I
continued to interviews participants until there was a point where the data from many
participants started repeating and providing no new insights. Notwithstanding, I assumed
that participants might provide only surface level information in the interview stage and,
adding the researcher self-reporting bias (Stake, 1995); I endeavored to solicit member
checking. In the second level, the thematic saturation was sought from the member

136
checking process: I reviewed, interpreted the data, and synthesized the findings, which
were sent to participants to corroborate and to add or remove information. I continued
this repeated and cross-verification process until there were no new concepts to answer
the RQ and subquestion.
Guba and Lincoln (1994) argued data saturation allows mitigating flawed
perceptions on the part of both the researcher and the participant. In addition, Perkins et
al. (2013) acknowledged the importance of keeping interviews short to maintain focus
and yield consistent cognitive outcomes. Each interview for the study lasted less than 50
minutes. Finally, Yin (2012) recommended additional strategies for data validation
including (a) using multiple sources of evidence converging on the same research
problem, (b) maintaining a database, and (c) creating a chain of evidence that provides
reciprocity between the RQ, the data, and the findings. I used two sources of data and
outlined the convergence of information between these sources.
Credibility. Yin (2012) maintained that a researcher must incorporate adequate
operational measures when analyzing the RQ. Similarly, Coker, Ploeg, Kaasalainen, and
Fisher (2013) argued that the credibility of qualitative findings relies on the
methodological stringency in data gathering and analysis. I aimed to increase the
credibility of this study by the use of strategic and annual reports that enhanced the data
quality. Guba and Lincoln (1994) and Munn et al. (2014) recommended that findings of
research must be reflective of participants’ views. Coker et al. (2013) identified the
primary criterion for credibility as the accuracy of results from the viewpoint of the
participants. In this study, central themes of interest reflected the participants’ views and

137
the context of the study rather than my perspective. Similarly, Coker et al. (2013) argued
that researchers must follow logical relationships between the conclusions and data when
analyzing them. I selected and grouped codes into categories to yield subthemes.
Furthermore, I associated the subthemes through built-in relationships provided in
Atlas.ti. This step was termed axial coding. The type of relationships I used to link the
subthemes included “is associated with, is part of, and is a cause of.” Core themes
emerged by grouping subthemes. Credibility is also enhanced when the data
interpretation reflects the source of information (Munn, Porritt, Lockwood, Aromataris,
& Pearson, 2014). In this study, I used three types of coding: in-vivo, free, and
provisional coding. Whereas provisional codes derived from the conceptual framework
and the RQ, in-vivo codes were concepts embedded in the text analyzed, and free or
emergent codes were those concepts and (intervening and causal) conditions that come up
in reading the material. As it can be noticed in the statement thereof, I used a hybrid
strategy to coding. Whereas emergent and in-vivo codes were inductive items,
provisional codes were a priori items. The conjunction of these two data coding strategies
shows that findings reflected the source of data. Given the potential for literal
generalizability, using a hybrid-coding logic compared to a deductive logic was critical to
minimize preconceived themes and bias.
The second approach I used in this study was exploring competing explanations
through follow-up questions. Follow-up questions were crucial as they permitted to
investigate the responses in detail and to enhance the understanding of what participants
attempted to say in the initial statements. The follow-up questions also allowed to

138
corroborate or contradict the reliability and validity of what the senior managers said by
comparing two different responses to the same interview question.
As recommended by Guba and Lincoln (1994), I implemented the transcript
review procedure. This procedure assured that the findings were grounded in the
participants’ views and the context of study (Cope, 2014; Guba & Lincoln, 1994; Harper
& Cole, 2012; Huberman & Miles, 1994) of the four companies, which could increase the
credibility of findings.
I selected participants based on their position, knowledge, and functions in the
aluminum production sector. The experience and knowledge of senior managers enriched
the data gathered and increased the information quality. Guba and Lincoln (1994) also
supported that the quality of participants is essential to improve data quality, which might
allow mitigating flawed opinions. The senior managers had at least 10 years of
experience in the field of aluminum production and were knowledgeable about the
aluminum production strategies. I selected 10 years of experience because the market
prices of primary aluminum have shown constant volatility in the last decade (World
Bank, 2013), so it was appropriate to gather information from senior managers who faced
these variations firsthand. Finally, I employed data convergence between semistructured
interviews and document review to ensure that neither biased answers nor false
information compromised the content. The triangulation of the four datasets supported
the credibility of the results. The proactive strategies mentioned thereof enhanced the
credibility.
Transferability. Transferability is the extent to which researchers or practitioners

139
can use the results of a qualitative analysis in another context (Yin, 2013). Transferability
also refers to assigning to another study the methodology a researcher might have
implemented throughout a research process (Yin, 2013). Yin (2012) maintained that
despite the uniqueness of each case study, qualitative comparative case studies should
yield analytic generalizability (Yin, 2012). I increased the likelihood of transferability by
using appropriate procedures that might be repeatable. For instance, I provided a detailed
description of the connections between the findings and the business contexts.
Data triangulation can enhance the transferability of results (Farahani,
Mohammadi, Ahmadi, & Mohammadi, 2013). Researchers use data triangulation to
corroborate the same conclusions between different sources (Yin, 2013). I drew data from
interviews and documentary analysis. I produced a detailed description of the production
strategies that companies used to reduce production costs in the aluminum field and
guaranteed that the description was representative of the contexts and the two data
sources. The diversity of the business settings of the four aluminum companies,
associated with the triangulation approach strengthened the transferability of the findings
in a similar context.
In their seminal work on qualitative data analysis, Huberman and Miles (1994)
recognized the need to select a representative sample of cases in a qualitative,
comparative case design. These authors argued that a researcher should plan the selection
of the sample to create both stronger inductive reasoning and enhance the ability to
transfer conclusions. The selection of the four companies under study was purposive,
adapted to increase the transferability potential, and to identify production practices that

140
may lead to reducing production costs. Yin (2012) stressed that researchers could
enhance transferability by addressing rival explanations. In this study, I have discussed
the primary production costs drivers and outlined possible differences and similarities
between companies. I also provided a detailed description of the business context and
highlighted what was unique in every business context. This research also provided a
foundational frame and knowledge regarding the improvements that may be made by
other aluminum producers.
Transition and Summary
In this study, I aimed to understand the context of aluminum production and
identify strategies aluminum producers use to reduce production costs. To achieve this
goal, I gathered data from two sources and used the approach of interpretivism to analyze
data. I applied interpretive procedures in the data triangulation to identify similarities and
differences between the sources of data. In gathering data, I focused on intervening
concepts and causal conditions that might influence production cost in the primary
aluminum production sector. Social constructivism, mixed with interpretivism influenced
my worldview and the methodology I used for data gathering and analysis in this study. I
endeavored to capture knowledge by integrating knowledge from aluminum production
SMs and the process by which they convert knowledge into strategies to reduce costs. In
addition, I aimed to guarantee the integrity, the replicability, and the objectivity of the
findings of this project by bracketing my perceptions to produce a high-quality research
project. The use of CAQDAS promoted consistency and the reliability of the data
analysis.

141
I aimed to construct knowledge within the companies' business context; in this
regard, the goal was to understand what was context-specific, unique, or common from
the perspective of aluminum producers based on a purposeful sample of four aluminum-
production companies. The coherence and consistency of the procedures used in this
study were bolstered by promoting trustworthiness through the researcher’s interactions
with aluminum producers. The quality of interactions allowed both the researcher and the
senior managers to understand particular causal conditions of high production costs
through analysis and interpretation.
I constructed central themes by using Huberman and Miles' (1994) data
organizing and analysis strategies. During the data gathering, I focused on a particular
context while socializing with aluminum production managers and maintaining a logical
point of view, consistency, and integrity. This approach presupposed that I developed a
precise understanding of the production processes used in aluminum production as well
as the concepts underlying constructivism and interpretivism.
I assured the quality and rigor of this study by applying appropriate research tools
and analytical techniques that helped deliver consistent and ethical research. In the next
section, I provided an overview of the study and the research findings. I also discussed
the application of the research results to professional practices and the implications for
social change, along with the research limitations and recommendations for further
studies.

142
Section 3: Application to Professional Practice and Implications for Change
Introduction
The purpose of this qualitative, multiple comparative case study was to explore
the strategies some aluminum producers might implement to reduce production costs.
The targeted population covered aluminum production senior managers in Western
Europe. The European Commission (2013, 2014) indicated the importance of analyzing
aluminum production costs in Western Europe in the context of slumping aluminum
prices and limited technological, material, and energy capabilities. A purposeful sample
of four companies was studied to compare production strategies: two companies that are
achieving sustained production costs and two that are not.
The economic theory of production and production costs (Cobb & Douglass,
1989) provided the conceptual framework for the research. The qualitative methodology,
based on constructivism and interpretivism (Merriam, 2014; Huberman & Miles, 1994),
facilitated the data collection and analysis. A purposeful sample was made of 32 senior
production managers who were interviewed using semistructured interviews. In addition,
I collected strategic, annual, and industry reports to provide information quality. Data
analysis in Atlas.ti resulted in six core themes representing intervening concepts for
reducing production costs and causal conditions for high costs. I found the following
concepts: (a) energy management and efficiency, (b) upstream integration, (c) operational
excellence and productivity, (d) carbon-anode manufacturing capability, (e) technological
capabilities, and (f) circular economy. These concepts were strategies for reducing
production costs. Increased production efficiency has implications for positive social

143
change, including lowering energy and material consumption and reducing emissions and
waste.
Presentation of the Findings
The overarching RQ for this study was the following: What strategies might
aluminum managers implement to reduce production costs. The following serves as a
subquestion: How can a manager develop core capabilities in production units to lower
production costs?
I used the Atlas.ti software to discover and analyze concepts from the
unstructured data comprising interviews and companies' reports. The software allowed
me to organize data, locate critical segments of text, and code information. It also assisted
me in analyzing, filtering, and querying the most relevant information from the material.
Figure 15 outlines some of the artifacts of the data analysis in Atlas.ti. I uploaded 53
documents into the hermeneutic unit, of which 49 were coded (32 interviews, 16 reports,
and one report describing the theory of aluminum electrolysis). I organized these
materials into five primary families (Companies A, B, C, D, and aluminum electrolysis
theory) according to their source. The code manager and memo outputs yielded 514
codes and 99 memos, grouped into 18 and 12 families, respectively (see Figure 15). I
paired the companies (e.g., A and B, and C and D) based on the characteristics outlined in
the sampling strategy. I matched the samples to reduce within-case variability to derive
compound themes that were best defined and straightforward to compare. I analyzed and
triangulated interviews and documents independently. I operationalized the data
triangulation through grouping similar codes under one category while considering

144
interviews and documents separately. As outlined in Figures 10–13, I applied the
triangulation approach separately to each company’s dataset. The convergence strategy
was implemented using two distinctive components: the qualitative and quantitative
similarities of themes. I compared both the content (e.g., types of themes) and the
frequency of the core themes of the two data sets (see Figures 10–13). There was
alignment between the themes isolated from the documents on the one hand and the
interviews on the other. When codes occurred again, I reviewed and compared them with
existing codes to assess the information convergence. Cases were analyzed separately and
were compared further to derive sub-themes. Data triangulation was the preferred
approach to merging and seeking convergence from the four datasets, which were
interviews and documents from Companies A, B, C, and D.
Figure 15. Hierarchical display of objects in Atlas.ti.
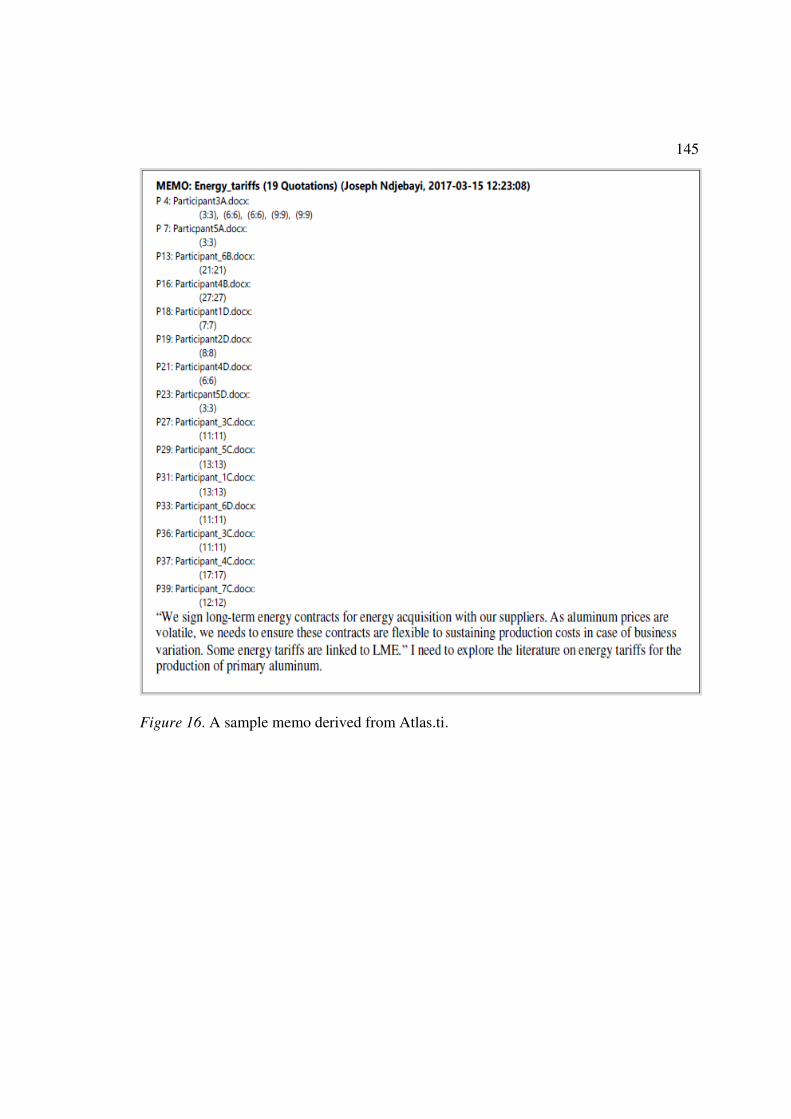
145
Figure 16. A sample memo derived from Atlas.ti.

146
Next, in Figure 17, is an excerpt of the codes’ taxonomy and relationships as I
arranged and regrouped them into families based on their meaning. It was possible to
export the codes’ family as well the thematic frequencies to a spreadsheet by using the
Atlas.ti query tool.
Figure 17. A sample of the Atlas.ti Query Tool.

147
All codes and themes were given equal attention during the analytic and coding
processes. I organized the codes into families to yield clusters. I compared any new code
to the groups and assigned a prefix based on its meaning. I established relationships
between codes (e.g., is part of, is associated with, is a cause of). Then, a two-dimensional
matrix was formed, comprising intervening concepts and causal conditions in the rows
and cost factors in the columns. All themes isolated were mapped in the matrix of
concepts that unfolded (see Table 3). This method was termed “constant comparison.”
When no subsequent documents qualitatively provided new developments, intervening
concepts, causal conditions, or categories to answer to the RQ, I considered that data
saturation was reached. Graphically, I noticed the saturation when the number of new
codes isolated was close to zero. Before this point, most data in the matrix were
repeatedly similar. In addition, thematic saturation was sought through member checking.
I reviewed, interpreted the data, and synthesized the findings, which were repeatedly sent
to participants to corroborate or to add information. I continued this repeated and cross-
verification process until there were no new insights to answer the RQ and subquestion.
Categories identified were saturated, and the participants' descriptions of themes were
thick and rich because most documents gathered were similar with negligible variability.
Thick refers to quantity, and rich refers to quality (Fusch & Ness, 2015).
I achieved rigor and validity through transcript review, data triangulation,
convergence validation, and data and thematic saturation. Initially, each data source
yielded basic themes, which evolved into primary themes upon triangulation. This step
was important because it allowed me to establish information convergence (see Figure

148
17). Next, I compared the primary themes among cases and within paired samples,
providing the second level of topics organization. Each organizing theme derived from
the hierarchical distinction of the central themes. I created the structural hierarchy of
themes by selecting and dropping codes from the flat list into subcategories, and by
assigning transitive relationships between items. This process resulted in 35 thematic
networks or organizing themes, each linked to the other. I named this step the “semantic
linkage.”
The second level of concept triangulation occurred between paired data sets to
yield core or overarching concepts. Six core concepts emerged from the data
triangulation across cases: (a) energy management and efficiency, (b) upstream
integration, (c) operational excellence and productivity, (d) carbon-anode manufacturing
capability, (e) technological capabilities, and (f) circular economy.
Most of these themes were prevailing, expected from the study’s conceptual
framework. The circular economy and material characteristics and prices efficiency were
serendipitous concepts that were missing from the literature. Production managers might
use these concepts as intervening strategies to lower costs. Some themes might also be
considered as causal conditions that could increase costs depending on how they are used.
Next, I provide the cases description and data analysis. For the sake of simplification, I
used the following symbols in the text to symbolize participants and documents from
Company A: P1A, 2A…, and D1A, D2A respectively. Similarly, participants and
documents from Companies B, C, and D will be represented by the symbols P1B, 2B,…,
P1C, 2C,..., P1D, 2D,…, and D1B, D2C,…, D4D respectively.
149
Case Analysis Company A
Case Description
Company A was a smelter in Western Europe specializing in the production of
primary aluminum. It was one of the biggest producers of aluminum in Europe. It
produced aluminum slabs and extrusion billets. The company’s vision was to enhance
productivity and minimize environmental impacts. The ultimate goal was to be one of the
most successful primary aluminum producers in the world. The production plant was
commissioned in the late 20th century for a production capacity of 220,000 tons per year,
equivalent to an electrical current input of 300 KA. Today, the smelter had a capacity of
275,000 tons of aluminum per year—approximately 120% of its initial capacity. This
exceptional shift in plant capacity was made possible by technological capabilities and
energy availability, according to one participant interviewed. The total cost savings
delivered in 2014 was USD 150 million posttax, according to documents reviewed. The
company achieved the savings through productivity improvements, cost reductions, and
the divestiture of high-cost assets, according to documents reviewed.
Table 5 outlines the overall codes prevalence from the two datasets (interviews
and documents review) after data triangulation. Tables 6 and 7 show the frequency of
codes for the core themes derived from interviews and the documents analyzed in
Company A. Each core concept emerged from the subthemes that I obtained by clustering
data based on their similarity with existing information in the matrix of codes that was
developing.

150
Table 5
Overview of Core Concepts, Company A
Energy Management & Efficiency
Raw Material Vertical Integration
Product- ivity & Plant Utilization
Purchasing Strategy
Insourcing Strategy
Strategic Partners
Material Consumption Efficiency
Technology Design
Totals:
Participant1A.docx 3 4 2 1 0 0 2 2 14
Participant2A.docx 2 3 3 3 1 1 2 3 18
Participant3A.docx 3 3 1 2 1 1 0 2 13
Participant4A.docx 7 6 0 0 0 1 1 1 16
Participant5A.docx 3 2 1 1 1 0 2 3 13
Participant6A.docx 1 4 1 2 0 0 0 4 12
Particpant7A.docx 2 4 2 3 1 0 1 0 13
Participant8A.docx 0 0 2 1 1 0 0 1 5
Document1A.pdf 7 0 0 0 0 0 0 1 8
Document2A.docx 1 2 1 0 0 0 2 2 8
Document3A.docx 1 3 3 0 1 0 4 2 14
Document4A.docx 2 2 1 0 1 1 0 1 8
Code Occurrence 29 29 15 12 7 4 12 20 128
Code Frequency 23% 23% 12% 9% 5% 3% 9% 16%
Frequency of
Participants
88% 88% 88% 88% 63% 38% 63% 63%
Frequency of Documents
100% 75% 75% 0% 50% 25% 50% 50%
I organized data interpretation in two steps: first, I presented a concise description
of the primary themes distinctly from each dataset. Next, I provided a complete
description of the participants’ views as well as the outcome of the documents review.
Step 2 was the integration of the two datasets; the integration was a comprehensive
synthesis of the composite views of participants and the output of the documents review.
The integration also involved identifying convergence or divergence of the composite
views.

151
Table 6
Codes Frequency Based on Participants’ Views
Partici pant 1A.docx
Partici pant 2A.docx
Partici pant 3A.docx
Partici pant 4A.docx
Partici pant 5A.docx
Partici pant 6A.docx
Partici pant 7A.docx
Partici pant 8A.docx
Code Occurrence
Frequency of Codes
RQ1_Energy_ Management& Efficiency
3 2 3 7 3 1 2 0 21 20.2%
RQ1_Raw Material :Vertical Integration
4 3 3 6 2 4 4 0 26 25.0%
RQ1_Productivity_Plant_Utilization
2 3 1 0 1 1 2 2 12 11.5%
RQ1_Purchasing Strategies
1 3 2 0 1 2 3 1 13 12.5%
RQ1_Sourcing 0 1 1 0 1 0 1 1 5 4.8%
RQ1_Strategic Partners
0 1 1 1 0 0 0 0 3 2.9%
Material Consumption Efficiency
2 2 0 1 2 0 1 0 8 7.7%
RQ2_Capabilities (Technology, Design)
2 3 2 1 3 4 0 1 16 15.4%
TOTALS: 14 18 13 16 13 12 13 5 104 100.0%

152
Table 7
Codes Frequency Based on the Documents Reviewed
Document1A.pdf
Document2A.docx
Document3A.docx
Document4A.docx
Code Occurrence
Frequency of Codes
RQ1_Energy_Efficiency 7 1 1 2 11 29%
RQ1_Raw_Material: Vertical Integration
0 2 3 2 7 18%
RQ1_Productivity_ Plant Utilization
0 1 3 1 5 13%
RQ1_Purchasing_ Strategies
0 0 0 0 0 0%
RQ1_Sourcing 0 0 1 1 2 5%
RQ1_Strategic_Partners 0 0 0 1 1 3%
RQ1_Material Consumption Efficiency
0 2 4 0 6 16%
RQ2_Capabilities (Technology, Design)
1 2 2 1 6 16%
TOTALS: 8 8 14 8 38 100%
Core Theme 1: Energy Management and Efficiency
Energy management and consumption efficiency stemmed from four subthemes:
the energy type used, energy processing efficiency, prices efficiency, and energy
management options (see Figure 18). Energy management involved the set of strategies
that production managers used to optimize energy consumption intensity while
maximizing profits. The energy management approach involved appropriate procedures
that consisted of reducing the energy requirements per unit of material processed while
maintaining other inputs and output of the production constants.
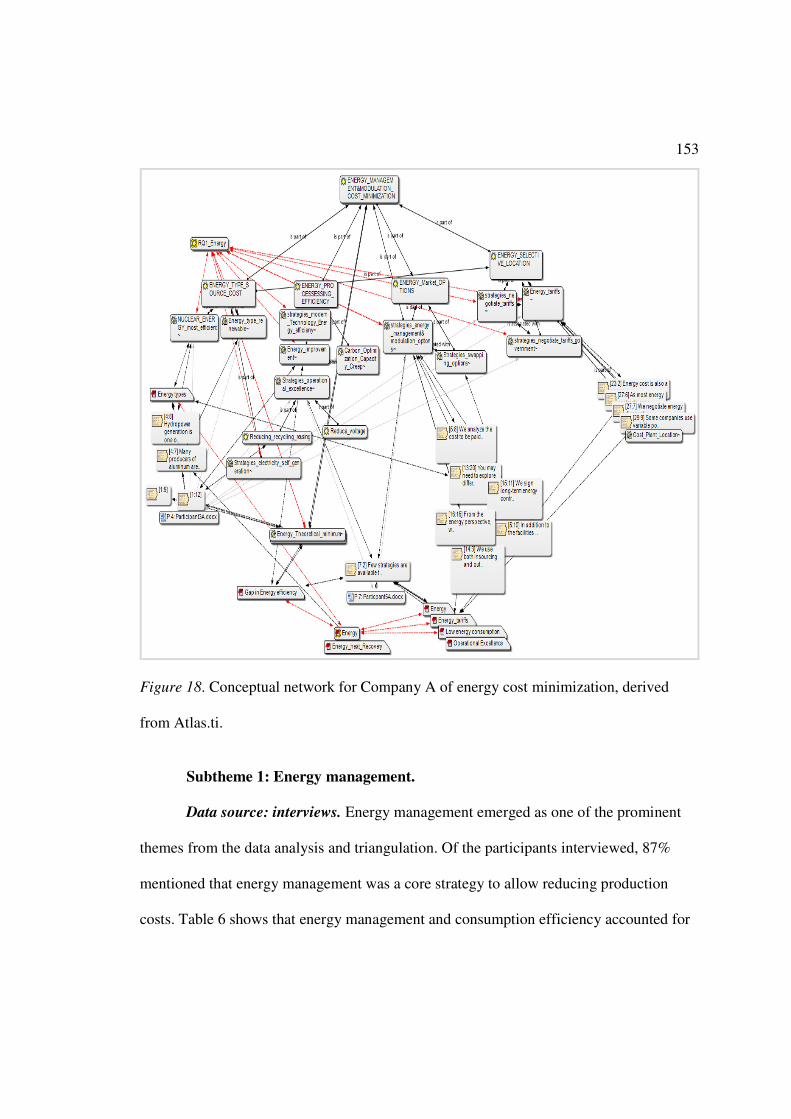
153
Figure 18. Conceptual network for Company A of energy cost minimization, derived
from Atlas.ti.
Subtheme 1: Energy management.
Data source: interviews. Energy management emerged as one of the prominent
themes from the data analysis and triangulation. Of the participants interviewed, 87%
mentioned that energy management was a core strategy to allow reducing production
costs. Table 6 shows that energy management and consumption efficiency accounted for
154
20% of the codes frequency. The table also indicates that 7 out of 8 participants identified
this concept as an important strategy to reduce production costs. Most senior managers
except one shared the view that energy was the most important cost factor. Whereas
participant 8A did not mention energy as a driving factor to reduce production cost,
Participant 3A highlighted this concept seven times during the interview. According to
senior manager 3A, energy prices will only go increasingly given environmental
restrictions and increasing energy demands. Energy management systems are often used
by aluminum companies to control their energy cost by importing or exporting energy
based on the seasonality of energy market prices (P1A & P2A, March 2017). Participant
1A further concluded that the flexibility of contractual agreements is an enabler to
leverage market options of energy prices. Flexibility involves incorporating the potential
changes or modifications to the contract, making sure that both contractual parties exceed
their expectations.
Data source: document review. Table 7 indicates that energy management and
efficiency accounted for 29% of the codes isolated. Of the documents analyzed, 100%
introduced the energy management and consumption efficiency (see Table 7) as a core
concept to reduce cost. Document D1A highlighted this concept seven times, indicating
its central role in the company’s portfolio of strategy to reduce production costs. As
shown in Figure 18, the energy management and efficiency emerged from a cluster of
four subthemes including energy contracts, processing efficiency, power source, and
market options. Energy processing efficiency derived from technological and operational
capabilities to lower electrolytic cell voltage while maintaining or improving the

155
productivity. Figure 18 shows the conceptual network of energy cost minimization.
Efficiency also derived from the use of low-cost assets.
Subthemes 2: Energy type and price efficiency.
Data source: interviews. Participants agreed that energy costs depend on the
source of energy available at the national level and the type of contract. One SM stated
that Company A uses nuclear power, one of the cheapest energy sources available; the
company uses a long-term fixed-energy contract (P1A & 3A, March 2017). The cost of
nuclear power per MWh was around USD 28, half the price of coal. This price was
competitive at the EU level, according to participants 2A and 6A. Participants 1A and 8A
argued that the energy costs account for 28% of the company’s production costs. In
addition, because of its nuclear base, this energy has no carbon effect (P1A & 4A, March
2017), thus providing an extra charge advantage.
Subtheme 3: Energy-processing efficiency.
Data source: interviews. This important theme was introduced in most documents
as outlined in Table 6 and Figure 18. The company generated cash from the smelting
business and by utilizing energy modulation as a strategy to increase revenues. In
addition, the technology used in electrolytic reduction provided one of the lowest energy
and carbon footprints in the aluminum industry, according to participants P6A and P8A.
Most aluminum producers viewed this technology as a global benchmark regarding
production costs, energy consumption, and environmental performance, according to
participants (P2A & P3A, March 2017). The energy efficiency of the material processing
was 60%, or 12.7 MWh/ton of aluminum output, which was 15% above the average

156
performance in the industry. Although the energy cost was competitive, the company
could still lower it further. For instance, Lucio et al. (2013) found that energy self-
generation in the primary aluminum business is competitive. Self-generation provides
security to the electricity supply.
The company was 15% more efficient than other businesses were in the same
industry; but when compared to technical requirements or the thermodynamic
calculation, the company was still incurring some additional opportunity cost. Gutowski
et al. (2013) found that high-energy efficiency could be achieved by implementing low-
cost capacity machines or by replacing high-cost technologies. The costs of inefficiency
compared to the benchmark (12.5 MWh/ton Al) were only USD 5/ton of aluminum
production, annualized to USD 12.6 million production costs. Compared to the
theoretical consumption, the company incurred extra expenses of USD 84/ton Al. It has
invested USD100 million in the last two years in energy saving and efficiency
improvements in the production units (D2A & D4A, March 2017). The chart below
outlines the current energy used versus the technical requirement for the production of
primary aluminum.

157
Figure 19. Energy consumption efficiency, Company A exhibited.
Data integration. Energy management, which consisted of importing or
exporting a portion of a company’s energy quota in the power grid, might allow an
aluminum company to optimize operational expenses or increase revenues. An increased
revenue allows reducing fixed costs per unit output. Energy contract should be agreed to
achieving both the cost efficiency and the flexibility of options, based on the market
prices to create value. According to Gaudard and Romerio (2014), two demand curves for
the energy management in Western Europe are available: one for peak and the other for
off-peak periods. Given this periodic availability (Gils, 2014), aluminum producers can
import or export energy to create additional value and gain opportunity costs. The two
datasets provided alignment of views regarding the central role that the energy
management and efficiency play in the aluminum production cost.

158
Core Concept 2: Upstream Integration and Geographical Location
Data source: interviews. Raw material vertical integration accounted for 25% of
the codes frequency. Similarly, Table 6 indicates that 7 out of 8 participants (87%) shared
the views that raw material integration allowed the company to reduce cost and improve
efficiency. Raw material integration emerged by grouping all subthemes including price
efficiency, alumina supply risk minimization, and price volatility. Porter (1980) and
Miltenberg (2005) also recognized the benefits of vertical integration on a company
operating costs as it could allow decreasing prices and transportation expenses and
reducing turnaround time. Vertical integration can occur in two directions: forward
integration and backward integration. In the case of interest, the company has integrated
the raw material in its production process according to one participant interviewed.
Data source: documents review. Table 7 outlines the code frequency based on
the reports reviewed. Data indicate that 18% of the total codes isolated and 75% of
reports highlighted the raw material integration as a valuable strategy to reduce costs.
This theme emerged from the clustering of all subthemes including price efficiency,
alumina-supply risk minimization, and price volatility. The majority of documents
reported the use of this strategy given the alumina prices volatility and the need for
securing alumina supplies in the long term (Documents D2, 3, & 4, March 2017).
Data integration. Data integration from interviews and the documents reviewed
indicated that seven participants out of eight (87%) and 75% of reports suggested that the
vertical integration of alumina supply is a strategy to reduce production costs. Two main
subthemes related the backward integration concept (see Figure 20) to production costs:

159
(a) the need for alumina supply security and (b) the need to enhance material supply
planning according to (P1A, 3A, & 4A; D2A, & 4A, March 2017). Ramanathan (2014)
also found that supply chain performance could be improved when a company
replenishes materials, coordinates planning, and forecasts supplies optimally.
Figure 20. The conceptual network for Company A of alumina cost minimization,
derived from Atlas.ti.

160
Company A was a component of a corporate business that had access to the
industry’s largest bauxite reserves. The company had integrated midstream and alumina
activities. This competitive advantage made it one of the world’s leading bauxite
producers (D2A & 4A. March 2017); therefore, the company might not incur additional
costs associated with alumina price uncertainty. Trench, Sykes, and Robinson (2015) also
found that alumina demand is expected to increase based on China’s ongoing alumina
needs. Furthermore, Trench, Sykes, and Robinson found that a high demand in the
market of alumina could foster prices to increase 15–20% by 2020. In this alumina
demand-rich context, it makes sense to plan investments for integrating the raw material.
The company shipped the raw material to its production plant by sea. The plant’s
production facilities are integrated with the port terminals. This strategic location allowed
minimizing transportation costs for the raw material supplies compared to its competitors,
according to documents reviewed (D4A, March 2017). Shipping costs for raw materials
between the maritime port terminal and the production plant were negligible because the
company handled the raw material by a dense-phase pneumatic conveying system, an
efficient method for bulk material handling (D4A, March 2017). The port’s availability
and proximity to its customers allowed viable transportation costs.
Core Concept 3: Productivity and Plant utilization
Data source: interviews. Table 6 indicates that 87% of participants considered
productivity and plant utilization as a core theme for reducing production cost. This
theme accounted for 11.5 % of the codes frequency. The concepts derived from

161
numerous subthemes (see Figure 21) including (a) technological design and capability,
(b) operational excellence, (c) asset utilization, and (d) skilled labor. Most participants
conveyed operational productivity as the baseline for improving the overall company’s
performance. One senior manager (2A) stated that Company A increased productivity by
increasing the capacity of all critical resources. Operational productivity is about
maximizing the reliability of operations and processes to maximize uptime and life
cycles, and improve quality while minimizing production cost. Improvement efforts were
prioritized to sustaining initiatives and aligning to the leadership vision according to
participants (2A &5A, March 2017).
Data source: documents review. Table 6 shows that 13% of the code prevalence
was related to productivity and asset utilization. The table also indicates that 75% of the
documents reviewed reported the productivity and high plant utilization as strategies to
minimize the fixed cost per unit output. The company focused on low-cost assets and
divested most of its high-cost assets. Of the four documents analyzed, one did not
highlight the use of productivity as a means to streamline operations. The focus of this
report was to highlight significant successes relative to green initiatives. Document 4D
emphasized that operational productivity and excellence allow minimizing the resources
used.
Data integration. Operational productivity was the most commonly used concept
that participants highlighted as influencing the production costs. The concepts derived
from numerous subthemes (see Figure 21) including (a) technological design and
capability, (b) operational excellence, (c) asset utilization, and (d) skilled labor. Seven

162
participants (87%) and three documents (75%) highlighted sustainable operations and
productivity as intervening concepts to reduce production costs. The company applied
operational excellence by ensuring quality at the bottom line, minimizing waste,
embracing scientific thinking, and focusing on the processes performance (P3A, 4A, &
7A; D2A & 4A, March 2017).
Operational productivity is about maximizing the reliability of operations and
processes to increase uptime, life cycles, and quality while minimizing production cost.
Improvement efforts were prioritized to sustain initiatives and align operational
capabilities to the leadership vision according to participants (2A &5A, March 2017).
One senior manager stated that there is no one path to production cost minimization and
sustainable value creation, each subdepartment tailors its operational capabilities by
focusing on the primary cost drivers in the value chain. The company developed a robust
problem-solving ability through state-of-the-art knowledge and deep functional expertise.
It also realized and captured synergies between functional areas.

163
Figure 21. The conceptual network for Company A of operational excellence and
productivity to reduce costs, derived from Atlas.ti.
Subthemes 3.1 and 3.3: Technological design, capability, and asset
utilization. Technical capability supported high-production capacity creep (asset
utilization) and economies of scales, according to a participant interviewed. Porter (1980)
and Miltenberg (2005) also highlighted the impacts of economies of scales in fixed costs.
An increased capacity (keeping production factors constant) allowed increasing
productivity and reducing fixed costs per unit output (P5A, 6A, & 7A, March 2017). For
instance, if a manager makes resources idle, assets would be underutilized, the production
facilities might generate high per-unit cost, and profit potential could reduce. Conversely,
high capacity utilization of assets may result in lower per-unit costs and increased profit

164
potential. Asset or capacity utilization, which is the ratio of current outputs to possible
outputs, provides insight into the overall slack that a firm may use to increase its
productivity while reducing fixed cost per unit production. Capacity utilization
contributes to a company’s technical efficiency (Farrell, 1975).
The production plant was in the lowest half of the industry cost curve because of
its technological capability and its competitive access to mines, according to documents
reviewed. The documents reviewed also showed that the company focused relentlessly on
cash generation by divesting high-cost assets. The technological capability supported
low-capital and high-return creep (D4A, March 2017).
Subtheme 3.2. Operational Excellence. The views of participants and the
documents reviewed were concordant about operational excellence (OE) being a decisive
step for strengthening cost efficiency in production units. OE focuses on total quality
management philosophy, according to a participant interviewed. Participants also
maintained that OE allowed addressing quality and safety issues, protecting the
environment, optimizing processes, and minimizing the resources used. The company
focused on various self-assessment activities to identify gaps in production and used
scientific tools to improve production performance by leveraging technological capability
and problem-solving abilities (P3A & 8A, March 2017).
The company also generated value by sharing best practices and supply chain
benefits across production plants. It demonstrated a strong commitment to excellence in
health, safety, and environmental performance, according to the documents reviewed, and
it had a clear, focused strategy for each production unit. There were 559 permanent

165
workers and a temporary workforce of 15%. The annual production capacity was 275,000
tons (P8A, March 2017).
Core Concept 4: Raw Material Consumption and Efficiency
Data source: interviews. The code prevalence for the raw material consumption
and efficiency was 7.7% according to Table 6. In addition, of participants, 68% identified
material use efficiency as a factor to reduce production cost. According to P1A, 2A, 4A,
and 5A, the raw material consumption efficiency allowed reducing greenhouse gases, and
the energy required to process aluminum oxide. The raw material consumption efficiency
resulted from clustering all the codes relative to carbon and alumina cost minimization.
Some codes composing these two subthemes included prices efficiency, circular
economy, reduced environmental impacts, and reduced waste. One senior manager
mentioned the savings that can be gained from recycling, recovering, and reusing solid
waste. According to this view, recycling is a source of raw materials potential in the
future.
Data source: documents review. Of the reports analyzed, 50% highlighted the
material consumption intensity as an influential factor in production costs. The code
prevalence for this theme was 16%, about twice as higher than what participants said.
Document 3A showed the influence of the material consumption efficiency on
environmental protection and cost, as well as the preservation of natural resources. In
paper 2A, the company identified opportunity costs by recovering, segregating, and
recycling some waste within the internal business process. Material consumption

166
efficiency also created opportunities for greener growth, which reduced taxes paid to the
community.
Data integration. Carbon and alumina were the two persuasive raw materials
used in the aluminum electrolytic process. Two prevailing subthemes emerged under
carbon and alumina consumption efficiency: price efficiency and material use efficiency
(see Figure 22). Most perspectives developed in the documents reviewed converged on
the idea that the use of the materials extracted from natural resources has significant
environmental, economic, and social consequences in the community and ecosystem
(P1A, 2A, D2A, & 3A, March 2017). These social impacts often go in tandem with
environmental costs that companies must pay to sovereign governments. Materials
consumption efficiency was identified as a determinant of productivity improvement.
Figure 22. The conceptual network for Company A of material efficiency to lower costs,
derived from Atlas.ti.

167
Subtheme 4.1: Carbon consumption efficiency. The carbon consumption rate in
an electrolytic cell was 405 kg of carbon/ton of aluminum, according to a participant
interviewed. The theoretical minimum, based on stoichiometric factors, is 333 kg C/ton
Al. The observed efficiency was only 68%, indicating a gap in the material consumption.
Given the carbon costs described in Table 4, 32% of the carbon-processing inefficiency
was equivalent to USD72/Al. This amount may sound inconsequential, but based on the
annual production capacity of 0.275 million Al, the cost avoidance could generate USD
19.8 million per year. In practice, the real carbon consumption is higher than the
technical requirement because carbon anodes are exposed to ambient air, and observed
current efficiency is lower than 100%. Nevertheless, the carbon inefficiency was
attributed to technological and operational capabilities, according to a participant
interviewed. Most senior managers and documents reviewed agreed that progress in
material consumption efficiency should derive from technological change, operational
efficiency, and the substitution of resources-intensive materials by efficient ones (e.g.,
inert carbon and cathode).

168
Figure 23. Carbon Consumption efficiency for Company A exhibited.
Subtheme 4-1. Alumina consumption efficiency. The ratio of the theoretical
alumina consumption to aluminum output is 1.89:1—that is, 1.89 kg of alumina is
required for every ton aluminum production according to stoichiometric factors.
Company A used a proportion of 1.91, according to participants interviewed. Observed
material inefficiency was 0.02 kg of alumina per kg Al. Participants also described how
this waste reflected the losses as well as the low current efficiency of electrolytic cells (P
2A, 7A, &8A, March 2017), which was equivalent to USD7/ton of aluminum. This
amount of waste may seem insignificant; however, based on the annual production
capacity of 0.275 million tons, the cost savings could generate USD2 million per year.
Alumina was lost in aluminum processing through volatilization because of its
fine particles size and a high attrition rate during trans-loading, transportation, and
handling. The volatilization of this valuable material throughout the conveying and
electrolytic processes necessitated tight controls and procedures to limit losses (D4A,

169
March 2017). The company designed and built low-maintenance, environmentally
friendly systems for optimal material transportation and handling requirements, from
ships to in-plant systems incorporating conveying and pressure-vessel capability,
according to documents observed. The system was designed to minimize alumina
attrition by using very low-conveying velocities. The segregation of fine and coarse
particles also affected the material efficiency and environmental emissions according to
one SM interviewed. The documents reviewed also showed that anti-segregation
technology for alumina storage was outfitted to maintaining uniform grain-size
distribution, as materials were unloaded and conveyed. Reduced attrition and increased
homogeneity enhanced the raw material quality, resulting in reduced anode effects and
greenhouse gas emissions as well as energy use.
Core Concept 5: Technology and R&D Capabilities
Data source: Interviews. Of participants, 63% interviewed identified
technological capabilities and R&D as a core factor to minimize resources consumption
and to yield efficient production processes. The code prevalence for this core theme was
15.6%, the third most influential intervening concepts to reduce cost, according to the
senior managers interviewed. One senior manager stated that the company developed a
technology roadmap; this roadmap outlined a strategic plan, designed to focus on
technological sustainability, energy minimization, and electrolytic cell lifespan
improvement. Some senior managers identified the cell lifespan as a significant source of
capital expenses. The lifespan increased through improving the carbon-cathode material
use efficiency, which is only 40-45%. The company pursued its technological

170
development through an organized agenda focusing on processing efficiency and
engineered-material solutions.
Data source: documents review. Of the documents reviewed, 50% described
technological capabilities and R&D as the primary factors in reducing production costs.
In addition, the code prevalence for this theme was 16%. Most reports highlighted the
importance of technical capabilities to increase energy efficiency, plant utilization, and
reduce carbon dioxide emissions. These concepts are components of production costs in
the aluminum production process. Document 2A and 3A indicated that the company
managed to reduce carbon dioxide emissions through a rapid change in technological
design. Some of the essential goals included developing alternative concepts (e.g., inert
anodes and cathodes), exceeding 12.5 kWh/kg for alumina processing, reducing the cost
of production, and improving cell life cycle by 2025.
Data integration. Technology and R&D were the driving forces of technical
capabilities (D3A & 4A, March 2017). R&D activities promoted technological learning,
derived from a firm's involvement in networking with other aluminum companies to
increase innovativeness. Technology teams are aiming to develop a new generation of
electrolytic cells that supports leading-edge operational and process control practices
(P1A & 3A; D4A, March 2017). The technical capability also allowed the company to
improve the productivity and the competitiveness of the plant through capacity creep,
according to documents reviewed. Technology provided some advances in the reduction
process, carbon casting, recycling, and environmental performance.

171
The company worked in close collaboration with universities, customers,
equipment manufacturers, and specialized firms to drive improvements in aluminum
smelting and recycling, according to the documents observed. The company also
promoted the capacity for innovation through the long-term collaboration with
approximately 20 external, scientific partners. Collaboration served many purposes such
as sharing innovation opportunities. The technology, resulting from expertise and
experience allowed the integration of capabilities that led to a sustainable performance at
the lowest economic cost (P3A& D5A, March 2017).
Case Analysis Company B
Case Description
Company B was a primary aluminum producer located in Europe. The company
produced semi-manufactured products such as T-ingots, slabs, and extrusion billets. Its
vision was to create a viable society by developing natural resources and products in
innovative and efficient ways, according to documents reviewed. This company was one
of the largest primary aluminum producers in Europe. It was a global player operating
along the entire value chain—from the production of bauxite, alumina, primary
aluminum, and energy generation to the recycling of solid aluminum (D3B, March 2017).
In the last decade, its production capacity increased from 0.35 million to 0.4 million
metric tons of molten aluminum. The company’s low-cost capability and energy
availability allowed 14% production capacity creep according to a participant interviewed
and a document reviewed. Increased volume per working hour produced productivity
gains when inputs were kept constants.

172
The company was located close to waterfalls that it used to develop hydropower.
Hydroelectricity was the primary source of energy utilized in the production of
aluminum. The company was close to port terminals and therefore enjoyed cost
advantages due to the geographical proximity (D1B, March 2017). It employed 750
workforces for a production capacity of 0.4 million tons, according to documents
observed. It benefited a robust competitive security in the raw material supply for its
production plants. The 2015 EBITDA margins rose to 25% from the 2014 baseline
according to the company’s annual report. The additional revenues stemmed from
operational efficiency and cost reduction initiatives (P3B, 4B, & 7B, March 2017). This
company was within the first quartile of the cost curve for the production of primary
aluminum.
Table 8 outlines the codes prevalence for all themes isolated from the two datasets
(interviews and documents review) after data triangulation. Tables 9 and 10 outline the
frequency of codes for the core themes derived from interviews and the documents I
reviewed in Company B. Each core concept arose from the subthemes I obtained by
clustering data based on their similarity with existing information in the matrix of codes
that was developing.

173
Table 8
Overview of Core Concepts, Company B
Energy Management & Efficiency
Raw Material Acquisition: Vertical Integration
Carbon Manufacturing Efficiency
Operational Excellence
Capabilities Technology/ Design
Productivity Plant Utilization
Strategic Partners
Sustainable Environment
Totals:
Participant_1B.docx 4 5 1 1 0 1 2 1 15
Participant_2B.docx 2 3 2 0 2 1 2 2 14
Participant_3B.docx 4 2 0 1 0 1 0 2 10
Participant4B.docx 2 3 2 0 4 2 1 0 14
Participant5B.docx 3 2 2 1 1 1 0 0 10
Participant6B.docx 3 0 3 1 1 0 1 1 10
Participant7B.docx 0 0 3 2 1 3 1 2 12
Participant8B.docx 0 1 2 3 3 0 1 1 11
Document1B.docx 1 0 0 2 2 3 0 1 9
Document2B.docx 2 1 2 1 3 3 2 2 16
Document3B.docx 3 2 2 4 2 1 0 3 17
Document4B.docx 1 3 0 0 0 1 3 3 11
Code Occurrence 25 22 19 16 19 17 13 18 149
Code Frequency 17% 15% 13% 11% 13% 11% 9% 12%
Frequency of Participants
75% 75% 88% 75% 75% 75% 75% 75%
Frequency of Documents
100% 75% 50% 75% 75% 100% 50% 100%

174
Table 9
Summary of Codes from Interviews
Partici pant
1B.docx
Partici Pant
2B.docx
Partici Pant
3B.docx
Partici Pant
4B.docx
Partici Pant
5B.docx
Partici Pant
6B.docx
Partici Pant
7B.docx
Partici Pant
8B.docx
Code Frequen
cy
Percentage of codes
RQ1_Energy Efficiency
4 2 4 2 3 3 0 0 18 18.8%
RQ1_Raw Material Vertical integration
5 3 2 3 2 0 0 1 16 16.7%
RQ1_Carbon Anode Manufacturing Efficiency
1 2 0 2 2 3 3 2 15 15.6%
RQ1_Operational Excellence
1 0 1 0 1 1 2 3 9 9.4%
RQ2_Capabilities Technology/ Design
0 2 0 4 1 1 1 3 12 12.5%
RQ1_Productivity Plant Utilization
1 1 1 2 1 0 3 0 9 9.4%
RQ1_Strategic_Partners 2 2 0 1 0 1 1 1 8 8.3%
RQ1_Sustainable_Environment/Circular Economy
1 2 2 0 0 1 2 1 9 9.4%
TOTALS: 15 14 10 14 10 10 12 11 96 100%

175
Table 10
Overview of Codes from Document Review
Document
1B.docx
Document
2B.docx
Document
3B.docx
Document
4B.docx
Code
Occurrence
Code
Frequency
Frequency of
Documents
RQ1_Energy
Management &
Efficiency
1 2 3 1 7 13% 100%
RQ1_Raw Material
Acquisition Vertical
Integration
0 1 2 3 6 11% 75%
RQ1_Carbon Anode
Manufacturing
Capability & Efficiency
0 2 2 0 4 8% 50%
RQ1_Operational
Excellence
2 1 4 0 7 13% 75%
RQ2_Capabilities
Technology/Design
2 3 2 0 7 13% 75%
RQ1_Productivity
Plant Utilization
3 3 1 1 8 15% 100%
RQ1_Strategic
Partners
0 2 0 3 5 9% 50%
RQ1_Sustainable
Environment/Circular
Economy
1 2 3 3 9 17% 100%
TOTALS: 9 16 17 11 53 100%
Core Concept 1: Sustainable Energy Management and Efficiency
Data source: interviews. Energy management and efficiency emerged as a core
theme of the data analysis. Of participants, 75% mentioned that energy efficiency was a
core strategy to reduce production costs. As shown in figure 25, energy management and
efficiency emerged through clustering codes of similar meaning. This grouping yielded
five subthemes including electricity contract, prices efficiency, processing efficiency,
heat recovery, and energy management options. The objectives of energy management
were energy consumption efficiency, cost minimization, and promoting environmental

176
conservation. Of the senior managers interviewed, 50% discussed the influence of
electricity prices on production costs. The company used fixed-price energy contracts
(P1B, 2B, 3B, & 5B, March 2017). The price paid to the energy supplier might not
change during the contractual period regardless of the energy market prices. Prices
efficiency was linked with the type of energy and contract used.
Energy processing efficiency was realized by adopting alumina-feeding strategy
that aimed at reducing cell voltage and greenhouse gases emissions (P4B & 5B, March
2017). Energy processing efficiency also was gained through using alternative materials
that allowed low-energy consumption while maintaining reasonable production output.
Data source: documents review. The concept of energy efficiency and
management was introduced in 100% of the reports analyzed. The company used fixed-
term energy contracts (D2B & D3B, March 2017) and hydropower for the production of
aluminum. Hydroelectricity is a clean source, which neither pollutes air nor generates
greenhouse gases. According to one document reviewed, it is the most efficient energy
source.
On the other hand, efforts were considered to reducing energy consumption
intensity through technological and operational capabilities. According to document
D3B, part of the energy released from electrolytic cells was recovered in the form of heat.
Heat recovery allowed increasing the energy efficiency, which allowed reducing
environmental emissions.
Data integration. The two data sources exhibited remarkable convergence of
information, indicating the critical role energy has in aluminum production costs. Energy

177
management and efficiency derived from five subthemes including (a) energy sources
and price efficiency, (b) power management options, (c) heat recovery, (d) energy-
processing efficiency, and (e) alumina-feeding strategy and greenhouse gases
minimization. Strategies for the energy management require profound understanding and
knowledge of the primary aluminum technical, economic, and regulatory limits to derive
opportunity costs when making operational decisions.
Subtheme 1.1. Energy source and price efficiency, data source: documents
review. Seventy percent of the company’s power supply was carbon-free, according to
the documents reviewed. The energy sources for alumina electrolysis were renewable, as
the company used hydropower and gas. One participant stated that hydropower price was
about one-half the price of nuclear power, which was also considered as a competitive
source of electricity generation. Hydropower and gas were the cleanest forms of
electricity; as such, their energy prices remained competitive compared to other energy
sources such as coal and fuel. In addition, the company used fixed-term energy contracts
(D1B, & 3B, March 2017), provided prices stability and enhanced quality forecast.
Subtheme 1.2. Energy management options, data source: interviews. Energy
management was one of the company’s core strategies. Energy management was
implemented through importing or exporting power within the distribution network,
according to 50% of the senior managers interviewed. The senior managers also indicated
that the energy management system was a public-private partnership or cooperation that
major energy consumers such as aluminum plants used to increase their competitiveness
(see Figure 25). With the growing public demand and the prices of energy, power

178
modulation increasingly provided incentives to maximize the revenues in some European
aluminum companies. Depending on the market options, energy exportation to the
national grid often led to additional revenues in the company’s portfolio. Nevertheless,
the power modulation also resulted in reduced production output because the aluminum
output was a linear function of the current input. According to a senior production
manager interviewed, the revenues growth gained by exporting energy allowed
compensating the cost incurred due to production loss. The volatility of energy prices in
the European market affected companies’ predictable costs.
Subtheme 1.4. Energy-processing efficiency: Data integration. The company
strived to use new materials with lower energy intensity to reduce the power consumption
for the material processing (P1B, 3B, 4B, & P4B, March 2017). The senior manager
stated that Company B consumed 12.5 MWh/ton Al in its new electrolytic cells,
providing a competitive edge over the companies that consumed 14 MWh/ton Al. Table 4
shows that 1.5 MWh/ton Al represented USD44/ton Al. Other sources of energy
improvements related to voltage minimization.
The company’s energy efficiency was 66%; it faced 34% inefficiency based on
the theoretical baseline (see Figure 24). Energy processing efficiency improvement was a
crucial operational capability to lowering production costs and to increasing predictable
earnings (P4B, 5B, & D4B, March 2017). The company used fixed-term energy contracts
(D1B, & 3B, March 2017), which provided prices stability and enhanced quality forecast.

179
Figure 24. Energy consumption for Company B.
Subtheme 1.5. Alumina feeding strategy and greenhouse gases generation,
data source: interviews. The primary greenhouse gas emitted from modern aluminum
production plants was carbon dioxide. This gas was generated from the electrical current
flowing into the carbon anode and the carbon reacting with oxygen in the molten
electrolyte. Highly potent greenhouse gases such as perfluorocarbons also developed
when the alumina concentration dropped below a minimum level in the electrolyte,
resulting in the so-called “anode effect,” which increased the cell voltage ten times higher
than the average voltage. Governmental taxes were proportional to the overall energy
used and emissions (P2B & 4B, March 2017). The company minimized these gases
through optimal alumina-feeding strategies and highly resilient operational processes,
according to a participant interviewed.
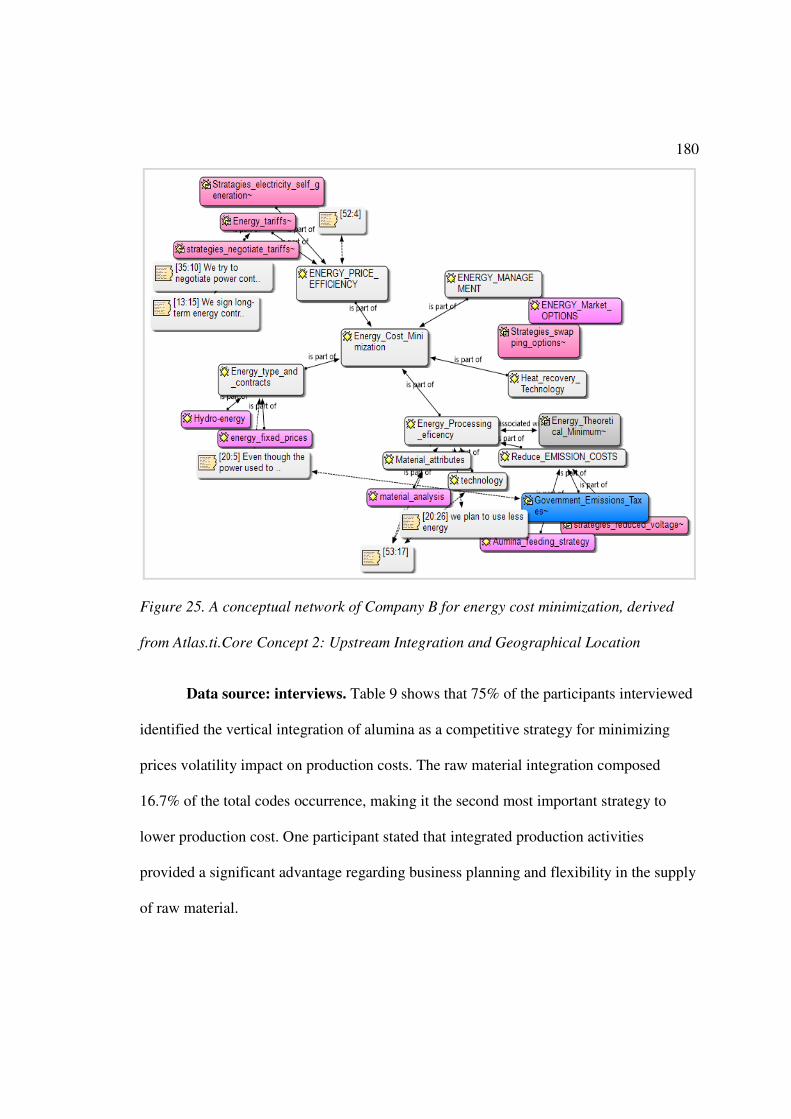
180
Figure 25. A conceptual network of Company B for energy cost minimization, derived
from Atlas.ti.Core Concept 2: Upstream Integration and Geographical Location
Data source: interviews. Table 9 shows that 75% of the participants interviewed
identified the vertical integration of alumina as a competitive strategy for minimizing
prices volatility impact on production costs. The raw material integration composed
16.7% of the total codes occurrence, making it the second most important strategy to
lower production cost. One participant stated that integrated production activities
provided a significant advantage regarding business planning and flexibility in the supply
of raw material.

181
Most alumina suppliers tended to shift toward index-pricing ties, which might be
based on futures or spot prices. Buying commodity on spot prices might lead to
disadvantageous economic costs for the primary aluminum producers, according to a
participant interviewed. The index-pricing link allowed suppliers to price alumina based
on the market price of aluminum on the LME. Increased alumina price affected not only
production costs but also offset gains on aluminum commodity prices (P2B, 3B, & 8B,
March 2017). Lin et al. (2014) found that internalized supplies of high-quality resources
through vertically integrated functions might capture a premium.
Nevertheless, one senior manager stated that backward integration was a risky
strategy –expensive, and challenging to reverse. Companies must analyze all potential
risks before embracing this approach. Lin, Parlaktürk, and Swaminathan (2014) also
found that upstream and downstream integrations tended to intensify competition.
Data source: document review. The raw material integration influenced
production cost for primary aluminum according to 75% of the documents reviewed.
Table 10 indicated that the code occurrence of this theme was higher than 11%. The
company has integrated its midstream production processes backward to its upstream
activities, providing access to alumina (D1B, 3B, & 4B, March 2017). This strategy
increased the quality planning of budgets as the company might take advantage of the
prices stability (D2B, March 2017). The integrated refinery capability was a state-of-the-
art process technology designed to minimize energy costs, raw material consumption, and
waste according to a document reviewed.
182
Data integration. The views developed in the two datasets indicated concordant
results and implied that the raw material acquisition cost tended to reduce when alumina
production and supply were integrated with the midstream activities. Vertical integration
enhances planning, increased coordination effectiveness, improves forecasting
predictability, and the quality of replenishment (Glock & Kim, 2015; Jin, Amydee, &
Fawcett, 2013), but might intensify completion, which has some impacts on prices. Two
senior managers provided quantitative data that allowed comparing the company’s
performance with competitors whose business used non-integrated strategies. The
alumina cost of USD377 composed 23% of the total production costs, as compared to
USD467 (29%) for the highest price observed. The difference of USD 90/ton of
aluminum output indicated that, on average, Company B was 24% more cost-efficient
than a non-integrated company was. Document 2D highlighted that transaction costs and
the risk of exploitation reduced when a business realizes vertical integration. The
document also considered that vertical integration creates market power and raises
barriers to entry. Transaction costs depend on prices volatility, material quality, and
delivery performance. According to document 2D, the company’s proximity, and access
to a port terminal also provided advantageous commercial transportation costs in
importing and exporting materials and finished products, according to a participant
interviewed.

183
Core Concept 3: Material Attributes and the Circular Economy
Figure 26 shows the conceptual network for the material attributes and circular
economy. Three subthemes, including material characteristics, recycling and reusing, and
increased electrolytic cell lifespan provided the conceptual framework of the network.
Figure 26. The conceptual network for Company B of material cost reductions, derived
from Atlas.ti.
Subtheme 3.1: Reducing, recycling, and reusing.
Data source: interviews. The company assessed the reliability of the raw material
through the material attributes assessment, which allowed it to anticipate and minimize
the relative cost-per-unit volume and harmful effects while planning the costs of
recycling (Participant 2B, March 2017). Materials must have the characteristics to serve a

184
definite industrial goal efficiently, effectively, and safely. While materials are designed to
transmit electricity and heat, increase life cycle, store energy, and insulate systems in the
production of primary aluminum, minimizing operational costs and waste should be the
primary goal in selecting the material according to a participant interviewed. For
example, the carbon cathode material, which is the main constituent of the electrolytic
cell lifespan, must be designed to increase the material use efficiency to minimizing
investment and refurbishment costs (Participant 2B & 3B, March 2017). Company B also
intensified the use of solid aluminum recycling as a means to reduce energy consumption.
One senior manager reported that the company used recycling because it improved
energy consumption intensity. Emissions also were reduced, and the costs paid to
governmental agencies reduced by a rate of 20% in recent years.”
Data source: documents review. The materials characteristics assessment allowed
the company to identify a material’s suitability to maximize the use efficiency (D1B
&4B, March 2017). The company recycled some of its materials for sustainable
development. Extraction and transformation of natural resources affect environmental
biodiversity. The company implemented circular economics to minimize adverse
environmental effects according to a participant interviewed. The recycling of aluminum
enabled aluminum producers to reduce waste according to a document reviewed. The
documents analyzed indicated that recycling had a lower energy requirement when
compared with the production of primary aluminum because it consumes only 5% of the
power.

185
Subthemes 3.2 and 3.3: Lifecycle and product attributes.
Data source: interviews. Increased cathode life can allow lowering the purchasing
cost as well as the cash outflow for the cathodic bloc replenishment. According to some
participants interviewed, reducing the carbon-material erosion rate or increasing its
utilization would allow increasing cathode lifespan. Aluminum producers might achieve
these two characteristics through efficient technological and operational capabilities and
new materials design. For instance, aiming for the homogeneous current distribution
across the cathodic surface could drive the optimum erosion pattern that allows
maximizing the cathode life (P7A, March 2017). Too often, when the cathodic material
fails in a running cell, only 35-40% of the material is used; the remainder is treated and
handled as waste (P7B & 8B, March 2017). The continuous improvement of new
generation electrolytic cells should support optimal solutions to increasing cathode life
while maintaining homogeneous erosion across its surface. This performance might
improve the aluminum cell life, productivity, energy efficiency, and lower production
cost according to a participant interviewed.
Data source: documents review. According to the documents observed and some
participants, the cement industry can use spent pot lining material (SPLM) as a raw
material in its process, provided the product be hazard free. The company used a local
partnership approach to handling SPLM. Local collaboration also allowed the company
to reduce transportation costs. In addition, residual aluminum from the casting process,
which was solid waste, was recycled to reduce environmental impacts. The recycling and
recovering of this material had significant economic implications. Residual aluminum,
186
removed from the casting process has high aluminum content. One SM described how
“the company melts residual aluminum in a specialized-recycling furnace that was set
aside for this special use and to reduce landfilling its waste.”
Data integration. All documents reviewed (100%) and 75% of participants
mentioned the circular economy as a robust strategy the company used to reduce costs.
The codes frequencies representing this theme were 17% and 9.4% from the document
reviewed and the interviews respectively. Three critical subthemes emerged from the data
organizing and categorizing: (a) reducing, recycling, and reusing materials; (b) material
attributes, and (c) increased lifespan (see Figure 26). The material quality contributed
significantly to energy consumption and the product lifecycle, according to a participant
interviewed. The objective of using the high-quality material in production systems was
to reduce the energy processing demand and emissions and other environmental impacts
of the business. The material characteristics approach allowed minimizing the negative
environmental impact of aluminum production through efficient and moderated use of
energy (P3B &5B, March 2017). Most SMs mentioned cathodic and carbon anode
materials as elements of sustainability. The use of high-quality material to reduce energy
consumption was a conscious and proactive approach to energy and environmental
conservation. The material selection was an important step to minimizing cost while
meeting the process requirements. Finally, the company used a local partner to handle
and transform SPLM. The local collaboration allowed the company to reduce
transportation costs.

187
Core Concept 4: Operational Excellence and Productivity
Data source: interviews. Participant 1B and 2B mentioned that high
productivity derived from high-plant utilization rate that allowed the company to reduce
environmental waste and improve asset efficiency. Operational excellence and
productivity were highlighted by 75% of the participants. The code frequency of this core
theme constituted 9.4% of the total codes recorded. Figure 27 indicates that productivity
derived from three subthemes: reduced environmental impact, increased asset utilization,
and increased asset efficiency. Production efficiency, which involved material, energy,
and labor factor capabilities, were fundamental elements of the production cost
minimization (P3B &5B, March 2017). Most senior managers agreed that productivity
improvement increased efficiency and reduced resources use while increasing output.
Notwithstanding, the SMs acknowledged that challenges exist regarding the estimation of
the resource productivity and its optimal use to address its implications (P3B, March
2017).

188
Figure 27. The conceptual network of Company B for operational excellence and productivity, derived from Atlas.ti.
Data source: documents review. Of the documents analyzed, 100% highlighted
productivity and plant utilization as an important theme to reduce production costs. In
addition, the theme composed 15% of the total codes occurrence. Documents 2B and 4B
identified technological capabilities, and process innovativeness as components of
productivity and capacity creep. Innovativeness, which is the quality of being innovative,
promotes creativity and continuous improvement. Production capacity is the quantity of
aluminum that a company produces in a given period based on available resources. When
the volume of output increases while maintaining inputs constant, the production
efficiency improves and the marginal cost per ton of aluminum decreases. The company
implemented automation and process improvement methodologies throughout its value
chain (D1B & D3B, March 2017).

189
Aluminum production is a resource- and energy-intensive process; starting with
the bauxite mining, aluminum fluoride, and coke, all these minerals are extracted from
the earth crust in millions of tons per annum. Aluminum production growth threatens
environmental sustainability. Whereas most producers attempted to increase the
production capacity to sustain high-fixed costs, the rate at which the raw material is
demanded, consumed, and some of it discarded in the form of waste has not abated due to
reduced efficiency and the lack of innovative processes of recycling (D4B, Mach 2017).
The growing resource consumption and waste generation together, place increasing
demands on financial capabilities and might further drive production costs upwards.
Document 4D further highlighted that the limited resources necessitated efficient
production functions and processes to alleviating sustainability and productivity
concerns. A firm’s cash flow and profitability are exposed to resources consumption
efficiency.
Data integration. The two datasets showed that increased productivity and plant
utilization reduced production costs. Technological capabilities and processes
innovativeness, as well as assets efficiency, can improve productivity and material
efficiency. Productivity derived from finding effective production methods of doing
things efficiently. It is different from costs cutting or increasing volumes of output
regardless of the returns. The measurement of the production frontier should guide the
decision to estimate the inputs requirements for a given production output. Gutowski et
al. (2013) found that implementing low-cost capacity machines or replacing high-cost
technologies increases efficiency.

190
Subtheme 4.1 Reduced emissions, data source: documents review. The
company improved performance through significant cost reductions and process
efficiency. The management focused on top-tier assets and curtailed high-cost capacity,
according to the documents reviewed. One participant interviewed described how the
company had lowered its greenhouse gas emissions by approximately 20% in the last 10
years, significantly reducing production costs. The reduction of the emissions generation
arose from (a) investments in breakthrough technologies for purifying and recycling
gases, (b) the closure refurbishment of old-or higher-carbon energy assets, and (c)
operational improvements, according to documents reviewed.
Figure 28. Environmental costs for Company B exhibited.
Subthemes 4.2: Increased plant utilization and efficiency, data source:
documents review. The company improved performance through significant cost
reductions and process efficiencies. The company’s strategy was to focus on top-tier
191
assets and curtail high-cost capacity, according to documents reviewed. The company
consolidated its position as one of the world’s leading aluminum businesses regarding the
quality of assets, productivity, and profitability. The documents review also indicated that
Company B delivered earnings of USD370 million in 2015, including increased EBITDA
margins, despite decreased average London Metal Exchange (LME) prices. It launched
700 cost-reduction initiatives in 2015, resulting in significant earnings improvements as
highlighted in its annual report. These cost initiatives included production efficiencies,
negotiated prices of raw materials, and increased capacities of output units, according to
annual reports. Qualified staff, as well as highly technical standards, and superior design
were the company’s core capabilities (P4A &7A, March 2017). The company employed
750 people, 10% of which were subcontractors, for a production capacity of 0.4 million
tons per year.
Core Concept 5: Material-Consumption Efficiency
Data integration. Table 9 shows that 87% of participants and 50% of the
documents reviewed mentioned the material consumption efficiency as a strategy to
reduce costs. The material consumption efficiency constituted 15.6% and 8% of the codes
occurrence from the interviews and documents reviewed, respectively. Carbon and
alumina were the most important raw materials in the aluminum processing (P1B, 2B, &
3D, March 2017). The carbon consumption rate in the electrolytic cell was approximately
400 kg of carbon/ton of aluminum (Annual Report, 2014), as compared to a technical
consumption requirement of 333 kg. The observed efficiency was 80%. The carbon
inefficiency of 20% was equivalent to 67 kilograms of carbon wasted for every ton of

192
aluminum output, corresponding to USD45 per ton. At a capacity of 0.4 million tons Al,
the cost improvement could generate USD18.3 million additional revenues per year.
Figure 29. Carbon consumption efficiency for Company B.
The ratio of alumina consumption to aluminum output was 1.92:1. Observed
material inefficiency was 0.03 kg of alumina wasted per kg Al. This additional alumina
consumed reflected losses as well as the low current efficiency of electrolytic cells and
was equivalent to USD 6/ton Al (P1B, March 2017), generating additional production
costs, annualized to USD2.4 million.
Core Concept 6: Technology and R&D Capabilities
Data source: interviews. Data showed that 75% of participants mentioned
technology and R&D as an enabler to lower production costs. P5A and 8A reported that
the company was engaged in the modernization projects of old assets; these investments
would allow the company to leverage the low-cost hydropower capability to reduce fixed
costs. The new technological capability developed in the reduction process was designed

193
to delivering lower economic costs of production, according to documents observed. One
senior manager stated, “The benefits expected included 20% higher productivity per
electrolytic cell and 7% greater workforce productivity.” The participants also described
the way technology allowed the company to enhance the predictability of its production
cells life cycle through promoting high-quality material. In addition, the senior manager
explained how the company was continually working to develop energy-efficient cells to
improve economic performance and create a sustainable production system.
Data source: documents review. Company B had a fully integrated alumina
transportation design and trans-loading capability, including point feeding and
hyperactive dense-phase systems that kept transportation costs at a minimum, according
to documents reviewed. In addition, the integrated-carbon-anode manufacturing
capability allowed minimizing transactional costs of purchasing anodes and supply risk
potential (D2 & 3D, March 2017). High electrolytic cell productivity increased
production outputs while reducing energy consumption intensity. As one document
described, “High environmental and safety standards, improved facilities quality, and
equipment design reduced incidents and security costs” (D3D, March 2017).
Data integration. Technology and R&D were enablers to reduce costs through
innovation. The technological capability had implications on material and energy
consumption intensities. The company refurbished low-energy efficiency electrolytic
cells to reduce energy consumption intensity. Technology also allowed some energy
recovery and waste minimization.

194
Case Analysis Company C
Case Description
Company C’s electrolysis plant was located in Western Europe. The company
produced primary aluminum through the Hall–Héroult process, the primary industrial
process for alumina electrolysis. The plant produced a diversified portfolio of specialized
light metal products, including alloys in the form of ingots, slab, and wire. The smelter
was commissioned in the early 20th century to produce high-quality aluminum and
sustainable material with high productivity. At full capacity, the company produced
145,000 tons of aluminum per year and used a workforce of 600 employees.
The company required competitive security for its raw material supply to its
production units because it purchased directly from the market, according to a participant
interviewed. The senior manager went further to highlight that businesses that buy the
raw material based on spot prices face price uncertainty. One senior manager stated that
the company realized less than 5% ROI in 2015, despite improvements in aluminum
prices in the last quarter of 2015. Figure 30 outlines five causal conditions of high
production cost in Company C: (a) energy and raw material cost inefficiency, (b) energy-
processing inefficiency, (c) material-consumption inefficiency, (d) lack of carbon anode
manufacturing capability, and (e) reduced asset utilization. Conversely, three core themes
emerged for reducing production costs including (a) operational excellence, (b) sourcing,
and (d) strategic collaboration.
Table 11 is a summary of the codes prevalence for all themes isolated from the
two datasets (interviews and documents review) after data triangulation. Tables 12 and 13

195
profiled the frequency of the codes for the core themes obtained from interviews and
documents analysis in Company C. Each core theme stemmed from the subthemes that I
obtained by clustering data based on their similarity with existing information in the
matrix of codes that was growing.
Table 11
Overview of Core Concepts: Company C
Energy Management/ Modulation
Missing Capability: Raw Material Integration
Limited Carbon Anode Manufacturing
Operational Excellence
Purchasing Strategies
Sourcing Strategies
Strategic Partners
Circular Economy
Capability Technology/ Design
Totals:
Participant 1C.docx
2 2 0 0 2 3 0 4 0 13
Participant 2C.docx
2 4 2 1 1 1 0 5 0 16
Participant 3C.docx
3 1 3 1 2 1 0 0 1 12
Participant 4C.docx
1 2 2 2 0 1 1 1 1 11
Participant 5C.docx
0 2 0 0 1 5 0 0 0 8
Participant 6C.docx
1 5 2 2 0 1 1 1 0 13
Participant 7C.docx
1 3 2 0 1 1 0 0 0 8
Participant 8C.docx
1 0 2 0 2 0 1 3 2 11
Document 1C.pdf
3 1 2 1 0 0 0 2 0 9
Document 2C.pdf
1 3 1 0 0 1 0 1 3 10
Document 3C.pdf
3 1 0 1 1 3 0 6 0 15
Document 4C.pdf
0 2 0 0 1 0 0 2 0 5
Code Occurrence
18 26 16 8 11 17 3 25 7 131
Code Frequency
14% 20% 12% 6% 8% 13% 2% 19% 5%
Frequency of Participants
88% 88% 75% 50% 75% 88% 38% 63% 38%
Frequency of Documents
75% 100% 50% 50% 50% 50% 25% 100% 50%

196
Table 12
Code Occurrence from Interviews
Energy Management/ Modulation
Missing Capability: Raw Material Integration
Limited Carbon Anode Manufacturing
Operational Excellence
Purchasing Strategies
Sourcing Strategies
Strategic Partners
Circular Economy
Capability Technology/ Design
Totals:
Participant_1C.docx
2 2 0 0 2 3 0 4 0 13
Participant_2C.docx
2 4 2 1 1 1 0 5 0 16
Participant_3C.docx
3 1 3 1 2 1 0 0 1 12
Participant_4C.docx
1 2 2 2 0 1 1 1 1 11
Participant_5C.docx
0 2 0 0 1 5 0 0 0 8
Participant6C.docx
1 5 2 2 0 1 1 1 0 13
Participant_7C.docx
1 3 2 0 1 1 0 0 0 8
Participant_8C.docx
1 0 2 0 2 0 1 3 2 11
Code Occurrence
11 19 13 6 9 13 3 14 4 92
Code Frequency
12% 21% 14% 7% 10% 14% 3% 15% 4% 100%
Frequency of Participants
88% 88% 88% 50% 75% 88% 38% 50% 38%

197
Table 13
Code Occurrence from Documents Review
Document _1C.pdf
Document _2C.pdf
Document _3C.pdf
Document _4C.pdf
Code Occurrence
Code Frequency
Frequency of Documents
RQ1_Missing_Capability_Energy_Efficiency
3 1 3 0 7 16% 75%
RQ1_Missing_Capability_Raw Material Integration
1 3 1 2 7 16% 100%
RQ1_Missing_Capability_Carbon Anode Manufacturing
2 1 0 0 3 7% 50%
RQ1_Productivity_Operational_Excellence
1 1 1 1 4 9% 100%
RQ1_Purchasing Strategies
0 0 1 1 2 5% 50%
RQ1_Sourcing 0 1 3 0 4 9% 50%
RQ1_Strategic Partners
0 2 0 0 2 5% 25%
RQ1_Strategies_Sustainable_Environment/Circular Economy
2 1 6 2 11 26% 100%
RQ2_Capability Technology
0 3 0 0 3 7% 25%
TOTALS: 9 13 15 6 43 100%
Causal Condition 1: Energy Inefficiency
Subtheme 1.1: Energy processing.
Data source: interviews. Table 12 shows that 87.5% of participants considered
energy as a decisive production factor for reducing expenses, although the company
suffered low-energy-processing efficiency. Energy efficiency constituted 11.6% of the
codes occurrence. Technology, which contributed to energy cost minimization, was also
identified as a significant component of production competitiveness. Participants voiced

198
concordant views on the adverse impact of old technology on productivity and plant
utilization. Most SMs seemed in consensus that the current electrolytic cells required
modernization to meeting the energy efficiency expectation (P2C, 3C, 4C, &6C, March
2017). One SM stated that the driving force for renovating old-aluminum electrolytic
cells was incentivized from reducing electrical-energy demands and minimizing adverse
environmental impacts. On the other hand, Participant 2C indicated that increased raw
materials prices and high-energy costs were driving the use of recycling solid aluminum
rather than processing primary material as the primary strategy of production. Recycling
allowed the company to reduce energy costs for processing alumina.
While the energy efficiency was approximately 37.8%, according to participants
(3C, 4C, & 6C, March 2017), the cost efficiency compared to the benchmark was 57%. I
evaluated the technological and operational efficiency by differentiating components of
energy costs including (a) total energy expenses incurred per unit of material produced,
(b) energy price, and (c) observed power consumption compared to the benchmark within
the same industry in the same region. Company C incurred additional USD113 and USD
238 because of price, technological and operational inefficiencies, respectively.

199
Figure 30. Energy efficiency of Company C, according to a participant interviewed.
Data source: documents review. Table 13 shows that 75% of the records analyzed
considered energy as an influential production factor for reducing costs. Energy
efficiency also composed 16% of the codes occurrence. Two documents out of four
mentioned that energy consumption intensity had a direct implication on greenhouse
gases emissions. Most costs savings realized in energy processing derived from
operational excellence or the implementation of good practices in production units.
Document 3C considered that the company needed to create the right conditions through
innovative technologies and revamping of high-cost assets to making savings in energy
consumption. The highest demand for energy consumption derived from the processing
of aluminum oxide. The company attempted to reduce its energy intensity through

200
secondary aluminum production, which was less energy-intensive than the primary-
aluminum processing (D2C & 4C, March 2017).
Subtheme 1.2: Energy contract and price inefficiency.
Data source: interviews. Company C used fuel and nuclear power as the primary
energy sources for its electrolytic cells according to senior managers. The energy contract
was a partnership arrangement with the sovereign government (P3C & 7C, March 2017).
The company paid the energy supplier a price proportional to power generation costs.
The SM also indicated that the cost paid was indexed based on the operating expenses of
the nuclear plant, which might follow the global prices volatility (P3C, March 2017).
Notwithstanding, fuel costs were subject to significant volatility given the country’s
reliance on this energy source (P2C, March 2017). Energy costs were the most critical
components in the production of primary aluminum, and the company’s ability to
negotiate tariffs in Western Europe was of paramount importance. At market prices, it
would be too costly for the plant to afford production costs, with energy cost accounting
for 35%, according to a participant interviewed. Figure 30 provides a comparison of the
energy costs between Company C and the theoretical baseline. The company incurred
USD113/ton Al extra cost.
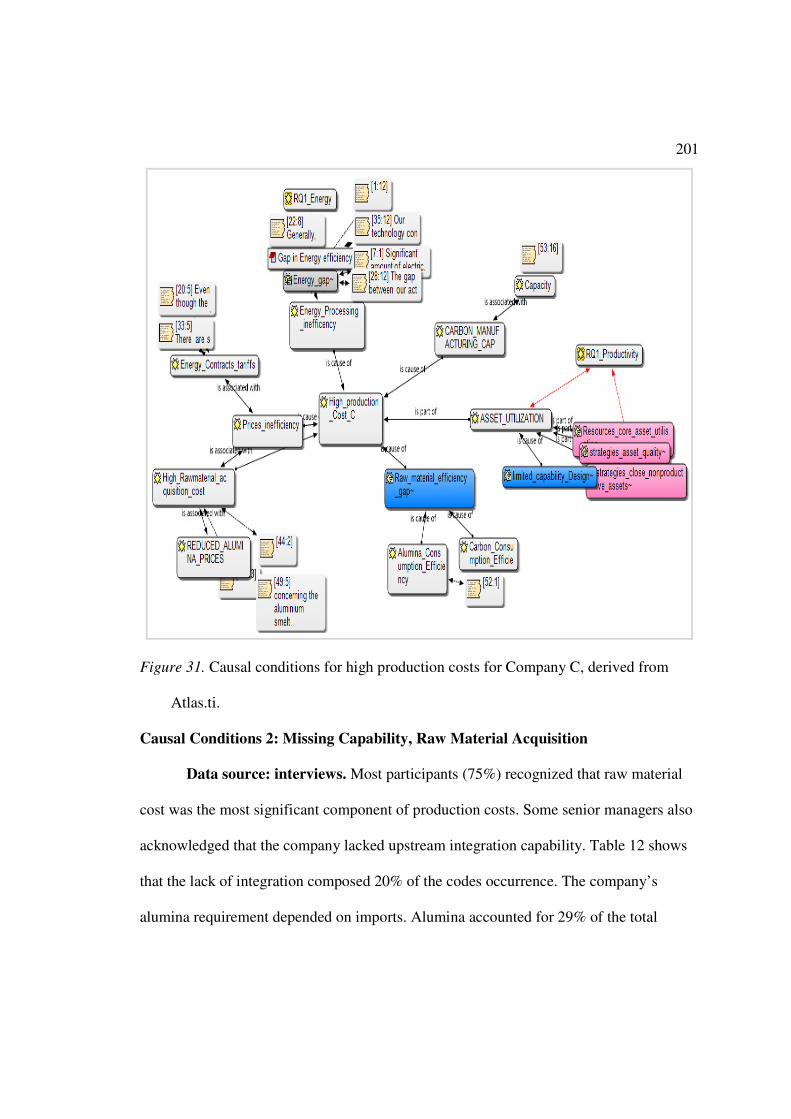
201
Figure 31. Causal conditions for high production costs for Company C, derived from
Atlas.ti.
Causal Conditions 2: Missing Capability, Raw Material Acquisition
Data source: interviews. Most participants (75%) recognized that raw material
cost was the most significant component of production costs. Some senior managers also
acknowledged that the company lacked upstream integration capability. Table 12 shows
that the lack of integration composed 20% of the codes occurrence. The company’s
alumina requirement depended on imports. Alumina accounted for 29% of the total

202
production costs, according to a participant interviewed. Company C had a short-term
contract for alumina, which was planned to expire in 2017, at which time most suppliers
might link the alumina prices to the LME index (P5C, March 2017). Figure 32 shows the
alumina cost difference between Company C and the benchmark. Alumina prices are
25.8% higher than the benchmark.
Figure 32. Alumina costs for Company C, according to a participant interviewed.
Data source: documents review. All documents reviewed (100%) highlighted
the raw material as the most influential production costs component. Table 12 shows that
the lack of integration composed 16% of the codes occurrence. Documents D2C reported
the list of alumina suppliers from which Company C purchased alumina to meet its
production requirements. The analysis of these alumina providers showed significant
costs variations depending on the vendor and the quality of alumina used according to
203
document D2C. One report also highlighted transportation as a cost factor in alumina
acquisition.
Data integration. The perspectives developed in the two data sources were
similar as shown in Tables 12 and 13. Most participants and documents considered that
the lack of integration increased the cost of procuring alumina. One senior manager
intimated that the alumina pricing mechanism had fluctuated historically in the range of
12-14.5% of the LME aluminum price. Recently, many alumina suppliers attempted to
unlink the pricing mechanism from the traditional channel to spot pricing. According to
participants 1C and 3C, Alcoa, who was the leading alumina supplier, implemented the
change to pricing alumina based on a ratio of spot alumina pricing in preference of a
percentage of the LME-based aluminum pricing. This change in pricing mechanism was
driving alumina acquisition cost to rise in the range of 16-18% of LME-based alumina
price according to participants and documents reviewed. Trench, Sykes, and Robinson
(2015) also found that alumina demand was expected to increase based on China’s
ongoing alumina demands. Furthermore, Trench, Sykes, and Robinson found that a high
demand in the market of alumina might enable prices to increase in the range of 15–20%
by 2020. The literature appeared to corroborate the views of participants and the
documents reviewed.
Causal Condition 3: Carbon Anodes and Limited Manufacturing Capacity
Data source: interviews. The company had limited capacity to manufacture
carbon anodes for its electrolytic process (P1C & 6C, March 2017). Table 12 shows that
the lack of carbon manufacturing capacity was the third most significant production cost

204
factor. Of eight senior managers interviewed, 75% recognized this missing capability as a
cause of additional cost. Table 12 also indicates that this theme constituted 13.7% of the
codes. Company C manufactured only 75% of its carbon anodes; it purchased the
remainder from China, according to a participant interviewed. The senior manager
affirmed that an anode made within the company costs USD180/ton Al, whereas, the
same anode bought from China increased direct costs in the range of 15-20%. Figure 33
provides the total carbon costs per ton of material output.
Figure 33. Carbon price inefficiency for Company C.
Data source: documents review. Of the documents reviewed, 50% reported the
requirement to reduce anode-manufacturing costs. In one report, the company compared
the anode manufacturing cost with the competition and seemed to acknowledge that there
were extra charges incurred in purchasing anodes from a third party. Table 13 shows that

205
shortcomings on carbon manufacturing capacity are a significant production cost factor.
Table 13 also indicates that this factor composed 7% of the codes. One document
reported that the lack of integrated in-house carbon manufacturing capability led to
outsourcing a portion of their carbon anodes requirements. The report presented the
following arguments to justify this strategy: price arbitrage between purchasing
manufactured anodes and calcined petroleum coke in the commissioning phase,
opportunity cost gains (through deferment of capital expenses) in building and
commissioning the plant, increasing environmental restrictions, and high-energy
consumption costs in manufacturing carbon anodes.
Data integration. The two datasets exhibited concordant viewpoints about the in-
house carbon-anode-manufacturing impact on cost. While senior managers presented
quantitative data to support the view that producers with integrated in-house carbon
anode manufacturing capability incurred fewer production costs than competitors who
used outsourcing strategy, the documents reviewed provided detailed qualitative
information about the benefits and disadvantages of each option. This information was
essential to explain the driving factors to outsource the supply of carbon anodes. These
factors were market-driven, opportunity-cost driven, environmental-driven, and capital-
driven as outlined in one document.
Causal Condition 4: Material Consumption
Subtheme 4.1: Carbon consumption (data source interview). The anode
consumption to aluminum output ratio was approximately 420 kg C/ton Al (P5C, March
2017). This ratio was the highest observed. Compared to a benchmark within the region,

206
Company C incurred additional costs for 20 kg of carbon/ton Al, corresponding to
USD13/ton of Al. Annualized production costs equal to USD1.9 million. The extra cost
incurred was due to operational inefficiency, and the high anode reactivity to air
according to a participant interviewed. The carbon consumption to the theoretical value
ratio observed was 1.27:1. In addition, some senior managers claimed that different
anode quality resulting from a variation in operating parameters and raw materials
influenced anode consumption (P3C, 5C, & 8C, March 20017). Carbon inefficiency was
one of the leading environmental causes of pollution because carbon oxidization led to
carbon dioxide and other greenhouse emissions. From the stoichiometric reaction
standpoint, the amount of carbon dioxide in weight emitted to the environment was
higher than the amount of primary Al output, and the tax paid to governmental agencies
was proportional to the emissions level (P3C, 5C, & 8C, March 20017).
Figure 34. Carbon consumption inefficiency for Company C.
207
Subtheme 4.2: Alumina consumption (data source interviews). The alumina
theoretical consumption to aluminum output ratio was1.89:1. Observed material
inefficiency was 0.03 kg of alumina per kg Al. This additional alumina consumed
reflected losses as well as the low current efficiency of electrolytic cells, according to
participants 1C and 4C. The senior managers stated that the alumina consumption
inefficiency was equivalent to USD7.5/ton of Al. The alumina loss generated additional
production costs of USD1 million per year. The company used a pressurized alumina
distribution system to minimize losses and prevent environmental spillages, according to
documents reviewed. This equipment was designed for high-operational efficiency and
environmental compliance.
Core Concept 2: Operational Excellence and Productivity
Data source: interviews. Data show that 75% of the senior managers considered
operational excellence and productivity as influential for the business performance; in
addition, this theme composed 11.3 % of the codes occurrence. Table 12 also shows that
this theme was one of the most significant strategies the company used to reduce costs.
The plant increased the production capacity over the last two decades from 125,000 tons
to approximately 145,000 tons annually, leading to the increased machine and labor
productivity. One participant stated, “We attempted to design efficient operating practices
supported by the Lean, and Six Sigma approaches to minimize the resources use. These
tools allowed the company to eliminate waste and streamline the workforce and material
flow.” Adequate implementation of these tools from the initial stage supported a culture
of excellence.

208
Data source: document review. In the last two decades, Company C increased
its production capacity, which affected fixed costs per unit produced according to
documents 1D and 2D. Nevertheless, the production output remained limited given a
series of challenges some mature companies face. For instance, additional production
capacity beyond the nominal level might require additional investments given the limited
technological capability. The company achieved growth in production capacity through
continuous process improvements and capacity enhancements of reduction cells (Annual
Report, 2014). These developments led to 7% increased productivity in aluminum output,
according to the document reviewed. The objective of the operational excellence was to
make the process more efficient and leverage operational capability to achieve business
growth (1D, 2D, & 4D, March 2017).
Data integration. High-fixed costs appeared to affect the company’s
performance. The concordant views of the two datasets showed that operational
excellence and increased productivity of resources had a significant impact on production
costs. The company strived to improve the production cost through enhancing machine
and labor productivity and minimizing resources use, all of which are supported by the
Lean, and Six Sigma approaches. These tools allowed the company to eliminate waste
and streamline the workforce and material flow.
Core Subtheme 2: Strategic Partnerships and Sourcing
Data source: interviews. Of participants, 68% identified sourcing and strategic
partnership as a core strategy the company used to reduce production cost. Table 12
indicates that these aggregate themes composed 20% of the code occurrence, intimating

209
their weight in the aluminum production strategy. Participants P1C and 3C mentioned
that the company employed 470, 10% of whom are subcontractors. Outsourcing provided
some benefits such as increased efficiency and reduced fixed cost per unit output.
Gunasekaran, Irani, Choy, Filippi, and Papadopoulos (2015) also found that outsourcing
decreases the cost of assets, allows strategic flexibility, and overcomes administrative
expenses.
Outsourcing allowed the company to maximize its supply chain visibility and
supported increased ROI according to four participants. From 2014 through 2015, the
company saved USD5 million in supplier spending through leveraging trusted supplier
data quality and strategic partnership (P2C, 3C, & 4C, March 2017). The company used
automated data exchange with trading partners to maximize agility and streamline the
supplier lifecycle management. One document reviewed reported, “Real-time access to
data can help empower the negotiation capabilities.” In recent years, the company
leveraged data analytics to increase its procurement efficiency. One senior manager also
stated that the company assessed the core processes and non-core process, and analyzed
the total cost of options to insource activities. It used sourcing strategy for noncore
operations only.
Data source: documents review. Table 13 indicates that 50% of documents
analyzed mentioned sourcing as an important strategy to reduce cost; however, only 25%
of the reports highlighted the strategic partnership as being important to reduce
production cost. Sourcing and strategic partnership together composed 14% of the codes
occurrence. The company reduced the number of suppliers in recent years to maintain

210
only those that enabled to streamline purchasing as they contributed to processes
innovation (D2D & 3D, March 2017). The company also used specialized suppliers to
provide new material that could allow reducing energy costs and minimizing
environmental emissions. Sourcing strategy was used as a strategy to reduce high fixed
costs.
Data integration. Although the codes occurrence for this core theme exhibited a
marginal difference between the two data sources, the perspectives the participants
developed by and those outlined in the documents reviewed were aligned. Strategic
sourcing and partnership, as defined in one of the documents reviewed was about
developing strategic channels of supplying services and materials by a strategic partner at
the lowest possible cost. The company used sourcing to perform non-core activities in
production units. It also used strategic partners to provide specialized services and critical
materials such as carbon cathode. These strategic partners allowed to streamline
purchasing and contributed to processes innovation.
Core Concept 3: Sustainable Environment
Data source: interviews. Of participants, 62% highlighted recycling and material
attributes selection as a core strategy to reduce cost. This theme composed 12% of the
codes occurrence. Recycling and material attributes were one of the most significant
strategies the participants highlighted to cut costs. The company used selective materials
that can be recycled and reused in its processes to increase energy performance. It also
recycled solid aluminum (P4C, 6C, & 8C, March 2017), a practice that supported to
reduce the energy consumption intensity. One senior manager stated that aluminum

211
recycling reduced energy demand and could allow promoting a positive community life.
Finally, the company used strategic partners in the cement industry to recycle the SPLM.
In summary, most senior managers agreed that aluminum recycling provided
environmental, energy efficiency, and community benefits; it also contributed to protect
and prevent natural resources depletion.
Data source: documents review. All documents (100%) provided insights on the
environmental benefits of recycling in the aluminum business. Environmental
sustainability composed 26% of the codes occurrence. The reports showed that this theme
was the most cited, symbolizing its weight in the production strategy to reduce cost.
Document 3C indicated that incorporating environmental and sustainability goals into the
business model promoted sustainable and environmentally responsible production
processes and practices. The company continually improved its operational practices and
alumina feeding strategies of the electrolytic process to reduce greenhouse gases (GHG)
emissions. Carbon dioxide contributes to global warming, and sovereign governments
impose taxes based on its emission (D3C, March 2017).
Data integration. The data integration shows that 100% of the documents
reviewed and 62% of the senior managers interviewed considered environmental
sustainability as a core strategy to reduce production costs as well as to minimize energy
waste of processing aluminum. The most commonly used strategies included aluminum
recycling, managing SPLM, employing high-material attributes, reducing greenhouse
gases emissions through alumina feeding strategies, and optimizing operational practices.

212
Core Concept 4: Technology and R&D Capabilities
The two datasets exhibited a similar code occurrence of technological and R& D
capabilities 4.2% for the interviews and 7% for the document reviewed (see Tables 12
and 13). Some senior managers (37.5%) mentioned that the technology used for the
aluminum oxide electrolysis required modernization to minimizing energy and
environmental costs. Miltenburg (2005) and Shepherd (2015) found that the wrong
selection of production techniques may increase production costs. Conversely, adequate
selection of technological capabilities, which is part of a manager’s responsibility,
involves allocative efficiency (Moll, 2014; Restuccia & Rogerson, 2013). The
participants mentioned that increased automation of the equipment has contributed to a
better control of the production process. Advanced automation of alumina feeding
introduced through the human-machine interface pot-regulating system has allowed
increased decision quality and optimal operational practices (P2C, 3C, & 4C, March
2017). Conceptually, this technology was designed to provide optimal operational safety
in the commissioning phase, as part of the corporate social responsibility. Meanwhile,
retrofitting is required to minimize emissions and increase efficiency, the participant
concluded.
Over the past years, the company has made significant improvements in the
operation of electrolytic cells. For instance, it has lowered electrolytic cell voltage and
enhanced real-time operational decisions through automation according to document
(D2C, March 2017). These actions had a significant impact on energy consumption and
environmental emissions. Improvements in electrolytic cell voltage were introduced

213
through a change in the lining material and the redesigning of the cathode bars, according
to two participants interviewed.
Case Analysis Company D
Case Description
Company D produced primary aluminum. The company was located in Western
Europe, had a production capacity of 230,000 tons of aluminum per year, and employed
640 people. The workforce consisted of 500 permanent employees and 140 contractors. It
produced rolling ingots and extrusion billets used for manufacturing cars, aircraft, trains,
ships, and window frames. The company was commissioned in the late 20th century and
used a prebaked-anode technology to produce primary aluminum. According to
participants interviewed and document analysis (Figure 35), four critical causal factors
influenced production costs including (a) limited-carbon manufacturing capacity, (b)
energy-processing and buying inefficiencies, (c) alumina-buying costs, and (d) the aging
technological effect. Conversely, data showed that the four central concepts that the
company used to reduce costs included: (a) operational excellence and productivity
enhancement, (b) recycling, (c) sourcing and collaborating, and (d) retrofitting aging
technologies. Table 14 outlines core concepts the company used to reduce production
cost. Tables 15 and 16 show the codes occurrence derived from the two data sources. The
tables also contain a summary of missing capabilities or causal conditions that led to high
production cost. The company incurred significant production costs of energy processing
and material acquisition. Figure 35 outlines the network of causal conditions of high
production costs as derived from Atlas.ti.

214
Table 14
Overview of Core Concepts: Company D
Energy Management/Modulation
Missing Capability: Alumina Integration
Limited Carbon Anode Manufacturing Capability
Productivity/ Operational Excellence
Purchasing Strategies
Sourcing Strategies
Strategic Partners
Sustainable Environment/Circular Economy
Capability Technology
Totals:
Participant_1D.docx
1 4 2 0 1 1 0 2 1 12
Participant_2D.docx
2 2 2 1 0 4 0 0 1 12
Participant3D.docx
1 1 1 0 0 1 0 1 0 5
Participant_4D.docx
2 2 0 1 0 0 0 0 0 5
Participant_5D.docx
0 4 2 1 3 1 1 3 1 16
Participant_6D.docx
2 1 2 0 0 1 1 2 0 9
Participant_7D.docx
2 1 1 1 0 1 0 1 1 8
Participant_8D.docx
1 1 2 2 0 2 1 3 1 13
Document1D.pdf
1 2 2 2 0 1 0 4 0 12
Document2D.pdf
1 0 1 0 1 4 0 3 0 10
Document3D.pdf
1 2 2 1 2 3 0 1 2 14
Document4D.pdf
0 0 0 0 2 2 0 2 1 7
Code Occurrence
14 20 17 9 9 21 3 22 8 123
Code Frequency
11% 16% 14% 7% 7% 17% 2% 18% 7%
Code Frequency
88% 100% 88% 63% 38% 88% 38% 75% 63%
Frequency of Participants
75% 50% 75% 75% 100% 100% 25% 100% 50%

215
Table 15
Overview of Codes Occurrence: Interviews
Missing Capability: Energy Management/Efficiency
Missing Capability Raw Material Integration
Limited Carbon Anode Manufacturing Capability
Productivity/ Operational Excellence
Purchasing Strategies
Sourcing Strategies
Strategic Partners
Sustainable Environment Circular Economy
Capability Technology/R&D
Totals:
Participant_1D.docx
1 4 2 0 1 1 0 2 1 12
Participant_2D.docx
2 2 2 1 0 4 0 0 1 12
Participant_3D.docx
1 1 1 0 0 1 0 1 0 5
Participant_4D.docx
2 2 0 1 0 0 0 0 0 5
Participant_5D.docx
0 4 2 1 3 1 1 3 1 16
Participant_6D.docx
2 1 2 0 0 1 1 2 0 9
Participant_7D.docx
2 1 1 1 0 1 0 1 1 8
Participant_8D.docx
1 1 2 2 0 2 1 3 1 13
Code Occurrence
11 16 12 6 4 11 3 12 5 80
Code Frequency
14% 20% 15% 8% 5% 14% 4% 15% 6% 100%
Frequency of Participants
88% 100% 88% 63% 38% 88% 38% 75% 63%

216
Table 16
Summary of Codes Occurrence: Document Review
Document
1D.pdf
Document
2D.pdf
Document
3D.pdf
Document
4D.pdf
Code
Occurrence
Code
Frequency
Frequency
of
Document
RQ1_Missing
Capability Energy
Efficiency
1 1 1 0 3 7% 75%
RQ1_Missing Action
Raw Material
Integration
2 0 2 0 4 9% 50%
RQ1_Productivity/
Operational
Excellence
2 1 2 0 5 12% 75%
RQ2_Limited Anode
Manufacturing
Capacity
2 0 1 0 3 7% 50%
RQ1_Purchasing
Strategies
0 1 2 2 5 12% 75%
RQ1_Sourcing 1 4 3 2 10 23% 100%
RQ1_Strategic
Partners
0 0 0 0 0 0% 0%
RQ1_Strategies
Circular Economy
4 3 1 2 10 23% 100%
RQ2_Capabilities
Technology/R&D
0 0 2 1 3 7% 50%
Totals: 12 10 14 7 43 100%

217
Figure 35. Causal conditions for high production costs in Company D, derived from
Atlas.ti.
Causal Condition 1: Limited Anode Manufacturing Capacity Because of Limited
Facilities Capability
Data source: interviews. Table 14 shows that 63% of senior managers
considered the lack of integrated-in-house carbon- anode manufacturing capacity as a
cause of high production cost. The missing carbon anode manufacturing capacity
composed 8% of the codes occurrence. The aluminum plant was built with a limited
anode production capacity because of three critical cost factors. First, carbon anode

218
production generates significant greenhouse gases subject to environmental restrictions
and national taxes. Second, the energy consumption to manufacture carbon anode could
have limited the power available for processing aluminum. Third, at the time the plant
was commissioned, purchasing cheaply manufactured anodes from China was
economically attractive compared to manufacturing internally (P2D & P4D, March
2017). Meanwhile, the aluminum business environment has changed, which corroborated
Porter’s (1980) arguments that multiple changes in a company’s external business
environment in which it operates might influence its strategic planning. With the
hindsight, some managers have realized the magnitude of these changes on the cost
incurred in purchasing carbon anodes externally. No one-business environment appears
to be unlimitedly stable over time; business people must be versatile to external changes
and their impacts on the planning.
In addition, the quality of carbon anodes influenced the carbon consumption
efficiency and had an impact on the aluminum production efficiency according to
participants. Similarly, the quality of the raw material has a significant impact on
environmental emissions due to its chemical content. Defective anodes, purchased
overseas incur significant transportation and production cost, and other indirect costs for
replacement because defects could not be corrected economically in the aluminum
electrolytic process (P2D, March 2017).
Data source: document review. Table 16 shows that 50% of the documents
reviewed mentioned insufficient anode manufacturing capacity as a cause of high
production costs. The code occurrence for this theme was 7%. Anode production

219
prevailed as one of the most significant cost drivers in the primary aluminum production.
Carbon anodes were manufactured from the raw material involving petroleum coke, a
binder pitch, and recycled spent anodes. The use of recycled anodes allowed the company
to minimize the raw material cost and natural resource depletion. The existing anode
plant has only limited-expansion capacity potential (P1D, 2D, & 4D, March 2017).
Figure 36 shows that the company incurred USD 102 extra charge as its purchased
carbon anodes overseas. The company increased its aluminum production capacity from
200,000 to 230,000 tons in the last decade. Increased aluminum production capacity has
exacerbated the shortage of carbon anodes requirements.
Data integration. The views developed in the two datasets set were similar as
most senior managers, and the documents reviewed highlighted that carbon anode
manufacturing cost might reduce, should the company develop in-house manufacturing
capability to fulfilling the anode consumption demand. On the other hand, purchasing
carbon anodes from a third party had some environmental and capital expenses
advantages. For instance, a company might gain opportunity overhead cost, investments
deferment, and labor costs. Figure 36 exhibits the production cost difference between the
two options: purchasing carbon anodes and developing in-house manufacturing
capability. Whereas in-house production capability might require significant investments
in a short-term, this strategy is considered as cost competitive in the long-term according
to participants.

220
Figure 36. Carbon anode costs for Company D, derived from Atlas.ti.
Note. Investment and environmental costs are excluded. Nevertheless, a fair comparison should consider these costs in the case of integrated-in-house manufacturing capability.
For a company to outsource anode production, it must have a reliable and robust
supply chain to lower transportation costs (P7D &8D, March 2017). Company D used
strategic partners and public seaport terminals for all logistic solutions, including
shipping manufactured anodes, according to a participant interviewed. Company D
signed a long-term supply contract for carbon anodes supplies, which it renews every two
years. Carbon costs per ton of Al were USD274, compared to USD177 for a high-
performing company.
Figure 36 shows that outsourcing carbon manufacturing incurred 57% extra costs
compared to in-house manufacturing. Nevertheless, because the volume of carbon anode
produced was reduced, some overhead costs could be avoided. For instance, Participant
7D stated that overhead expenses, capital expenses, environmental and raw material costs
221
were reduced. The company should conduct the net present value and internal rate of
return of options for further strategic decision-making.
Causal Condition 2: Energy Prices and Processing Inefficiencies
Two subthemes composed the energy costs and processing efficiency: contracts
efficiency (rates) and processing efficiency. Whereas the price efficiency derived from
the contractual agreements, the energy processing efficiency derived from technological
and operational capabilities.
Energy consumption efficiency.
Data source: interviews. Of participants, 88% highlighted energy consumption
inefficiency as a critical cause of high production costs. Table 15 also indicates that the
power consumption composed 14% of the codes occurrence. Company D used a highly
energy-intensive technology, for which the power consumption rate is higher than 14.5
MWh/ton Al according to two participants interviewed. Energy costs were 40% of
production costs and were expected to increase to 45% (P1D & 2D, March 2017).
Power consumption also depended on operational and electrolytic process
efficiency. The ability to operate an electrolytic cell near the thermodynamic limit of the
Hall-Heroult Process is of paramount importance to mitigate energy consumption. The
effectiveness of the material used to conduct electricity also allowed lowering power
consumption according to a senior manager. Figure 37 outlines the company’s energy
consumption efficiency compared to the benchmark.

222
Figure 37. Energy consumption efficiency for Company D, derived from Atlas.ti
Data source: document review. Of the documents reviewed, 75% identified the
high-energy consumption as a cause of high production costs. This code constituted 7%
of the code occurrence. According to documents 2D and 3D, the modernization of the
technology was yet to commence. Refurbishing consisted of introducing high-conductive
materials with a low electrical resistivity that could improve the energy consumption
efficiency. Document 3D further highlighted that saving energy and reducing carbon
dioxide emissions would come from redesigning and modernizing the current electrolytic
cell design. The report concluded that the combination of technological improvements
and operational efficiency had the potential to develop a step-change and improvement of
the production costs.
Energy price inefficiency (data source interviews). Participant 1D stated that
high electricity costs and reduced-processing efficiency caused the current high

223
production costs. Another senior manager intimated that changes in energy prices
resulted in a reduced financial performance in recent years. Figure 38 shows a significant
gap between the price paid to purchase electricity and a benchmark. The cost inefficiency
derived from two subthemes: the contractual agreements and the type of energy used.
Company’s D electricity price was 1.6 times higher than the benchmark (see Figure 38).
The company used a variable price contract; this price depended on the energy cost the
electricity provider incurred to produce energy. According to participants 6D and 8D, the
company faced the seasonal energy rates between winter and summer times.
Figure 38. Energy price inefficiency for Company D, derived from Atlas.ti.
Data integration. The power consumption inefficiency for the primary aluminum
production was 16% and 60% higher than the observed benchmark and the technical

224
requirements, respectively. The company incurred extra production costs because of
operational and technological inefficiencies. The additional charge was USD116/ton Al.
The primary energy consumption processes included carbon anode manufacturing,
casting, and alumina processing. The electricity price disadvantage also added extra costs
equivalent to USD238/ton Al. The two datasets highlighted that improvements in
aluminum production technology and operational efficiency, as well as prices efficiency,
could benefit both aluminum production cost and environmental emissions. The material
attributes also might contribute to lower the overall cell voltage through the lower
resistivity of the material.
Core Concept 1: Improving Energy Efficiency
According to a participant interviewed, Company D considered efficiency across
the full lifecycle of primary aluminum production. According to a document reviewed,
the company worked on multiple fronts to save energy. First, the company worked on
energy-efficiency initiatives across production units, including carbon-anode
manufacturing, smelting, and aluminum casting. Second, the leadership decided to
retrofit the technology to lower the current density while increasing the production
capacity. Finally, Company D was also negotiating its energy contract with the energy
supplier and the EU.
The company intended to add efficient industrial equipment and ramp up solid-
metal recycling to reducing power consumption by over 4–5% by 2018 according to a
senior manager. The senior manager also stated that power modulation was expected to

225
support achieving these aggressive goals. Operational efficiency would permit cost
savings, waste reduction, and direct environmental impact reduction.”
Causal Condition 3: Raw Material Access, Disintegration
Data source: interviews. Table 15 shows that 100% of participants considered
the lack of raw material integration as the primary cause of high production costs. This
theme composed 20% of the codes occurrence. Raw material cost accounted for 30% of
the production costs (P1D, 2D, & 3D, March 2017). The participants considered that
alumina integration, which was a missing capability, influenced the company’s business
competitiveness. The company purchased the raw material as a commodity in the market.
Most alumina suppliers started indexing alumina price based on the LME price, which
had surged by 7% because of persistent Chinese buying interest (P5D & 6D, March
2017). Participant 5D further concluded that an increased alumina cost had worsened the
company’s financial performance in 2016 through 2017.
Data source: documents review. Table 16 indicates that 50% of the reports
reviewed mentioned this missing action as a cause of high production cost. The Table
also shows that this theme composed 9% of codes occurrence. Document 1D detailed the
alumina cost ratio, which rose to 17.4% of the LME-based alumina price, from a level of
14.2% in 2014. The document indicated that a 2.8% increase in alumina price could have
a double impact on the production cost.
Data integration. The alumina disintegration influenced the company’s costs
efficiency and supply visibility. This finding was predicted in the literature based on the
change in pricing mechanism of alumina acquisition. For instance, Trench, Sykes, and

226
Robinson (2015) found a strong correlation between alumina prices and increased
China’s ongoing alumina requirements. The literature corroborated the views of
participants and the documents reviewed. The alumina price variation would have a
double impact on aluminum production based on the stoichiometric ratios of the leading
chemical reaction that reduces aluminum oxide into metallic aluminum.
Core Concept 2: Circular Economy and the Material Attributes Selection
The circular economy emerged by grouping similar codes including the material
consumption efficiency and environmental emissions. The circular economy model plays
an essential role in the preservation of resource use; it is a regenerative model for the
resources input (e.g., energy and the raw materials) as well as waste minimization.
Subtheme 1: Material-consumption efficiency
Data source: interviews. The ratio of carbon consumption to aluminum output is
417 kg C/ton, Al. This ratio was the second highest observed. Compared to a highly
efficient benchmark within the industry in the region; the company incurred additional
costs for 17 kg carbon/ton Al, corresponding to USD11/ton Al (P1D & 2D, March 2017).
The losses suffered were USD 2.5 million annually. The ratio of observed carbon
consumption to theoretical value was 1.25:1—that is, the production process consumed
25% extra material, more than the technical requirements. Material use inefficiency
derived from the low technological and current inefficiencies, ambient-air oxidization,
and low-anode quality according to participants. Figure 39 shows the carbon
consumption rate of Company D compared to the benchmark.

227
Figure 39. Carbon consumption efficiency for Company D, derived from Atlas.ti.
Observed alumina inefficiency was 0.02 kg of material consumption per kg of Al.
This additional alumina consumed reflected the losses as well as the low current
efficiency of electrolytic cells. The extra cost incurred was equivalent to USD7/ton Al,
according to a participant interviewed. Applied to the nominal production capacity, 0.02
kg of alumina loss generated additional production costs of USD1.6 million per year.
Figure 40 outlines the alumina price inefficiency. The expenses incurred were
USD89/ton, Al, annualized to USD 20million.

228
Figure 40. Alumina price efficiency for Company D, derived from Atlas.ti.
Subtheme 2: recycling and material attributes.
Data source: interviews. Of participants, 75% highlighted recycling and the
material attributes selection as a core strategy to reduce cost. This subtheme also
constituted 15% of the codes occurrence. The material characteristics analysis allowed
estimating the impact potential of the material in the business and the environment. In the
ongoing efforts to develop an environmentally responsible business, the company
invested in new recycling capabilities and high-performance materials to improve energy
efficiency according to participants (P3D, 6D, & 8D, March 2017). The company has
strategic customers who played a vital partnership role in innovation. For instance, its
partners recommended critical materials for use in manufacturing electrolytic-cell
cathodes (P5D & 6D, March 2017). Selective material attributes allowed the company to

229
reduce waste from operations, increase life cycle, maximize the recyclability at the end of
life, and improve the energy efficiency of the reduction process, according to participants
interviewed.
In addition, the company optimized costs through consolidated spending. Supply-
chain spending was one of the targeted areas the company used for cost reduction. One
participant stated, “We aggregate the material purchasing and use integrated sourcing and
procurement strategies with strategic partners. We explore competitive suppliers and
establish performance metrics that allow assessing supply costs.”
Data source: documents review. All documents highlighted the sustainable
business as a corporate social responsibility of the company. Table 17 shows that the
sustainable environment strategy composed 23% of the codes occurrence. The company
has set aggressive targets for sustainable aluminum production. For example, one of the
documents reviewed described the 2015 goal the company established to reducing
landfills by 70% and increasing solid aluminum recycling by 15% compared to the 2014
baseline. Aluminum recycling allowed reducing energy demands per ton of material
output (D2D & 4D, March 2017). Company D used strategic partners in the cement
industry to recycle the SPLM, which enabled the company to reduce its national taxes
according to a document reviewed.
Data integration. The material characteristics analysis allowed estimating the
effect potential of the material in the business and the environment. High-performance
materials allowed high-recyclability, improved energy efficiency, and increased lifecycle.

230
Improved lifecycle contributed to reducing capital expenses requirements. Investing in
recycling capabilities might allow absorbing all solid waste stored in the landfill.
Core Concept 3: Technology and R&D Capabilities
Data source: interviews. Of participants, 63% maintained that technology and
R&D capabilities contributed to reducing production cost. In addition, this theme
composed 6% of the codes occurrence. In partnership with strategic partners and
customers, the company attempted to retrofit old assets that were the cause of
inefficiency (P4D & 8D, March 2017). Two participants stated that technology allowed
the company to lower adverse alumina effects on production performance; specifically
through alumina distribution strategies and silo management. Silo management reduced
operational disturbances that affected the anode effect rate and greenhouse gas emissions,
which had significant impacts on environmental costs.
Data source: documents review. Table 17 indicates that 50% of the reports
highlighted the technological and R&D capabilities as a production cost driver. The code
frequency of the technology and R&D was 7%. Technical capabilities were discussed in
documents 3D and 4D. Documents 3D highlighted that using technological innovations
in electrolytic process, and in-house carbon manufacturing can increase the productivity
and provide a competitive advantage. The company implemented technological changes
across productions lines, improved functions, and reduced resources used per ton of
aluminum output to increase efficiency. Shepherd (2015) also found that the wrong
selection of production techniques might lead to increased production costs. Moll (2014)
and Restuccia Rogerson (2013) supported that technological capabilities require

231
allocative efficiency. According to document 3D, technology allowed eliminating
redundancies. Technology also allowed optimizing inventories and replenishments,
which contributed to lower logistics and transportation costs according to the documents
reviewed.
Data integration. The data analysis indicates that Company D used technology
for inventory management, process innovation, and to lower the cycle time to execute
activities. The company implemented technology to allow high automation of critical
functionalities such as alumina storage and distribution strategy. The high level of
automation allowed reducing human error and the cost of poor quality.
Cross-Case Analysis
Cross-Case Analysis of Companies A and B
Table 17 provides a comparison of the strategies companies A and B used to
lower production cost. Figure 41 shows a high similarity index of the codes frequency
and the overall codes pattern. Companies A seemed to place a high emphasis on three
primary themes including (a) the raw material vertical integration, (b) energy efficiency
and management, and (c) technological capabilities. Company B seemed to use sourcing
strategy and partnership more intensively than company A did. The two companies
shared a similar vision regarding productivity, plant utilization, and materials
consumption efficiency. Nevertheless, company B had a balanced portfolio of strategies
across the six core concepts. These concepts incorporated (a) energy management and
price efficiency, (b) raw material integration, (c) productivity and plant utilization, (d)

232
material consumption efficiency, (e) technological and R&D capabilities, and (f)
purchasing strategies.
Table 17 also shows that the views of participants from the two companies
converged significantly. I compared the aggregate frequency of participants and
documents from the two companies to assess the thematic convergence. The only
significant discrepancy observed was related to purchasing strategy, which seemed
stronger in company B (75%) than company A (44%). Similarly, whereas the use of
partnership in Company B was 88%, Company A exhibited only 31% of the documents
reviewed and the senior managers who highlighted the use of this theme as an intervening
concept to reduce production cost.
Table 17
Cross-Case Analysis of Companies A and B
Total Code
OccurrenceCompany_
A
Code Frequency Company_
A
Total Code Occurrence Company_
B
Code Frequency Company_
B
Frequency of Participants and
Documents_ Company_A
Frequency of Participants and
Documents_ Company_B
RQ1_Energy_Efficiency 29 23% 25 17% 94% 88%
RQ1_Raw Material Vertical Integration
29 23% 22 15% 81% 75%
RQ1_Productivity_Plant Utilization
15 12% 19 13% 81% 69%
RQ1_Purchasing Strategies 12 9% 16 11% 44% 75%
RQ1_Sourcing 7 5% 19 13% 56% 75%
RQ1_Strategic Partners 4 3% 17 11% 31% 88%
RQ1_Material Consumption Efficiency
12 9% 13 9% 56% 63%
RQ2_Capabilities (Technology/Design)
20 16% 18 12% 56% 88%
Totals: 128 100% 149 100%

233
0%
5%
10%
15%
20%
25%R
Q1
_E
ne
rgy
_E
ffic
ien
cy
RQ
1_
Ra
w_
ma
teri
al_
a
cqu
isit
ion
(V
ert
ica
l…
RQ
1_
Pro
du
ctiv
ity
_P
la
nt_
uti
liza
tio
n
RQ
1_
Pu
rch
asi
ng
_S
tra
teg
ies
RQ
1_
So
urc
ing
RQ
1_
Str
ate
gic
_P
art
n
ers
RQ
1_
Str
ate
gie
s:
Ma
teri
al…
RQ
2_
Ca
pa
bil
itie
s
(te
chn
olo
gy
,…
Code
Frequency_Company_A
Code
Frequency_Company_B
Figure 41. Codes frequency of Companies A and B
Cross-Case Analysis of Companies C and D
Table 18 exhibits the core themes that companies C and D used to reduce costs.
The table also outlines causal conditions that led to high production costs. Figure 42
shows some similarity of the codes frequency and the overall codes pattern. Figure 42
reveals that two patterns were established: the first one was related to causal conditions
that led to high production costs. These conditions were comprised of the lack of raw
material integration, insufficient carbon anode manufacturing capacity, and energy
consumption inefficiency. The European Commission (2013) found that these factors
composed 70-75% of the production costs. Miltenburg (2005) cautioned that budgetary
constraints and the lack of investments influence long-term decision-making and lead to a
trade-off among options. Gallegos et al. (2012) discussed the ways that inappropriate
investments are a risk for businesses. Limited investments in production systems may
234
lead to insufficient production initiatives (Miltenburg, 2005). Gallegos et al. (2012)
further discussed that although disinvestments can produce financial benefits in the short-
term, the adverse consequences may be overwhelming should a manager fail to integrate
market potential and variations to long-term production strategies.
The second pattern involved the concepts that companies C and D used
intensively to reduce production costs. These Themes included operational excellence
and plant productivity, environmental sustainability strategy, and sourcing strategy.
Technology appeared a weak point in these two companies according to participants
interviewed. Shepherd (2015) and Farrell (1957) cautioned that inadequate technological
capabilities might lead to reduced technical efficiency, which has an impact on
production cost.
Table 18 also shows the convergence of views based on the aggregate frequency
of participants and documents that mentioned causal conditions leading to high
production cost, and intervening conditions to reduce the costs. The only significant
discrepancy observed was related to technological and R&D capabilities that seemed to
show a higher weight in Company D (56%) than in Company C (31%).

235
Table 18
Cross-Case Analysis of Companies C and D
Total Code Occurrence Company C
Code Frequency Company C
Total Code Occurrence Company D
Code Frequency Company D
Frequency of Participants and Documents Company C
Frequency of Participants and Documents Company D
RQ1_Missing Capability: Energy Efficiency
18 13% 14 11% 81% 81%
RQ1_Missing Capability: Raw Material Integration
26 19% 20 16% 94% 75%
RQ1_Operational Excellence/Productivity
16 12% 17 14% 63% 81%
RQ2_Limited Anode Manufacturing Capacity
15 11% 9 7% 88% 69%
RQ1_Purchasing_Strategies
8 6% 9 7% 50% 69%
RQ1_Sourcing 17 12% 21 17% 69% 94%
RQ1_Strategic_Partners 8 6% 3 2% 38% 31%
RQ1_Strategies Circular Economy
23 17% 22 18% 81% 88%
RQ2_Capability Technology/R&D
7 5% 8 7% 31% 56%
Totals: 138 100% 123 100%

236
0%2%4%6%8%
10%12%14%16%18%20%
RQ
1_
Mis
sin
g_
act
ion
_E
ne
r
gy
_E
ffic
ien
cy
RQ
1_
Mis
sin
g_
Act
ion
_ra
w
_m
ate
ria
l_in
teg
rati
on
RQ
1_
Op
era
tio
na
l
Exc
elle
nce
(e
ffic
ien
cy)
RQ
2_
Lim
ite
d A
no
de
Ma
nu
fact
uri
ng
Ca
pa
city
RQ
1_
Pu
rch
asi
ng
_S
tra
teg
i
es
RQ
1_
So
urc
ing
RQ
1_
Str
ate
gic
_P
art
ne
rs
RQ
1_
Str
ate
gie
s_e
nvir
om
e
nta
l _
sust
ain
ab
ilit
y
RQ
2_
Ca
pa
bilit
ies_
Te
chn
ol
og
y_
R&
D
Code Frequency_Company_C
Code Frequency_Company_D
Figure 42. Codes Occurrence Companies C and D Compared.
Cross-Case Analysis: Companies A_B Compared to Companies C_D
Based on the analysis and the data interpretation outlined in the cross-case
analysis section, no one strategy seemed to fit all requirements to reduce production
costs. With increasing environmental challenges, alumina market fragmentation, energy
costs, and the prices volatility of commodities, strategies to produce aluminum were
expected to exhibit different patterns. In fact, believing that all primary aluminum
producers are similar—and recommending a one-dimensional production strategy would
be complicated, and potentially unrealistic. Tables 19 through 22 outline some of the
strategies the companies used.

237
Table 19
Overview of the Companies’ Strategies: Company A
Intervening Concepts
Production Function Components
Key Features Company A
Geographical Location
Transportation Costs
Low Transportation Costs
The plant’s facilities were located strategically and integrated with a port terminal in central Europe. The production units were close to its principal customer base. This location provided advantageous transportation costs compared to its competitors for the supply of the raw materials.
Energy Management and Modulation
Energy type and Contracts
Nuclear Energy is Carbon-Emission Free
The power source was nuclear-based. The company used long-term fixed contracts, which provided long-term cost visibility.
Energy Efficiency
Price Efficiency
The Price efficiency of around USD 29.2/MW provided a competitive cost advantage (price or contract efficiency). This contract also provided competitive security of energy supplies. The company used energy modulation to increase efficiency.
Technology and Operational Efficiency; Skilled Workforce
The specific energy consumption was 12.7 MWh/ton Al. The cost of inefficiency was USD 5/ ton Al compared to the observed benchmark. The energy gap compared to the theoretical requirement was 3.67 MWh/ton Al output, equivalent to USD 107/ ton Al. The technological capability supported high current creep and production volume (economies of scale), which resulted in reduced marginal fixed costs. The company used energy modulation to increase cash inflow.
Material and Technological Capabilities
Carbon Anode Manufacturing Capability and Efficiency
Cost Efficiency The cost of carbon per ton of aluminum produced was USD 185. The company had a full capacity for the carbon anode in-house manufacturing. It optimized carbon anode life in electrolytic cells.
Technology and Operational Efficiency
The company exhibited average performance for the carbon consumption intensity. The carbon consumption efficiency was around 68 % compared to the theoretical requirements of 0.333 kg C/kg Al. The company derived productivity improvement from operational excellence. Anodes requirement for its electrolysis were manufactured internally.
Alumina Acquisition and Consumption Efficiency
Price Efficiency
Alumina supply: 100% mining ownership providing lower alumina costs than competitors. The cost incurred was around USD 371/ton alumina. The mining ownership provided a competitive security of supply. The company might not face the raw material prices volatility and pricing divergence from the traditional LME index.
Technology and Operational Efficiency
The low-cost aluminum production technology increased the company’s cash generation and profits. The alumina consumption inefficiency rate was only 0.02 kg/Kg of aluminum produced, corresponding to 7 USD/ton of aluminum output.
Circular Economy
Environmental Sustainability
Technology and Operational Efficiency
The company invested in breakthrough technologies for purifying and recycling gasses. It strived to reduce, recycle, and reuse solid materials of its process. The material to recycle was processed in specialized furnaces. The company used cathodic materials exhibiting specialized attributes. In addition, it had a clear strategy for SPL and residual aluminum management.
Note. This chart is a Bitmap picture; double click and expand to enhance the readability.
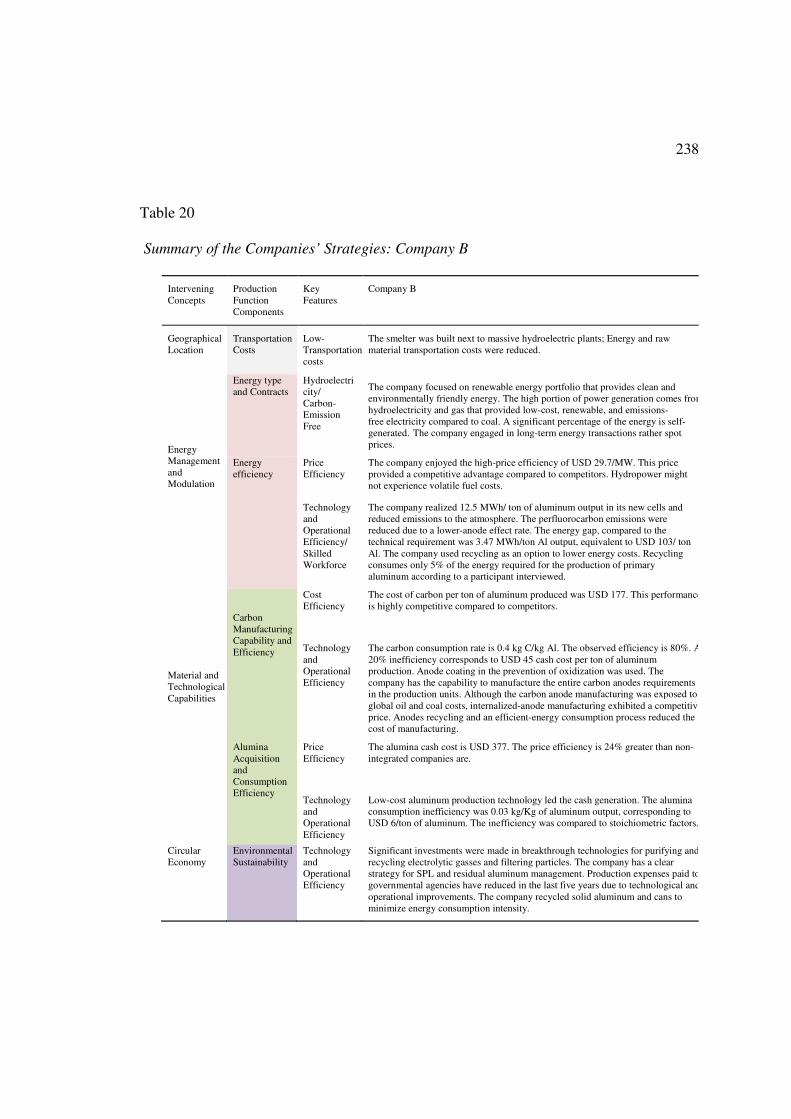
238
Table 20
Summary of the Companies’ Strategies: Company B
Intervening Concepts
Production Function Components
Key Features
Company B
Geographical Location
Transportation Costs
Low-Transportation costs
The smelter was built next to massive hydroelectric plants; Energy and raw material transportation costs were reduced.
Energy Management and Modulation
Energy type and Contracts
Hydroelectricity/ Carbon-Emission Free
The company focused on renewable energy portfolio that provides clean and environmentally friendly energy. The high portion of power generation comes from hydroelectricity and gas that provided low-cost, renewable, and emissions-free electricity compared to coal. A significant percentage of the energy is self-generated. The company engaged in long-term energy transactions rather spot prices.
Energy efficiency
Price Efficiency
The company enjoyed the high-price efficiency of USD 29.7/MW. This price provided a competitive advantage compared to competitors. Hydropower might not experience volatile fuel costs.
Technology and Operational Efficiency/ Skilled Workforce
The company realized 12.5 MWh/ ton of aluminum output in its new cells and reduced emissions to the atmosphere. The perfluorocarbon emissions were reduced due to a lower-anode effect rate. The energy gap, compared to the technical requirement was 3.47 MWh/ton Al output, equivalent to USD 103/ ton Al. The company used recycling as an option to lower energy costs. Recycling consumes only 5% of the energy required for the production of primary aluminum according to a participant interviewed.
Material and Technological Capabilities
Carbon Manufacturing Capability and Efficiency
Cost Efficiency
The cost of carbon per ton of aluminum produced was USD 177. This performance is highly competitive compared to competitors.
Technology and Operational Efficiency
The carbon consumption rate is 0.4 kg C/kg Al. The observed efficiency is 80%. A 20% inefficiency corresponds to USD 45 cash cost per ton of aluminum production. Anode coating in the prevention of oxidization was used. The company has the capability to manufacture the entire carbon anodes requirements in the production units. Although the carbon anode manufacturing was exposed to global oil and coal costs, internalized-anode manufacturing exhibited a competitive price. Anodes recycling and an efficient-energy consumption process reduced the cost of manufacturing.
Alumina Acquisition and Consumption Efficiency
Price Efficiency
The alumina cash cost is USD 377. The price efficiency is 24% greater than non-integrated companies are.
Technology and Operational Efficiency
Low-cost aluminum production technology led the cash generation. The alumina consumption inefficiency was 0.03 kg/Kg of aluminum output, corresponding to USD 6/ton of aluminum. The inefficiency was compared to stoichiometric factors.
Circular Economy
Environmental Sustainability
Technology and Operational Efficiency
Significant investments were made in breakthrough technologies for purifying and recycling electrolytic gasses and filtering particles. The company has a clear strategy for SPL and residual aluminum management. Production expenses paid to governmental agencies have reduced in the last five years due to technological and operational improvements. The company recycled solid aluminum and cans to minimize energy consumption intensity.

239
Table 21
Overview of the Companies’ Strategies: Company C
Intervening concepts
Production Function Components
Key Features Company C
Geographical Location
Geographical Location
High-Transportation Costs
The company was located away from port terminals facilities and used road transportation for shifting the raw material. The raw material (RM) was delivered via ships. From the port facilities, the RM was transported to the smelter via a conveyor belt. Nevertheless, the company was located close to its leading customers' base.
Energy Management and Modulation
Energy type and Contracts
Hydroelectricity and nuclear power
The company used a mixed of nuclear and hydropower for its electrolytic cells. The power plant was connected to the public grid. The energy cost was proportional to electricity generation cost (variable prices contract). The cost was indexed based on the operating expenses of the nuclear power plant. The Company strived to reduce the prices through a public-private partnership (PPP) arrangement.
Energy
Efficiency
Price Efficiency Energy accounted for 35% of the production cost and amounted USD 41.8/
MW. This price provided a competitive disadvantage compared to
competitors. The cost inefficiency was 49% compared to a regional
benchmark.
Technology and
Operational
Efficiency;
Skilled
Workforce
The gap between the current energy consumption and the theoretical
requirement was 5.7 MWh/ton Al. This gap incurred direct cash costs of USD
234/ton Al. The technological and operational inefficiencies caused 62.7% of
the extra energy consumption.
Material Capabilities
Carbon Manufacturing Capability and Efficiency
Cost Efficiency While in-house manufactured anodes generated direct cash costs of $217 USD, the similar anodes bought from China increased the direct cost by 22% due to transportation costs and the exposure to the raw material price volatility. Nevertheless, overhead, labor, and environmental expenses might offset these costs.
Technology and
Operational
Efficiency
The company had a limited capability to manufacture carbon anodes for its
electrolytic process. Only 60-65 % of the anodes were made in-house; the
remainder was purchased from China. The Carbon Plant required retrofitting
to meeting the energy efficiency and aluminum production requirements. The
anode consumption ratio to aluminum output was 0.420 kg C/kg Al, 5%
above the regional benchmark. The cost incurred was USD 13/ton aluminum
production. Technological and operational efficiencies induced 27% of this
additional cost compared to the theoretical requirements.
Alumina
Acquisition
and
Consumption
Efficiency
Price Efficiency The company purchased alumina at the market prices: These prices were
confronted with uncertainty. The alumina cash cost was USD 456/ton Al. The
price inefficiency was 26% higher than a low-cost company was (integrated
upstream and midstream). The company lacked competitive security for the
supply of the raw material in the long-term because it purchased the material
at spot prices.
Technology and
Operational
Efficiency
Observed alumina consumption inefficiency was 0.03 kg per kg of aluminum
produced. The inefficiency induced additional cost of USD 7.5/ton Al. This
inefficiency was related to lower current efficiency compared to technical
expectations.
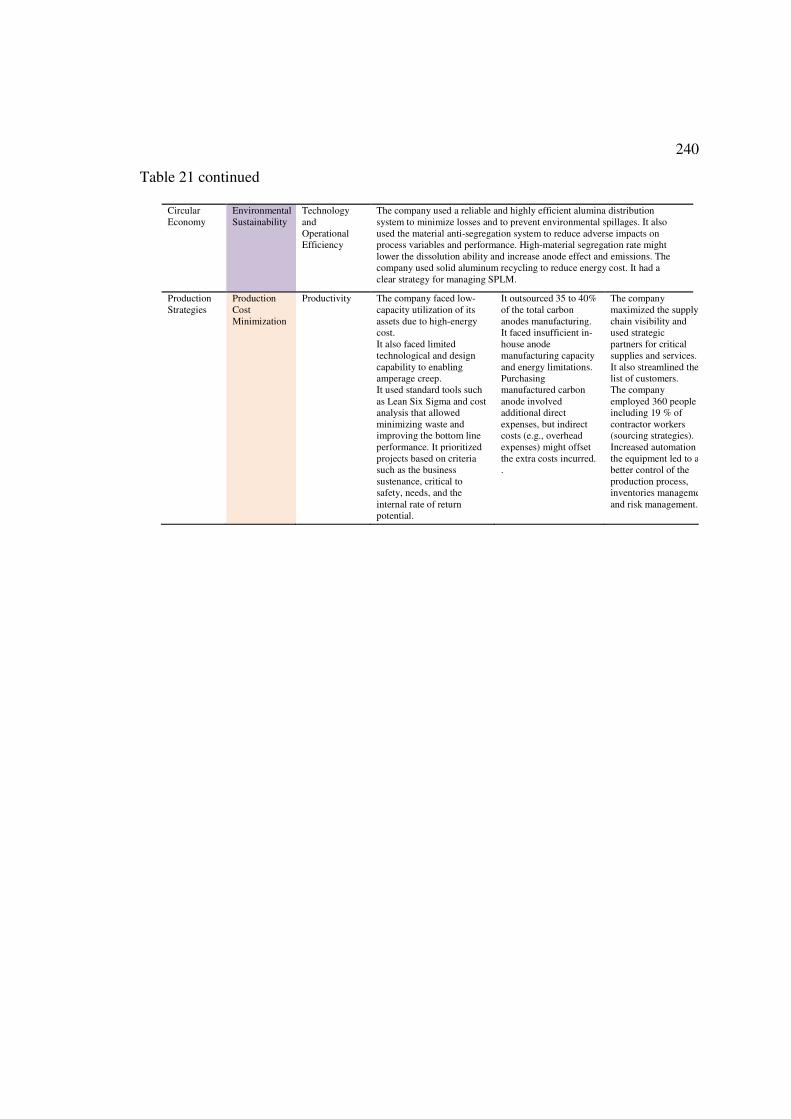
240
Table 21 continued
Circular Economy
Environmental Sustainability
Technology and Operational Efficiency
The company used a reliable and highly efficient alumina distribution system to minimize losses and to prevent environmental spillages. It also used the material anti-segregation system to reduce adverse impacts on process variables and performance. High-material segregation rate might lower the dissolution ability and increase anode effect and emissions. The company used solid aluminum recycling to reduce energy cost. It had a clear strategy for managing SPLM.
Production Strategies
Production Cost Minimization
Productivity The company faced low- capacity utilization of its assets due to high-energy cost. It also faced limited technological and design capability to enabling amperage creep. It used standard tools such as Lean Six Sigma and cost analysis that allowed minimizing waste and improving the bottom line performance. It prioritized projects based on criteria such as the business sustenance, critical to safety, needs, and the internal rate of return potential.
It outsourced 35 to 40% of the total carbon anodes manufacturing. It faced insufficient in-house anode manufacturing capacity and energy limitations. Purchasing manufactured carbon anode involved additional direct expenses, but indirect costs (e.g., overhead expenses) might offset the extra costs incurred. .
The company maximized the supply chain visibility and used strategic partners for critical supplies and services. It also streamlined thelist of customers. The company employed 360 people including 19 % of contractor workers (sourcing strategies). Increased automation of the equipment led to a better control of the production process, inventories managementand risk management.

241
Table 22
Overview of the Companies’ Strategies: Company D
Intervening concepts
Production Function Components
Key Features Company D
Geographical Location
Geographical Location
High-Transportation Costs
The company was located away from port terminal facilities. Imbalance of supplies for freight transportation services created additional inventories. This geographical location provided a disadvantageous position for transportation costs and inventories management. .
Energy Management and Modulation
Energy type and Contracts
Hydroelectricity and nuclear power
The company was on variable power cost contracts with the electricity suppliers. The power suppliers were paid a fixed percentage of the world ingot price, which varied based macroeconomic factors such as the demand level and oil prices.
Energy
Efficiency
Price Efficiency The technology was energy intensive. The power consumption rate was 14.5
MWh/ton aluminum output. The technological inefficiency impact on
production expenses was 5.47 MWh/ton aluminum production. The energy
price disadvantage was USD 238/ton Al, annualized to USD 55 million.
.
Technology and
Operational
Efficiency;
Skilled
Workforce
The technology consumed 14.5 MWh/ton of aluminum produced. The
energy consumption inefficiency was higher 16% and 60% compared to
observed benchmark and the technical efficiency requirements respectively.
The direct additional production cost involved due to operational or
technological inefficiencies was USD 116/ton of aluminum output,
annualized to USD 26.7 million.
Material Capabilities
Carbon Manufacturing Capability and Efficiency
Cost Efficiency The Company signed a long-term supply contract for carbon anodes; the contract is renewed every two years. The cost of carbon per ton of aluminum produced was USD 274 compared to USD 177 for the high-performing company. Nevertheless, positive environmental impacts due to reduced emissions and energy use to manufacture carbon anode might offset the total costs. Net production cost, considering environmental benefits might be lower than the values mentioned thereof.
Technology and
Operational
Efficiency
The carbon consumption ratio to aluminum output was about 0.417 kg
C/kg, Al. The production process consumed 25% of additional material due
to low technological and operational efficiencies. The technical and
operational inefficiency impact corresponded to USD 11/ton aluminum
output compared to the observed benchmark. This cost was annualized to
USD 2.5 million. .
Alumina
Acquisition
and
Consumption
Efficiency
Price Efficiency Alumina cash cost was around USD 460/ton. Extra cost incurred compared to
the observed benchmark was USD 89/ton of aluminum produced, which can
be annualized to USD 20 million.
Technology and
Operational
Efficiency
Observed alumina inefficiency was 0.02 kg of alumina consumption per kg
of aluminum produced equivalent to USD 7/ton of aluminum output,
annualized to USD 1.6 million. The alumina consumption inefficiency was
compared to the technical efficiency requirement
.

242
Table 22 continued
Circular Economy
Environmental Sustainability
Technology and Operational Efficiency
The company used the material attributes analysis to estimate the effect of its material potential in the business and the environment. For instance, the material properties allowed extending the cell lifespan and might also reduce capital costs. The management of SPL allowed overcoming environmental challenges and costs. The company used solid metal recycling to reduce energy use.
Production Strategies
Production Cost Minimization
Productivity The company employed 500 permanent employees and 140 contractor workers (sourcing strategies). The insourcing rate was 21%, higher than the competitors. The company insourced non-core activities. The company exhibited a low-asset utilization capacity restricted by the high energy costs and technological limits. The company used strategic partners in the cement industry to recycle the spent lining material (SPLM).
The company strived to negotiate energy contracts. Power modulation strategy was used to increase the cash inflow. Power modulation involved sound technical capability and skilled workforce. The company reduced cost through operational excellence and the productivity improvements. .
The company used strategic partners to optimize the supply chain performance. It produces high-quality aluminum, which provides premiums. The company established aluminum supplies to downstream business to minimize transportation costs. I used forward agreements to sell an amount of aluminum at a specified future date. A forward agreement protects the company from the risks of uncertainty in prices.
In mapping the themes based on data integration from the two primary sources
and the cross-case analysis, six core concepts were isolated (see Figure 43). These six
core concepts were the categories that exhibited a significant weight in the matrix of
categories that unfolded. The repeated statements or viewpoints that were similar from all
data sources (e.g., high frequency) denoted the weight. The six strategies, namely energy
management and efficiency, raw material integration, circular economy, operational
excellence and productivity, technological capability, and raw material consumption
efficiency composed the concepts of interest.

243
Figure 43. Production strategies aluminum companies use to reduce costs, derived from
Atlas.ti.
Core Concept 1: Energy Consumption and Price Efficiency
The theme Energy consumption and price efficiency arose from the subthemes
involving energy tariffs and contracts, energy-processing efficiency, energy self-
generation, technological efficiency, and energy management options. Whereas
participants from Companies C and D acknowledged the impacts of these elements on
production costs, they also highlighted the deficiencies of these capabilities in their
production functions. Similarly, most participants highlighted that technological and
R&D capabilities influenced production costs. Nevertheless, companies C and D faced
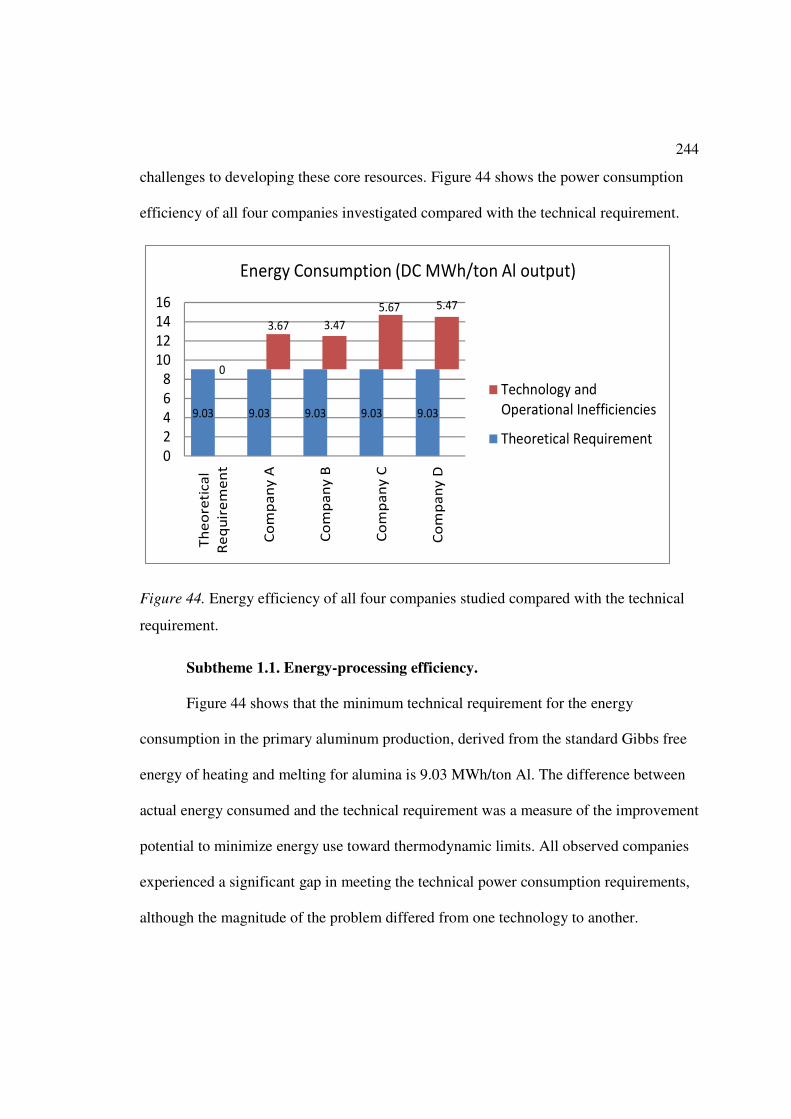
244
challenges to developing these core resources. Figure 44 shows the power consumption
efficiency of all four companies investigated compared with the technical requirement.
9.03 9.03 9.03 9.03 9.03
0
3.67 3.47
5.67 5.47
0
2
4
6
8
10
12
14
16
Th
eo
reti
ca
l
Re
qu
ire
me
nt
Co
mp
an
y A
Co
mp
an
y B
Co
mp
an
y C
Co
mp
an
y D
Energy Consumption (DC MWh/ton Al output)
Technology and
Operational Inefficiencies
Theoretical Requirement
Figure 44. Energy efficiency of all four companies studied compared with the technical
requirement.
Subtheme 1.1. Energy-processing efficiency.
Figure 44 shows that the minimum technical requirement for the energy
consumption in the primary aluminum production, derived from the standard Gibbs free
energy of heating and melting for alumina is 9.03 MWh/ton Al. The difference between
actual energy consumed and the technical requirement was a measure of the improvement
potential to minimize energy use toward thermodynamic limits. All observed companies
experienced a significant gap in meeting the technical power consumption requirements,
although the magnitude of the problem differed from one technology to another.

245
Whereas data revealed a constraining energy inefficiency gap for all companies,
there was a difference between Companies (A and B) on the one side and Companies (C
and D) on the other. Companies A and B consumed less energy than Companies C and D
did by a magnitude of 16.7%. Part of this result was predictable because of two driving
cost factors: (a) Companies A and B were modernized aluminum plants; whereas,
Companies C and D were aging plants that required modernization. (b) Technological
and operational capabilities also differed from these two groups of companies.
Subtheme 1.2: Energy management and price efficiency compared.
Figure 45 outlines the energy cost components and the sources of inefficiencies. Two
important concepts explained the observed pattern. These concepts were the basis for
comparing aluminum company efficiency in buying and consuming energy: the energy
price efficiency and the technological and operational efficiency. These important
concepts were discussed in the literature that analyzed the implications of public
information for cost efficiency and the costs of capital (Elliott, Hobson, & White, 2015;
Han, Tang, & Yang, 2016).
The cost efficiency of energy and its consumption rate affected production costs,
according to a participant interviewed. Contrary to inefficient markets in which energy
prices may not always include all discounted values, in an efficient market, energy
contracts and prices should be efficient because they reflect publicly available
information. In an efficient market, aluminum companies that purchase electricity should
determine the power contract portfolios that enable the maximum expected return
(minimum production costs) for various levels of risk in their business model. Companies

246
C and D incurred an additional cost of USD184 and 254, respectively, because of the
price inefficiencies. I compared the observed and benchmark prices in the same
geographical location to determine the cost efficiency.
Figure 45. Energy cost efficiency of all four companies compared with a benchmark or
baseline.
Subtheme 1.3: Energy type and emissions. Companies A and B used low-cost,
renewable energy portfolios to capture midstream value such as low environmental and
energy costs, according to participants interviewed and documents reviewed. All
companies implemented electrolytic cell voltage reduction and the material attribute
analysis to reduce electricity consumption intensity and environmental emissions.
Whereas the power consumption difference between the benchmark and the
companies studied was a valuable measure of the opportunities of improvement for low-
performing companies, the gap between the energy use and the theoretical minimum

247
remained most compelling. Some sovereign governments have compounded the energy
costs by emissions taxation on power producers. These costs were also charged to
customers such as aluminum producers. The differences in energy consumption intensity
among companies offered significant trade-offs regarding costs and the subsequent
emission levels (carbon footprints), which were subject to national taxes. Examining the
energy use difference between the two-paired samples would indicate where valuable
technological and operational capabilities should be developed to reduce energy cost.
Efficient technology and energy consumption, and the resulting carbon footprint would
be the differentiator for corporations that wish to promote process quality and social
responsibility.
Core Concept 2: Technological and Operational Efficiencies
Technical and operational inefficiencies were determined by using a similar
approach as outlined previously. The technology and quality of operations influenced the
production costs. Companies C and D incurred additional production costs of USD83 and
84, respectively, compared to the benchmark. The evidence that Company A curtailed
and modernized most of its high-cost capacities, to deliver regional-leading performance
through high-productive assets, might explain the performance observed. Company B
also has upgraded most of its assets to target low-energy consumption assets.
Core Concept 3: Upstream Integration and Prices Efficiency
Backward alumina integration derived from the need to mitigate alumina supply
uncertainty and companies' interdependence with dominant suppliers, and to protect
companies from price volatility. An increased alumina price index not only influences

248
production costs but also offsets gains on real aluminum prices because the alumina
prices fluctuations have a double impact on the aluminum output cost based on
stoichiometric factors. As most suppliers tend to link alumina index pricing to LME, this
pricing strategy had disadvantageous economic costs for primary aluminum producers,
according to a participant interviewed. Companies A and B exhibited lower alumina
prices because they integrated their upstream activities. Mines ownership and alumina
supplies security allowed the companies to drive low costs and generate cash. A strategic
focus on low-cost capabilities, and upstream activities for obtaining alumina supplies
were a fundamental pillar for Company A. One document reviewed highlighted that
alumina ownership was a competitive security. Conversely, Companies C and D
purchased alumina on the market and incurred additional production costs of USD94 and
102 per ton of product output, respectively. A fair comparison of costs opportunity,
however, should include investment cost for producing alumina.
Core Concept 4: Material-Consumption Efficiency
Subtheme 4.1: Alumina consumption efficiency. Figure 44 indicates similarities
among the four companies regarding the alumina consumption rate. Alumina was lost
during aluminum processing through volatilization because of its fine particle size and
high attrition rate during transportation and handling, necessitating tight controls and
procedures to limit losses. Most companies have designed and built low maintenance,
environmentally friendly systems for optimal material transportation and handling, from
ships to in-plant systems incorporating conveying and pressure vessel capability,
according to documents reviewed. The system was designed to minimize alumina

249
attrition, which was the partial cause of waste. Overall, material heterogeneity influences
material efficiency and environmental emissions when fine and coarse particles are
segregated. The documents reviewed also indicated that anti-segregation technology for
alumina storage maintained uniform grain-size distribution when materials were
conveyed. When companies reduced attrition and increased homogenous material, they
also reduced anode effects and greenhouse gas emissions and reduced energy use
according to most participants interviewed.
Figure 46. Alumina costs of all four companies compared with technical requirements.
Subtheme 4.2. Carbon-manufacturing capability and consumption.
Whereas Companies A and B could manufacture carbon anodes in their production
plants, Companies C and D did so only partially. The latter group purchased some carbon
anodes already made from China. This strategy had significant direct impacts on

250
production costs. The total additional production costs incurred equal to USD31 and 89
per ton of aluminum output for companies C and D, respectively. Figure 45 (left)
indicates that carbon anode consumption efficiency was 30–36% lower than the
stoichiometric requirement for all companies. Companies C and D exhibited the lowest
carbon utilization efficiency. Participants related this factor to technological and
operational capabilities.
Although the carbon consumption showed a similar pattern among all four
companies, the difference still, was observed vis-à-vis the technical requirements and the
observed performance as well as the price efficiency. Carbon-consumption efficiency
depended on the quantity of material used, its quality, recyclability, and its reusability.
From the environmental standpoint, improving the material efficiency enabled the
greenhouse gas reduction, which had significant impacts on production costs.
Figure 47. Carbon expenses of all four companies compared: components of carbon cost
(left); the difference between the theoretical and observed consumption (right).

251
Anode-material quality is of paramount importance because its consumption rate affects
the production cost per ton Al. The material quality influenced not only use efficiency,
but it also was a determinant of the energy efficiency and productivity of the electrolytic
process.
Core Concept 5: Sustainable Operation and Productivity Improvements
Increased productivity and operational excellence were the core concepts
implemented across the four aluminum plants. This critical concept derived from seven
subthemes: (a) plant utilization, (b) sourcing, (c) waste minimization, (d) refurbishing
high-cost assets, (e) improving operational practices, (f) prioritizing capital expenses, and
(g) skilled labor. Company A increased productivity through the material and inventory
management increased the asset lifecycle and consolidated the performance. For
example, in the electrolytic process, increased anode size allowed the company to
increase the current input and the production volume, according to a participant
interviewed.
Although current creep allowed aluminum producers to reduce the fixed cost-per-
unit output, production could not increase relentlessly because the law of diminishing
marginal returns might be applicable. According to Ellington et al. (2014), for a given
combination of inputs, most optimization processes face depreciating efficiencies. When
a production unit nears the maximum, its profitability decreases because its marginal
production costs tend to increase (Ellington et al., 2014). Participants stated that
Company A considered all direct and indirect costs that contributed to the plant
efficiency to evaluate net present value analysis (the cumulative difference between the

252
current value of cash inflows and outflows of an option). The company also assessed the
capacity utilization to estimate the maximum amount of output potential given existing
resources.
In turn, Company B focused on the efficiency of resources and innovative
processes that minimized waste and material use. Its profitability margins were also
supported by a highly automated and innovative technology, a substantial technical
expertise, and customer experience, according to documents reviewed. Documents
reviewed also indicated that experienced management teams enabled and drove the value
creation and maximization at all levels of the production chain. An example of the value
maximization was increased production volumes while maintaining input quasi-constants
and reducing working capital. Both Companies A and B maximized value creation by
increasing asset utilization.
The workforce-sourcing rate for these companies was in the ranges of 10–15% for
Companies A and B and 17–21% for Companies C and D (see Figure 48). Insourcing
involved bringing in contractors to accomplish temporary activities or non-core tasks that
a manager would otherwise outsource. Insourcing or Outsourcing strategy was used to
reduce fixed costs and increase flexibility (Porter, 1980). On a unit of material output
basis, Companies C and D incurred higher person-hours than Companies A and B (Figure
48, left), revealing a higher full-time equivalent (FTE). Companies C and D attempted to
intensify insourcing strategy to balance the high-FTE effect on production costs.

253
Figure 48. Productive hour (left) and production capacity (right) of all four companies
compared.
Crespi and Zuniga (2012) found that innovative firms have higher labor
productivity when compared with noncreative companies. Applying technological
capabilities can enable producers to use resources efficiently, providing an economic
advantage (Crespi & Zuniga, 2012; Dosi et al., 2015). Innovativeness can be linked to the
ability to adjust the methods and techniques or to engineer a production process to
increase its efficiency.
Core Concept 6: Sustainable Environment and Circular Economy
The circular economy also received a definite consensus because most
participants highlighted the benefits regarding the energy minimization and material use,
reduced governmental taxes and emissions, and the protection of the natural resources.
The lifespan of an electrolytic cell ranged from 5 to 7 years, depending on the
technological capability and electronic density crossing a cell cathode, according to a

254
participant interviewed. At the end of its life, companies demolished the electrolytic cell,
and the SPLMs, which were polluted with various chemicals, such as aluminum carbide,
sodium, toxic fluoride, and cyanide compounds. The SPLM must be recycled using a
proper safety protocol to minimize waste and environmental contamination. Holywell
and Breault (2013) found that most companies often confine SPLMs at the production
sites, placed in landfills or containers, or employed in other industries as raw material.
Holywell and Breault also found that many environmental institutions list the SPLM
generated in the aluminum electrolytic process as hazardous waste. This dangerous
material requires companies to implement rigorous operational safety, not only by the
supplying company for shifting and storing but also by the buying company in storing
and processing the material. Recovery and recycling techniques for SPLM exist but are
expensive to implement given their uneconomic returns, according to a participant
interviewed. The process of decontaminating and recycling these corrosive materials can
be a source of significant expenses from both the operationalization and the national
taxes standpoints. The European Commission (2014a) found that environmental costs in
the production of primary aluminum account for approximately 8–13% of the production
costs, evidencing disparities among companies.
Because the SPLM is an end-of-life product; as such, its potential value might not
cover the costs of decontamination, transportation, and processing. Because of this effect,
companies must conduct net present value analysis to decide the best financial options for
handling the SPLM. In either case, the company must either invest in internal capabilities
for decontaminating and processing the material or pay costs associated with the

255
elimination of SPLM pollution when the responsibility for processing is outsourced. Most
companies found local partners for handling and processing the SPLM. National
governments no longer accept inaction vis-à-vis the management of the SPLM, and the
failure to handle the materials appropriately might result in financial liabilities from a
regulatory standpoint and a reputational perspective—both of which affect production
costs.
Literature review Analysis
I used the economic theory of production and production costs as the conceptual
framework to provide a foundational scheme for analyzing the data and comparing the
strategies the four aluminum production companies implemented to reduce production
costs. The economic theory of production and production costs includes four significant
concepts related to a production system’s performance: (a) technical efficiency, (b)
factors of production, (c) production costs, and (d) the rate of technological substitution
(Cobb & Douglas, 1928). Factors that affect production costs include machine and
technical capabilities, labor skills (Chauhan & Singh, 2013), quality (Herrmann &
Kayasa, 2012), processing efficiency (Farrell, 1957), and resource allocation and use
(Bartelsman et al., 2013; Cobb & Douglass, 1928). Casadesus and Zhu (2013) found that
technological superiority and innovative business models are critical factors of business
performance to reduce production costs.
Shepherd (2015) and Wicksteed (1894) defined the production function as a
combination of factors used in a process to yield outputs. Cobb and Douglas (1928) and
Wicksteed (1894) found that each production function consists of different stages.

256
Production managers may adjust input utilization to increase or decrease outputs.
Notwithstanding, a manager may face increasing returns to scale (IRS), constant returns
to scale (CRS), or diminishing returns to scale (DRS; Restuccia & Rogerson, 2013). CRS
and DRS may arise in cases where management does not control input levels
adequately—in such circumstances production costs might increase (Cook et al., 2014).
Miltenburg (2005) and Oke (2013) found that a production system provides many
outputs against which to measure performance. These outputs include production costs,
flexibility, quality, efficiency, and innovation. Restuccia and Rogerson (2013) and Jones
(2011) found that the optimal combination of production factors depends on the
effectiveness of the allocative resources at each operational level and the alignment
among organizational units. With this understanding, a complete analysis of a
production-function efficiency to reduce costs includes two principal components: (a)
allocative efficiency and (b) technical efficiency (Haelermans & Ruggiero, 2013; Jones,
2011; Restuccia & Rogerson, 2013). Farrell (1957) further divided technical efficiency
into two distinct elemental constituents: input and output efficiency. Input-output
efficiency is the ratio of the total value of the products and services obtained from a
production process to the set of resources used given technological capabilities (Fang et
al., 2013). Jones (2011), Farrell (1957), and Fang et al. (2013) found that a higher input-
output efficiency refers to an efficient allocation and a rational use of inputs. The frontier
method also termed the “directional distance function” (Tovar & Wall, 2015) can be
suitable for comparing the production performance of different companies. The frontier

257
analysis helps to determine the extent to which a production manager can stretch inputs
and yield allocative resources to reduce production costs.
The energy use of production implies both high power usage and high carbon
dioxide concentration (Gutowski et al., 2013). High energy and material consumption
affect production costs and incur additional environmental taxes, should a company fail
to address regulatory requirements. According to technical efficiency paradigms (Farrell,
1957), companies may adjust their energy and raw material usages to minimize the costs
of inputs (input efficiency). Reh (2013) idealized the concept of reducing, recycling, and
reusing (RRR) as a circular economy—a practice that can affect not only production
outputs but also material inputs. Regarding resource capacity constraints, circular
economies might make sense as a strategy for reducing production costs in resource-
intensive industries.
Applications to Professional Practice
The network exhibited in Figure 47 outlines the strategies that the four companies
used to reduce production costs. Companies A and B (blue rectangles) were those that
lower costs and Companies C and D (orange boxes) did not. I coded different and similar
strategies the companies use in the diagram. This network was a type of Venn diagram,
consisting of multiple overlapping concepts that the companies used to reduce cost. The
overlapping areas were intersection points or areas of partial convergence. The domains
of total convergence were in the middle of the chart. I outlined the areas of discordance
or singularity separately near the rectangle representing each company. I positioned
similar strategies between the two codes of the companies. For instance, Companies D

258
and C faced similar challenges, limiting their ability to reduce costs. These challenges
included limited technological capabilities to increase production, high prices of raw
material, and energy cost and processing inefficiencies. In addition, because market
dynamics tend to drive commodity prices, Companies C and D that did not own bauxite
mines, faced price pressure of the raw-material prices volatility.
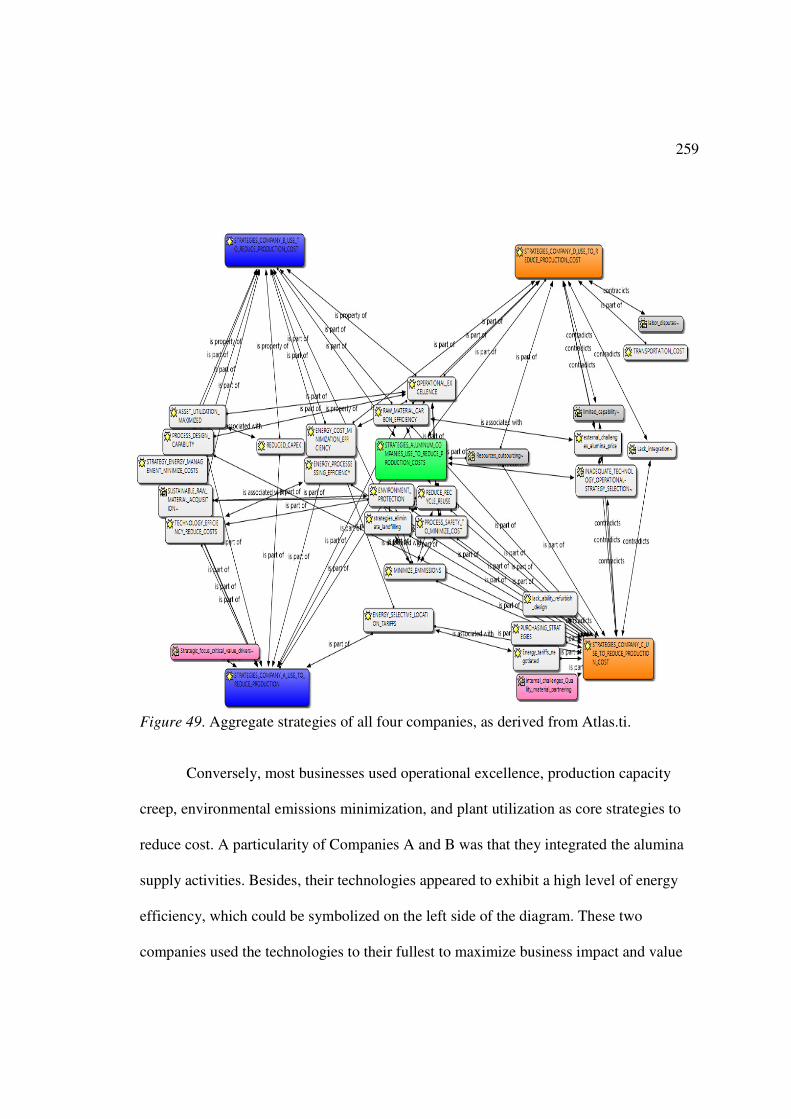
259
Figure 49. Aggregate strategies of all four companies, as derived from Atlas.ti.
Conversely, most businesses used operational excellence, production capacity
creep, environmental emissions minimization, and plant utilization as core strategies to
reduce cost. A particularity of Companies A and B was that they integrated the alumina
supply activities. Besides, their technologies appeared to exhibit a high level of energy
efficiency, which could be symbolized on the left side of the diagram. These two
companies used the technologies to their fullest to maximize business impact and value

260
creation. The companies had a clear strategic focus on low-cost assets that maximized the
returns. On the contrary, Companies C and D faced different challenges—in particular,
rising alumina prices, energy costs, and a shortage of capabilities to manufacture carbon
anodes.
Vertical Integration and Prices Efficiency
Aluminum businesses faced challenges unique to their models of activities and
contexts as well as regarding their energy and alumina contracts. For example, the lack of
upstream and midstream integration affected the production costs of Companies C and D.
Blair and Kaserman (2014) found that price variations in resource acquisition have an
impact on a company’s production cost structure; nevertheless, the effect might reduce
when the resources are integrated. Miltenburg (2005) and Porter (1980) identified the
conditions under which suppliers may affect the production costs of buying companies.
First, the industry downstream is disintegrated; that is, the supplier-to-downstream
concentration ratio is high (Radetzki, 2013). Second, no substitute products are available
for the buyers. Finally, the supplier’s product is critical for the industry downstream.
Integrating the upstream activities influences vertical and horizontal competition as well
as the price structure of the product under consideration (Glock & Kim, 2015).
Backward integration occurs when a company in the downstream of a given
supply chain decides to integrate upstream activities in its business (Lin et al., 2014).
Backward integration can allow convenient access to the strategic raw material while
improving purchasing activities, production coordination (Miltenburg, 2005; Porter,
1980), and price efficiency. Price efficiency allows a company to reduce the cost of

261
inputs and is part of a firm’s technical efficiency (Farrell, 1957). Vertical integration
provides benefits such as enhanced planning, improved forecasting predictability, and
replenishment quality (Glock & Kim, 2015; Jin et al., 2013). Backward integration also
allows an aluminum company to bypass dominant suppliers in the industry upstream and
the alumina-pricing index based on the LME. Ping et al. (2013) argued that because raw
material prices for nonferrous metals have been rising worldwide, upstream integration in
this industry could make sense. According to Lin et al. (2014), however, upstream and
downstream integrations tend to intensify competition.
Technological and R&D Capabilities and Capacity Utilization
Technical capabilities provided a competitive advantage to Companies A and B
and restricted Companies C and D from increasing the production capacity. Although a
more revolutionary technology for producing primary aluminum is needed in today’s
competitive environment to curb production costs, Companies A and B demonstrated
some advances with their designs to provide sustainable prices, at least in the middle
term. For instance, the R&D activities in Companies A and B promoted technological
learning, derived from firms’ engagement in networking of relations with other aluminum
companies in the same field (Participants 1A, 2A, 2B, & 4B, March 2017). The
networking also promoted training and problem-solving opportunities that were factors in
the cost minimization.
Miltenburg (2005) and Porter (1980) found that capacity utilization was of
paramount importance in high capital-intensive businesses with high fixed costs. Farrell
(1957) argued that technological capability was a factor in capacity utilization. In

262
Companies A and B, R&D was an enabler to provide knowledge to drive technical
process abilities and capacity utilization (D1A & 2B, March 2017). Capacity can improve
economies of scale (increased volumes), increase productivity, and spread fixed costs.
Candelise, Winskel, and Gross (2013) found that production costs decreased significantly
in systems in which the production doubled given the technology and quasi-fixed inputs.
Jones (2011) found that the misallocation of core resources leads to revenue
differences among companies. Furthermore, Jones maintained that aligning appropriate
technologies to business realities might allow a company to develop a competitive edge
rapidly. Restuccia and Rogerson (2013) showed that many firms lose money because
they fail to produce at optimum efficiency. The knowledge of the production frontier
based on the factors of production such as energy, labor, raw material, capital, and
technological capabilities, could allow enhancing the plant and resources utilization.
Scholars agree that differences in technical efficiency emerge from the misallocation of
core resources and technology insufficiencies, both of which affect production costs
(Baik et al., 2013; Moll, 2014; Restuccia & Rogerson, 2013).
Energy Management and Efficiency
Companies A and B modulated the energy usage by operating production systems
with nonlinear energy input. The decision to shift from the linear energy input to a
nonlinear model was based on the average price realized and the internal rate of return of
options. These companies were competitive regarding power costs and electricity
contracts. In the aluminum industry, energy costs range from 25–45% of the total
aluminum output costs; for Companies A and B, power prices ranged from 28–30%. The

263
companies’ energy efficiency was approximately 60% from the theoretical baseline.
Gutowski et al. (2013) found that implementing low-cost capacity machines or replacing
high-cost technologies might provide high-energy efficiency. Companies A and B
divested or curtailed high-cost assets. Lucio et al. (2013) found that energy self-
generation in the primary aluminum business is a competitive factor. Lucio et al. also
found that strategic energy management in a production system contributes to improving
electricity consumption through the flexible operation and option-pricing methods (Liu et
al., 2014).
Companies consider two demand curves in energy management: one for peak and
the other for off-peak periods (Gaudard & Romerio, 2014). In Western Europe, public
electricity demand is higher in winter than in summer. Given the periodic availability and
temperature-dependent capacity profiles (Gils, 2014), many power producers face
challenges responding to the market demand for electricity in winters. The energy deficit
and its substantial pricing implications in wintertime in urban areas provide an
opportunity for many aluminum companies to improve the plant performance. The
seasonal implementation of imports or exports could allow balancing or offsetting high
production costs in the context of slumping aluminum prices. The internal rate of return
must be assessed precisely by identifying all direct and indirect costs of options as well as
their technical implications for the business. For example, some companies negotiate
contractual terms in such a way that electricity providers carefully schedule periodic
maintenance from soaring electricity demand to lower demand periods. From the
perspective of an electricity provider, demand response through import and export
264
strategies on the power grid is a mechanism to overcome stringent planning of network
reinforcement.
Based on the real options model for value developed by Dockendorf and Paxson
(2013), and given the complexity of the aluminum electrolytic process, companies might
interrupt part of the production for exporting energy should the internal return of the
option exhibit a desirable behavior. Notwithstanding, interrupting the process might
entail significant structural and infrastructural costs. For instance, when a company
curtails a production line and endeavors to restore it, people and assets face operational
risks (Bastian-Pinto et al., 2015). Skilled workers are needed to provide high-quality
conditioning, retrofitting, and re-energizing of the cells. Technically, it is possible for
aluminum producers to minimize losses by reducing a percentage of the current input
while maintaining a reasonable thermal balance in the electrolytic cells. Figure 48 shows
a conceptual pattern for seasonal energy management in aluminum production.
Nevertheless, this option is only available in a short-term; companies should consider
additional technological and operational efficiencies for reducing energy use.

265
Figure 50. Seasonal energy management/modulation for aluminum producers.
Energy Tariffs and Contracts
Energy tariffs and the type of contracts aluminum companies used varied widely
in price. Prices efficiency depended on the electricity contract type (e.g., fixed-power
price contracts, variable-power price contracts, or other contracts), for which prices
varied significantly from one company to another. Fixed-rate contracts remained constant
for the contractual period and provided long-term visibility of production costs. In
variable-power price contracts, the electric companies were paid a fixed percentage of the
aluminum commodity price (LME). In this arrangement, energy costs decreased when
aluminum prices decreased; reciprocally when aluminum increased energy prices
increased. In the other types of contracts, the aluminum producer refunded the amount
proportional to the expenses incurred to produce electricity. This kind of arrangement
presented different levels of uncertainty, including a dependence on the energy supplier’s
business model and context, which might be disconnected from the aluminum-
commodity pricing mechanism on the LME. The cost of electricity also varied according
Energy Importation
Energy Exportation
Linear Energy Supply or
Equilibrium

266
to the primary energy source used (coal, nuclear, fuel, hydroelectricity), because most
European countries have integrated carbon and energy prices since 2008 (Ahamada &
Kirat, 2015). Coal and fuel were the most expensive energy sources. Aluminum
companies that used nuclear or hydropower had a competitive advantage in energy
prices.
Focusing on High-Returning Assets
Companies A and B used similar strategies focusing on high-economic returning
assets. Whereas Companies A and B were in the lowest quartile in the industry cost
curve, Companies C and D were in the highest quartile. Being a low-cost producer was a
key driver for sustaining the commodity price pressure. Companies C and D might face
significant challenges in a falling aluminum price context. These two companies incurred
significant costs because they failed to retrofit high-cost technologies adequately or
efficiently (Participants 1C, 2C, 2D, & 5D, March 2017). Given that energy contributed
to approximately 40% of the production costs, technologies for which energy efficiency
was below 45% from the theoretical baseline should be retrofitted given the small return.
The return on assets is a gauge of the assets' profitability, which is an indication of its
quality, and how well a production manager can utilize the asset to make a profit. The
higher the return, the more cost efficient the asset is in earnings generation and reducing
production cost. High-returning capabilities that supported low production costs
comprised upstream integration, carbon-manufacturing capability, energy efficiency,
Low-cost assets, and long-life cell lining.
267
Operational Excellence and Productivity
Most companies considered operational excellence (OE) and environmental
sustainability as the baseline for sustaining and consolidating performance. Operational
excellence is a practice that business people use to maximize quality while minimizing
waste. The OE is implemented through a robust problem-solving ability involving the
optimization of existing production processes, which results in a continuous improvement
(Tsiotras, 2014). Operational excellence stresses the application of a variety of tools and
principles with the aim of developing a culture that yields sustainable improvements.
Another attribute of operational excellence is high information–capability systems (Youn,
Yang, Kim, & Hong, 2014). These attributes apply to aluminum production given its
resource-intensive characteristic.
Information capability can allow a company to reduce operating costs along the
value chain through purchasing strategies. The information capability also allows a
company to enhance its relationship with strategic suppliers, mitigate supply chain risks,
and learn continually. Chopra and Sodhi (2014) found that supply-chain risk is associated
with cost efficiency. A high-quality information system in the supply chain network
facilitates knowledge acquisition, which is linked to cycle times and supply chain costs.
The quality of information promotes innovation and enhances responsiveness (Suresh,
2014).
Real-time data transmission from an electrolytic cell to the control room operator
was another information capability that could permit the acknowledgment of problems
and a timely diagnosis. A high level of automation also provided operational resilience
268
and the additional ability for operational risk management. Aluminum production
managers might use these practices to enable asset reliability, resulting in increased
lifespan of critical assets, and reduced capital expenses. Finally, Tate, Ellram,
Schoenherr, and Petersen (2014) found that skilled labor was a critical competitive factor
driving operational excellence and business sustainability.
Circular Economy
Product end-of-life management was a significant challenge for most aluminum
producers. Business leaders should begin financing R&D for alternative scenarios in the
future era of the industrial ecology. Most companies started thinking about the material
attributes or breakthroughs in materials science to capture the value-added and to
implement designs that enhance the recyclability and reusability of the material input into
the aluminum smelting process. Alternative scenarios of standards for energy and
material efficiencies and reusability criteria must be produced (Niero, Hauschild,
Hoffmeyer, & Olsen, 2017) for further generation of electrolytic cells. Health,
recyclability, and reusability are challenges facing not only the aluminum industry but
also the general community and policymakers.
Most aluminum companies that were studied had a transparent approach to
managing the sector’s end-of-life material, the SPLM. The strategy consisted of working
with strategic partners in the cement industry to decontaminating, recycling, and reusing
the SPLM. Some companies set aggressive targets for increasing the recycling rate of
waste while reducing landfilling. These actions not only create value for stakeholders but
also reduce production and environmental costs.

269
Implications for Social Change
This research has implications for positive social changes because companies can
implement a circular rather than a linear economy to reduce costs while maintaining the
biodiversity prosperity. Reducing waste, energy, and emissions—recycling solid
aluminum and the derivative process waste, and reusing these materials are approaches
strongly supported in the circular–economy model. Primary aluminum production is a
resource- material- and energy-intensive process that generates a significant amount of
greenhouse gases and solid waste. This process causes extraction of large quantities of
raw materials and uses millions of megawatts of electricity.
For industrial ecology, the current production model requires a strong
commitment from business owners to minimize operational and technological impacts.
This research provided a comprehensive framework of discussion and paved the path for
exploration of alternatives solutions of production because it outlined the technical gap
among technologies. The circular economy approach applied in aluminum production is a
necessary, sustainable alternative to its linear counterpart.
The circular-economy paradigm implemented in this study referred to a business
model that generated minimum waste and pollution and that used minimum amounts of
materials and energy. It is a model in which technological and operational practices must
be crafted to restoring and regenerating resources through material substitution and
recycling. Aluminum producers should embrace this model for an apparent reason
associated with growing solid-waste management and emissions burdens. In
implementing the circular economy approach, a company might realize greater

270
productivity through a more sustainable resource use and decreased environmental
impacts. For example, Company B used internal capabilities (furnaces) for recycling the
solid metal collected from the casting process. Besides, Companies B and C intensified
solid-aluminum recycling to minimize the use of material and energy. These strategies
not only reduced costs paid to governmental agencies but also contributed to the
prosperity of the ecosystem.
Recommendations for Action
The data of this study indicated that low-cost aluminum producers had a balanced
portfolio of strategies for most of the industry’s production cost drivers. These companies
also had a focused strategy for each cost driver (energy, raw material, carbon,
environmental sustainability, and low-cost assets). Data indicated that energy and
material use mainly affected production costs. Businesses that integrated alumina
supplies (backward integration) appeared more cost effective than those that purchased
alumina at spot prices. A balanced alumina position or self-supply seemed to provide
competitive supply security and a certainty of cost visibility (long-term action).
Critical components of energy costs comprised price efficiency, energy
management or modulation, operational efficiency, and energy self-generation. Price
efficiency depended on the electricity contract type (e.g., fixed-power price contracts,
variable-power price contracts, or other contracts), for which prices varied significantly
from one company to another. Fixed-rate contracts remained constant for the contractual
period and provided long-term visibility of production costs. In variable-power price
contracts, the electric companies were paid a fixed percentage of the aluminum

271
commodity price (LME). In this arrangement, energy costs varied proportionally to
aluminum prices. In other types of contracts, the aluminum producer refunded the amount
proportional to the expenses incurred to produce electricity. This contractual arrangement
presented different levels of uncertainty, including a dependence on the energy supplier’s
business model and context, which might be disconnected from the aluminum commodity
pricing mechanism on the LME.
Companies should use long-term market outlook to analyze various market
options to select the option that maximizes the return (minimum prices) and yields
minimal risk. In conclusion, companies must be well versed in the tactics of leveraging
the best choice through a public-private partnership in a liberalized energy market (short-
term action). Ultimately, aluminum companies should negotiate long-term power deals
that provide stable energy costs. Operational practices and technological capabilities
allow the company to minimize energy consumption and to implement a circular
economy. Companies need to set aggressive annual targets to reduce energy use
considering the theoretical minima and the thermodynamic limits as the long-term goal.
For example, increased energy efficiency by 1–2% annually might allow significant cost
reduction. This realistic goal would foster research breakthroughs and disruptive
technologies (medium-term action). Companies should import or export energy to the
grid depending on the attractiveness and the net present value of options to improve price
efficiency. Companies may conduct internal rate of returns analyses to ensuring efficient
value creation (short-term action). Aluminum companies can use the highly productive
circular economy and minimize energy consumption, waste, and environmental
272
emissions to reduce environmental costs. This shift of activity is expected to boost a
company’s competitiveness while focusing on business economics and fostering
sustainable environmental benefits. Aggressive targets are needed to strengthen resource
efficiency, minimize waste, and grow the recyclability. For instance, goals should include
(a) reuse 90% of the process waste, (b) recycle and reuse 100% of the solid aluminum
waste, and (c) reduce SPLM landfilling to a maximum of 5% by 2025.
Companies can generate cash using selective assets with higher returns. High-cost
assets might be retrofitted to minimize energy consumption and increase production
capacity, which allows improving plant productivity (medium-term action). Finally,
operational excellence provides a robust problem-solving ability involving the
optimization and consolidation of existing production processes that often result in
continuous improvements. Operational excellence emphasizes the application of a variety
of tools and principles with the aim of developing a culture that yields sustainable
improvements.
Stakeholders who might benefit from this research include primary aluminum
producers in Western Europe, academic practitioners, and business consultants.
Policymakers also might be interested in the findings regarding natural resource
preservation and regulation, energy use minimization, and the benefits of the circular
economy. By exploring technologies that minimize the resources and energy use
intensity, companies might contribute to environmental protections that support sovereign
states’ energy and resources policies. Future research may use these findings to test
hypotheses and add to the body of knowledge. This research will be communicated

273
beyond the conventional medium of academic journals. Initially, I will disseminate the
research results in context, building trust incrementally, and then I will move to broader
channels such as seminars, international aluminum conferences, and business workshops.
Recommendations for Further Research
Despite the current technological advances in operating standards, aluminum
producers must still maintain a clear focus on sustainable values that are central industrial
problems. Apparently, the most significant opportunities for productivity improvement
include (a) minimizing energy and material use (alumina, cathodes, and carbon), (b)
developing an efficient circular economic model that integrates the material properties to
expand the recyclability of waste, and (c) increasing electrolytic cell life cycle.
Heterogeneous current distribution across the cathodic surface drives the heterogeneous
erosion of the cathodic material. Cathode lining material, as input in the Hall–Héroult
process, has always been a capital-intensive component. Too often, when the cathodic
material fails in running cells, only 30-40% of the material is used; the remainder is
treated and handled as waste. New generations of technologies should provide optimal
solutions to increasing cathode lifespan while maintaining the homogeneous erosion
across its surface. This performance might improve the aluminum cell life, productivity,
energy efficiency, and could lower capital cost. Regarding the energy efficiency, new
long-term technological capabilities should consider energy recovery and storage to slash
overall carbon emissions. Storage capacity, coupled with smart demand management,
might allow companies to absorb and reuse the excess energy wasted during processing.
Finally, R&D teams should answer the following question: what material attributes can

274
enable aluminum producers to meet stringent environmental and efficiency standards
while reducing production costs. The new breakthroughs in materials science should
achieve the trifecta of conductivity, durability, and sustainability.
Reflections
A highly productive circular economy is the path to which aluminum companies
might need to move the business forward to curb the current linear production model that
generates excess waste and emissions, and which uses material and energy intensively.
The current aluminum production model induces a significant pressure on finite resources
and increases the problem of resource depletion. The circular economy model may allow
aluminum producers to curb environmental burdens. The benefit of the circular economy
model is the sustainability of the aluminum production process. As companies are
becoming increasingly concerned regarding waste generation as well as increasing
emissions and their long-lasting effects on the world’s ecosystem, aluminum producers
have the opportunity to advance the material attributes to meeting these challenges. The
aluminum energy-processing and material consumption efficiencies ranged from 45–60%
and 70–80% respectively; energy waste as heat loss from the electrolytic cells was over
40-45%. The carbon wasted (20-30%) was oxidized during the electrolytic process,
resulting in greenhouse gases. If the heat lost from the electrolytic cells, which is
estimated to exceed millions of megawatt hours annually could be recovered or reused
upstream or downstream, significant advances in energy use would result.
The Hall-Héroult electrolysis is an energy-intensive process; notwithstanding,
companies can still innovate beyond the traditional model of operation and push the

275
boundaries of energy consumption efficiency. The levels of efficiency exhibited
previously offer a scope for potential gains given the gaps between the current
performance of 13.3 MWh/ton Al and the theoretical and thermodynamic limits of 9.03.
Notwithstanding the performance achieved so far in high-performing companies,
production managers must overcome multiple technical barriers before the industry
reaches sustainable performance. Still, the economic gain potential, including cost
reduction and environmental benefits for both the aluminum companies and their
communities, are worth funding the R&D. In the future, companies might maximize
productivity through regenerative resources (energies and materials) and sustainable
environments (zero landfilling and minimal emissions to the atmosphere). Improvements
expected in the future include the following: (a) Technological progress—the discovery
of a breakthrough technology that will revolutionize aluminum production to minimize
energy and material intensities. (b) Waste minimization—a continuous challenge for
aluminum producers; (c) Increased electrolytic cell lifespan, (d) Product end-of-life
management—implementing aluminum post-sale tracking with the aim of developing a
recycling system and maximizing its benefits.
Regarding the energy management and modulation, switching between
production options (e.g., suspending part of operations based on energy price incentives)
requires a company to develop strategic technical flexibility. Scholars describe strategic
flexibility as the ability to acknowledge a change in the marketplace, adapt production
systems, and allocate resources for new directions to realize higher performance (Zhang,
Juan, & Xiao, 2015).

276
Summary and Study Conclusion
This study allowed identifying the strategies aluminum companies might use to
reduce production costs. I found that low-cost aluminum producers had a balanced
portfolio of strategies for most production cost drivers and a focused strategy for each
cost driver. No cost driver was left out, and no driver dominated. Reducing production
costs requires a company to promoting technical efficiency capabilities, a state of
production that necessitates a clear vision and an efficient allocation of resources at
distinct levels of the production system. The study indicates that aluminum production is
a resource-intensive process; companies should aim to be technically efficient, by
operating the production functions near the production limits of the core resources. The
production frontier is the maximum output achievable with minimum resources use. The
technical efficiency measures the ability of an aluminum company to maximize outputs
for a given set of inputs. Production managers might use the production-function analysis
method to monitor the firm’s efficiency.
I also found that material consumption and acquisition mainly influenced
production costs. Businesses that integrated alumina supplies (backward integration)
were more cost effective than those that purchased alumina at spot prices. A balanced
alumina position or self-supply might provide a competitive supply security and the
certainty of price visibility. Cost optimization depends not only on the proper selection of
production capabilities but also on the access to the raw material and energy at efficient
prices.
277
Price efficiency of energy depended on the electricity contract type (e.g., fixed-
power price contracts, variable-power price contracts, other contracts), for which prices
varied significantly from one company to another. Competitive power rates are the basis
for a sound primary aluminum business plan. Without a competitive electricity price,
primary aluminum producers might lack competitiveness. Prices inefficiency might result
from distortions in the supply-demand dynamism, influencing the cost of input. A firm's
internal characteristics (information capability, highly trained and experienced workforce,
continuing technological adaptation to new stringent shareholders’ expectations) might
allow mitigating buying costs.
Notwithstanding, some companies lack a measurement system of production
frontier, technical efficiency, and allocative efficiency to assess accurately to what extent
a manager can make improvements to production factors utilization to drive cost-saving
opportunities. The knowledge of these measurements might permit to determine different
stages of production: increasing returns to scale (IRS), constant returns to scale (CRS), or
diminishing returns to scale (DRS). DRS may arise in cases of high consumption of
inputs, an overuse of resources, and a misallocation of resources that can lead to
increased marginal unit cost.
Operational practices and technological capabilities allow a company to minimize
energy consumption. Companies might set aggressive annual targets for reducing energy
use, considering the theoretical minima and thermodynamic limits as a long-term goal.
For example, increasing energy efficiency by 1–2% annually might provide a significant

278
cost reduction. Raising the energy efficiency requirement would foster research
breakthroughs and disruptive technologies.
From the methodological standpoint, the qualitative method was appropriate to
explore the portfolio of strategies to reduce production cost. The methodology, which
was based on the constructivist and interpretivism worldview, empowered the data
collection and analysis and provided a thick and rich description of different and
contrasting production strategies. According to interpretivism, individuals and companies
are each different, and reality is complicated to apprehend; people understand reality in a
variety of ways. The flexibility of the qualitative research method allowed close
interactions with participants. The quality of the documents reviewed enhanced the
information quality.
The qualitative method provided the flexibility of the data collection based on
new insights that some senior managers suggested. Without these insights, I could not
have covered the aluminum production strategies at a granular level and from various
angles. The multiple comparative case study design was beneficial for three essential case
study characteristics: (a) it allowed the application of different data-gathering strategies
to permit in-depth inquiry about complex issues. (b) It allowed the analysis of four
different strategies developed in the companies’ economic contexts. Finally, (c) the
purposeful sampling maximized the information strength and provided an extended range
of perspectives that allowed analyzing and understanding competing explanations. The
business and economic context influenced the companies’ performance. Most companies
adopted production strategies based on internal and external factors. Given the sampling

279
size and characteristics, this multiple case study design can provide both critical and
theoretical transferability of the findings. Some limitation nevertheless affected the data
collection quality, because I could not negotiate the permission for entry to perform site
observations. Most companies were reluctant about issues of confidentiality. These
restrictions limited the possibility to observe core process and assets, although the
participants and documents provided a wealth of information to overcome such
shortcomings.

280
References
Achtenhagen, L., Melin, L., & Naldi, L. (2013). Dynamics of business models:
Strategizing, critical capabilities and activities for sustained value creation. Long
Range Planning, 46, 427–442. doi:10.1016/j.lrp.2013.04.002
Adamczak, M., Domanski, R., Hadas, L., Cyplik, P. (2016, June). The integration
between the production-logistics system and its task environment: Chosen
aspects. Proceedings of the 8th IFAC Conference on Manufacturing Modelling,
Management and Control MIM 2016: Troyes, France.
doi:10.1016/j.ifacol.2016.07.771
Addington, D., McKenzie, E., Addington, J., Patten, S., Smith, H., & Adair, C. (2014).
Performance measures for early psychosis treatment services. Psychiatric
Services. doi:10.1176/appi.ps.56.12.1570
Ahamada, I., & Kirat, D. (2015). The impact of phase II of the EU ETS on wholesale
electricity prices. Revue d'économie Politique, 125, 887–908. Retrieved from
https://www.cairn.info/revue-d-economie-politique.htm
Ahmed, M. U., Kristal, M. M., & Pagell, M. (2014). Impact of operational and marketing
capabilities on firm performance: Evidence from economic growth and
downturns. International Journal of Production Economics, 154, 59–71.
doi.10.1016/j.ijpe.2014.03.025.
Ajmal, M., Hussain, M., Kristianto, Y., & Tenkorang, A. R. (2012). A study of
technology adoption in manufacturing firms. Journal of Manufacturing and
Technology Management, 23, 198–211. doi:10.1108/17410381211202197

281
Alborzi, M., Nazemi, J., Salimian, H., & Shavarini, K. S. (2013). Operations strategy and
business strategy alignment model (case of Iranian industries). International
Journal of Operations and Production Management, 33, 1108–1130.
doi:10.1108/ijopm-12-2011-0467
Allen, C. R., Fontaine, J. J., Pope, K. L., & Garmestani, A. S. (2011). Adaptive
management for a turbulent future. Journal of Environmental Management, 92,
1339–1345. doi:10.1016/j.jenvman.2010.11.019
Amini, S., Kazemi, N., & Marzban, A. (2015). Energy optimization of traditional and
modern farms of broiler production using data envelopment analysis approach.
Elixir Agriculture 81, 32005–32010. Retrieved from
https://www.researchgate.net/profile/Sherwin Amini2/publication/283090795
Energy Optimization of Traditional and Modern Farms of Broiler Production
using Data Envelopment Analysis
Approach/links/562a894d08ae04c2aeb1aaf9.pdf
Anyan, F. (2013). The influence of power shifts in data collection and analysis stages: A
focus on qualitative research interview. The Qualitative Report, 18, 1–9.
Retrieved from http://www.nova.edu/sss/QR/index.html
Aristovnik, A., Seljak, J., & Mencinger, J. (2013). Relative efficiency of police
directorates in Slovenia: A non-parametric analysis. Expert Systems with
Applications, 40, 820–827. doi:10.1016/j.eswa.2012.08.027
Aristovnik, A., Seljak, J., & Mencinger, J. (2014). Performance measurement of police
forces at the local level: A non-parametric mathematical programming

282
approach. Expert Systems with Applications, 41, 1647–
1653. doi:10.1016/j.eswa.2013.08.061
Ashton, S. (2014). Researcher or nurse? Difficulties of undertaking semi-structured
interviews on sensitive topics. Nurse Researcher, 22, 27–31.
doi:10.7748/nr.22.1.27.e1255
Atici, K. B., & Podinovski, V. V. (2015). Using data envelopment analysis for the
assessment of the technical efficiency of units with different specializations: An
application to agriculture. Omega, 54, 72–83. doi:10.1016/j.omega.2015.01.015
Bach, S., & Bordogna, L. (2013). Reframing public service employment relations: The
impact of economic crisis and the new EU economic governance. European
Journal of Industrial Relations, 19, 279–294. doi:10.1177/0959680113505031
Baik, B., Chae, J., Choi, S., & Farber, D. B. (2013). Changes in operational efficiency
and firm performance: A frontier analysis approach. Contemporary Accounting
Research, 30, 996–1026. doi:10.1111/j.1911-3846.2012.01179.x
Ballot, G., Fakhfakh, F., Galia, F., & Salter, A. (2014). The fateful triangle:
Complementarities in performance between product, process and organizational
innovation in France and the UK. Research Policy, 44, 217–232.
doi:10.1016/j.respol.2014.07.003
Bardou, P., Mariette, J., Escudié, F., Djemiel, C., & Klopp, C. (2014). Jvenn: An
interactive Venn diagram viewer. BMC Bioinformatics, 15, 1. doi:10.1186/1471-
2105-15-293

283
Bartelsman, E., Haltiwanger, J., & Scarpetta, S. (2013). Cross-country differences in
productivity: The role of allocation and selection. The American Economic
Review, 103, 305–334. doi:10.1257/aer.103.1.305
Baškarada, S. (2014). Qualitative case study guidelines. Qualitative Report, 19, 1–25.
Retrieved from www.tqr.nova.edu
Bastian-Pinto, C. D. L., Brandão, L. E. T., & Ozório, L. D. M. (2015). Valuing flexibility
in electro-intensive industries: The case of an aluminum smelter. Production,
(AHEAD). doi:10.1590/0103-6513.174214
Bastič, M., Ivanišević, A., Leber, M., & Mavrič, M. (2014). Value analysis as an integral
part of new product development. Procedia Engineering, 69, 90–98.
doi:10.1016/j.proeng.2014.02.207
Behmiri, N. B., & Manera, M. (2015). The role of outliers and oil price shocks on the
volatility of metal prices. Resources Policy, 46, 139–150.
doi:10.1016/j.resourpol.2015.09.004
Bennett, D. L., & Vedder, R. K. (2014). Public policy, higher education, and income
inequality in the US: Have we reached diminishing returns? Social Philosophy &
Policy, 31, 252–280. doi:10.13140/RG.2.1.3519.3763
Bianxia, S., Sharon, X. L., & Zesheng, S. (2013). The impact of monetary liquidity on
Chinese aluminum prices. Resources Policy, 38, 512–522.
doi:10.1016/j.resourpol.2013.08.002
Birchall, S. J., Murphy, M., & Milne, M. (2016). Mixed methods research: A
comprehensive approach for study into the New Zealand Voluntary Carbon

284
Market. The Qualitative Report, 21, 1351–1365. Retrieved from
http://nsuworks.nova.edu/tqr/vol21/ iss7/11
Blair, R. D., & Kaserman, D. L. (2014). Law and economics of vertical integration and
control. New York, NY: Academic Press.
Blom, H., Gustavsson, C., & Sundler, A. J. (2013). Participation and support in intensive
care as experienced by close relatives of patients: A phenomenological study.
Intensive and Critical Care Nursing, 29, 1–8. doi:10.1016/j.iccn.2012.04.002
Blomberg, J., & Söderholm, P. (2011). Factor demand flexibility in the primary
aluminum industry: Evidence from stagnating and expanding regions. Resources
Policy, 36, 238–248. doi:10.1016/j.resourpol.2011.03.002
Bonevski, B., Randell, M., Paul, C., Chapman, K., Twyman, L., Bryant, J.,…Hughes, C.
(2014). Reaching the hard-to-reach: A systematic review of strategies for
improving health and medical research with socially disadvantaged groups. BMC
Medical Research Methodology, 14, 1–29. doi:10.1186/1471-2288-14-42
Bornstein, M. H., Jager, J., & Putnick, D. L. (2013). Sampling in developmental science:
Situations, shortcomings, solutions, and standards. Developmental Review, 33,
357–370. doi:10.1016/j.dr.2013.08.003
Bouchard, K. L. (2016). Anonymity as a double-edged sword: Reflecting on the
implications of online qualitative research in studying sensitive topics. The
Qualitative Report, 21, 59–67. Retrieved from
http://nsuworks.nova.edu/tqr/vol21/iss1/5

285
Boulamanti, A., & Moya, J. A. (2016). Production costs of the non-ferrous metals in the
EU and other countries: Copper and zinc. Resources Policy, 49, 112–118.
doi:10.1016/j.resourpol.2016.04.011
Bourne, A. H., & Robson, M. A. (2015). Participants’ reflections on being interviewed
about risk and sexual behavior: Implications for collection of qualitative data on
sensitive topics. International Journal of Social Research Methodology, 18, 105–
116. doi:10.1080/13645579.2013.860747
Brailas, A. V. (2014). Networked grounded theory. The Qualitative Report, 19, 1–16.
Retrieved from http://nsuworks.nova.edu/tqr/vol19/iss8/3
Bray, E. L. (2013). Metal prices in the United States through 2010 (Scientific
Investigations Report 2012–5188). Retrieved from
http://pubs.usgs.gov/sir/2012/5188/sir2012-5188.pdf
Brown, G., Greaney, A. M., Heffernan, C., Heffernan, E., Mhaolrúnaigh, S. N., Murphy,
J., & Sheehy, A., (2012). Research ethics application: A guide for the novice
researcher. British Journal of Nursing, 21, 38–40.
doi:10.12968/bjon.2012.21.1.38
Burian, P. E., & Maffei, F. R. (2013). Operations strategy: A broader view of threading
the vision to the customer. The International Business and Economics Research
Journal (Online), 12, 1513–1520. Retrieved from
http://www.cluteinstitute.com/ojs/index.php/IBER/article/viewFile/8637/8634
Cai, H., Chen, H., Yi, T., Daimon, C. M., Boyle, J. P., Peers, C., ... & Martin, B. (2013).
VennPlex: A novel Venn diagram program for comparing and visualizing datasets

286
with differentially regulated datapoints. PLoS One, 8, e53388.
doi:10.1371/journal.pone.0053388
Camuffo, A., & Wilhelm, M. (2013). Between internal and external misfit: A
configurational perspective on the Toyota crisis. Academy of Management
Proceedings, 1. doi:10.5465/AMBPP.2013.16246a
Candelise, C., Winskel, M., & Gross, R. J. (2013). The dynamics of solar PV costs and
prices as a challenge for technology forecasting. Renewable and Sustainable
Energy Reviews, 26, 96–107. doi:10.1016/j.rser.2013.05.012
Caniëls, M. C., & Rietzschel, E. F. (2015). Organizing creativity: Creativity and
innovation under constraints. Creativity and Innovation Management, 24, 184–
196. doi:10.1111/caim.12123
Cant, M. C., Wiid, J. A., & Kallier, S. M. (2015). Product strategy: Factors that influence
product strategy decisions of SMEs in South Africa. Journal of Applied Business
Research, 31, 621–630. Retrieved from
http://cluteinstitute.com/ojs/index.php/JABR/article/viewFile/9158/9148
Cardoso, S.R., Ana Paula, F.D., Barbosa-Povoa, A.P.F.D., & Relvas S. (2013). Design
and planning of supply chains with the integration of reverse logistics activities
under demand uncertainty. European Journal of Operational Research, 226, 436–
451. doi:10.1016/j.ejor.2012.11.035
Caruth, G. D. (2013). Demystifying mixed methods research design: A review of the
literature. Online Submission, 3, 112–122. doi:10.13054/mije.13.35.3.2
287
Carvalho, P., & Marques, R. C. (2014). Computing economies of vertical integration,
economies of scope and economies of scale using partial frontier nonparametric
methods. European Journal of Operational Research, 234, 292–307.
doi:10.1016/j.ejor.2013.09.022
Casadesus, M. R., & Zhu, F. (2013). Business model innovation and competitive
imitation: The case of sponsor‐based business models. Strategic Management
Journal, 34, 464–482. doi:10.1002/smj.2022
Castillo-Montoya, M. (2016). Preparing for interview research: The interview protocol
refinement framework. The Qualitative Report, 21, 811–831. Retrieved from
http://nsuworks.nova.edu/tqr/vol21/iss5/2
Chan, Z. C., Fung, Y., & Chien, W. (2013). Bracketing in phenomenology: Only
undertaken in the data collection and analysis process. The Qualitative Report, 18,
1–9. Retrieved from http://nsuworks.nova.edu/tqr/vol18/iss30/1
Chatfield, S. L., Cooper, R., Holden, E., & Macias, K. (2014). Enhancing the experience:
A multiple case study of students' experiences using arts-based techniques in
learning qualitative research. The Qualitative Report, 19, 1–13. Retrieved from
http://nsuworks.nova.edu/tqr/vol19/iss41/3
Chauhan, G., & Singh, T. P. (2013). Resource flexibility for lean manufacturing: SAP-
LAP analysis of a case study. International Journal of Lean Six Sigma, 4, 370–
388. doi:10.1108/IJLSS-10-2012-0010

288
Chevarin, F., Azari, K., Ziegler, D., Gauvin, R., Fafard, M., & Alamdari, H. (2016).
Substrate effect of coke particles on the structure and reactivity of coke/pitch
mixtures in carbon anodes. Fuel, 183, 123-131. doi:10.1016/j.fuel.2016.06.070
Chian, K. (2013). Dynamic data envelopment analysis: A relational analysis. European
Journal of Operational Research, 227, 325–330. doi:10.1016/j.ejor.2012.12.012
Chiang, Y. H., Li, J., Choi, N. Y. T., & Man, K. F. (2012). Comparing China mainland
and China Hong Kong contractors' productive efficiency: A DEA-Malmquist
Productivity Index approach. Journal of Facilities Management, 10, 179–197.
doi:10.1108/14725961211245992
Chopra, S., & Sodhi, M. S. (2014). Reducing the risk of supply chain disruptions. MIT
Sloan Management Review, 55(3), 73. Retrieved from http://sloanreview.mit.edu/
Cleary, M., Horsfall, J., & Hayter, M. (2014). Data collection and sampling in qualitative
research: Does size matter? Journal of Advanced Nursing, 70, 473–475.
doi:10.1111/jan.1216
Cobb, C. W., & Douglas, P. H. (1928). A theory of production. The American Economic
Review, 139–165. Retrieved from http://www.jstor.org/
Coker, E., Ploeg, J., Kaasalainen, S., & Fisher, A. (2013). Assessment of rigor in
published nursing intervention studies that use observational methods. The
Qualitative Report, 18, 1–23. Retrieved from
http://nsuworks.nova.edu/tqr/vol18/iss34/1

289
Compton, M. & Barrett, S. (2016). A brush with research: Teaching grounded theory in
the art and design classroom. Universal Journal of Educational Research, 4, 335–
348. doi:10.13189/ujer.2016.040204
Connelly, L. M. (2013). Limitation section. Medsurg Nursing, 22, 325. Retrieved from
http://www.medsurgnursing.net/cgi-bin/WebObjects/MSNJournal.woa
Cook, W. D., Tone, K., & Zhu, J. (2014). Data envelopment analysis: Prior to choosing a
model. OMEGA, 44, 1–4. doi:10.1016/j.omega.2013.09.004
Cope, D. G. (2014). Methods and meanings: Credibility and trustworthiness of qualitative
research. Oncology Nursing Forum, 41, 89–91. doi:10.1188/14.ONF.
Corbin, J., & Strauss, A. (2014). Basics of qualitative research: Techniques and
procedures for developing grounded theory. Thousand Oaks, CA: Sage.
Cornish, F., Gillespie, A., & Zittoun, T. (2013). Collaborative analysis of qualitative
data. Thousand Oaks, CA: Sage.
Council on Population, Social Sciences, & National Research. (2014). Determining
minimal risk in social and behavioral research. Retrieved from
http://www.ncbi.nlm.nih.gov/books/NBK217972/
Crespi, G., & Zuniga, P. (2012). Innovation and productivity: Evidence from six Latin
American countries. World Development, 40, 273–290. Retrieved from
http://www.econstor.eu/bitstream/10419/89026/1/IDB-WP-218.pdf
Croskerry, P. (2013). From mindless to mindful practice: Cognitive bias and clinical
decision making. N Engl J Med, 368, 2445–2448. Retrieved from

290
http://www.girardslaw.com/library/from mindless to mindful practice cognitive
bias and clinical decision making redacted.pdf
Cruz, L. (2015). Self-reflexivity as an ethical instrument to give full play to our explicit
and implicit subjectivity as qualitative researchers. The Qualitative Report, 20,
1723–1735. Retrieved from http://nsuworks.nova.edu/tqr/vol20/iss10/13
Davenport, T. H. (2013). Process innovation: reengineering work through information
technology. New York, NY: Harvard Business Press.
Denzin, N. K. (2012). Triangulation 2.0. Journal of Mixed Methods Research, 6, 80–88.
doi:10.1177?1558689812437186
Ding, D. X. (2014). The effect of experience, ownership, and focus on productive
efficiency: A longitudinal study of US hospitals. Journal of Operations
Management, 32, 1-14. doi:10.1016/j.jom.2013.10.002
Dockendorf, J. & Paxson, D. (2013). Continuous rainbow options on commodity outputs:
what is the real value of switching facilities? The European Journal of Finance
19, 645–673. doi:10.1080/1351847X.2011.601663
Doody, O., & Noonan, M. (2013). Preparing and conducting interviews to collect
data. Nurse Researcher, 20, 28–32. doi:10.7748/nr2013.05.20.5.28.e327
Dosi, G., Grazzi, M., Moschella, D. (2015). Technology and costs in international
competitiveness: From countries and sectors to firms. Research Policy, 44, 1795–
1814. doi:10.1016/j.respol.2015.05.012
Earley, M. A. (2014). A synthesis of the literature on research methods education.
Teaching in Higher Education, 19, 242–253. doi:10.1080/13562517.2013.860105

291
Eckel, C., Iacovone, L., Javorcik, B., & Neary, J. P. (2015). Multi-product firms at home
and away: Cost-versus quality-based competence. Journal of International
Economics, 95, 216–232. doi:10.1016/j.jinteco.2014.12.012
Ellington, J. K., Dierdorff, E. C., & Rubin, R. S. (2014). Decelerating the diminishing
returns of citizenship on task performance: The role of social context and
interpersonal skill. Journal of Applied Psychology, 99, 748–758.
doi:10.1037/a0036102
Elliott, W. B., Hobson, J. L., & White, B. J. (2015). Earnings metrics, information
processing, and price efficiency in laboratory markets. Journal of Accounting
Research, 53, 555–592. doi:10.1111/1475-679X.12080
Elo, S., Kaariainen, M., Kanste, O., Polkki, T., Utriainen, K., & Kyngas, H. (2014).
Qualitative content analysis: A focus on trustworthiness. SAGE Open, 1–10.
doi:10.1177/2158244014522633
Esmaeilikia, M., Fahimnia, B., Sarkis, J., Govindan, K., Kumar, A., & Mo, J. (2014).
Tactical supply chain planning models with inherent flexibility: Definition and
review. Annals of Operations Research, 1–21. doi:10.1007/s10479-014-1544-3
European Commission. (2013). The state of aluminum production in Europe
(MEMO/13/954). Retrieved from http://europa.eu/rapid/press-release MEMO-13-
954 en.htm
European Commission. (2014a). DG enterprise and industry: Short-term industrial
outlook (Ref. Ares (2014)3536116 - 24/10/2014). Retrieved from
http://ec.europa.eu/geninfo/query/resultaction.jsp

292
European Commission. (2014b). Best available techniques (BAT) reference document for
the non-ferrous metals industries: Final draft, JRC Institute for Prospective
Technological Studies Sustainable Production and Consumption Unit (European
IPPC Bureau, October). Retrieved from
http://eippcb.jrc.ec.europa.eu/reference/BREF/NFM Final Draft 10 2014.pdf
Fang, C., Guan, X., Lu, S., Zhou, M., & Deng, Y. (2013). Input-output efficiency of
urban agglomerations in China: An application of data envelopment analysis
(DEA). Urban Studies, 0042098013477707. doi:10.1177/0042098013477707
Farahani, M. A., Mohammadi, E., Ahmadi, F., & Mohammadi, N. (2013). Factors
influencing the patient education: A qualitative research. Iranian Journal of
Nursing and Midwifery Research, 18, 133–138. Retrieved from
http://www.ncbi.nlm.nih.gov/pmc/articles/PMC3748569/
Farrell, M. J. (1957). The measurement of productive efficiency. Journal of the Royal
Statistical Society. Series A (General), 253–290. Retrieved from
https://www.jstor.org/journal/jroyastatsociser
Fielding, N. G. (2012). Triangulation and mixed methods design: Data integration with
new research technologies. Journal of Mixed Methods Research, 6, 124–136.
doi:10.1177/1558689812437101
Fram, S. M. (2013). The constant comparative analysis method outside of Grounded
Theory. The Qualitative Report, 18, 1–25. Retrieved from
http://nsuworks.nova.edu/tqr/vol18/iss1/1

293
Franzén, C., & Brown, G. (2013). Undergraduate degree projects in the Swedish dental
schools: A documentary analysis. European Journal of Dental Education, 17,
122–126. doi:10.1111/eje.12022
Frels, R. K., & Onwuegbuzie, A. J. (2013). Administering quantitative instruments with
qualitative interviews: A mixed research approach. Journal of Counseling &
Development, 91, 184–194. doi:10.1002/j.1556-6676.2013.00085.x
Friese, S. (2014). Qualitative data analysis with Atlas.ti. Los Angeles, CA: Sage.
Fusch, P. I., & Ness, L. R. (2015). Are we there yet? Data saturation in qualitative
research. The Qualitative Report, 20(9), 1408–1416. Retrieved from
http://www.nova.edu/ssss/QR/QR20/9/fusch1.pdf
Gale, N. K., Heath, G., Cameron, E., Rashid, S., & Redwood, S. (2013). Using the
framework method for the analysis of qualitative data in multi-disciplinary health
research. BMC Medical Research Methodology, 13, 117. doi:10.1186/1471-2288-
13-117
Gallegos, D., Giskes, K., Ramsey, R., & Turrell, G. (2012). Food insecurity among adults
residing in disadvantaged urban areas: Potential health and dietary consequences.
Public Health Nutrition, 15, 227–237. doi:10.1017/S1368980011001996
Gaudard, L., & Romerio, F. (2014). The future of hydropower in Europe: Interconnecting
climate, markets, and policies. Environmental Science & Policy, 37, 172–181.
doi:10.1016/j.envsci.2013.09.008

294
Gibbins, J., Bhatia, R., Forbes, K., & Reid, C. M. (2014). What do patients with advanced
incurable cancer want from the management of their pain? A qualitative study.
Palliative Medicine, 28, 71–78. doi:10.1177/0269216313486310
Gils, H. C. (2014). Assessment of the theoretical demand response potential in
Europe. Energy, 67, 1–18. doi:10.1016/j.energy.2014.02.019
Gioia, D. A., Corley, K. G., & Hamilton, A. L. (2013). Seeking qualitative rigor in
inductive research notes on the Gioia methodology. Organizational Research
Methods, 16, 15–31. doi:10.1177/1094428112452151
Glaser, B. G., & Strauss, A. (1967). The discovery of grounded theory: Strategies for
qualitative research. Chicago, IL: Aldine.
Gläser, J., & Laudel, G. (2013). Life with and without coding: Two methods for early-
stage data analysis in qualitative research aiming at causal explanations.
Qualitative Social Research, 14. Retrieved from http://www.qualitative-
research.net/index.php/fqs/article/view/1886/3528>
Glock, C, H., & Kim, T. (2015). The effect of forward integration on a single-vendor–
multi-retailer supply chain under retailer competition. International Journal of
Production Economics, 164, 179–192. doi:10.1016/j.ijpe.2015.03.009
Gorski, P. S. (2013). What is critical realism? And why should you care? Contemporary
Sociology: A Journal of Reviews, 42, 658–670. doi:10.1177/0094306113499533
Götz, G. (2014). Stop de-industrialization: Concrete proposals from the European
aluminum Industry. Aluminium International Today, 26, 14. Retrieved from
http://search.proquest.com/openview/5dc346e68bcc594c422921f315ec6d21/1?pq

295
Govindan, K., Khodaverdi, R., & Jafarian, A. (2013). A fuzzy multi-criteria approach for
measuring sustainability performance of a supplier based on triple bottom line
approach. Journal of Cleaner Production, 47, 345–354.
doi:10.1016/j.jclepro.2012.04.014
Graham, A., Powell, M. A., & Taylor, N. (2014). Ethical research involving children:
Encouraging reflexive engagement in research with children and young
people. Children and Society, 29, 331–343. doi:10.1111/chso.12089
Guba, E. G., & Lincoln, Y. S. (1994). Competing paradigms in qualitative research. In N.
K. Denzin & Y. S. Lincoln (Eds.), Handbook of Qualitative Research (pp. 105–
117). Thousand Oaks, CA: Sage. Retrieved from
https://www.uncg.edu/hdf/facultystaff/Tudge/Guba%20&%20Lincoln%201994.p
df
Guest, G., Bunce, A., & Johnson, L. (2006). How many interviews are enough? An
experiment with data saturation and variability. Field Methods, 18, 59–82.
doi:10.1177/1525822X05279903
Gunasekaran, A., Irani, Z., Choy, K. L., Filippi, L., & Papadopoulos, T. (2015).
Performance measures and metrics in outsourcing decisions: A review of research
and applications. International Journal of Production Economics, 161, 153-166.
doi.10.1016/j.ijpe.2014.12.021
Gutowski, T. G., Sahni, S., Allwood, J. M., Ashby, M. F., & Worrell, E. (2013). The
energy required to produce materials: Constraints on energy-intensity
improvements, parameters of demand. Philosophical Transactions of the Royal

296
Society of London A: Mathematical, Physical and Engineering Sciences, 371,
20120003. doi:10.1098/rsta.2012.0003
Haahr, A., Norlyk, A., & Hall, E. O. C. (2014). Ethical challenges embedded in
qualitative research interviews with close relatives. Nursing Ethics, 21, 6–15.
doi:10.1177/0969733013486370.
Haas, B. K., Hermanns, M., & Melin-Johansson, C. (2016). Case study of persons with
cancer participating in a community-based exercise program: An exploration of
meaning and change. The Qualitative Report, 21, 1409–1424. Retrieved from
http://nsuworks.nova.edu/tqr/vol21/iss8/5
Hadas, L., Cyplik, P., Adamczak, M. (2014). Integration level measurement system in
modeling forward and backward supply chain. In P. Golinska (Ed.), Logistics
Operations, Supply Chain Management, and Sustainability (pp. 47–58). New
York, NY: Springer. doi:10.1016/j.ifacol.2016.07.771
Haelermans, C., & Ruggiero, J. (2013). Estimating technical and allocative efficiency in
the public sector: A nonparametric analysis of Dutch schools. European Journal
of Operational Research, 227, 174–181. doi:10.1016/j.ejor.2012.12.004
Hall, W., Prichard, J., Voogt, P., & Zuccato, E. (2014). Sewage epidemiology and illicit
drug research: The development of ethical research guidelines, Science of The
Total Environment, 472, 550–555. doi:10.1016/j.scitotenv.2013.11.039
Han, B., Tang, Y., & Yang, L. (2016). Public information and uninformed trading:
Implications for market liquidity and price- efficiency. Journal of Economic
Theory, 163, 604–643. doi.10.1016/j.jet.2016.02.012

297
Hanna, P. (2012). Using internet technologies (such as Skype) as a research medium: A
research note. Qualitative Research, 12, 239–242.
doi:10.1177/1468794111426607
Hannes, K., & Parylo, O. (2014). Let’s play it safe: Ethical considerations from
participants in a photo voice research project. International Journal of Qualitative
Methods, 13, 255–274. Retrieved from
http://ejournals.library.ualberta.ca/index.php/IJQM/article/view/21243/16897
Hao, H., Geng, Y., & Hang, W. (2016). GHG emissions from the production of primary
aluminum in China: Regional disparity and policy implications. Applied
Energy, 166, 264–272. doi:10.1016/j.apenergy.2015.05.056
Harper, M., & Cole, P. (2012). Member checking: Can benefits be gained similar to
group therapy? The Qualitative Report, 17, 510–517. Retrieved from
http://www.nova.edu/ssss/QR/QR17-2/harper.pdf
Hazzan, O., & Nutov, L. (2014). Teaching and learning qualitative research: Conducting
qualitative research. Qualitative Report, 19, 1–29. Retrieved from www.nova.edu
Helm, R., & Conrad, D. (2015). The impact of customer-specific and market-related
variables on the preference for highly innovative products. Review of Managerial
Science, 9, 61–88. doi:10.1007/s11846-014-0123-y
Herrmann, C., & Kayasa, M. J. (2012). A simulation-based evaluation of selective and
adaptive production systems (SAPS) supported by quality strategy in production.
Procedia CIRP, 3, 14–19. doi:10.1016/j.procir.2012.07.004

298
Higginbottom, G. M. A., Pillay, J. J., & Boadu. N.Y. (2013). Guidance on performing
focused ethnographies with an emphasis on healthcare research. The Qualitative
Report , 18, 1–16. Retrieved from
http://www.nova.edu/ssss/QR/QR18/higginbottom17.pdf
Holliday, R. E., Humphries, J. E., Milne, R., Memon, A., Houlder, L., Lyons, A., & Bull,
R. (2012). Reducing misinformation effects in older adults with cognitive
interview mnemonics. Psychology and Aging, 27, 1191. doi:10.1037/a0022031
Holloway, I., & Wheeler, S. (2013). Qualitative research in nursing and healthcare.
Chichester, UK: John Wiley & Sons.
Holywell, G., & Breault, R. (2013). An overview of useful methods to treat, recover or
recycle spent pot lining. JOM, 65, 1443. doi:10.1007/s11837-013-0769-y
Hook, G. (2015). Plugging in epistemology: A theoretical and methodological maneuver
in qualitative research. The Qualitative Report, 20, 982–995. Retrieved from
http://nsuworks.nova.edu/tqr/vol20/iss7/3
Hoon, C. (2013). Meta-synthesis of qualitative case studies: An approach to theory
building. Organizational Research Methods, 16, 522–556.
doi:10.1177/1094428113484969
Hoskins, M. L., & White, J. (2013). Relational inquiries and the research interview:
Mentoring future researchers . Qualitative Inquiry, 19, 179–188.
doi:10.1177/1077800412466224
Houghton, C., Casey, D., Shaw, D., & Murphy, K. (2013). Rigor in qualitative case-study
research. Nurse Researcher, 20, 12–17. doi:10.7748/nr2013.03.20.4.12.e326

299
Hua, N., & Lee, S. (2014). Benchmarking firm capabilities for sustained financial
performance in the U.S. restaurant industry. International Journal of Hospitality
Management, 36, 137–144. doi:10.1016/j.ijhm.2013.08.012
Huang, C. W., Ho, F. N., & Chiu, Y. H. (2014). Measurement of tourist hotels׳
productive efficiency, occupancy, and catering service effectiveness using a
modified two-stage DEA model in Taiwan. Omega, 48, 49–59.
doi:10.1016/j.omega.2014.02.005
Huberman, A. M., & Miles, M. B. (1994). Data management and analysis methods. In N.
K. Denzin & Y. S. Lincoln (Eds.), Handbook of qualitative research (pp. 428–
44). Thousand Oaks, CA: Sage.
Hyett, N., Kenny, A., & Dickson-Swift, D. V (2014). Methodology or method? A critical
review of qualitative case study reports. International Journal of Qualitative
Studies on Health and Well-being, 9. doi:10.3402/qhw.v9.23606
Irvine, A., Drew, P., & Sainsbury, R. (2012). Am I not answering your questions
properly? Clarification, adequacy, and responsiveness in semi-structured
telephone and face-to-face interviews. Qualitative Research, 13, 87–106.
doi:10.1177/1468794112439086
Jean-François, H., Boiral, O., Marie-Josee, & Roy. (2016). Strategic cost management
and performance: The case of environmental costs. The British Accounting
Review, 48, 269-282. doi:10.1016/j.bar.2015.01.001

300
Jeong, H., & Othman, J. (2016). Using Interpretative phenomenological analysis from a
realist perspective. The Qualitative Report, 21, 558–570. Retrieved from
http://nsuworks.nova.edu/tqr/vol21/iss3/9
Jin, Y, H., Amydee, M, F, & Fawcett, S, E. (2013). Awareness is not enough:
Commitment and performance implications of supply chain integration.
International Journal of Physical Distribution & Logistics Management, 43, 205–
230. doi:10.1108/IJPDLM-10-2011-0169
Jones, C. I. (2011). Intermediate goods and weak links in the theory of economic
development. American Economic Journal: Macroeconomics, 3, 1–28. Retrieved
from http://www.aeaweb.org/aej-macro/index.php
KC, D., Staats, B. R., & Gino, F. (2013). Learning from my success and from others'
failure: Evidence from minimally invasive cardiac surgery. Management
Science, 59, 2435–2449. doi:10.1287/mnsc.2013.1720
Kelly, C. A., Soler-Hampejsek, E., Mensch, B. S., & Hewett, P. C. (2013). Social
desirability bias in sexual behavior reporting: Evidence from an interview mode
experiment in rural Malawi. International Perspectives on Sexual and
Reproductive Health, 39, 14. doi:10.1363/3901413
Kirkwood, A., & Price, L. (2013). Examining some assumptions and limitations of
research on the effects of emerging technologies for teaching and learning in
higher education. British Journal of Educational Technology, 44, 536–543.
doi:10.1111/bjet.12049

301
Klein, H. K., & Myers, M. D. (1999). A set of principles for conducting and evaluating
interpretive field studies in information systems. MIS Quarterly, 67–93. Retrieved
from http://www.misq.org/
Koopmans, T. C. (1951). Analysis of production as an efficient combination of
activities. New York, NY: Wiley.
Kortmann, S., Gelhard, C., Zimmermann, C., & Piller, F. T. (2014). Linking strategic
flexibility and operational efficiency: The mediating role of ambidextrous
operational capabilities. Journal of Operations Management, 32, 475–490.
doi:10.1016/j.jom.2014.09.007
Kvande, H. (2015). Occurrence and production of aluminum. Encyclopedia of Inorganic
and Bioinorganic Chemistry. doi:10.1002/9781119951438.eibc2350
Kvande, H., & Drabløs, P. A. (2014). The aluminum smelting process and innovative
alternative technologies. Journal of Occupational and Environmental Medicine,
56. doi:10.1097/JOM.0000000000000062
Lahiri, N., & Narayanan, S. (2013). Vertical integration, innovation, and alliance
portfolio size: Implications for firm performance. Strategic Management
Journal, 34, 1042–1064. doi:10.1002/smj.2045
Latham, J. R. (2013). A framework for leading the transformation to performance
excellence part I: CEO perspectives on forces, facilitators, and strategic leadership
systems. Quality Management Journal, 20, 12–29. Retrieved from
http://www.asq.org/pub/qmj/

302
Lee, C. J. G. (2012). Reconsidering constructivism in qualitative research. Educational
Philosophy and Theory, 44, 403–412. doi:10.1111/j.1469-5812.2010.00720.x
Leedy, P. D., & Ormrod, J. E. (2013). Practical research: Planning and design (10th
ed.). Upper Saddle River, NJ: Pearson Education.
Lin, Y. T., Parlaktürk, A. K., & Swaminathan, J. M. (2014). Vertical integration under
competition: Forward, backward, or no integration? Production and Operations
Management, 23, 19–35. doi:10.1111/poms.12030
Liu, Y., Dong, H., Lohse, N., Petrovic, S., & Gindy, N. (2014). An investigation into
minimising total energy consumption and total weighted tardiness in job shops.
Journal of Cleaner Production, 65, 87–96. doi:10.1016/j.jclepro.2013.07.060
Loh, J. (2013). Inquiry into issues of trustworthiness and quality in narrative studies: A
perspective. The Qualitative Report, 18, 1. Retrieved from
http://nsuworks.nova.edu/tqr/vol18/iss33/1
Lohri, C. R., Camenzind, E. J., & Zurbrügg, C. (2014). Financial sustainability in
municipal solid waste management: Costs and revenues in Bahir Dar,
Ethiopia. Waste Management, 34, 542–552. doi:10.1016/j.wasman.2013.10.014
Lucas, S. R. (2014). An inconvenient data set: Bias and inappropriate inference in the
multilevel model. Quality & Quantity, 48, 1619–1649. doi:10.1007/s11135-013-
9865-x
Lucic, L., Daiute, C., & Khan, A. (2015). Narrative exploration of social cognition in
adults hospitalized due to symptoms of schizophrenia. European Psychiatry, 30,
1282. doi:10.1016/S0924-9338(15)31004-X

303
Lucio, N. R., Wendell de Queiroz, L., & Rubens de Camargo, J. (2013). Strategic energy
management in the primary aluminum industry: Self-generation as a competitive
factor, Energy Policy, 59, 182–188. doi:10.1016/j.enpol.2013.03.021
Ma, D., Chang, C. C., & Hung, S. W. (2013). The selection of technology for late-
starters: A case study of the energy-smart photovoltaic industry. Economic
Modelling, 35, 10-20.doi:10.1016/j.econmod.2013.06.030
Malterud, K., Siersma, V. D., & Guassora, A. D. (2016). Sample size in qualitative
interview studies: Guided by information power. Qualitative Health Research, 26,
1753–1760. doi:10.1177/1049732315617444
MacGillivray, A., Jeffrey, H., Winskel, M., & Bryden, I. (2014). Innovation and cost
reduction for marine renewable energy: A learning investment sensitivity
analysis. Technological Forecasting and Social Change, 87, 108–124.
doi:10.1016/j.techfore.2013.11.005
Marsillac, E., & Jungbae, R. J. (2014). Connecting product design, process, and supply
chain decisions to strengthen global supply chain capabilities. International
Journal of Production Economics, 147, 317–329. doi:10.1016/j.ijpe.2013.04.011
McAreavey, R., & Das, C. (2013). A delicate balancing act: Negotiating with gatekeepers
for ethical research when researching minority communities. International
Journal of Qualitative Methods, 12, 113–131. doi:10.1177/160940691301200102
Merriam, S. B. (2014). Qualitative research: A guide to design and implementation. San
Francisco, CA: John Wiley & Sons.

304
Miltenburg, J. (2005). Manufacturing strategy: How to formulate and implement a
winning plan. New York, NY: Taylor and Francis Group.
Mitchell, K. R., & Wellings, K. (2013). Measuring sexual function in community
surveys: Development of a conceptual framework. Journal of Sex Research, 50,
17–28. doi:10.1080/00224499.2011.621038
Moll, B. (2014). Productivity losses from financial frictions: Can self-financing undo
capital misallocation? American Economic Review, 104, 3186–3221.
doi:10.1257/aer.104.10.3186
Mollick, E. (2014). The dynamics of crowdfunding: An exploratory study. Journal of
Business Venturing, 29, 1–16. doi:10.1016/j.jbusvent.2013.06.005
Molnár, G., Greiff, S., & Csapó, B. (2013). Inductive reasoning, domain specific and
complex problem solving: Relations and development. Thinking Skills and
Creativity, 9, 35-45. doi:10.1016/j.tsc.2013.03.002
Morse, A., & McEvoy, C. D. (2014). Qualitative research in sports management: Case
study as a methodological approach. The Qualitative Report, 19, 1–13. Retrieved
from http://nsuworks.nova.edu/tqr/vol19/iss31/3
Munn, Z., Porritt, K., Lockwood, C., Aromataris, E., & Pearson, A. (2014). Establishing
confidence in the output of qualitative research synthesis: The ConQual approach.
BMC Medical Research Methodology, 14. 1–7. doi:10.1186/1471-2288-14-108
Namageyo-Funa, A., Rimando, M., Brace, A., Fowles, T., Christiana, R., Davis, T. L.,
Martinez, L., Sealy, D. (2014). Recruitment in qualitative public health research:
305
Lessons learned during dissertation sample recruitment. The Qualitative Report,
19, 1–17. Retrieved from http://nsuworks.nova.edu/tqr/vol19/iss4/3
Neri de Souza, F., Neri, D. C., & Costa, A. P. (2016). Asking questions in the qualitative
research context. The Qualitative Report, 21, 6–18. Retrieved from
http://nsuworks.nova.edu/tqr/vol21/iss13/2
Niero, M., Hauschild, M. Z., Hoffmeyer, S. B., & Olsen, S. I. (2017). Combining
eco‐efficiency and eco‐effectiveness for continuous loop beverage packaging
systems: Lessons from the Carlsberg Circular Community. Journal of Industrial
Ecology. doi:10.1111/jiec.12554
Noble, H. & Smith, J. (2015). Issues of validity and reliability in qualitative
research. Evidence-Based Nursing, 18, 34–35. doi:10.1136/eb-2015-102054
Nolte, S., Elsworth, G. R., & Osborne, R. H. (2013). The absence of social desirability
bias in the evaluation of chronic disease self-management interventions. Health
and Quality of Life Outcomes, 11, 1. doi:10.1186/1477-7525-11-114
Novy-Marx, R. (2013). The other side of value: The gross profitability premium. Journal
of Financial Economics, 108, 1–28. doi:10.1016/j.jfineco.2013.01.003
The Office for Human Research Protections. (2005). The Nuremberg code. Trials of War
Criminals before the Nuremberg Military Tribunals under Control Council Law,
10, 181–182. Retrieved from http://www.hhs.gov/ohrp/archive/nurcode.html
Oke, A. (2013). Linking manufacturing flexibility to innovation performance in
manufacturing plants. International Journal of Production Economics, 143, 242–
247. doi:10.1016/j.ijpe.2011.09.014

306
Olausson, S., Lindahl, B., & Ekebergh, M. (2013). A phenomenological study of
experiences of being cared for in a critical care setting: The meanings of the
patient room as a place of care. Intensive and Critical Care Nursing, 29, 234–243.
doi:10.1016/j.iccn.2013.02.002
Olesen, O. B., & Petersen, N. C. (2016). Stochastic data envelopment analysis: A
review. European Journal of Operational Research, 251, 2–21.
doi:10.1016/j.ejor.2015.07.058
Olson, J. D., McAllister, C., Grinnell, L. D., Gehrke-Walters, K., & Appunn, F. (2016).
Applying constant comparative method with multiple investigators and inter-
coder reliability. The Qualitative Report, 21, 26–42. Retrieved from
http://nsuworks.nova.edu/ tqr/vol21/iss1/3
Onwuegbuzie, A. J., & Byers, V. T. (2014). An exemplary for combining the collection,
analysis, and interpretation of verbal and nonverbal data in qualitative research.
International Journal of Education, 6, 183–246. doi:10.5296/ije.v6i1.4399
Oquendo, M. A., Stanley, B., Ellis, S. P., & Mann, J. J. (2014). Protection of human
subjects in intervention research for suicidal behavior. American Journal of
Psychiatry, 161, 1558–1563. doi:10.1176/appi.ajp.161.9.1558
O’Reilly, M., & Parker, N. (2012, May). Unsatisfactory saturation: A critical exploration
of the notion of saturated sample sizes in qualitative research. Qualitative
Research, 1–8. doi:10.1177/1468794112446106
307
Owen, G. T. (2014). Qualitative methods in higher education policy analysis: Using
interviews and document analysis. The Qualitative Report, 19, 1–19. Retrieved
from http://nsuworks.nova.edu/tqr/vol19/iss26/2
Ozorio, L., Bastian-Pinto, C. L., Baidya, T. K. N., & Brandão, L. E. T. (2013).
Investment decision in integrated steel plants under uncertainty. International
Review of Financial Analysis, 27, 55–64. doi:10.1016/j.irfa.2012.06.003
Palinkas, L. A., Horwitz, S. M., Green, C. A., Wisdom, J. P., Duan, N., & Hoagwood, K.
(2015). Purposeful sampling for qualitative data collection and analysis in mixed
method implementation research. Administration and Policy in Mental Health and
Mental Health Services Research, 1–12. doi:10.1007/s10488-013-0528-y
Palmer, J., Fam, D., Smith, T., & Kilham, S. (2014). Ethics in fieldwork: Reflections on
the unexpected. The Qualitative Report, 19, 1–13. Retrieved from
http://nsuworks.nova.edu/tqr/vol19/iss28/3
Park, B. L., Simar, P., & Zelenyuk, V. (2015). Categorical data in local maximum
likelihood: Theory and applications to productivity analysis. Journal of
Productivity Analysis, 43, 199–214. doi:10.1007/s11123-014-0394-y
Pearson, M. L., Albon, S. P., & Hubball, H. (2015). Case study methodology: Flexibility,
rigor, and ethical considerations for the scholarship of teaching and learning. The
Canadian Journal for the Scholarship of Teaching and Learning, 6(12). Retrieved
from http://ir.lib.uwo.ca/cjsotl rcacea/vol6/iss3/12

308
Perkins, A., Burton, L., Dray, B., & Elcock, K. (2013). Evaluation of a multiple-mini-
interview protocol used as a selection tool for entry to an undergraduate nursing
program. Nurse Education Today, 33, 465–469. doi:10.1016/j.nedt.2012.04.023
Pernecky, T. (2012). Constructionism: Critical pointers for tourism studies. Annals of
Tourism Research, 39, 1116–1137. doi:10.1016/j.annals.2011.12.010
Petty, N. J., Thomson, O. P., & Stew, G. (2012). Ready for a paradigm shift? Part 2:
Introducing qualitative research methodologies and methods. Manual
Therapy, 17, 378-384. doi:10.1016/j.math.2012.03.004
Pierre, E. A. S., & Jackson, A. Y. (2014). Qualitative data analysis after coding.
Qualitative Inquiry, 20, 715–719. doi:10.1177/1077800414532435
Ping, W. E. I., Tang, H. Q., Yao, C. H. E. N., & Chen, X. H. (2013). Measuring technical
efficiency of Chinese nonferrous metals enterprises on a background of industry
consolidation. Transactions of Nonferrous Metals Society of China, 23, 2797–
2806. doi:10.1016/S1003-6326(13)62800-9
Pinto, A. D., Manson, H., Pauly, B., Thanos, J., Parks, A., & Cox, A. (2012). Equity in
public health standards: A qualitative document analysis of policies from two
Canadian provinces. International Journal for Equity in Health, 11, 28.
doi:10.1186/1475-9276-11-28
Pogue, A. I., & Lukiw, W. J. (2014). The mobilization of aluminum into the
biosphere. Frontiers in Neurology, 5. doi:10.3389/fneur.2014.00262

309
Polansky, A. M. (2014). Assessing the capability of a manufacturing process using
nonparametric Bayesian density estimation. Journal of Quality Technology, 5,
150–170. Retrieved from http://www.asq.org/pub/jqt
Porter, M. E. (1980). Competitive Strategy: Techniques for analyzing industries and
competitors. New York, NY: The Free Press.
Potter, S. (2013). Learning to value stories: A review of narrative inquiry. Qualitative
Report, 18, 1–3. Retrieved from www.nova.edu
Radetzki, M. (2013). The relentless progress of commodity exchanges in the
establishment of primary commodity prices. Resources Policy, 38, 266–277.
doi:10.1016%2Fj.resourpol.2013.04.001
Ramanathan, U. (2014). Performance of supply chain collaboration–A simulation
study. Expert Systems with Applications, 41(1), 210.
doi:10.1016/j.eswa.2013.07.022
Ravenek, M. J., & Rudman, D. L. (2013). Bridging conceptions of quality in moments of
qualitative research. International Journal of Qualitative Methods, 12, 436–456.
doi:10.1177/160940691301200122
Ray, C. S. (2015). Nonparametric measures of scale economies and capacity utilization:
An application to U.S. manufacturing. European Journal of Operational
Research, 245, 602–611. doi:10.1016/j.ejor.2015.03.024
Reh, L. (2013). Process engineering in circular economy. Particuology, 11, 119–133.
doi:10.1016/j.partic.2012.11.001

310
Reinartz, S. J., & Schmid, T. (2015). Production flexibility, product markets, and capital
structure decisions [Abstract]. Review of Financial Studies, hhv126.
doi:10.1093/rfs/hhv126
Restuccia, D., & Rogerson, R. (2013). Misallocation and productivity. Review of
Economic Dynamics, 16, 1–10. doi:10.1016/j.red.2012.11.003.
Rimando, M., Brace, A. M., Namageyo-Funa, A., Parr, T. L., Sealy, D., Davis, T. L.,
Martinez, L. M., & Christiana, R. W. (2015). Data collection challenges and
recommendations for early career researchers. The Qualitative Report, 20, 2025–
2036. Retrieved from http://nsuworks.nova.edu/tqr/vol20/iss12/8
Ritchie, J., Lewis, J., Nicholls, C. M., & Ormston, R. (Eds.). (2013). Qualitative research
practice: A guide for social science students and researchers. Thousand Oaks,
CA: Sage.
Robert, D., & Shenhav, S. (2014). Fundamental assumptions in the narrative analysis:
Mapping the field. The Qualitative Report, 19, 1–17. Retrieved from
http://nsuworks.nova.edu/tqr/vol19/iss38/3
Rosenthal, M. (2016). Qualitative research methods: Why, when, and how to conduct
interviews and focus groups in pharmacy research. Currents in Pharmacy
Teaching and Learning, 8, 509–516. doi.org/10.1016/j.cptl.2016.03.021
Sáenz, V. B., Bukoski, B. E., Lu, C., & Rodriguez, S. (2013). Latino males in Texas
community colleges: A phenomenological study of masculinity constructs and
their effect on college experiences. Journal of African American Males in
Education, 4, 82–102. Retrieved from http://journalofafricanamericanmales.com

311
Schraw, G. (2013). Conceptual integration and measurement of epistemological and
ontological beliefs in educational research. ISRN Education.
doi:10.1155/2013/327680
Scopelliti, I., Cillo, P., Busacca, B., & Mazursky, D. (2014). How do financial constraints
affect creativity? Journal of Product Innovation Management, 31, 880–893.
doi:10.1111/jpim.12129
Shepherd, R. W. (2015). Theory of cost and production functions. Princeton, NJ:
Princeton University Press.
Sherman, H. D., & Zhu, J. (2013). Analyzing performance in service organizations. MIT
Sloan Management Review, 54, 37–42. Retrieved from
http://sloanreview.mit.edu/article/analyzing-performance-in-service-
organizations/
Shrouf, F., Ordieres-Meré, J., García-Sánchez, A., & Ortega-Mier, M. (2014). Optimizing
the production scheduling of a single machine to minimize total energy
consumption costs. Journal of Cleaner Production, 67, 197–207.
doi:10.1016/j.jclepro.2013.12.024
Silva, J. A., Abellán-Nebot, J. V., Siller, H. R., & Guedea-Elizalde, F. (2014). Adaptive
control optimization system for minimizing production cost in hard milling
operations. International Journal of Computer Integrated Manufacturing, 27,
348–360. doi:10.1080/0951192X.2012.749535
312
Simpson, A., & Quigley, C. F. (2016). Member checking process with adolescent
students: Not just reading a transcript. The Qualitative Report, 21, 376–392.
Retrieved from http://nsuworks.nova.edu/tqr/vol21/iss2/12
Singh, D., Oberoi, J. S., & Ahuja, I. S. (2014). A rule-based fuzzy-logic approach for
evaluating the strategic flexibility in manufacturing organizations. International
Journal of Strategic Change Management, 5, 281–296.
doi:10.1504/IJSCM.2014.067284
Stacey, A. & Stacey, J. (2012). Research ethics for sustainable development. Paper
presented at the 391-XV European Conference on Research for Methodology for
Business Management. Retrieved from
http://www.ejbrm.com/front/search/index.html
Stake, R. (1995). The art of case study research. Thousand Oaks, CA: Sage.
Stanko, M. A., Molina‐Castillo, F. J., & Harmancioglu, N. (2015). It won't fit! For
innovative products, sometimes that's for the best. Journal of Product Innovation
Management, 32, 122–137. doi:10.1111/jpim.12238
Strauss, A., & Corbin. (1998). Basics of qualitative research: Techniques and procedures
for developing grounded theory. Thousand Oaks, CA: Sage.
Suresh, A. (2014). Synthesis of knowledge through responsiveness, recognition,
formation, attraction, and retention: An empirical approach. IUP Journal of
Knowledge Management, 12, 53. Retrieved from
https://www.coursehero.com/file/p45f9v9/2014-Synthesis-of-Knowledge-
Through-Responsiveness-Recognition-Formation/

313
Sverdrupa, H. U, Ragnarsdottirb, K, V., Kocac, D. (2015). Aluminium for the future:
Modelling the global production, market supply, demand, price and long term
development of the global reserves. Resources, Conservation and Recycling, 103.
139–154. doi:10.1016/j.resconrec.2015.06.008
Tabereaux, A. T., & Peterson, R. D. (2014). Chapter 2.5 - Aluminum production. In S.
Seetharaman (Ed.), Treatise on Process Metallurgy (pp. 839–917). Boston, MA:
Elsevier. doi:10.1016/B978-0-08-096988-6.00023-7
Taheri, M., Moghaddam, M. R. A., & Arami, M. (2015). Improvement of
the/Taguchi/design optimization using artificial intelligence in three acid azo dyes
removal by electrocoagulation. Environmental Progress and Sustainable Energy,
34, 1568–1575. doi:10.1002/ep.12145
Tarrozzi, M. (2013). How does my research question come about? The impact of funding
agencies in formulating research questions. The Qualitative Report, 18, 1–11.
Retrieved from http://nsuworks.nova.edu/tqr/vol18/iss51/2
Tate, W. L., Ellram, L. M., Schoenherr, T., & Petersen, K. J. (2014). Global competitive
conditions driving the manufacturing location decision. Business Horizons, 57(3),
381–390. doi:10.1016/j.bushor.2013.12.010
Teddlie, C., & Tashakkori, A. (2012). Common core characteristics of mixed methods
research: A review of critical issues and call for greater convergence. American
Behavioral Scientist, 56, 774-788. doi:10.1177/0002764211433795

314
Torrie, R. D., Stone, C., & Layzell, D. B. (2016). Understanding energy systems change
in Canada: Decomposition of total energy intensity. Energy Economics, 56, 101–
106. doi:10.1016/j.eneco.2016.03.012
Tovar, B. & Wall, A. (2015). Can ports increase traffic while reducing inputs? Technical
efficiency of Spanish Port Authorities using a directional distance function
approach. Transportation Research Part A. doi:10.1016/j.tra.2014.11.003
Trench, A., Sykes, J., & Robinson, P. (2015). Edge of tomorrow: A tour of 2016–2020
mineral commodity markets. In Proceedings AusIMM New Zealand Branch
Annual Conference (pp. 481–494). Retrieved from
https://www.researchgate.net/profile/John_Sykes4/publication/299584077_Edge_
of_tomorrow_A_tour_of_2016-
2020_mineral_commodity_markets/links/5700b67108aea6b77469bae0.pdf
Tribedy, P., & Venugopalan, R. (2012). QCD saturation at the LHC: Comparisons of
models to p+ p and A+ A data and predictions for p+ Pb collisions. Physics
Letters B, 710, 125–133. Retrieved from http://www.worldscinet.com/mplb
Tsiotras, G. D. (2014). Operational excellence in the Greek brewing industry. Global
Business and Organizational Excellence. doi: 10.1002/joe.2153
Tukker, A. (2015). Product services for a resource-efficient and circular economy: A
review. Journal of Cleaner Production, 97, 7691.
doi:10.1016/j.jclepro.2013.11.049

315
Tummons, J. (2014). Using software for qualitative data analysis: Research outside
paradigmatic boundaries. Big Data, 155–177. doi:10.1108/S1042-
319220140000013010
U.S. Department of Health. (2014). The Belmont Report: Ethical principles and
guidelines for the protection of human subjects of research. The Journal of the
American College of Dentists, 81, 4. Retrieved from
http://www.ncbi.nlm.nih.gov/pubmed/25951677
U.S. Energy Information Administration. (2012). Energy needed to produce aluminum.
Retrieved from https://www.eia.gov/todayinenergy/detail.cfm?id=7570
U.S. Geological Survey. (2013). Metal prices in the United States through 2010.
Washington, DC: U.S. Government Printing Office.
U.S. Geological Survey. (2014). Mineral commodity summaries 2014. Washington, DC:
U.S. Government Printing Office.
Valero, A., Valero, A., & Calvo, G. (2015). Using thermodynamics to improve the
resource efficiency indicator GDP/DMC. Resources, Conservation and
Recycling, 94, 110–117 doi:10.1016/j.resconrec.2014.12.001
Van Wijk, E. (2014). Recruitment and retention of vulnerable populations: Lessons
learned from a longitudinal qualitative study. The Qualitative Report, 19, 1–21.
Retrieved from http://nsuworks.nova.edu/tqr/vol19/iss28/2
Varabyova, Y. & Schreyögg, J. (2013). International comparisons of the technical
efficiency of the hospital sector: Panel data analysis of OECD countries using
parametric and non-parametric approaches. Health System Performance

316
Comparison: New Directions in Research and Policy, 112, 70–79.
doi:10.1016/j.healthpol.2013.03.003
Venkatesh, V., Brown, S. A., & Bala, H. (2013). Bridging the qualitative-quantitative
divide: Guidelines for conducting mixed methods research in information
systems. MIS Quarterly, 37, 21–54. Retrieved from http://www.misq.org
Wei-Qiang, C., & Lei Shi. (2012). Analysis of aluminum stocks and flows in mainland
China from 1950 to 2009: Exploring the dynamics driving the rapid increase in
China's aluminum production. Resources, Conservation and Recycling, 65, 18–
28. doi.10.1016/j.resconrec.2012.05.003.
Weishaar, H., Collin, J., Smith, K., Grüning, T., Mandal, S., & Gilmore, A. (2012).
Global health governance and the commercial sector: A documentary analysis of
tobacco company strategies to influence the WHO framework convention on
tobacco control. PLoS Medecine, 9. doi:10.1371/journal.pmed.1001249
White, P. (2013). Who’s afraid of research questions? The neglect of research questions
in the methods literature and a call for question-led methods teaching.
International Journal of Research & Method in Education, 36, 213–227.
doi:10.1080/17437 27X.2013.809413
Wicksteed, P. H. (1894). An essay on the co-ordination of the laws of
distribution. Journal of the History of economic thought. Retrieved from
http://cepa.newschool.edu/het/texts/wicksteed/wickess.pdf
Wiengarten, F., Humphreys, P., Cao, G., & McHugh, M. (2013). Exploring the important
role of organizational factors in IT business value: Taking a contingency

317
perspective on the resource‐based view. International Journal of Management
Reviews, 15, 30–46. doi:10.1111/j.1468-2370.2012.00332.x
Williams, A. D., Blackwell, S. E., Mackenzie, A., Holmes, E. A., & Andrews, G. (2013).
Combining imagination and reason in the treatment of depression: A randomized
controlled trial of internet-based cognitive-bias modification and internet-CBT for
depression. Journal of Consulting and Clinical Psychology, 81, 793. Retrieved
from http://psycnet.apa.org/journals/ccp/81/5/793.html
Wirshing, D. A., Wirshing, W. C., Marder, S. R., Liberman, R. P., & Mintz, J. (2014).
Informed consent: Assessment of comprehension. The American Journal of
Psychiatry, 155, 1508–1511. doi:10.1176/ajp.155.11.1508
World Bank. (2013). Commodity market outlook. Global Economic Prospect. Retrieved
from http://www.wds.worldbank.org/external/default/WDSContentServer/WDSP/
IB/2013/02/05/00042596220130205142844/Rendered/PDF/750590WP0Box370ti
es2013A0FullReport.pdf
Yang, W., Shi, J., Qiao, H., Shao, Y., & Wang, S. (2016). Regional technical efficiency
of Chinese Iron and steel industry based on bootstrap network data envelopment
analysis. Socio-Economic Planning Sciences. In Press, Corrected
Proof, doi:10.1016/j.seps.2016.07.003
Yao, S., & Liu, Z. (1998). Determinants of grain production and technical efficiency in
China. Journal of Agricultural Economics, 49, 171-184. doi:10.1111/j.1477-
9552.1998.tb01262.x

318
Yazan, B. (2015). Three approaches to case study methods in education: Yin, Merriam,
and Stake. The Qualitative Report, 20, 134–152. Retrieved from
http://nsuworks.nova.edu/tqr/vol20/iss2/12
Yilmaz, K. (2013). Comparison of quantitative and qualitative research: Traditions:
epistemological, theoretical, and methodological differences. European Journal of
Education, 48, 311–325. doi:10.1111/ejed.12014
Yin, R. K. (2012). Application of case study research (3rd ed.). Thousand Oaks, CA:
Sage.
Yin, R. K. (2013). Validity and generalization in future case study evaluations.
Evaluation, 19, 321–332. doi:10.1177/1356389013497081
Youn, S. H., Yang, M. G. M., Kim, J. H., & Hong, P. (2014). Supply chain information
capabilities and performance outcomes: An empirical study of Korean steel
suppliers. International Journal of Information Management, 34(3), 369–380.
doi:10.1016/j.ijinfomgt.2014.01.008
Zelenyuk, V. (2015). Aggregation of scale efficiency. European Journal of Operational
Research, 240, 269–277. doi:10.1016/j.ejor.2014.06.038
Zhang, C., Juan, Z., & Xiao, G. (2015). Do contractual practices affect technical
efficiency? Evidence from public transport operators in China. Transportation
Research Part E: Logistics and Transportation Review, 80, 39–55.
doi:10.1016/j.tre.2015.05.001

319
Appendix A: Interview Protocol Form
Aluminum Production Profitability: A Comparative Case Study of Production Strategy
by
Joseph Nloga Ndjebayi
Walden University
Doctoral Proposal: A Comparative Case Study of Production Strategy in the Primary-
Aluminum Production
Date
Time Location Interviewer Joseph Ndjebayi Interviewee “X1 ’’ Release informed consent. Interview Background
Thank you for your participation in this explorative research. The purpose of this
study is to identify strategies that some producers use to reduce production costs. You
have been selected as a participant because of your experience and the important role you
play in developing production strategies. In this doctoral research, I place a particular
interest in understanding the production strategy as deployed in your company. I would
like to identify the strategies your business uses to increase business profitability by
decreasing production costs. I believe your contribution will shed light on the purpose of
this research by helping to identify strategies to reduce costs.

320
Please note that the IRB has approved this study; therefore, I will guarantee that
all the requirements for ethical research are met. Specifically, I will anonymize your
details and those of your company. Is that ok with you? To avoid losing valuable
information, I will also audiotape this interview; is that also ok with you? The
approximate length of the interview is no more than 50 minutes for 10 primary questions.
Please feel free to seek clarification to any questions that may be ambiguous. The
following serves as the line of questioning:
1. What are resources of production necessary for reducing production costs?
2. How do you combine the resources of production to reduce production
costs?
3. What strategy of production related to production costs does your
company use to minimize resource utilization?
4. What approach does your company use to maximize the production output
while reducing resource utilization?
5. In line with production cost minimization, by what measurement do you
consider that you have reached the maximum limit attainable for resource
utilization?
6. In line with production cost minimization, what strategy does your
company use to allocate resources?
7. What material-management strategy does your company use to reduce
production costs?

321
8. What are your purchasing and procurement strategies to reduce production
costs?
9. What level of technology do you use to minimize production costs?
10. What level of process engineering does your company use to reduce
production costs?
11. What other production capability do you use to help your business reduce
its production costs?
Reflection by Interviewer:
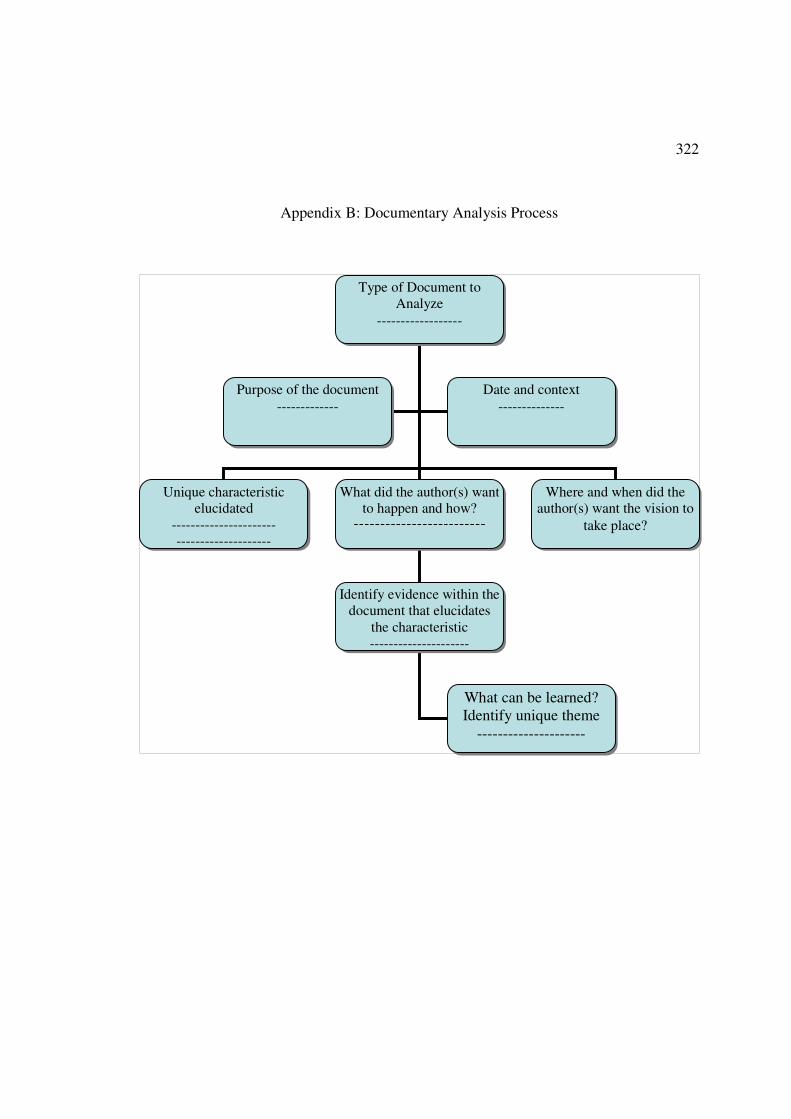
322
Appendix B: Documentary Analysis Process
Type of Document to Analyze
------------------
Unique characteristic elucidated
---------------------- --------------------
Where and when did the author(s) want the vision to
take place?
What did the author(s) want to happen and how?
-------------------------
Purpose of the document
-------------
Date and context
--------------
Identify evidence within the document that elucidates
the characteristic ---------------------
What can be learned? Identify unique theme
---------------------

323
Appendix C: Within-Case Analysis Network

324
Appendix D: Between-Case Analysis Network