Embed Size (px)
Citation preview

Altron Group2010 Interim results

Agenda
Altron group overview Robert Venter
Altron group financial results Alex Smith
Operational reviews:
Altech Craig Venter
Bytes Rob Abraham
Powertech Norbert Claussen
Altron – Outlook Robert Venter

Volumes flat with growth coming from cost cutting and efficiencies obtained over last 18 months
Encouraging improvement in EBITDA margins
Further improvement in group’s working capital management
Bytes and Powertech show significant improvement in profits and margins
Altech experienced difficult market conditions, particularly in East Africa and Altech UEC
Strong rand continues to impact the group
Increased competition from foreign entry into local markets
Second 6 months anticipated to be stronger at Altech
Continued external focus on selective acquisitions
Group overview

Financial summary(for the 6 months ended 31 August 2010)
R millions Aug 10 Aug 09 % change
Revenue 11 724 12 055 (3%)
EBITDA 988 951 4%
EBITDA margin 8.4% 7.9%
Adjusted diluted HEPS (cents) 105 100 5%
Return on capital employed 18.4% 19.9%

Revenue: 4 788 1%
EBITDA: 507 12%
EBITDA margin: 10.6% 12.2%
Headline earnings: 201 29%
Adjusted dilutedheadline earnings: 218 25%
ROE: 21.7% 29.2%
ROCE: 31.3% 41.2%
*
Subsidiary company results (for the 6 months ended 31 August 2010)
*listed on JSE
62%
(R millions)
*shareholding

Revenue: 3 797 (5%)
EBITDA: 270 23%
EBITDA margin: 7.1% 5.5%
Headline earnings: 91 102%
Adjusted dilutedheadline earnings: 98 63%
ROE: 7.6% 4.0%
ROCE: 10.8% 8.5%
*
Subsidiary company results (for the 6 months ended 31 August 2010)
100%
(R millions)
*
shareholding
*listed on JSE
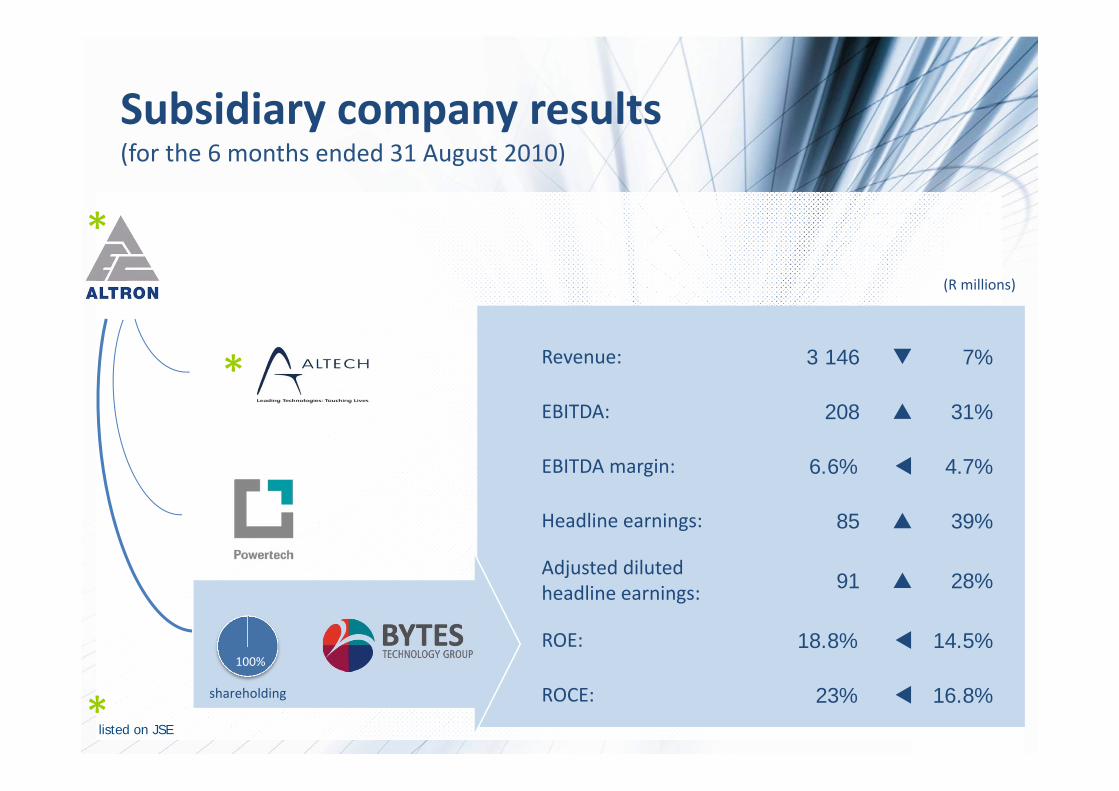
100%
Revenue: 3 146 7%
EBITDA: 208 31%
EBITDA margin: 6.6% 4.7%
Headline earnings: 85 39%
Adjusted dilutedheadline earnings: 91 28%
ROE: 18.8% 14.5%
ROCE: 23% 16.8%
*
Subsidiary company results (for the 6 months ended 31 August 2010)
*
(R millions)
shareholding
*listed on JSE

Contribution per subsidiary
Revenue* EBITDA* Headline earnings
Aug 10
Aug 09
* Revenue & EBITDA excludes Corporate & Financial and includes forex losses / gains
R270m 27%
R507m 52%
R208m 21%
R219m 23%
R578m 60%
R159m 17%
R91m 30%
R123m 39%
R85m 27%
R13m 4%
R45m 15%
R175m 60%
R61m 21%
R12m 4%
R3 797m 32%
R4 788m 41%
R3 146m 27%
R3 981m 33%
R4 732m 39%
R3 374m 28%

Improve existing operationsExpand organicallyAcquire and disposeAllocate capital
Strategic philosophies
Strategic alliances
Ownership of Intellectual Property
Annuity income
Value added servicesMarket leadership / Critical mass
Quality / Sustainability of Income
Superior human capital
Global expansion in niche marketsBlack Economic Empowerment
Increase shareholder value
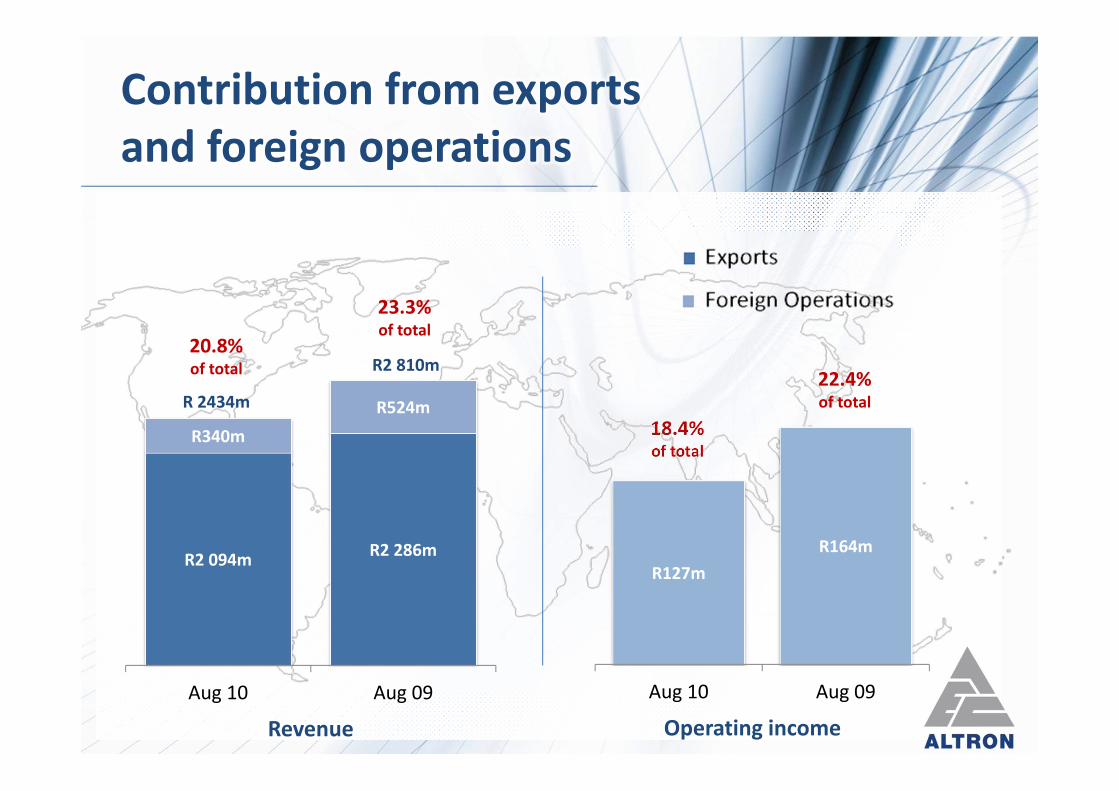
R2 094m R2 286m
R340mR524m
Aug 10 Aug 09
Contribution from exports and foreign operations
20.8%of total
23.3%of total
18.4%of total
22.4%of totalR 2434m
R2 810m
Revenue Operating income
R127mR164m
Aug 10 Aug 09

Annuity incomefor 12 months to Feb 09 (R m)
Annuity incomefor 12 months to Feb 10 (R m)
Annuity incomeFor 6 months to Aug 10 (R m)
6 809 74% 7 422 81% 3 926 82%
2 805 46% 2 822 47% 1 491 47%
1 617 17% 1 238 17% 618 16%
11 231 45% 11 482 51% 6 035 51%
Annuity based services

EBITDA
‐
100
200
300
400
500
600
700
H12006
H22006
H12007
H22007
H12008
H22008
H12009
H22009
H12010
H22010
H12011
Altech
‐
50
100
150
200
250
300
H12006
H22006
H12007
H22007
H12008
H22008
H12009
H22009
H12010
H22010
H12011
Bytes
‐
100
200
300
400
500
600
700
H12006
H22006
H12007
H22007
H12008
H22008
H12009
H22009
H12010
H22010
H12011
Powertech
‐
200
400
600
800
1 000
1 200
1 400
H12006
H22006
H12007
H22007
H12008
H22008
H12009
H22009
H12010
H22010
H12011
Altron
Rm Rm
Rm Rm

Altron's progress in terms of meeting its B‐BBEE Vision 2012 targets has been published in Altron Vision 2012 Progress Report
Empowerdex ratings confirmed Bytes’ position as number one empowered ICT company in South Africa
Bytes group obtained average B‐BBEE score of 90.98 to be rated a Level 2 contributor on DTI scorecard for 2010 (customers can claim 156%)
Altech’s consolidated verification achieved Level 3 contributor status with 76.14 points
Powertech’s major operations have been rated and reflect Level 3 contributor ratings
Altron ranked #1 countrywide survey for skills development by FM/Empowerdex
B‐BBEE transformation progress

Financial resultsAlex SmithChief Financial Officer: Altron

Group income statement ‐ highlights
R millions Aug 10 Aug 09 % change
Revenue 11 724 12 055 3%
Operating profit before capital items 691 731 5%
EBITDA 988 951 4%
EBITDA margin 8.4% 7.9%
Net investment income (35) (43)
Capital items (24) (50)
Foreign exchange losses/gains (27) (96)
Taxation (216) (234)
Headline earnings per share (cents) 99 93 6%
Adjusted diluted headline earnings per share (cents)* 105 100 5%
* Adjusted for the amortisation of intangible assets

Impact of appreciating rand
6 months to Aug 10
R m
EBITDA 507 208 270 988
EBITDA margin 10.6% 6.6% 7.1% 8.4%
Forex losses 10 12 12 27
Effect of translation of foreign ops 10 5 1 16
Adjusted EBITDA 527 225 283 1 031
Adjusted EBITDA margin 11.0% 7.2% 7.5% 8.8%
Effect of translation is difference between current year results translated at average
rates for half year, versus average rate for prior half year

Adjusted & diluted headline earnings
R millions Aug 10 Aug 09
Headline earnings 312 293
Amortisation of intangibles (net of tax and minorities)
‐ Altech 10 7
‐ Bytes 6 9
‐ Powertech 15 15
Adjusted headline earnings 343 324
Dilution adjustments
‐ Aberdare (8) 0
‐ Altech Alcom Matomo 0 (2)
‐ Dilutive options – Altech (2) (4)
Adjusted diluted headline earnings 333 318

R millions Aug 10 Aug 09
Total non‐current assets 5 719 5 235
Current assets 5 374 5 818
Cash balances 1 273 1 338
Total assets 12 366 12 391
Shareholders’ equity 4 664 4 506
Minority interests 1 414 1 384
Non‐current liabilities 908 1 305
Current liabilities 5 380 5 196
Total equity and liabilities 12 366 12 391
Summarised balance sheet

Cash flow statementR millions Aug 10 Aug 09
Operating activities
Cash generated by operations 1 013 956
Changes in working capital 31 127
Net investment expense (45) (43)
Tax paid (230) (227)
Cash available from operating activities 769 813
Dividends paid, including to minority shareholders (449) (533)
Investment activities (395) (574)
Financing activities (108) 97
Net funds utilised (183) (197)
Cash and cash equivalents at the end of period 1174 1180
Translation of foreign cash (17) (12)
Cash and cash equivalents at the end of period 974 971

58 48 46 39 43 43
5357 55
57 56 51
‐85 ‐89‐81 ‐77 ‐81 ‐80
Feb 07 Feb 08 Feb 09 Aug 09 Feb 10 Aug 10
Working capital26
21
18
Accounts receivable days
Inventory days
Accounts payable days
Net working capital days
16
R1 625mR1 989mR1 598mR1 567m Net working capital
19
14
R1 784m R1 488m
R22 336mR24 768mR21 431mR17 126m RevenueR12 055m R11 724m

Altech results Craig VenterCEO

Altech financial summary
R millions Aug 10 Aug 09 % change
Revenue 4 788 4 732 1
EBITDA 507 578 (12)
EBITDA margin 10.6% 12.2%
Adjusted diluted headline earnings 218 291 (25)

Altech divisional reviewR millions
Aug 10revenue
% growth Comments
Autopage Cellular 2 819 2 Subscriber clean‐out (lower margin). ARPU maintained.
Netstar 473 9 Continued strong growth in Fleet Management.
Tech Concepts 26 85 Stable performance, transforming from Tier 2 to Tier 1 ISP.
East Africa 314 21 East Africa remains growth engine for Altech. Lower bandwidth charges. Timing of SEACOM bandwidth sales (now all sold). Carrying cost of satellite connectivity.
Alcom 152 (12) Solid performance on back of new projects.
Fleetcall 32 19 Stable growth.
UEC 544 (9) DTT delays and uncertainty on technology standards.Improved 2nd half.
AAD 142 (6) Electronics industry under pressure.
Isis 61 13 Strengthened position with existing customers.
ACS 151 29 Continued positive growth trend, e‐Security and POS terminals .
West Africa 99 (8) Rand exchange effect. Maintained market share. Expanded product lines and services capacity.
NuPay 56 55 Strong performance.
Group eliminations (82)
Total 4 788 1

Altech – the way forward
Significantly improved performance expected for 2nd half
Adverse factors specific to 1st half will not recur
Diversify income base within TMT sector through globalisation, M&A activity and convergence opportunities
Transform Telecoms business by moving ATC up the value chain
Expand Multi‐media division’s converged services offering through continued investment in and development of innovative technologies
Strengthen leadership position in East Africa
Invest in human capital development and skills retention
Focus on optimisation of margins, cost structures, working capital and cash flow
Our journey from a telecommunications and technology company to converged services group continues…

Bytes results
Rob AbrahamCEO

1st half focus
Reorganise management team and streamline operations
Deploy performance excellence plans with reviews
Emphasis on financial results (profit and cash)
Turn around underperformers (Retail ATM, BDS UK, Intelleca)
Energise and develop our people
Customer service and brand recognition
Agree an acquisitions plan and strategy for future growth

R millions Aug 10 Aug 09 % change
Revenue 3 146 3 374 (7)
EBITDA 208 159 31
EBITDA margin 6.6% 4.7%
Adjusted diluted headline earnings 91 71 28
Bytes financial summary

CompanyAug 10revenue
% growth
Comments
Systems Integration 380 20 Profits substantially improved ‐ new business focus
Managed Solutions 365 (14) Performance slightly ahead of expectation – Retail ATM turnaround complete ☺ Good pipeline of business expected to materialise in 2nd half
Document Solutions 915 (1) Xerox division performed strongly. NOR Paper and LaserCom below par ‐better 2nd half anticipated
Connect 271 5
Outsource ‐ rock solid, strong performanceCommunications ‐ re‐energised ‐ satisfactory 1st halfIntelleca – poor performance, now restructured and reorganised, recovery dependent on new business development in medium accounts
Healthcare Solutions 99 15 Another excellent performance ‐ better than expectation. Investment in new offerings underway
People Solutions 42 15 Profitable growth, considerably better than previous year
International Operations 1 092 (20) BDS UK turned around, refocused and re‐energisedSoftware Services ‐ strong performance, better than anticipated
Bytes Namibia 11 12 Satisfactory performance
Group Eliminations (29)
Total 3 146 (7) Efficiency gains fueled 31% EBITDA improvement
Bytes divisional review

Sustain strong cash generation and excellent working capital
management achieved in 1st half
Implement growth plan
Leverage cross sell opportunities
East Africa (possibly green fields)
UK ‐ progress acquisition opportunities
South Africa ‐ continue to focus on operational excellence
Our vision – to be recognised as the best IT company in Africa
Our mission – to help our customers do great work
Bytes – the way forward

Powertech resultsNorbert ClaussenCEO

Powertech financial summary
R millions Aug 10 Aug 09 % change
Revenue 3 797 3 981 (5%)
EBITDA 270 219 23%
EBITDA margin 7.1% 5.5%
Adjusted diluted headline earnings 98 60 63%
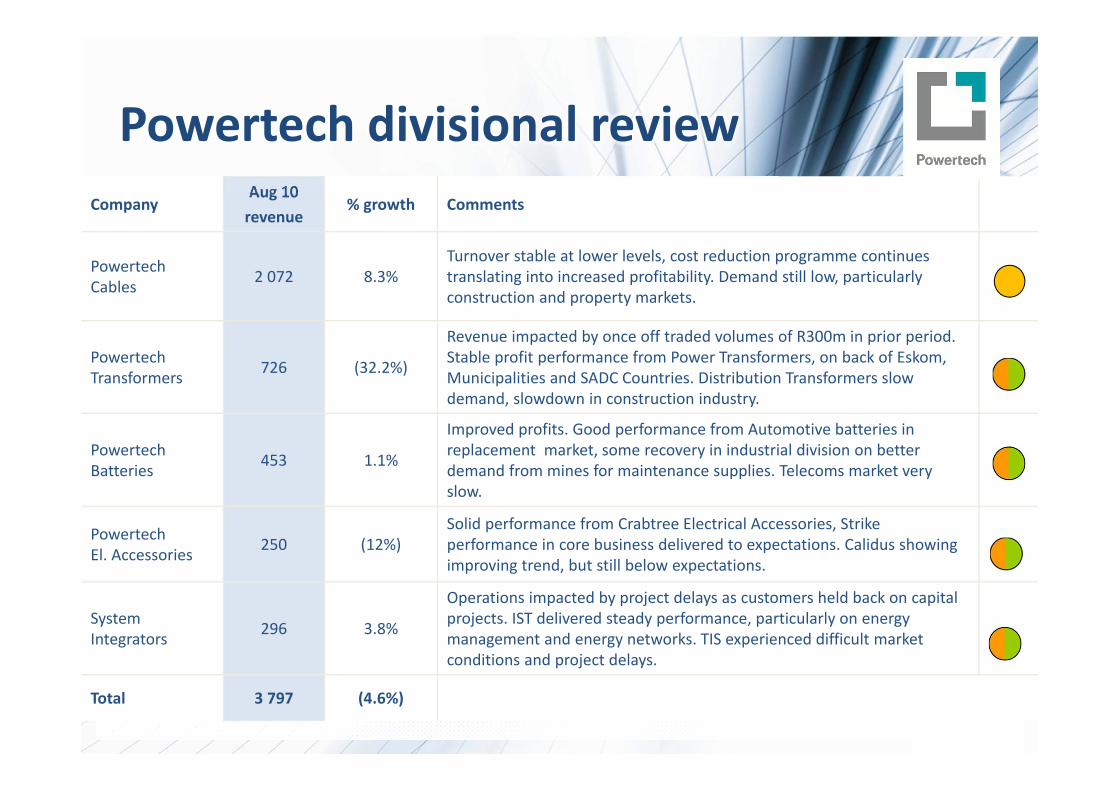
CompanyAug 10revenue
% growth Comments
Powertech Cables 2 072 8.3%
Turnover stable at lower levels, cost reduction programme continues translating into increased profitability. Demand still low, particularly construction and property markets.
Powertech Transformers 726 (32.2%)
Revenue impacted by once off traded volumes of R300m in prior period. Stable profit performance from Power Transformers, on back of Eskom, Municipalities and SADC Countries. Distribution Transformers slow demand, slowdown in construction industry.
Powertech Batteries 453 1.1%
Improved profits. Good performance from Automotive batteries in replacement market, some recovery in industrial division on better demand from mines for maintenance supplies. Telecoms market very slow.
Powertech El. Accessories 250 (12%)
Solid performance from Crabtree Electrical Accessories, Strike performance in core business delivered to expectations. Calidus showing improving trend, but still below expectations.
System Integrators 296 3.8%
Operations impacted by project delays as customers held back on capital projects. IST delivered steady performance, particularly on energy management and energy networks. TIS experienced difficult market conditions and project delays.
Total 3 797 (4.6%)
Powertech divisional review

Total Powertech order bookFeb 2009 Aug 2009 Feb 2010 Aug 2010
Aberdare Cables R 515 m R 332 m R 365 m R 332 m
Transformers R 1 535 m R 1 070 m R 862 m R 1 169 m
Batteries R 25 m R 18 m R 13 m R 20 m
Industrial R 34 m R 24 m R 30 m R 28 m
Systems Integrators R 230 m R 230 m R 230 m R 214 m
Total R 2 339m R 1 674m R 1 500m R 1 763m
0
500
1000
1500
2000
2500
Feb 09 Aug 09 Feb 10 Aug 10

Market conditions remain challenging particularly in telecoms, building and construction industries
Cost and working capital management remain focus items for management
Utilities demand for electrical products showing improving trend
Market penetration for new Switchgear product to be a focus area in next 6 months
Increase marketing of basket of Powertech products over the next year, some success with gain of contracts at utilities and industry
Exploring opportunities for turnkey solutions to adress delays in infrastructure delivery
Powertech – the way forward
Cautiously Optimistic

Altron – the road aheadRobert VenterChief Executive

Source: McKinsey Global Institute report‐Lions on the move: The progress and potential of African economies

Source: McKinsey Global Institute report‐Lions on the move: The progress and potential of African economies

Customer alliances offer opportunities in Africa – banking and retail
Altech Stream East Africa remains significant growth driver for Altech
Growth in population and working age profile
Urbanisation and rise of middle class African consumer are stimulating consumer and infrastructure spending
Bytes already active in 26 countries and are planning to extend IT presence in East Africa in collaboration with Altech
NEPAD power projects aimed at boosting electrical power generation, distribution and transmission in Africa – opportunities for Powertech
Building on group’s existing footprint in Africa
Focus on Africa

Altron in Africa
Companies with operational presence Altech Bytes Powertech
R millions Exports Sales TotalAFRICA 872 1 082 1 954Kenya 56 440 497Namibia 149 191 340Mauritius 274 61 335Nigeria 20 217 237Botswana 94 70 164Mozambique 81 41 122Tanzania 33 14 47Uganda 2 42 45% of Altron revenue 4% 5% 9%
12 months to Feb 2010

Visibility remains limited and strong rand will continue to impact on translation of results of foreign operations, reduced exports and increased competition from imports
Despite indications that economic recovery is slowing down, prospects for the second half are positive given the expected turnaround in Altech’s performance and continued recovery from Bytes and Powertech
Powertech will require enhanced demand levels to drive growth in its businesses
Board remains optimistic that group is well positioned to capitaliseon future growth opportunities
Outlook

Questions


![988 hoffman[1]](https://img.dokumen.tips/doc/110x75/559b31c91a28abdb568b4569/988-hoffman1.jpg)


