Embed Size (px)
Citation preview
Alternative Strategies to Reduce Maternal Mortality inIndia: A Cost-Effectiveness AnalysisSue J. Goldie1,3*, Steve Sweet1, Natalie Carvalho1, Uma Chandra Mouli Natchu2,4, Delphine Hu1,3
1 Center for Health Decision Science, Harvard School of Public Health, Boston, Massachusetts, United States of America, 2 Department of Nutrition, Harvard School of
Public Health, Boston, Massachusetts, United States of America, 3 Department of Health Policy and Management, Harvard School of Public Health, Boston, Massachusetts,
United States of America, 4 Pediatric Biology Centre, Translational Health Science and Technology Institute, Delhi, India
Abstract
Background: Approximately one-quarter of all pregnancy- and delivery-related maternal deaths worldwide occur in India.Taking into account the costs, feasibility, and operational complexity of alternative interventions, we estimate the clinicaland population-level benefits associated with strategies to improve the safety of pregnancy and childbirth in India.
Methods and Findings: Country- and region-specific data were synthesized using a computer-based model that simulatesthe natural history of pregnancy (both planned and unintended) and pregnancy- and childbirth-associated complications inindividual women; and considers delivery location, attendant, and facility level. Model outcomes included clinical events,population measures, costs, and cost-effectiveness ratios. Separate models were adapted to urban and rural India usingsurvey-based data (e.g., unmet need for birth spacing/limiting, facility births, skilled birth attendants). Model validationcompared projected maternal indicators with empiric data. Strategies consisted of improving coverage of effectiveinterventions that could be provided individually or packaged as integrated services, could reduce the incidence of acomplication or its case fatality rate, and could include improved logistics such as reliable transport to an appropriatereferral facility as well as recognition of referral need and quality of care. Increasing family planning was the most effectiveindividual intervention to reduce pregnancy-related mortality. If over the next 5 y the unmet need for spacing and limitingbirths was met, more than 150,000 maternal deaths would be prevented; more than US$1 billion saved; and at least one ofevery two abortion-related deaths averted. Still, reductions in maternal mortality reached a threshold (,23%–35%) withoutincluding strategies that ensured reliable access to intrapartum and emergency obstetrical care (EmOC). An integrated andstepwise approach was identified that would ultimately prevent four of five maternal deaths; this approach coupledstepwise improvements in family planning and safe abortion with consecutively implemented strategies that incrementallyincreased skilled attendants, improved antenatal/postpartum care, shifted births away from home, and improvedrecognition of referral need, transport, and availability/quality of EmOC. The strategies in this approach ranged from beingcost-saving to having incremental cost-effectiveness ratios less than US$500 per year of life saved (YLS), well below India’sper capita gross domestic product (GDP), a common benchmark for cost-effectiveness.
Conclusions: Early intensive efforts to improve family planning and control of fertility choices and to provide safe abortion,accompanied by a paced systematic and stepwise effort to scale up capacity for integrated maternal health services overseveral years, is as cost-effective as childhood immunization or treatment of malaria, tuberculosis, or HIV. In just 5 y, morethan 150,000 maternal deaths would be averted through increasing contraception rates to meet women’s needs for spacingand limiting births; nearly US$1.5 billion would be saved by coupling safe abortion to aggressive family planning efforts; andwith stepwise investments to improve access to pregnancy-related health services and to high-quality facility-basedintrapartum care, more than 75% of maternal deaths could be prevented. If accomplished over the next decade, the lives ofmore than one million women would be saved.
Please see later in the article for the Editors’ Summary.
Citation: Goldie SJ, Sweet S, Carvalho N, Natchu UCM, Hu D (2010) Alternative Strategies to Reduce Maternal Mortality in India: A Cost-Effectiveness Analysis. PLoSMed 7(4): e1000264. doi:10.1371/journal.pmed.1000264
Academic Editor: Zulfiqar A. Bhutta, Aga Khan University, Pakistan
Received September 14, 2009; Accepted March 12, 2010; Published April 20, 2010
Copyright: � 2010 Goldie et al. This is an open-access article distributed under the terms of the Creative Commons Attribution License, which permitsunrestricted use, distribution, and reproduction in any medium, provided the original author and source are credited.
Funding: John D. and Catherine T. MacArthur Foundation #07-89007-0 00GSS. The funder had no role in study design, data collection and analysis, decision topublish, or preparation of the manuscript.
Competing Interests: The authors have declared that no competing interests exist.
Abbreviations: bEmOC, basic emergency obstetrical care; cEmOC, comprehensive emergency obstetrical care; EmOC, emergency obstetrical care; GDP, grossdomestic product; MDG, Millennium Development Goal; MMR, maternal mortality ratio; PPH, postpartum hemorrhage; SBA, skilled birth attendant; TFR, totalfertility rate; YLS, year of life saved
* E-mail: [email protected]
PLoS Medicine | www.plosmedicine.org 1 April 2010 | Volume 7 | Issue 4 | e1000264

Introduction
Approximately one-quarter of all pregnancy- and delivery-related
maternal deaths worldwide occur in India, which has the highest
burden of maternal mortality for any single country [1,2]. Although the
inclusion of maternal mortality reduction in the United Nations’
Millennium Development Goals (MDGs) reflects the importance of
improving maternal health as a key mechanism in reducing poverty
and promoting social and economic growth, global progress has been
suboptimal [2–4]. Several factors may be changing the landscape for
maternal health in India in particular [5]. These factors include more
information on maternal mortality measures [6,7], an increasing
number of studies evaluating interventions [8], renewed determination
on the part of the maternal health and public health communities [9],
and, most importantly, the emergence of maternal mortality reduction
as a clear priority on the Indian national political agenda [5,10–12].
Despite consensus on the need for universal access to high-quality
intrapartum and emergency obstetrical care (EmOC), uncertainties
remain about how to adapt ‘‘ideal recommendations’’ to specific
situations [8,13]. The need for an adequate supply of skilled providers,
functional referral and transport, and well-equipped facilities for
EmOC will prove a formidable barrier in the near-term for countries
with weak health systems, as well as for states with inadequate health
delivery infrastructure and for communities in predominantly rural
areas [13]. This challenge will be particularly relevant for India, with its
largely rural population, and striking disparities between states. For
example, while Kerala reports a maternal mortality ratio (MMR) of
fewer than 100 maternal deaths per 100,000 live births, rural Uttar
Pradesh and Rajasthan report MMRs of more than 400 [14,15].
To most effectively leverage India’s national commitment to
reducing maternal mortality, identifying evidence-based strategies
that consider the local context is imperative. Our analysis is
motivated by questions that include: What are the fundamental
drivers of the effectiveness, cost-effectiveness, and affordability of a
package of interventions to reduce maternal mortality? Because
adequate facilities, health infrastructure, and skilled human
resources will not be readily available in all settings, can we provide
interim guidance to policy makers? While no single empirical study
can provide clear answers to these questions, a modeling approach
within a decision-analytic framework can extend empiric informa-
tion by extrapolating outcomes beyond the time horizon of a single
study, can facilitate synthesis of multiple data sources in an
internally consistent and epidemiologically plausible way [16], and
may be adapted to specific settings so that existing infrastructure,
resources, and political realities can be considered.
Previous model-based studies have provided important insights into
the potential high public health value of reducing maternal deaths,
however, many of these have not considered the full range of
interventions to reduce maternal mortality, such as family planning,
safe abortion, and intrapartum care [7,17,18]. Some have only focused
on single interventions [19–21], others have not included costs [22],
and recent analyses that did assess multiple strategies did not explicitly
model critical barriers to life-saving referral, such as recognition of
referral need and accessible transport [23,24]. Taking into account the
costs, feasibility, and operational complexity of alternative interven-
tions, we extend this body of work to estimate the clinical and
population-level benefits associated with a comprehensive set of
strategies to improve the safety of pregnancy and childbirth in India.
Methods
Analytic OverviewThe best available data were synthesized using a computer-
based model that simulates the natural history of pregnancy and
relevant comorbidities, aggregates individual outcomes to the
population level, and reflects setting-specific epidemiology.
Separate models were adapted to urban and rural India using
data on antenatal care, family planning, facility births, and skilled
birth attendants (SBAs), and information about access to transport,
referral facilities, and quality of care. Model outcomes include
clinical events (e.g., pregnancies, live births, maternal complica-
tions), measures of maternal mortality (e.g., MMR, proportionate
mortality ratio [i.e., proportion of deaths that are pregnancy-
related among women aged 15–45 y], and lifetime risk of maternal
death), population outcomes (e.g., life expectancy), and economic
costs.
We evaluated alternative approaches to reducing maternal
mortality in settings in India that differ according to underlying
maternal risk, health, and socioeconomic status. Interventions can
be provided individually or packaged into integrated services.
Following standard recommendations for economic evaluation
[25], strategies are first ranked in terms of increasing costs and
benefits; those that are less effective and more costly than an
alternative strategy are considered inefficient, and those that cost
less than the status quo are considered ‘‘cost saving.’’ For all other
strategies, we calculate an incremental cost-effectiveness ratio,
defined as the additional cost of a specific strategy divided by its
additional clinical benefit, compared with the next least expensive
strategy. We considered interventions with cost-effectiveness ratios
of less than the per capita gross domestic product (GDP)
(US$1,068) to be very cost-effective as suggested by the
Commission on Macroeconomics and Health. Sensitivity analyses
are conducted to assess the impact of parameter uncertainty.
The ModelThe computer-based Global Maternal Health Policy Model
simulates the natural history of pregnancy (both planned and
unintended) and pregnancy- and childbirth-associated complica-
tions (Figure 1). This model defines health states to reflect
important characteristics that affect prognosis, quality of life, and
resource use. The time horizon incorporates a woman’s lifetime
and is divided into equal time increments during which women
transition from one health state to another. Nonpregnant girls
enter the model and in each time period may become pregnant
depending on age, use of contraception, and clinical history
(Figure 1, upper panel). Once pregnant, women have a chance of
spontaneous abortion (i.e., miscarriage), induced abortion, or
continued pregnancy. A proportion of induced abortions will be
unsafe (i.e., surgical or medical abortion conducted by untrained
personnel). Labor and delivery may be associated with a direct
complication of pregnancy (e.g., hypertensive disorders of
pregnancy, obstructed labor, hemorrhage, sepsis). Case fatality
rates are conditional on the type and severity of complication (e.g.,
moderate sepsis requiring antibiotics versus severe hemorrhage
requiring blood transfusion) and underlying comorbidity (e.g.,
anemia). Nonfatal complications include neurological sequelae,
rectovaginal fistula, severe anemia, and infertility (Figure 1, upper
panel). In addition to death from maternal complications, women
face an annual risk of death from age-specific all-cause mortality.
Strategies in the model to reduce maternal mortality consist of
improving coverage of effective interventions, which may be
provided individually or packaged as integrated services. In
addition to family planning, antenatal care (i.e., prenatal care)
and treatment of anemia, safe abortion, and postpartum care, the
model includes both intrapartum interventions that reduce the
incidence of a complication (e.g., misoprostol for postpartum
hemorrhage [PPH], clean delivery for sepsis), as well as those that
Reducing Maternal Mortality in India
PLoS Medicine | www.plosmedicine.org 2 April 2010 | Volume 7 | Issue 4 | e1000264

Figure 1. Schematic of the model. Upper panel: Model simulates the natural history of pregnancy (both planned and unintended) andpregnancy- and childbirth-associated complications. Case fatality rates for complications depend on severity and comorbidity. General interventioncategories (open red boxes) include family planning for spacing or limiting births, antenatal or prenatal care (and treatment of anemia), safe abortion,intrapartum care (e.g., active management of labor), basic and comprehensive EmOC, and postpartum care. Interventions can reduce the incidence orseverity of a complication or can reduce the case fatality rate through appropriate treatment. Lower panel: Model reflects the intervention pathwayduring labor and delivery, including location (home, birthing or health center, bEmOC, cEmOC), attendant (family member, traditional birth attendant[TBA], or SBA), and three potential barriers to effective treatment in the event of a complication, including recognition of referral need, transfer (e.g.,
Reducing Maternal Mortality in India
PLoS Medicine | www.plosmedicine.org 3 April 2010 | Volume 7 | Issue 4 | e1000264

reduce the case fatality rate through appropriate management in a
referral facility (Figure 1, upper panel).
The effectiveness of interventions to either reduce the incidence
of complications or to reduce case fatality rates associated with
complications depends, in part, on access to specific services (e.g.,
trained SBA) and to specific levels of facilities (e.g., comprehensive
EmOC [cEmOC] with capacity for blood transfusion). Accord-
ingly, the ultimate impact of interventions depends on several
setting-specific factors. These include delivery site, presence of
birth attendant, quality and type of referral facility, as well as
successful referral when necessary. The model therefore explicitly
considers the location of delivery, type of assistance, access to basic
or comprehensive obstetrical care, and the ability to overcome a
series of barriers around the timing of delivery (e.g., recognition of
referral need, reliable transport, timely treatment at an appropri-
ate referral facility); these factors collectively determine the health
services a woman can access and the specific interventions that
would be included (Figure 1, lower panel).
Delivery setting is differentiated by provider (e.g., family
member, traditional birth attendant [TBA], or SBA) and by site
(e.g., home versus facility). Facility levels are categorized as (1)
birthing centers or health centers, which cannot provide all
services necessary to qualify as a basic emergency obstetrical care
(bEmOC) facility, but are staffed with SBA who provide expectant
management of labor and more reliable referral when necessary
than with delivery at home; (2) facilities with bEmOC capacity
(e.g., first referral units); and (3) facilities with cEmOC capacity
(e.g., district hospitals) [26,27]. Facilities capable of bEmOC are
assumed to be capable of administering injectable antibiotics,
oxytocics, and sedatives or anticonvulsants, and performing
manual removal of placenta, removal of retained products, and
assisted vaginal delivery. Facilities capable of cEmOC also are able
to provide blood transfusion, cesarean section, and management of
advanced shock.
This model also allows us to evaluate phased approaches that
involve scaling up access to services over time; the stepwise
investments in infrastructure required to assure high-quality
intrapartum care are designated as ‘‘upgrades.’’ In addition to
reducing unmet need for family planning and unsafe abortion,
four consecutively implemented strategies increased skilled atten-
dants, improved antenatal/postpartum care, incrementally shifted
births away from home, and improved the availability and quality
of EmOC. For women delivering at home or in birthing centers,
these ‘‘upgrades’’ also improved recognition of referral need,
access to transport, and expedient referral to an appropriate
facility (Figure 2).
All models were built using TreeAge Pro 2008 (TreeAge
Software Inc.) and analyzed using IBM/Lenovo Dual-Core VT
Pro Desktop computers running Microsoft Windows XP, using
Microsoft Excel 2007 and Visual Basic for Applications 6.5
(Microsoft Corp.). We used Monte Carlo simulation to generate
the number of per woman events such as pregnancies, live births,
facility-based births, and maternal complications.
DataSelected parameters and assumptions used in the model are
provided in Tables 1 and 2 [7,14,15,17,22,23,28–73]. Additional
details are provided in Text S1. Initial estimates of incidence and
case fatality rates associated with pregnancy-related complica-
tions were obtained from published data, and a plausible range
for sensitivity analysis was based on review of the literature. Case
fatality rates were adjusted based on complication severity (e.g.,
life-threatening complications requiring cEmOC) and underlying
severity of anemia (Table 1; Text S1). The effectiveness of
interventions to reduce the incidence of complications (e.g.,
active management of labor) was estimated from published
studies using methods detailed in Text S1. The effectiveness of
interventions to reduce case fatality rates was from published
studies and assumed treatment in an appropriate facility; a
wide plausible range was used for sensitivity analyses (Table 1;
Text S1). Data on facility births, SBAs, family planning for
spacing or limiting births, and antenatal care were from country-
specific surveys [28].
For women delivering at home or in a birthing center, the
probability of successful referral depended on overcoming three
potential barriers [74]: (1) delay in recognizing referral need; (2)
delay in transfer to referral facility (means of transport and interim
care en route); (3) delay in receiving appropriate care at the
appropriate EmOC facility such as inadequate staffing and
supplies, inexpedient attention (e.g., delay to collect fees), and/or
non-evidence-based or substandard care. Assumptions about the
latter two delays were based on survey data (e.g., National Family
Health Survey [NFHS-3] [28,75], District Level Household
Survey [DLHS] [76], and Facility Survey [26]), state-level facility
surveys [77,78], government reports [27], and published studies
(Text S1) [14,15,79–83].
Model performance was assessed by comparing the distribution
of direct causes of maternal mortality, life expectancy, propor-
tionate mortality ratio, MMR, and total fertility rate (TFR) to
empiric data [2,14,15,28,29,32,38,84–87] in rural and urban
India. Model validation was assessed by using state-specific data
from Rajasthan and Uttar Pradesh as model inputs, and
comparing model-projected indicators of maternal mortality with
survey-reported outcomes [14,15]. In addition, a secondary
analysis assessing all strategies evaluated in the base case was
conducted in Uttar Pradesh. Details of this process are included in
Text S1.
CostsSelected costs used in the model are provided in Table 3
[18,25,80,88–94]. Details are provided in Text S1. With the
exception of facility costs, salaries, and transport costs, resource
requirements to deliver interventions and the costs of maternal
complications were estimated from the United Nations Population
Fund’s (UNFPA) Reproductive Health Costing Tools Model
(RHCTM) [88]. The RHCTM uses an ingredients approach to
estimate direct costs (including drugs, supplies, and personnel
requirements) of 45 reproductive health interventions, as well as
investments required for scale-up. We obtained personnel costs
(salaries) and facility costs from public access country-specific
databases [25,89], and drugs and supply costs from the UNICEF
Supply Catalogue and Management Sciences for Health (MSH)
International Drug Price Indicator Guide [90,91]. We leveraged
public access sources and published studies to inform assumptions
about the financial requirements for improving transport and
scaling up facility- and human-resource capacity [7,30,80,92,93].
We assessed the face validity of model input values and established
a plausible range for sensitivity analysis by comparing estimates to
transport), and timely quality care in an appropriate EmOC facility. Management of labor and delivery depends on attendant (e.g., SBA, clean delivery)and site (e.g., expectant management in birthing center, active management in EmOC facility), as does access to specific levels of treatment (e.g.,blood transfusion only available in cEmOC).doi:10.1371/journal.pmed.1000264.g001
Reducing Maternal Mortality in India
PLoS Medicine | www.plosmedicine.org 4 April 2010 | Volume 7 | Issue 4 | e1000264

those in published studies (Text S1). All costs were converted to
2006 US$.
Results
Model ValidationModel-estimated life expectancy for a 15-y-old female was 55 y
compared to the World Health Organization’s (WHO) estimate of
55.1 y [85]. The distribution of maternal deaths by cause closely
approximated published regional estimates (Table 1) [29]. Model-
generated estimates of TFR and MMR for India, stratified for
rural and urban status, closely approximated survey-reported
values [1,2,28,38], as did the state-specific models for Rajasthan
and Uttar Pradesh (Table 2) [14,15]. Model predicted deaths for
2005, taking into account direct and indirect causes of maternal
mortality, were 117,657, compared to 117,000 estimated by
UNICEF, WHO, and UNFPA [86,87].
Enhanced Family Planning and Safe AbortionIncreased family planning to reduce the unmet need (for spacing
and limiting births) by amounts ranging from 25% to 100%,
reduced maternal deaths by amounts ranging from 7.0% to 28.1%
in rural India and 5.8% to 23.5% in urban India (Table 4). In
rural India, eliminating the unmet need for family planning
decreased the TFR from 2.97 to 2.14, the proportion of deaths
that are pregnancy related from 16.4% to 12.3%, and the lifetime
risk of maternal death from 1 in 65 to 1 in 90. In rural India alone,
the cost savings for a single birth cohort of 15-y-old girls (2010)
that would be expected to accrue over their reproductive lifespans
ranged from US$111.4 million to US$448.2 million. Reducing the
unmet need, coupled with provision of safe abortion, provided
synergistic benefits and saved additional costs (Table 4). Results
were similar in urban India, although the amount of deaths
averted and costs saved were smaller, reflecting both the lower
initial TFR and the smaller population size (Table 4).
Increased family planning to reduce the unmet need also reduced
the number of deaths attributable to unsafe abortion (Figure 3). For
example, in rural India increasing contraceptive rates to 67.6% cut
abortion-related deaths by more than 50%—even with no change in
rates of unsafe abortion. Adding improved access to safe abortion and
postabortion care for three out of four women pursuing elective
termination of pregnancy prevented an additional 22% to 50% of
abortion-related deaths, depending on the underlying level of unmet
need; similarly, the additional cost savings ranged from 22% more, to
more than double the savings expected from family planning alone.
Interventions Packaged as Integrated ServicesOur results suggest that reaching the MDG 5 goal of a 75%
reduction in maternal mortality would require investments
targeting the intrapartum period, in addition to family planning
and safer abortion. Without these additional strategies, the model
predicts a ceiling on the level of maternal mortality reduction
achievable, ranging from 32% in urban India to 34% in rural
India.
Figure 2. Stepwise improvements in scaling up maternal services. Four strategies that scale up access to critical maternal health services inconsecutive phases are designated as upgrade 1, upgrade 2, upgrade 3, and upgrade 4. Shown are the percent increases in facility-based delivery,SBAs, recognition of referral need (by SBA at birthing/health center), transport (to appropriate referral facility), and availability/quality of EmOC(including adequate staff/supplies, appropriate clinical treatment, immediate attention), for rural and urban India. Shifts from home births assume a70% shift to health centers/birthing centers and a 30% shift to EmOC; for routine births in EmOC, we assume 90% bEmOC and 10% cEmOC.Alternatives evaluated in sensitivity analysis (Results and Text S1).doi:10.1371/journal.pmed.1000264.g002
Reducing Maternal Mortality in India
PLoS Medicine | www.plosmedicine.org 5 April 2010 | Volume 7 | Issue 4 | e1000264

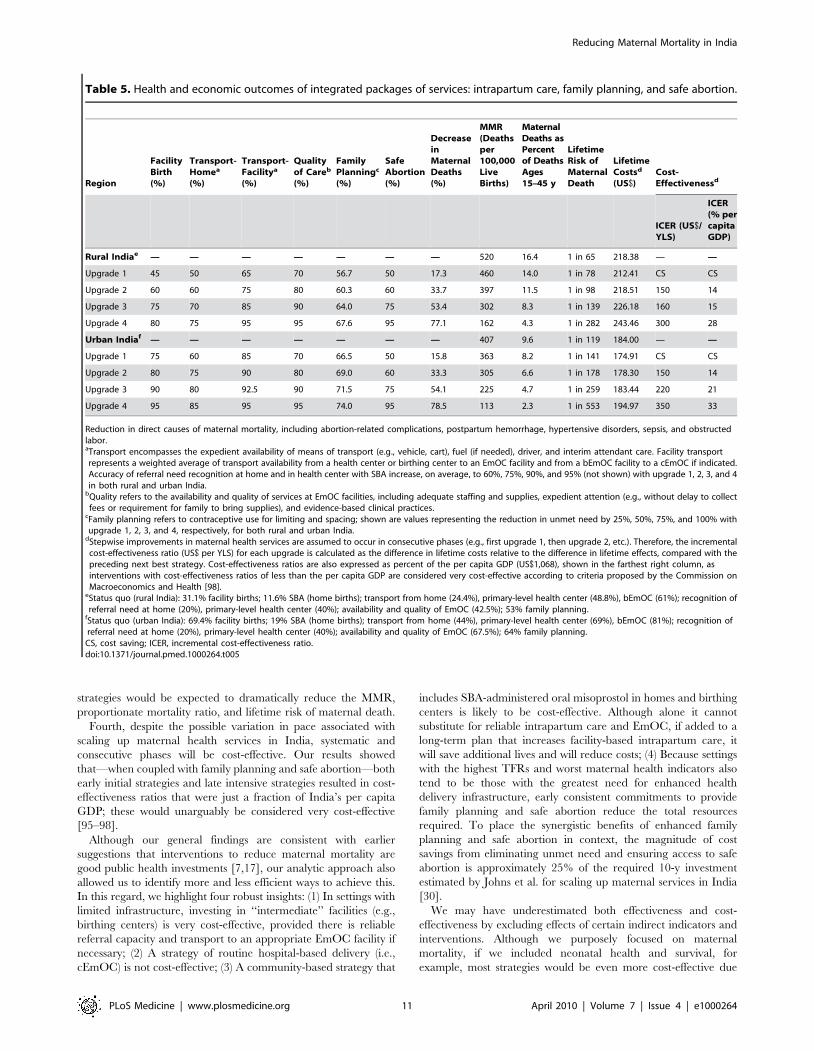
Table 5 shows the health and economic outcomes associated
with interventions packaged as integrated services; these
included phased approaches that scale up access to intrapartum
services over time in rural (upper section) and urban India (lower
section), coupled with incremental improvements in family
planning and safe abortion. The four stepwise ‘‘upgrades’’
incorporated improvements in available SBAs for home births,
recognition of referral need, transport, and availability/quality
of EmOC, as well as shifts from home- to facility-based
delivery.
Compared to the status quo in rural India (upper section,
Table 5), our model predicted that integrated strategies coupling
family planning and safe abortion with four consecutive
‘‘upgrades’’ would be expected to reduce maternal deaths by
17.3% to 77.1%, the MMR to less than 200, proportionate
mortality ratio by 14% to 4%, and lifetime risk of maternal
mortality from one in 78 to one in 282. Compared to the status
quo in urban India (Table 4, lower section), similar reductions in
maternal deaths were predicted; although the number of absolute
lives saved would be lower, the MMR, lifetime risk, and
proportionate mortality ratio would be expected to decline to
113, one in 553, and 2.3%, respectively, with the most intensive
strategy (upgrade 4).
Because the stepwise improvements in each component of the
integrated package (intrapartum care, family planning, and safe
abortion) were assumed to occur in consecutive phases, the
incremental cost-effectiveness ratio for each ‘‘upgrade’’ strategy
was calculated as the difference in costs relative to the difference in
effects, compared with the preceding next best strategy. While the
initial strategy was cost saving in both urban and rural India,
Table 1. Selected model parameters: Incidence and mortality of pregnancy and delivery-related complications, and impact ofinterventions.
Parameter Hemorrhage Obstructed LaborHypertensiveDisorders Sepsis Unsafe Abortion
Incidence and mortality
Probability of event [15,29,31–44] 0.114 0.047 0.035 0.050 0.128a
Range 0.051–0.228 0.030–0.074 0.025–0.050 0.043–0.060 0.050–0.250
Probability of morbidity [28,30,45–48]b 0.008 0.022 0.001 0.400 0.120
Range 0.006–0.010 0.018–0.026 0.001–0.001 0.320–0.480 0.096–0.144
CFR [7,49–51] 0.010 0.007 0.017 0.013 0.003
Adjusted CFRc 0.023 0.019 0.021 0.028 0.009
Range 0.007–0.030 0.005–0.025 0.012–0.027 0.009–0.036 0.002–0.012
Attributable mortality [29]d 46.2% (9%–73%) 14.1% (3%–52%) 13.7% (0%–18%) 17.4% (0%–20%) 8.6% (0%–20%)
Model-projected attributable mortality 40.6% 16.8% 12.3% 20.4% 9.8%
Impact of interventions
Decreased incidence [34,37]e 50%,75%e — — 25%, 50%f —
Rangef 25%–91% — 25%–50% 0%–60% 0%–100%
Decreased CFR [7,17,50,52–64]g 75% 95% 59% 90% 98%a
Rangef 60%–90% 76%–100% 45%–95% 63%–93% 50%–100%
See [7,14,15,17,22,23,28–64,69–73].aIncidence of elective abortion is 0.170, and 75% are assumed to be unsafe in the base case [15,29,39–44]. Case fatality rate (CFR) of safe abortion is 0.000006,representing a 98% reduction in mortality [50,62–64]. For more details on abortion-related assumptions, see Text S1. Incidence of miscarriage (not shown) is 0.150[69,70].
bSpecific examples of nonfatal complications include Sheehan’s Syndrome following maternal hemorrhage, fistula resulting from obstructed labor, neurologicalsequelae from eclampsia, pelvic inflammatory disease (PID). Not shown but included are the risk of infertility from PID (0.086) and the risk of severe anemia followingmaternal hemorrhage (0.09) [23,45,46].
cCFRs were adjusted based on complication severity (e.g., life threatening complications requiring cEmOC) and underlying severity of anemia [71]. See Text S1.dEstimates for distribution of causes of maternal mortality for India are from India overall estimates from Khan et al. [29], based on the entire Asia region, as well as other
data to establish a range for sensitivity analysis [14,15]. Cause-specific proportions sum to 66%, reflecting approximately 33% indirect causes, although this varies from15% to 35% in different studies. Estimates shown reflect adjustment of data from Khan et al. [29] such that a distribution is shown for the 66% of direct causes, tocompare to model output. Further, anemia was reported to be responsible for 15% of deaths and was assumed to exert mortality impact on direct causes throughseverity of PPH, sepsis, and unsafe abortion.
eIncidence of sepsis reduced by 50% with SBA and clean delivery in birthing center, bEmOC, and cEmOC; and reduced by 25% with SBA and clean delivery at home [37].Incidence of maternal hemorrhage reduced by 50%–75% depending on expectant versus active management of labor; we assume for the status quo, all cEmOCfacilities provide active management, 50% of bEmOC facilities provide active management, and birthing centers/health centers provide expectant management only[34]. Exploratory analyses that estimate the impact of community-based provision of oral misoprostol in birthing centers and at home assume a 25% to 50% reductionin PPH [22,72]. For each baseline estimate, sensitivity analysis was conducted across a plausible range based on literature review; references are documented in theText S1.
fFor each baseline estimate, sensitivity analysis was conducted across a plausible range based on literature review; references and assumptions are documented in theText S1.
gEstimates shown represent average reduction in case fatality rate provided complications necessitating surgery (e.g., cesarean section), blood transfusion, intensivehemodynamic support are treated in cEmOC. Obstructed labor is managed using assisted vaginal delivery with forceps or vacuum and, if necessary, cesarean section;severe pre-eclampsia and eclampsia treated with intravenous hydralazine and magnesium sulfate, in addition to induction of labor or emergency cesarean sectionwhen required; sepsis treated with ampicillin, gentamycin, and metronidazole or equivalent regimen followed by an 8-d course of intramuscular gentamycin and oralmetronidazole (see Text S1 for details) [7,73].
doi:10.1371/journal.pmed.1000264.t001
Reducing Maternal Mortality in India
PLoS Medicine | www.plosmedicine.org 6 April 2010 | Volume 7 | Issue 4 | e1000264

incremental cost-effectiveness ratios ranged from US$150 to
US$300 per YLS in rural India and from US$150 to US$350
per YLS in urban India. Cost-effectiveness ratios are also
expressed as percent of the per capita GDP (US$1,068). Even
the most intensive and effective strategic package was well below
50% of the per capita GDP.
In contrast to these integrated strategies, implementing only the
stepwise intrapartum care upgrades—without family planning and
safe abortion—was less effective and less cost-effective. The
incremental cost-effectiveness ratios ranged from US$490–
US$1,060 in rural India and US$200–US$990 per YLS in urban
India (Text S1).
Integrated Safe Motherhood Interventions in Rural UttarPradesh
Figure 4 (upper panel) displays the health outcomes associated
with stepwise approaches to improve maternal health in rural Uttar
Pradesh. The vertical axis (from bottom to top) shows outcomes
associated with increased access to family planning and safe
abortion; the horizontal axis (from left to right) displays outcomes
associated with investments in high-quality health-center–based
intrapartum care (e.g., facility, attendance, referral, transport,
EmOC). In Figure 4 (upper panel) the cell located in the far left
lower corner represents current conditions in rural Uttar Pradesh.
Table 2. Selected model parameters and assumptions: Coverage of interventions and maternal health indicators by setting.
Parameter India India, Urban India, Rural Rajasthan Uttar Pradesh, Rural
Coverage of contraception (%) [28]
Family planning (any method) 56.3 64.0 53.0 47.2 39.7
Modern methods 48.5 55.8 45.3 44.4 25.2
Pill 6.4 7.0 6.2 4.5 5.2
IUD 3.7 6.1 2.4 3.6 3.2
TOL 76.9 67.7 81.9 77.0 66.7
Condom 10.9 17.9 7.3 12.8 24.6
Unmet need 13.2 10.0 14.6 14.6 23.8
Coverage of prenatal care (%) [28]
Prenatal care 50.7 73.8 42.8 41.2 22.6
Treatment for anemiaa 22.3 34.5 18.1 13.1 6.7
Delivery location (%) [28]
Total skilled delivery 48.3 75.2 39.1 41.0 23.8
Facility deliveryb 40.7 69.4 31.1 29.6 17.5
Home delivery with SBAb 12.8 19.0 11.6 16.2 7.6
Assumptions for available transport/interimcare to appropriate facility (%) [65,66]
From home to EmOC 30.4 44.4 24.4 24.4 18.1
Range 20–40 35–55 15–35 20–40 15–30
From HC or BC to EmOC 54.8 68.8 48.8 48.8 36.1
Range 40–65 60–80 40–60 30–55 25–45
From bEmOC to cEmOC 67.0 81.0 61.0 61.0 45.1
Range 55–80 70–90 50–70 50–70 35–55
Assumptions for available facility,staff/supplies, quality of care (%) [67,68]
EmOC 50.0 67.5 42.5 42.5 31.5
Range 40–60 55–80 30–55 30–55 20–40
Maternal health indicators
TFR [28] 2.68 2.07 2.98 3.21 4.13
Model-projected TFRc 2.70 2.07 2.97 3.24 4.13
Model-projected MMRc 440 407 520 524 633
See [14,15,28,65–68,71].aCase fatality rates (CFRs) were adjusted based on complication severity (e.g., life threatening complications requiring cEmOC) and underlying severity of anemia [71].See Text S1.
bRoutine deliveries in EmOC facilities assume that 90% would be in bEmOC and 10% in cEmOC. Alternative assumptions explored in sensitivity analysis (Text S1). Wecalculated the percentage of births with skilled attendance at home by subtracting the percentage delivered in facilities (which we assume are with skilled attendance)from the total of births with skilled attendance: (total skilled delivery2facility based births)/home births; for rural India: (0.39120.311)/(120.311) = 0.116 or 11.6%.
cUsing the empirically calibrated India model, we parameterized the state-level models for Rajasthan and Uttar Pradesh and adjusted for the TFR as reported in NFHS 3[28]. To provide comparison, reported MMRs for Uttar Pradesh include an estimate of 707 from Mills [14], and prior data from SRS including the SRS 2001–2003 estimateof 517 (confidence interval [CI] 461–573), SRS 1999–2001 estimate 539 (481–596), and the SRS 1997–98 (606, CI 544–668) [15]. For Rajasthan, we used the 2001–2003,special survey of deaths using RHIME, which reported 445 (371–519), and SRS 1999–2001, which reported 501 (423–580) [15].
BC, birthing center; HC, health center; IUD, intrauterine device; TOL, female sterilization.doi:10.1371/journal.pmed.1000264.t002
Reducing Maternal Mortality in India
PLoS Medicine | www.plosmedicine.org 7 April 2010 | Volume 7 | Issue 4 | e1000264

Each of the other cells represents a unique strategy; the reduction in
maternal deaths expected with each strategy, relative to current
conditions, is shown. For example, a strategy that reduced the
unmet need by 75%, increased safe abortion to 60%, and
implemented improvements to intrapartum care consistent with
upgrade 3, reduced maternal deaths by 57%.
In Figure 4 (upper panel) each cell is also color-coded to
reflect the cost-effectiveness profile associated with the partic-
ular strategy. Strategies that only employed family planning and
safe abortion (vertical axis, from bottom to top) were generally
cost saving, but reduced mortality by a maximum of 40%.
Strategies that only invested in intrapartum care improvements
Table 3. Selected model input costs.
Cost Components Base Case Rangea
Family planning [25,88]
Oral contraceptives 10.64 6.03–15.96
Injectable contraceptives 10.20 4.92–15.30
Condoms 8.40 3.79–12.60
Intrauterine device 9.17 2.58–13.76
Female sterilization 18.98 9.49–28.47
Male sterilization 12.67 6.34–19.01
Antenatal careb [25,88]
Four visits 17.82 8.54–25.61
Abortionc [25,88,94]
Incomplete abortion 8.90 4.45–17.80
Elective abortion 21.87 10.94–43.74
Postabortion complications 43.40 21.70–86.80
Deliveryd [25,88]
Home (TBA, SBA) 4.52, 6.44 0–9.66
Facility (birthing center, bEmOC, cEmOC) 14.46, 24.58, 32.54 7.23–48.81
Community-based interventionse
Misoprostol (home, birthing center) 0.99 0.75–2.00
SBA training 3.40 0.62–5.00
Transportation costsf
Home to facility 3.62–8.13 1.81–12.20
Birthing/health center/bEmOC to referral facility 4.88–7.14 2.44–10.71
Management of complicationsg [25,88]
Obstructed labor 70.16 12.76–139.38
Maternal hemorrhage 67.99 18.40–212.51
Puerperal sepsis 47.92 23.15–111.02
Severe pre-eclampsia/eclampsia 65.85 33.50–153.62
Postpartum careh [25,88]
One visit 4.99 1.04–7.49
See [18,25,80,88–94].Estimates of costs under current standard of care (2006 US$). Estimates for the base case were country-specific and from UNFPA’s Reproductive Health Costing ToolsModel (RHCTM) [88] and WHO CHOICE/public databases [25,89–91], unless otherwise specified. Costing details and methods for converting costs to 2006 US$ areprovided in the Text S1.aRanges for sensitivity analyses established on the basis of assumptions and other published literature documented in the Text S1.bAntenatal care includes tetanus vaccination, syphilis, gonorrhea, chlamydia screening (and treatment), urinalysis, blood tests, treatment for anemia, counseling (e.g.,
family planning, spacing, intrapartum care).cPostabortion complications assumed to require manual vacuum aspiration, treatment of sepsis in 25%, surgical repair in 25% [92].dTotal costs reflect skill level of attendant, level of facility, and drugs and supplies. For example, delivery at birthing center (US$14.46) includes personnel (US$6.44),
facility (US$4.52), and drugs and supplies (US$3.50). Other assumptions documented in the Text S1.eCommunity-based interventions evaluated in sensitivity analysis included SBA-administered misoprostol to reduce incidence of PPH in deliveries at home and inbirthing centers. Costs for misoprostol (US$0.99) and training (upper bound, US$3.40) based on assumptions presented in Sutherland and Bishai [18]; these costsrepresent the incremental costs above routine SBA delivery.
fTransport costs include those incurred from home to a referral facility (bEmoc or cEmOC), and those incurred between facilities when necessary (e.g., bEmOC tocEmOC). Assumptions based on literature [80,93,94] and public access data described in the Text S1.
gEstimates shown represent average total costs using case-specific unit costs weighted by severity. Complications requiring surgery (e.g., cesarean section), bloodtransfusion, intensive hemodynamic support assumed to require cEmOC. Details of unit cost assumptions for facility-specific treatment documented in Text S1.
hPostpartum care includes examination, iron/folate supplementation, and counseling.TBA, traditional birth attendant.doi:10.1371/journal.pmed.1000264.t003
Reducing Maternal Mortality in India
PLoS Medicine | www.plosmedicine.org 8 April 2010 | Volume 7 | Issue 4 | e1000264

(horizontal axis, left to right) were generally associated with the
highest cost-effectiveness ratios (i.e., least attractive), reflecting
the higher costs required for infrastructure improvements. An
overarching strategic approach that moves along the diagonal,
from the lower left corner to the upper right corner, was most
effective and cost-effective; the cost savings from enhanced
family planning and safe abortion offset the resources required
to improve intrapartum care.
Sensitivity AnalysesFor deliveries at home and in birthing centers in rural Uttar
Pradesh, removing only one ‘‘delay’’ in accessing EmOC had
minimal impact (,5%) on lowering maternal mortality and was
not cost-effective (e.g., US$700–US$4,900 per YLS) (Figure 4,
lower panel). In contrast, an integrated strategy that made modest
improvements in all components (e.g., SBA, referral, transport,
and quality) reduced mortality by 22%. Cost-effectiveness of an
Table 4. Health and economic outcomes of family planning to reduce the unmet need for limiting and spacing births, and safeabortion, in rural and urban India.
Strategy
LifetimeDeaths per100,000Women
Reductionin MaternalDeaths
ProportionateMortality Ratio
Lifetime Riskof Death Dueto MaternalComplications
Model-projectedSavings fora Single BirthCohort of 15 yolds (US$)a
Cost Savingsfor a SingleYear (CurrentDistribution of15–45 y Olds inIndia) (US$)b
Rural India, current conditions (TFR, 2.97)c 1,543 — 16.4% 1 in 65 NA —
Family planning
Reduce unmet need 25% (56.7%) 1,435 7.0% 15.4% 1 in 70 111,357,615 60,200,655
Reduce unmet need 50% (60.3%) 1,327 14.0% 14.4% 1 in 75 223,221,615 120,611,563
Reduce unmet need 75% (64.0%) 1,218 21.1% 13.4% 1 in 82 335,439,615 181,233,496
Reduce unmet need 100% (67.6%) 1,109 28.1% 12.3% 1 in 90 448,188,615 242,067,230
Safe abortion
Increase safe abortion 50% 1,517 1.7% 16.2% 1 in 66 48,080,115 42,078,125
Increase safe abortion 75% 1,473 4.5% 15.8% 1 in 68 130,739,115 114,289,234
Increase safe abortion 95% 1,433 7.1% 15.4% 1 in 70 214,460,115 167,790,590
Family planning and safe abortion
Reduce unmet need (56.7%), safe abortion 75% 1,369 11.3% 14.8% 1 in 73 233,930,115 166,870,014
Reduce unmet need (60.3%), safe abortion 75% 1,265 18.0% 13.8% 1 in 79 337,386,615 219,568,526
Reduce unmet need (64.0%), safe abortion 75% 1,160 24.8% 12.8% 1 in 86 441,108,615 272,385,038
Reduce unmet need (67.6%), safe abortion 95% 1,026 33.5% 11.5% 1 in 98 580,230,615 362,579,472
Urban India, current conditions (TFR, 2.07)d 842 — 9.6% 1 in 119 NA —
Family planning
Reduce unmet need 25% (66.5%) 793 5.8% 9.1% 1 in 126 22,089,305 12,838,532
Reduce unmet need 50% (69.0%) 743 11.7% 8.6% 1 in 135 44,214,305 25,696,437
Reduce unmet need 75% (71.5%) 694 17.6% 8.1% 1 in 144 66,398,305 38,578,054
Reduce unmet need 100% (74.0%) 644 23.5% 7.5% 1 in 155 88,611,805 51,483,279
Safe abortion
Increase safe abortion 50% 822 2.4% 9.4% 1 in 122 11,351,305 9,742,159
Increase safe abortion 75% 788 6.4% 9.1% 1 in 127 30,821,305 26,413,778
Increase safe abortion 95% 758 9.9% 8.7% 1 in 133 50,438,805 36,823,443
Family planning and safe abortion
Reduce unmet need (66.5%), safe abortion 75% 741 11.9% 8.6% 1 in 135 51,235,305 37,766,193
Reduce unmet need (69%), safe abortion 75% 695 17.5% 8.1% 1 in 144 71,649,305 49,126,308
Reduce unmet need (71.5%), safe abortion 75% 648 23.0% 7.6% 1 in 154 92,122,305 60,499,204
Reduce unmet need (74%), safe abortion 95% 580 31.2% 6.8% 1 in 173 119,557,305 79,270,520
See [87]. Reduction in direct causes of maternal mortality, including abortion-related complications, postpartum hemorrhage, hypertensive disorders, sepsis, andobstructed labor.aModel-projected cost savings reflect net costs averted over a woman’s reproductive lifespan (ages 15–45 y) applied to the current population of 15 y olds in Indiastratified by rural (75%) and urban (25%) settings [87]. Future costs discounted 3% annually.
bCost savings for a single representative year of a successfully implemented strategy were calculated using population-level data from India [87] stratified by rural (75%)and urban (25%) settings, for the current distribution of reproductive age women (ages 15–45 y).
cIn rural India, model-projected TFR is 2.76, 2.56, 2.36, 2.14 with reductions in unmet need of 25%, 50%, 75%, 100%, respectively.dIn urban India, model-projected TFR is 1.94, 1.82, 1.71, 1.59 with reductions in unmet need of 25%, 50%, 75%, 100%, respectively.doi:10.1371/journal.pmed.1000264.t004
Reducing Maternal Mortality in India
PLoS Medicine | www.plosmedicine.org 9 April 2010 | Volume 7 | Issue 4 | e1000264

integrated strategy ranged from cost saving to US$170 per YLS
(Text S1).
Universal antenatal care by itself averted fewer than 2% of
maternal deaths; however, if enhanced antenatal care increased
the probability of either facility-based delivery or SBA-attended
birth (linked with accurate referral and transport) from 31% to
60%, health benefits increased 5-fold (Text S1).
As a greater proportion of routine deliveries shifted from home
to facilities, we assumed 70% would shift to birthing centers or
health centers staffed by SBA and 30% to facilities with full
EmOC capacity. Although the differential benefits of routine
delivery in birthing/health centers versus bEmOC was dependent
on expedient transfer from a center to referral EmOC if needed,
provided this was assured, both approaches were cost-effective. In
contrast, when we varied assumptions about the proportion of
routine deliveries in cEmOC versus bEmOC, cost-effectiveness
results changed drastically; as routine deliveries shifted to cEmOC,
the incremental cost-effectiveness ratios became much less
attractive, ranging from US$8,300 to US$27,000 per YLS.
Table 6 shows the potential incremental benefits and cost-
effectiveness of adjunctive community-based SBA-administered
misoprostol for births at home and birthing centers/health centers
in rural India. For all four ‘‘upgrade’’ strategies, additional lives
could be saved; depending on the phase of improvements in
intrapartum care, an additional 7%–13% of maternal deaths were
prevented. Cost-savings for a single birth cohort of 15-y-old girls
(2010) expected to accrue over their reproductive lifespan (age 15–
45 y) ranged from US$128 million to US$190 million.
Discussion
We have identified several strategic options that would cost-
effectively reduce maternal mortality in both rural and urban
India. Our principal findings are that early intensive efforts to
improve family planning and provide safe abortion, accompanied
by a systematic stepwise effort to scale up intrapartum and EmOC,
could reduce maternal mortality by 75%. Despite the inherent
uncertainty in data and assumptions used in the analysis, four
critical themes emerge as robust.
First, increasing effective family planning is the most effective
individual intervention to reduce pregnancy-related mortality. If
the unmet need was met in rural and urban India by 2012, our
results imply that the lives of 168,000 women would be saved by
the end of 2015. The cost savings over that time period would
exceed US$1 billion. Because strategies to increase contraceptive
options for limiting and spacing do not require the same level of
infrastructure as improving intrapartum care, targeting these
strategies toward rural areas with high TFRs is a promising way to
initiate equitable improvements in maternal health.
Second, two distinct—yet synergistic—approaches, family
planning and safe abortion, can reduce deaths from unsafe
abortion. Enhanced access to family planning by itself reduces
demand for elective abortion and consequently reduces deaths
attributable to unsafe abortion. In fact, reducing the unmet need
for contraception can prevent one of every two abortion-related
deaths. Furthermore, just a fraction of the cost savings from family
planning would fully fund an intervention to provide safe abortion
and postabortion care.
Third, despite the substantial health and economic benefits
associated with family planning and safe abortion, there is a
threshold above which further reductions in mortality are
impossible. MDG 5 will therefore not be achievable without
involving integrated interventions that ensure reliable access to
high-quality intrapartum and EmOC. These interventions could
be implemented, however, in a staged, scale-up fashion.
While formidable effort and financial investment would be
required to scale up maternal health services over time, we
identified a number of phased approaches that would ultimately
prevent four out of five maternal deaths. Coupled with stepwise
improvements in family planning and safe abortion, these
approaches incrementally shifted home births to birthing centers
or facilities with EmOC, and improved both access to SBAs as well
as accurate recognition of referral need, transport, and availabil-
ity/quality of EmOC. Successful implementation of these
Figure 3. Averted deaths with family planning and safe abortion. Averted deaths attributable to unsafe abortion in rural India by addressingneed for family planning (green shading) and providing 75% safe abortion (blue shading). Magnitude of additional averted abortion-related deathswith improved access to safe abortion depends on the amount of unmet need for contraception.doi:10.1371/journal.pmed.1000264.g003
Reducing Maternal Mortality in India
PLoS Medicine | www.plosmedicine.org 10 April 2010 | Volume 7 | Issue 4 | e1000264
strategies would be expected to dramatically reduce the MMR,
proportionate mortality ratio, and lifetime risk of maternal death.
Fourth, despite the possible variation in pace associated with
scaling up maternal health services in India, systematic and
consecutive phases will be cost-effective. Our results showed
that—when coupled with family planning and safe abortion—both
early initial strategies and late intensive strategies resulted in cost-
effectiveness ratios that were just a fraction of India’s per capita
GDP; these would unarguably be considered very cost-effective
[95–98].
Although our general findings are consistent with earlier
suggestions that interventions to reduce maternal mortality are
good public health investments [7,17], our analytic approach also
allowed us to identify more and less efficient ways to achieve this.
In this regard, we highlight four robust insights: (1) In settings with
limited infrastructure, investing in ‘‘intermediate’’ facilities (e.g.,
birthing centers) is very cost-effective, provided there is reliable
referral capacity and transport to an appropriate EmOC facility if
necessary; (2) A strategy of routine hospital-based delivery (i.e.,
cEmOC) is not cost-effective; (3) A community-based strategy that
includes SBA-administered oral misoprostol in homes and birthing
centers is likely to be cost-effective. Although alone it cannot
substitute for reliable intrapartum care and EmOC, if added to a
long-term plan that increases facility-based intrapartum care, it
will save additional lives and will reduce costs; (4) Because settings
with the highest TFRs and worst maternal health indicators also
tend to be those with the greatest need for enhanced health
delivery infrastructure, early consistent commitments to provide
family planning and safe abortion reduce the total resources
required. To place the synergistic benefits of enhanced family
planning and safe abortion in context, the magnitude of cost
savings from eliminating unmet need and ensuring access to safe
abortion is approximately 25% of the required 10-y investment
estimated by Johns et al. for scaling up maternal services in India
[30].
We may have underestimated both effectiveness and cost-
effectiveness by excluding effects of certain indirect indicators and
interventions. Although we purposely focused on maternal
mortality, if we included neonatal health and survival, for
example, most strategies would be even more cost-effective due
Table 5. Health and economic outcomes of integrated packages of services: intrapartum care, family planning, and safe abortion.
Region
FacilityBirth(%)
Transport-Homea
(%)
Transport-Facilitya
(%)
Qualityof Careb
(%)
FamilyPlanningc
(%)
SafeAbortion(%)
DecreaseinMaternalDeaths(%)
MMR(Deathsper100,000LiveBirths)
MaternalDeaths asPercentof DeathsAges15–45 y
LifetimeRisk ofMaternalDeath
LifetimeCostsd
(US$)Cost-Effectivenessd
ICER (US$/YLS)
ICER(% percapitaGDP)
Rural Indiae — — — — — — — 520 16.4 1 in 65 218.38 — —
Upgrade 1 45 50 65 70 56.7 50 17.3 460 14.0 1 in 78 212.41 CS CS
Upgrade 2 60 60 75 80 60.3 60 33.7 397 11.5 1 in 98 218.51 150 14
Upgrade 3 75 70 85 90 64.0 75 53.4 302 8.3 1 in 139 226.18 160 15
Upgrade 4 80 75 95 95 67.6 95 77.1 162 4.3 1 in 282 243.46 300 28
Urban Indiaf — — — — — — — 407 9.6 1 in 119 184.00 — —
Upgrade 1 75 60 85 70 66.5 50 15.8 363 8.2 1 in 141 174.91 CS CS
Upgrade 2 80 75 90 80 69.0 60 33.3 305 6.6 1 in 178 178.30 150 14
Upgrade 3 90 80 92.5 90 71.5 75 54.1 225 4.7 1 in 259 183.44 220 21
Upgrade 4 95 85 95 95 74.0 95 78.5 113 2.3 1 in 553 194.97 350 33
Reduction in direct causes of maternal mortality, including abortion-related complications, postpartum hemorrhage, hypertensive disorders, sepsis, and obstructedlabor.aTransport encompasses the expedient availability of means of transport (e.g., vehicle, cart), fuel (if needed), driver, and interim attendant care. Facility transportrepresents a weighted average of transport availability from a health center or birthing center to an EmOC facility and from a bEmOC facility to a cEmOC if indicated.Accuracy of referral need recognition at home and in health center with SBA increase, on average, to 60%, 75%, 90%, and 95% (not shown) with upgrade 1, 2, 3, and 4in both rural and urban India.
bQuality refers to the availability and quality of services at EmOC facilities, including adequate staffing and supplies, expedient attention (e.g., without delay to collectfees or requirement for family to bring supplies), and evidence-based clinical practices.
cFamily planning refers to contraceptive use for limiting and spacing; shown are values representing the reduction in unmet need by 25%, 50%, 75%, and 100% withupgrade 1, 2, 3, and 4, respectively, for both rural and urban India.
dStepwise improvements in maternal health services are assumed to occur in consecutive phases (e.g., first upgrade 1, then upgrade 2, etc.). Therefore, the incrementalcost-effectiveness ratio (US$ per YLS) for each upgrade is calculated as the difference in lifetime costs relative to the difference in lifetime effects, compared with thepreceding next best strategy. Cost-effectiveness ratios are also expressed as percent of the per capita GDP (US$1,068), shown in the farthest right column, asinterventions with cost-effectiveness ratios of less than the per capita GDP are considered very cost-effective according to criteria proposed by the Commission onMacroeconomics and Health [98].
eStatus quo (rural India): 31.1% facility births; 11.6% SBA (home births); transport from home (24.4%), primary-level health center (48.8%), bEmOC (61%); recognition ofreferral need at home (20%), primary-level health center (40%); availability and quality of EmOC (42.5%); 53% family planning.
fStatus quo (urban India): 69.4% facility births; 19% SBA (home births); transport from home (44%), primary-level health center (69%), bEmOC (81%); recognition ofreferral need at home (20%), primary-level health center (40%); availability and quality of EmOC (67.5%); 64% family planning.
CS, cost saving; ICER, incremental cost-effectiveness ratio.doi:10.1371/journal.pmed.1000264.t005
Reducing Maternal Mortality in India
PLoS Medicine | www.plosmedicine.org 11 April 2010 | Volume 7 | Issue 4 | e1000264

Reducing Maternal Mortality in India
PLoS Medicine | www.plosmedicine.org 12 April 2010 | Volume 7 | Issue 4 | e1000264

to associations between place of birth and presence of a skilled
attendant, with neonatal and maternal deaths [99,100]. With the
exception of anemia, we focused on direct causes of maternal
mortality; a priority for future analyses is to include interventions
to reduce the indirect causes of pregnancy-related mortality. The
analysis would be strengthened by availability of indicators that
reflect safe motherhood externalities including measures of
enhanced household well-being, increased school attendance,
decreased numbers of orphans, and reduced impoverishment
resulting from catastrophic expenses [94,99].
Other limitations in our analysis stem from its inherent reliance
on high-quality data about maternal mortality specifically. While
our calibration of setting-specific models allows us to better
represent within-country differences in baseline risk, coverage, and
capacity than previous studies, high-quality empiric evidence for
the effectiveness of comprehensive strategies to reduce maternal
mortality and morbidity is often either lacking or inconsistent.
More studies quantifying the benefits of community-level inter-
ventions on preventing maternal morbidity remain a priority
[100]. The additional costs that we assumed would be required to
scale up interventions and build infrastructure are, at best, gross
estimates. That being said, our assumption of 2- to 3-fold increases
in the per woman costs to reflect the additional resources required
to improve capacity is consistent with those implied by recent
analyses assessing global resource needs for maternal health
[30,93].
Shiffman and Smith [101] have described the importance of
framing priority public health issues in a manner that resonates
with both the ‘‘internal’’ community and other ‘‘external’’
decision makers. With regard to the internal community, the
Table 6. Incremental benefits of community-based misoprostol in rural India.
Rural India
FamilyPlanninga
(%)
SafeAbortion(%)
FacilityBirth (%)
Transport-Homeb (%)
Transport-Facilityb (%)
Quality ofCarec (%)
Incremental Benefits and Cost-Effectivenessof Community-Based Misoprostold
Decrease inMaternalDeaths
Lives Saved withAddition ofCommunity-basedMisoprostole
Cost-Effectiveness
Upgrade 1 56.7 50 45 50 65 70 — — —
Plus communityinterventiond
— — — — — — 12.3% 16,992 Cost savinge
Upgrade 2 60.3 60 60 60 75 80 — — —
Plus communityinterventiond
— — — — — — 13.0% 17,612 Cost savinge
Upgrade 3 64.0 75 75 70 85 90 — — —
Plus communityinterventiond
— — — — — — 10.2% 13,983 Cost savinge
Upgrade 4 67.6 95 80 75 95 95 — — —
Plus communityinterventiond
— — — — — — 6.9% 9,470 Cost savinge
aFamily planning refers to contraceptive use for limiting and spacing; shown are values representing the reduction in unmet need by 25%, 50%, 75%, and 100% withupgrades 1, 2, 3, and 4, respectively.
bTransport encompasses the expedient availability of means of transport (e.g., vehicle, cart), fuel (if needed), driver, and interim attendant care.cQuality refers to the availability and quality of services at EmOC facilities, including adequate staffing and supplies, and evidence-based clinical practices.dCommunity-based interventions assume SBA-administered misoprostol for births at home and birthing centers/health centers with a 50% (25%–60%) reduction in PPH
[72].ePopulation-level incremental benefits (lives saved) associated with the community-based misoprostol intervention (compared to the same strategy without thecommunity-based misoprostol intervention). These were calculated by applying model-projected outcomes to population-level data from rural India [87]. Cost-savingsfor a single birth cohort of 15-y-old girls (2010) expected to accrue over their reproductive lifespan (age 15–45) ranged from US$128 million to US$190 million.
doi:10.1371/journal.pmed.1000264.t006
Figure 4. Health and economic outcomes in rural Uttar Pradesh. Upper panel. Reduction in maternal deaths and cost-effectiveness withstepwise approaches to improve maternal health in rural Uttar Pradesh. The vertical axis (from bottom to top) shows outcomes associated withincreased access to family planning and safe abortion. The horizontal axis (from left to right) displays outcomes associated with investments in high-quality health-center–based intrapartum care, which involved stepwise improvements in SBAs, recognition of referral need, and antenatal/postpartum care, incrementally shifted births away from home, and improved transport, availability, and quality of EmOC. Each cell represents aunique strategy; the reduction in maternal deaths shown is relative to current conditions (far lower left corner). Shading reflects cost-effectivenessratios, compared to status quo (pink, cost saving; blue, ,US$250/YLS; green, ,US$500/YLS; purple, ,US$750/YLS; orange, US$890/YLS). See text fordetails. Lower panel. Sensitivity analysis depicting the impact of improving only one component of intrapartum care services in rural Uttar Pradesh.Base case and improvements for each component are shown in numbers below the component name (e.g., quality of EmOC is 31.5% in the basecase, improvements of 50%–100% were assessed). In settings where most deliveries occur at home, linkage of services in multiple domains is a criticaldeterminant of reduction in maternal deaths. Even large improvements in skilled birth attendants for nonfacility births (yellow bar), recognition ofreferral need (pink bar), transport (green bar), or quality of EmOC (purple bar) fail to reduce mortality more than 2%–5% if other interdependentcomponents are not improved as well. In contrast, even modest improvements in all four components, as shown in upgrade 1 (blue bar), reducemortality by 22%. Cost-effectiveness of the integrated strategy ranged from cost saving to US$170 per YLS compared with US$700 to US$4,900 perYLS for single unlinked improvements.doi:10.1371/journal.pmed.1000264.g004
Reducing Maternal Mortality in India
PLoS Medicine | www.plosmedicine.org 13 April 2010 | Volume 7 | Issue 4 | e1000264

strategies we identified as most effective support three crucial
elements already recognized as essential to achieve MDG 5:
family planning and control of fertility choices, provision of safe
abortion, and assurance that all women have access to
intrapartum care and EmOC. Our results reinforce this message,
and extend it by quantifying the cost savings of family planning
and safe abortion, and identifying efficient and cost-effective
approaches to scaling-up capacity for integrated maternal health
services.
With regard to the external community, we have tried to
provide a range of outcomes that can be used to create effective
‘‘take home’’ messages for different target audiences. For example,
in only 5 y, more than 150,000 lives could be saved just from
increasing contraception rates by a few percentage points; nearly
US$1.5 billion could be saved by adding safe abortion to family
planning efforts; and finally, with stepwise investments to provide
facility-based intrapartum care, the majority of maternal deaths
could be prevented. In the next decade, this accomplishment
would save the lives of 1 million Indian women.
Finally, by placing and prioritizing safe motherhood in the
context of other global health priorities [101,102], our results can
also be effectively framed for policymakers who must allocate
limited resources, by providing comparative and contextual
information about the relative benefits and cost-effectiveness of
investments in maternal health measured against other public
health priorities. One of the robust findings of our analysis, for
example, is that there are integrated strategies that involve
improvements in family planning, safe abortion, and intrapartum
care that are equally or more cost-effective or attractive than
childhood immunization or treatment of malaria, tuberculosis, or
HIV [95].
The Indian government has initiated several policies to improve
maternal health [5], particularly in rural areas [27,103], and
efforts to both implement and evaluate new strategies are ongoing
[83,94,104–106]. Although our analysis is intended to catalyze
actionable steps, we recognize that decisions in India about the
choice of strategies and rate of stepwise investments to reduce
maternal mortality will be a function not only of cost-effectiveness
and affordability, but also of political will and local circumstances.
Identifying approaches that can be tailored to local situations, but
that rely on firm core principles and are cost-effective, holds
considerable promise as a way to mobilize further political support
and convince stakeholders that MDG 5 is within reach.
In particular, it is clear from our analysis that an initial focus on
family planning, especially in rural poor areas, will significantly
prevent pregnancy-related deaths, reduce deaths from unsafe
abortion, and save resources. Providing universal access to safe
abortion will further augment these benefits. The cost savings from
these two strategies will partially offset the resources required to
invest in the necessary infrastructure that would assure every
woman access to high-quality intrapartum care and EmOC. While
MDG 5 is unlikely to be met without assuring access to health-
center–based intrapartum care, implementation of a phased
stepwise approach, designed to reach this goal while reflecting
the current realities and most feasible initial approaches in
different settings, is absolutely within reach.
Supporting Information
Text S1 Supplemental material accompanying the article. Part I,
overview of model; part II, overview of model parameterization,
calibration, performance; part III, overview of costs and estimates;
part IV, supplemental results; part V, references.
Found at: doi:10.1371/journal.pmed.1000264.s001 (0.53 MB
PDF)
Acknowledgments
We are appreciative of the administrative assistance from Meredith
O’Shea, and constructive feedback on the model assumptions (Dan
Grossman, Kelly Blanchard, Carol Levin).
Author Contributions
ICMJE criteria for authorship read and met: SG SS NC UCMN DH.
Agree with the manuscript’s results and conclusions: SG SS NC UCMN
DH. Designed the experiments/the study: SG SS NC DH. Analyzed the
data: SG SS NC UCMN DH. Collected data/did experiments for the
study: SG DH. Wrote the first draft of the paper: SG. Contributed to the
writing of the paper: SG SS NC UCMN DH. Wrote first draft of Text S1:
DH.
References
1. World Health Organization (WHO) (2007) Maternal mortality in 2005:
estimates developed by WHO, UNICEF, UNFPA, and The World Bank.
Available: http://www.who.int/whosis/mme_2005.pdf. Accessed 19 August
2009.
2. Hill K, Thomas K, AbouZahr C, Walker N, Say L, et al. (2007) Estimates of
maternal mortality worldwide between 1990 and 2005: an assessment of
available data. Lancet 370: 1311–1319.
3. United Nations (UN). Millennium Development Goals: Goal 5 (MDG 5).
Improve maternal health. Available: http://www.un.org/millenniumgoals/
maternal.shtml. Accessed 31 July 2009.
4. World Health Organization (WHO) (2005) Millennium Development Goals
and Health–India. Chapter III: Goal 5: improve maternal health. Geneva:
WHO. Available: http://www.whoindia.org/LinkFiles/MDG_Chapter-03.
pdf. Accessed 31 July 2009.
5. Shiffman J, Ved R (2007) The state of political priority for safe motherhood in
India. BJOG 114: 785–90.
6. Ronsmans C, Graham WJ, on behalf of The Lancet Maternal Survival Series
steering group (2006) Maternal mortality: who, when, where and why. Lancet
368: 1189–1200.
7. Graham WJ, Cairns J, Bhattacharya S, Bullough CHW, Quayyum Z, et al.
(2006) Chapter 26: Maternal and perinatal conditions. Jamison DT,
Breman JG, Measham AR, Alleyne G, Claeson M, et al., eds. Disease control
priorities in developing countries. 2nd edition. New York: Oxford Uni-
versity Press. pp 499–530. Available: http://www.dcp2.org/pubs/DCP/26/.
Accessed 23 August 2009.
8. Campbell OM, Graham WJ, Lancet Maternal Survival Series steering group
(2006) Strategies for reducing maternal mortality: getting on with what works.
Lancet 368: 1284–99.
9. Rosenfield A, Maine D, Freedman L (2006) Meeting MDG-5: an impossible
dream? Lancet 368: 1133–1135.
10. Government of India (2005) Reproductive and Child Health Programme
Document (RCH II–Document 2): the principles and evidence base for State
RCH II Programme Implementation Plans (PIPs). New Delhi, India:
Government of India. Available: http://www.whoindia.org/LinkFiles/Child_
Health_in_India_PIP_Doc_Chapter01.pdf. Accessed 21 August 2009.
11. Government of India, Ministry of Health and Family Welfare, Department
of Family Welfare (2005) National rural healthcare mission. New Delhi,
India: Government of India. Available: http://www.mohfw.nic.in/
NRHM/Documents/NRHM%20Mission%20Document.pdf. Accessed 21
August 2009.
12. Shiffman J (2007) Generating political priority for maternal mortality reduction
in 5 developing countries. Am J Public Health 97: 796–803.
13. Costello A, Azad K, Barnett S (2006) An alternative strategy to reduce
maternal mortality. Lancet 368: 1477–1479.
14. Mills S, Bos E, Lule E, Ramana GNV, Bulatao R (2007) Obstetric care in poor
settings in Ghana, India, and Kenya. Washington (D.C.): The World Bank.
Available: http://www-wds.worldbank.org/servlet/main?menuPK = 64187510&
pagePK=64193027&piPK=64187937&theSitePK=523679&entityID = 000310607_
20080123112201. Accessed 27 July 2009.
15. Registrar General, India (2006) Maternal mortality in India: 1997–2003;
trends, causes and risk factors. New Delhi, India. Available: http://www.mp.
gov.in/health/Maternal_Mortality_in_India_1997-2003.pdf. Accessed 22 Au-
gust 2009.
16. Goldie SJ, Goldhaber-Fiebert JD, Garnett GP (2006) Public health policy for
cervical cancer prevention: role of decision science, economic evaluation, and
mathematical modeling. Vaccine 24: S155–S163.
Reducing Maternal Mortality in India
PLoS Medicine | www.plosmedicine.org 14 April 2010 | Volume 7 | Issue 4 | e1000264

17. Adam T, Lim SS, Mehta S, Bhutta ZA, Fogstad H, et al. (2005) Cost
effectiveness analysis of strategies for maternal and neonatal health indeveloping countries. BMJ 331: 1107.
18. Sutherland T, Bishai D (2009) Cost-effectiveness of misoprostol and prenataliron supplementation as maternal mortality interventions in home births in
rural India. Int J Gynaecol Obstet 104: 189–193.
19. Levine R, Langer A, Birdsall N, Matheny G, Wright M, et al. (2006)
Contraception. Disease control priorities in developing countries. 2nd edition.New York: Oxford University Press, 1075–1090. Available at: http://www.
dcp2.org/pubs/DCP.
20. Terris-Prestholt F, Watson-Jones D, Mugeye K, Kumaranayake L, Ndeki L,
et al. (2003) Is antenatal syphilis screening still cost effective in sub-SaharanAfrica. Sex Transm Infect 79: 375–381.
21. Nakhaee N, Mirahmadizadeh AR, Gorji HA, Mohammadi M (2002) Assessingthe cost-effectiveness of contraceptive methods in Shiraz, Islamic Republic of
Iran. East Mediterr Health J 8: 55–63.
22. Pagel C, Lewycka S, Colbourn T, Mwansambo C, Mequid T, et al. (2009)
Estimation of potential effects of improved community-based drug provision, toaugment health-facility strengthening, on maternal mortality due to post-
partum haemorrhage and sepsis in sub-Saharan Africa: an equity-effectivenessmodel. Lancet 374: 1441–1448.
23. Hu D, Bertozzi SM, Gakidou E, Sweet S, Goldie SJ (2007) The costs, benefits,and cost-effectiveness of interventions to reduce maternal morbidity and
mortality in Mexico. PLoS ONE 2: e750. doi:10.1371/journal.pone.0000750.
24. Prata N, Sreenivas A, Greig F, Walsh J, Potts M (2010) Setting priorities for
safe motherhood interventions in resource-scarce settings. Health Policy 94:1–13.
25. World Health Organization (WHO) CHOICE: choosing interventions that arecost-effective. Available: http://www.who.int/choice/en/. Accessed 12 July
2007.
26. International Institute for Population Sciences (IIPS) (2005) Reproductive and
child health project. Facility survey. DLHS-2, 2003. Available: http://www.rchiips.org/pdf/rch2/National_Facility_Report_RCH-II.pdf. Accessed 1 Sep-
tember 2009.
27. Government of India (2008) Bulletin on rural health statistics in India.
Rural health system in India. Available: http://www.mohfw.nic.in/Bulletin%20on%20RHS%20-%20March,%202008%20-%20PDF%20Version/
Rural%20Health%20Care%20System%20in%20India.pdf. Accessed 1 September
2009.
28. International Institute for Population Sciences (IIPS) and ORC Macro (2007)
National Family Health Survey (NFHS-3), 2005–06: India. Mumbai: IIPS.Available: http://www.nfhsindia.org/nfhs3_national_report.html. Accessed 23
August 2009.
29. Khan KS, Wojdyla D, Say L, Gulmezoglu AM, Van Look PF (2006) WHO
analysis of causes of maternal death: a systematic review. Lancet 367:1066–1074.
30. Johns B, Sigurbjornsdottir K, Fogstad H, Zupan J, et al. (2007) Estimatedglobal resources needed to attain universal coverage of maternal and newborn
health services. Bull World Health Organ 85: 256–263.
31. World Health Organization (WHO) (2002) Estimates of DALYs by
sex, cause and WHO mortality sub-region, estimates for 2001. Geneva:WHO. Available: http://www.who.int/healthinfo/global_burden_
disease/estimates_regional_2001/en/index.html. Accessed 23 August2009.
32. World Health Organization (WHO) (2007) World Health Statistics. Available:http://www.who.int/healthinfo/statistics/gbdwhoregionincidence2002.xls.
Accessed 7 May 2009.
33. UNICEF (2004) State of the world’s children. Available: http://www.unicef.org/
sowc/archive/ENGLISH/The%20State%20of%20the%20World%27s%20Children%202004.pdf. Accessed 7 May 2009.
34. Dolea C, AbouZahr C, Stein C (2003) Global burden of maternal hemorrhagein the year 2000. Geneva, Switzerland: World Health Organization. Available:
http://www.who.int/healthinfo/statistics/bod_maternalhaemorrhage.pdf. Ac-cessed 23 August 2009.
35. Dolea C, AbouZahr C (2003) Global burden of obstructed labor in the year2000. Geneva, Switzerland: World Health Organization. Available: http://
www.who.int/healthinfo/statistics/bod_obstructedlabour.pdf. Accessed 23 Au-gust 2009.
36. Dolea C, AbouZahr C (2003) Global burden of hypertensive disordersof pregnancy in the year 2000. Geneva, Switzerland: World Health
Organization. Available: http://www.who.int/healthinfo/statistics/bod_
hypertensivedisordersofpregnancy.pdf. Accessed 23 August 2009.
37. Dolea C, Stein C (2003) Global burden of maternal sepsis in the year 2000.Geneva, Switzerland: World Health Organization. Available: http://www.
who.int/healthinfo/statistics/bod_maternalsepsis.pdf. Accessed 23 August
2009.
38. AbouZahr C, Wardlaw T (2004) Maternal mortality in 2000: estimates developedby WHO, UNICEF and UNFPA. Geneva: World Health Organization.
Available: http://www.who.int/reproductivehealth/publications/monitoring/
9241562706/en/index.html. Accessed 23 August 2009.
39. Henshaw SK, Singh S, Haas T (1999) The incidence of abortion worldwide.
Int Fam Plann Persp 25: S30–S38.
40. Shah I, Ahman E (2004) Age patterns of unsafe abortion in developing countryregions. Reprod Health Matters 12: S9–S17.
41. Berer M (2004) National laws and unsafe abortion: the parameters of change.
Reprod Health Matters 12: 1–8.
42. The Alan Guttmacher Institute (AGI) (2006) Preventing unsafe abortion
and its consequences: priorities for research and action. New York: Alan
Guttmacher Institute. Available: http://www.guttmacher.org/pubs/2006/07/
10/PreventingUnsafeAbortion.pdf. Accessed 24 August 2009.
43. The Alan Guttmacher Institute (AGI) (2007) Facts on induced abortion worldwide:
worldwide incidence and trends. Available: http://www.guttmacher.org/pubs/
fb_IAW.html. Accessed 18 August 2009.
44. Lule E, Singh S, Chowdury SA (2007) Fertility regulation behaviors and their
costs: contraception and unintended pregnancies in Africa and Eastern Europe
& Central Asia. Washington (D.C.): World Bank. Available: http://
siteresources.worldbank.org/HEALTHNUTRITIONANDPOPULATION/
Resources/281627-1095698140167/FertilityRegulationsFinal.pdf. Accessed 24
August 2009.
45. Murray CJL, Lopez AD (1996) Estimating causes of death: new methods and
global and regional applications for 1990. Murray CJL, Lopez AD, eds. The
global burden of disease, vol. 1 of Global burden of disease and injury series.
Cambridge: Harvard University Press. pp 117–200.
46. Murray CJL, Lopez AD, eds (1998) Health dimensions of sex and
reproduction. Cambridge: Harvard School of Public Health.
47. Ahman E, Dolea C, Shah I (2006) The global burden of unsafe abortion in the
year 2000, Geneva: World Health Organization, Available: http://www.who.
int/healthinfo/statistics/bod_abortions.pdf. Accessed 4 August 2008.
48. Singh S (2006) Hospital admissions resulting from unsafe abortion: estimates
from 13 developing countries. Lancet 368: 1887–1892.
49. Biswas AB, Das DK, Misra R, Roy RN, Ghosh D, et al. (2005) Availability and
use of emergency obstetric care services in four districts of West Bengal, India.
J Health Popul Nutr 23: 266–274.
50. Ahman E, Shah I (2007) Unsafe abortion: global and regional estimates of unsafe
abortion and associated mortality in 2003 (5th edn). Geneva: World Health
Organization. Available: http://www.who.int/reproductivehealth/publications/
unsafe_abortion/9789241596121/en/index.html. Accessed 24 August 2009.
51. Ahman E, Shah I Unsafe abortion: global and regional estimates of unsafe
abortion and associated mortality in 2000 (4th edn). Geneva: World Health
Organization. Available: http://www.who.int/reproductivehealth/publications/
unsafe_abortion/9241591803/en/index.html. Accessed 24 August 2009.
52. Gulmezoglu AM, Villar J, Ngoc NT, Piaggio G, Carroli G, et al. (2001) WHO
multicentre randomised trial of misoprostol in the management of the third
stage of labour. Lancet 358: 689–695.
53. Johanson RB, Menon BK (2000) Vacuum extraction versus forceps for assisted
vaginal delivery. Cochrane Database Syst Rev 2: CD000224.
54. Hofmeyr GJ, Kulier R (2000) External cephalic version for breech presentation
at term. Cochrane Database Syst Rev 2: CD000083.
55. Hofmeyr GJ, Hannah ME (2003) Planned Caesarean section for term breech
delivery. Cochrane Database Syst Rev 3: CD000166.
56. Schuitemaker N, van Roosmalen J, Dekker G, Van Dongen P, van Geijn H,
et al. (1997) Maternal mortality after cesarean section in The Netherlands. Acta
Obstet Gynecol Scand 76: 332–334.
57. Magpie Trial Collaborative Group (2002) Do women with pre-eclampsia and
their babies benefit from magnesium sulphate? The Magpie Trial: a
randomised placebo controlled trial. Lancet 359: 1877–1890.
58. Duley L, Gulmezoglu A, Henderson-Smart D (2003) Magnesium sulphate and
other anticonvulsants for women with eclampsia. Cochrane Database Syst Rev
2: CD000025.
59. Crowther C, Hiller J, Doyle L (2002) Magnesium sulphate for preventing
preterm birth in threatened preterm labour. Cochrane Database Syst Rev 4:
CD001060.
60. French LM (2003) Prevention and treatment of postpartum endometritis. Curr
Womens Health Rep 4: 274–279.
61. French LM, Smaill FM (2004) Antibiotic regimens for endometritis after
delivery. Cochrane Database Syst Rev 4: CD001067.
62. Koonin LM, Smith JC, Ramick M (1993) Abortion surveillance–United States,
1990. MMWR CDC Surveill Summ 42: 29–57.
63. Institute of Medicine (IOM) (1975) Legalized abortion and the public health;
report of a study by a committee of the Institute of Medicine. Washington
(D.C.): National Academy of Sciences.
64. Grimes DA (2005) Risks of mifepristone abortion in context. Contraception 71:
161.
65. World Bank (2002) India’s transport sector: the challenges ahead. Vol 1.
Washington (D.C.): World Bank Group. Available: http://www-wds.
worldbank.org/external/default/main?pagePK = 64193027&piPK =64187937
&theSitePK =523679&menuPK = 64187510&searchMenuPK = 64187283&the
SitePK = 523679&entityID = 000094946_02070604022321&searchMenuPK =
64187283&theSitePK = 523679. Accessed 23 August 2009.
66. PMGSY (Pradhan Mantri Gram Sadak Yojana) (2006) Briefing book.
Available: http://pmgsy.nic.in/. Accessed 27 July 27 2009.
67. Katrak H (2008) Measuring the shortage of medical practitioners in rural and
urban areas in developing countries: a simple framework and simulation
exercise with data from India. Int J Health Plann Manage 23: 93–105.
68. Ma S, Sood N A comparison of the health systems in China and India. Rand
Corporation. Available: http://www.rand.org/pubs/occasional_papers/2008/
RAND_OP212.pdf. Accessed 27 July 2009.
Reducing Maternal Mortality in India
PLoS Medicine | www.plosmedicine.org 15 April 2010 | Volume 7 | Issue 4 | e1000264

69. Harlap S, Shiono PH, Ramcharan S (1980) A life table of spontaneous
abortions and the effects of age, parity and other variables. Porter IH, Hook EB,eds. Human embryonic and fetal death. New York: Academic Press. pp
145–158.
70. Menken J, Rahman MO (2006) Chapter 3: Reproductive health. Merson MH,Black RE, Mills AJ, eds. International public health: diseases, programs,
systems, and policies, 2nd ed. Sudsbury (Massachusetts): Jones and BartlettPublishers. pp 71–125.
71. Brabin BJ, Hakimi M, Pelletier D (2001) An analysis of anemia and pregnancy-
related maternal mortality. J Nutr 131: 604S–614S.72. Hofmeyr GJ, Gulmezoglu AM (2008) Misoprostol for the prevention and
treatment of pospartum hemorrhage. Best Practice & Research Clinical Obstetand Gynaec 22: 1025–1041.
73. Cahuana-Hurtado L, Sosa-Rubi S, Bertozzi S (2004) The application of themother baby package reproductive health costing spreadsheet in Morelos:
National Institute of Public Health, Division of Health Economics and Policy,
Mexico.74. Thaddeus S, Maine D (1994) Too far to walk: maternal mortality in context.
Soc Sci Med 38: 1091–1110.75. International Institute for Population Sciences (IIPS) and ORC Macro (2007)
National Family Health Survey (NFHS-3), 2005–06: India. Maternal health,
Chapter 8. Mumbai: IIPS. 191–222 Available: http://www.nfhsindia.org/NFHS-3%20Data/VOL-1/india_volume_I_chapter_8_corrected_for_website_
17oct08.pdf. Accessed 23 August 2009.76. International Institute for Population Sciences (IIPS) (2006) Reproductive and
Child Health Project. District Level Household Survey. DLHS-2. 2002–2004.Available: http://www.rchiips.org/pdf/rch2/National_Report_RCH-II.pdf.
Accessed 1 September 2009.
77. International Institute for Population Sciences (IIPS) (2007) Fact sheet: UttarPradesh. Reproductive and Child Health Project. District Level Household and
Facility Survey. DLHS-3. Available: http://www.rchiips.org/pdf/rch3/state/Uttar-Pradesh.pdf. Accessed 1 September 2009.
78. International Institute for Population Sciences (IIPS) (2007) Fact sheet:
Rajasthan. Reproductive and Child Health Project. District Level Householdand Facility Survey. DLHS-3. Available: http://www.rchiips.org/pdf/rch3/
state/Rajsthan.pdf. Accessed 1 September 2009.79. Vora KS, Mavalankar DV, Ramani KV, Upadhyaya M, Sharma B, et al.
(2009) Maternal health situation in India: a case study. J Health Popul Nutr 27:184–201.
80. Iyengar SD, Iyengar K, Gupta V (2009) Maternal health: a case study of
Rajasthan. J Health Popul Nutr 27: 271–292.81. Iyengar SD, Iyengar K, Suhalka V, Agarwal K (2009) Comparison of
domiciliary and institutional delivery-care practices in Rural Rajasthan, India.J Health Popul Nutr 27: 303–312.
82. Iyengar K, Iyengar SD, Suhalka V, Dashora K (2009) Pregnancy-related
deaths in rural Rajasthan, India: exploring causes, context, and care-seekingthrough verbal autopsy. J Health Popul Nutr 27: 293–302.
83. Mavalankar DV, Vora KS, Ramani KV, Raman P, Sharma B, et al. (2009)Maternal health in Gujarat, India: a case study. J Health Popul Nutr 27:
235–248.84. AMDD Working Group on Indicators (2002) Program note: using UN process
indicators to assess needs in emergency obstetric services: Bhutan, Cameroon
and Rajasthan, India. Int J Gynaecol Obstet 77: 277–284.85. World Health Organization (WHO) (2006) World Health Report: working
together for health. Geneva: World Health Organization. Available: http://www.who.int/whr/2006/en/index.html. Accessed 23 August 2009.
86. UNICEF, WHO, UNFPA (2007) Maternal mortality declining in middle-
income countries; women still die in pregnancy and childbirth in low-incomecountries. UNICEF, WHO, UNFPA Joint Press Release. Available: http://
www.unicef.org/media/media_41208.html. Accessed 27 July 2009.87. United Nations (UN), Department of Economic and Social Affairs, Population
Division (2007) World Population Prospects: the 2006 revision. CD-ROM
edition - extended dataset in Excel and ASCII formats. New York: UnitedNations.
88. UNFPA (2007) Reproductive Health Costing Tools Model. New York:
UNFPA. Available: http://www.who.int/pmnch/topics/economics/costing_tools/en/index15.html. Accessed 27 July 2009.
89. International Labour Organization (ILO). Laborsta database. Available: http://
laborsta.ilo.org/. Accessed 27 July 2009.
90. UNICEF Supply Division. Available: http://www.supply.unicef.dk/catalogue/.
Accessed 27 July 2009.
91. Management Sciences for Health (MSH). International Drug Price IndicatorGuide (IDPIG). Available: http://erc.msh.org/mainpage.cfm?file = 1.0.
htm&id = 1&temptitle = Introduction&module = DMP&language = English.
Accessed 27 July 2009.
92. Duggal R (2004) The political economy of abortion in India: cost and
expenditure patterns. Reprod Health Matters 12: S130–S137.
93. Borghi J, Ensor T, Somanathan A, Lissner C, Mills A, on behalf of The Lancet
Maternal Survival Series steering group (2006) Mobilising financial resources
for maternal health. Lancet 368: 1457–1465.
94. Bhat R, Mavalankar DV, Singh PV, Singh N (2009) Maternal healthcare
financing: Gujarat’s Chiranjeevi Scheme and its beneficiaries. J Health Popul
Nutr 27: 249–258.
95. Jamison DT, Breman JG, Measham AR, Alleyne G, Claeson M, et al. (2006)
Disease control priorities in developing countries. 2nd edition. Washington
(D.C.): The International Bank for Reconstruction and Development/TheWorld Bank. Available: http://www.dcp2.org. Accessed 4 May 2009.
96. Laxminarayan R, Chow J, Shahid–Salles SA (2006) Intervention cost–
effectiveness: overview of main messages. Disease control priorities indeveloping countries. 2nd edition. 35–86. New York: Oxford University Press.
Available: http://www.dcp2.org/pubs/DCP/2/FullText. Accessed 4 May
2009.
97. Brenzel L, Wolfson LJ, Fox-Rushby J, Miller M, Halsey NA (2006) Vaccine–
preventable diseases. Disease control priorities in developing countries. 2nd
edition. 389-412. New York: Oxford University Press. Available: http://www.dcp2.org/pubs/DCP/20/FullText. Accessed 4 May 2009.
98. World Health Organization (WHO) (2001) Macroeconomics and health:
investing in health for economic development: report of the Commission onMacroeconomics and Health. Geneva: World Health Organization.
99. Ekman B, Pathmanathan I, Liljestrand J (2008) Integrating health interventions
for women, newborn babies, and children: a framework for action. Lancet 372:990–1000.
100. Bang RA, Bang AT, Reddy MH, Deshmukh MD, Baitule SB, et al. (2004)
Maternal morbidity during labour and the puerperium in rural homes and theneed for medical attention: A prospective observational study in Gadchiroli,
India. BJOG 111: 231–238.
101. Shiffman J, Smith S (2007) Generation of political priority for global health
initiatives: a framework and case study of maternal mortality. Lancet 370:
1370–1379.
102. Filippi V, Ronsmans C, Campbell OM, Graham WJ, Mills A, et al. (2006)
Maternal health in poor countries: the broader context and a call for action.
Lancet 368: 1535–1541.
103. National Rural Health Mission (2005–2012) Mission document. Available:
http://india.gov.in/outerwin.php?id = http://mohfw.nic.in/NRHM/
NRHM%28National%20Rural%20Health%20Mission%29.htm. Accessed 1September 2009.
104. Padmanaban P, Raman PS, Mavalankar DV (2009) Innovations and
challenges in reducing maternal mortality in Tamil Nadu, India. J HealthPopul Nutr 27: 202–219.
105. Prakasamma M (2009) Maternal mortality-reduction programme in Andhra
Pradesh. J Health Popul Nutr 27: 220–234.
106. McPake B, Koblinsky M (2009) Improving maternal survival in South Asia-
what can we learn from case studies? J Health Popul Nutr 27: 93–107.
Reducing Maternal Mortality in India
PLoS Medicine | www.plosmedicine.org 16 April 2010 | Volume 7 | Issue 4 | e1000264

Editors’ Summary
Background. Every year, more than half a million women—most of them living in developing countries—die frompregnancy- or childbirth-related complications. About aquarter of these ‘‘maternal’’ deaths occur in India. In 2005,a woman’s lifetime risk of maternal death in India was 1 in70; in the UK, it was only one in 8,200. Similarly, the maternalmortality ratio (MMR; number of maternal deaths per100,000 live births) in India was 450, whereas in the UK itwas eight. Faced with the enormous maternal death toll inIndia and other developing countries, in September 2000,the United Nations pledged, as its fifth MillenniumDevelopment Goal (MDG 5), that the global MMR wouldbe reduced to a quarter of its 1990 level by 2015. Currently, itseems unlikely that this target will be met. Between 1990and 2005, global maternal deaths decreased by only 1% perannum instead of the 5% needed to reach MDG 5; in India,the decrease in maternal deaths between 1990 and 2005 wasabout 1.8% per annum.
Why Was This Study Done? Most maternal deaths indeveloping countries are caused by severe bleeding afterchildbirth, infections soon after delivery, blood pressuredisorders during pregnancy, and obstructed (difficult) labors.Consequently, experts agree that universal access to high-quality routine care during labor (‘‘obstetric’’ care) and toemergency obstetrical care is needed to reduce maternaldeaths. However, there is less agreement about how toadapt these ‘‘ideal recommendations’’ to specific situations.In developing countries with weak health systems andpredominantly rural populations, it is unlikely that all womenwill have access to emergency obstetric care in the nearfuture—so would beginning with improved access to familyplanning and to safe abortions (unsafe abortion is anothermajor cause of maternal death) be a more achievable, morecost-effective way of reducing maternal deaths? How wouldfamily planning and safe abortion be coupled efficiently andcost-effectively with improved access to intrapartum care? Inthis study, the researchers investigate these questions byestimating the health and economic outcomes of variousstrategies to reduce maternal mortality in India.
What Did the Researchers Do and Find? The researchersused a computer-based model that simulates women throughpregnancy and childbirth to estimate the effect of differentstrategies (for example, increased family planning or increasedaccess to obstetric care) on clinical outcomes (pregnancies,live births, or deaths), costs, and cost-effectiveness (the cost ofsaving one year of life) in India. Increased family planning wasthe most effective single intervention for the reduction ofpregnancy-related mortality. If the current unmet need forfamily planning in India could be fulfilled over the next 5 years,more than 150,000 maternal deaths would be prevented,more than US$1 billion saved, and at least half of abortion-related deaths averted. However, increased family planning
alone would reduce maternal deaths by 35% at most, so theresearchers also used their model to test the effect ofcombinations of strategies on maternal death. They foundthat an integrated and stepwise approach (increased familyplanning and safe abortion combined with consecutivelyincreased skilled birth attendants, improved care before andafter birth, reduced home births, and improved emergencyobstetric care) could eventually prevent nearly 80% ofmaternal deaths. All the steps in this strategy either savedmoney or involved an additional cost per year of life saved ofless than US$500; given one suggested threshold for cost-effectiveness in India of the per capita GDP (US$1,068) peryear of life saved, these strategies would be considered verycost-effective.
What Do These Findings Mean? The accuracy of thesefindings depends on the assumptions used to build themodel and the quality of the data fed into it. Nevertheless,these findings suggest that early intensive efforts to improvefamily planning and to provide safe abortion accompaniedby a systematic, stepwise effort to improve integratedmaternal health services could reduce maternal deaths inIndia by more than 75% in less than a decade. Furthermore,such a strategy would be cost-effective. Indeed, note theresearchers, the cost savings from an initial focus on familyplanning and safe abortion provision would partly offset theresources needed to assure that every woman had access tohigh quality routine and emergency obstetric care. Thus,overall, these findings suggest that MDG 5 may be withinreach in India, a conclusion that should help to mobilizepolitical support for this worthy goal.
Additional Information. Please access these Web sites viathe online version of this summary at http://dx.doi.org/10.1371/journal.pmed.1000264.
N UNICEF (the United Nations Children’s Fund) providesinformation on maternal mortality, including the WHO/UNICEF/UNFPA/The World Bank 2005 country estimates ofmaternal mortality
N The World Health Organization also provides information onmaternal health and about MDG 5 (in several languages)
N The United Nations Millennium Development Goals Web siteprovides detailed information about the Millennium Decla-ration, the MDGs, their targets and their indicators, and aboutMDG 5
N The Millennium Development Goals Report 2009 and itsprogress chart provide an up-to-date assessment of progresstoward all the MDGs
N Computer simulation modeling as applied to health is furtherdiscussed at the Center for Health Decision Science at HarvardUniversity
Reducing Maternal Mortality in India
PLoS Medicine | www.plosmedicine.org 17 April 2010 | Volume 7 | Issue 4 | e1000264