Embed Size (px)
Citation preview
The free monthly newsletter providing insights into private equity performance, investors, deals, fundraising and more using information from Preqin’s Private Equity Online.
PRIVATE EQUITY & VENTURE CAPITAL
SPOTLIGHT
■ VOLUME 12, ISSUE 1 ■ JANUARY 2017
alternative assets. intelligent data.
2015 Annual CAIA Corporate Recognition
Award Winner
2017PREQIN GLOBALPRIVATE EQUITY & VENTURE CAPITALREPORT
alternative assets. intelligent data.
ISBN: 978-1-907012-97-6$175 / £125 / €150www.preqin.com
EXCLUSIVE FIRST LOOK AT
THE 2017 PREQIN GLOBAL
PRIVATE EQUITY & VENTURE
CAPITAL REPORT
This month’s Private Equity
& Venture Capital Spotlight features a preview of the most comprehensive review of the asset class ever undertaken, including:
■ 2016 Fundraising Market■ First-Time Fund Managers■ Performance Benchmarks■ Investor Appetite■ Venture Capital Deals■ Largest Buyout Deals and Exits
...and much more!
Email us at [email protected] to ensure you're notifi ed of the launch
450+ LPs. 2000+ Attendees. 400+ Speakers. Countless Opportunities.27 February – 2 March, 2017InterContinental Hotel, Berlin
Visit website
Dear Spotlight reader,
We are very pleased to offer a 10% discount to Spotlight readers for registrations to SuperReturn Internationalin Berlin, 27 February – 2 March, 2017.
Bringing together private equity leaders from around the world, including:• 2000 top private equity and venture capital attendees• 400+ LPs, including decision makers from pension plans, family offices, sovereign wealth funds, foundationsand fund of funds• 400+ speakers, including global industry titans from the world’s biggest private equity houses and specialguest speakers.
As well as offering you the perfect opportunity to connect with LPs via a networking app and other facilities,the conference will dig deeper into co investments and explore the current dynamics of the LP/GP relationshipplus cover the hottest topics in private equity.
I hope to see you there!
Kindest regards
Mark O’HareManaging Director,Preqin
For all bookings & enquiries, please contact the SuperReturn International TeamQuote VIP: FKR2428PRQSP for your 10% discountTel: +44 (0) 20 7017 7200Email: [email protected] website
Driving Innovation. Developing Opportunity.27 28 February 2017
Pullman Berlin Schweizerhof, Berlin
And remember, SuperVenture is co located with SuperReturn International. This means that if you register forSuperVenture, you can attend whichever parts of day one of SuperReturn International you want. And havethe opportunity to meet the 450+ LPs attending both events.
© Preqin Ltd. 2017 / www.preqin.com3 Private Equity & Venture Capital Spotlight | January 2017
2017 PREQIN GLOBAL PRIVATE EQUITY & VENTURE CAPITAL REPORT
- SAMPLE PAGES
CONTENTS
CEO’s Foreword - Mark O’Hare 4
1: 2017 PREQIN GLOBAL PRIVATE EQUITY & VENTURE CAPITAL REPORT
Keynote Address - Joseph Bae, KKR 6
Keynote Address - Capturing Megatrends Growth through Minority Stakes - Stanislas Cuny, Amundi
8
2: OVERVIEW OF THE PRIVATE EQUITY INDUSTRY
Private Equity in Context 12
Private Equity: 2016 in Numbers 16
Private Equity in 2017 - Christopher Elvin, Preqin 17
Private Equity and Public Image - Bronwyn Bailey, American Investment Council
18
Brexit and the UK’s Private Equity & Venture Capital Industry - Gurpreet Manku, BVCA
20
Emerging Markets in a Trump Administration - Robert W. van Zwieten, EMPEA
21
Addressing LP Concerns - Peter Freire, Institutional Limited Partners Association (ILPA)
22
3: ASSETS UNDER MANAGEMENT AND DRY POWDER
Assets under Management and Dry Powder 24
4: FUNDRAISING
Marketing Your Fund II - Clay Deniger, Capstone Partners 28
2016 Fundraising Market 30
Funds in Market 33
In Focus: Regional Fundraising 36
North American Fundraising 37
SMid Cap: Focus and Growth - Eric Bismuth, Montefi ore Investment
38
European Fundraising 39
Asian Fundraising 40
Rest of World Fundraising 41
5: FUND MANAGERS
A Fast-Evolving Landscape - Moose Guen, MVision 44
Fund Manager Outlook for 2017 46
Fund Manager Views on Investor Appetite 49
The Case for First-Time Funds - Michael Murphy, Credit Suisse Private Fund Group
50
First-Time Fund Managers 52
Largest Fund Managers 54
Compensation and Employment 56
Women in Private Equity 58
6: ALTERNATIVE STRUCTURES
Co-Investments 60
Investor and Fund Manager Use of Separate Accounts 63
7: PERFORMANCE
Chasing Yield - “Heading into The Unknown”- Leon Sinclair, IHS Markit
66
Building the Infrastructure for Repeatable Value Creation - Niclas Thelander, Outsized
67
Performance Overview 69
PrEQIn Private Equity Quarterly Index 72
Horizon Returns 73
Private Equity Returns for Public Pension Funds 74
Private Equity Performance Benchmarks 75
Consistent Performing Managers 77
8: INVESTORS
The LP Perspective: Accessing Private Equity Funds - Maurice Gordon, Guardian Life Insurance
80
Evolution of the Investor Universe 81
Investors in Recently Closed Funds 83
Investor Appetite for Private Equity in 2017 85
Sample Investors to Watch in 2017 88
How Investors Source and Select Funds 90
PRIVATE EQUITY ONLINE
Private Equity Online is Preqin’s fl agship online private equity information resource and encompasses all of Preqin’s private
equity and venture capital databases, with unrivalled data and intelligence on all aspects of the asset class, including fund
terms and conditions, fundraising, fund managers, institutional investors, fund performance, deals and exits and more.
Constantly updated by our teams of dedicated researchers strategically located in industry centres around the globe, Private
Equity Online represents the most comprehensive source of industry intelligence available today.
www.preqin.com/privateequity
© Preqin Ltd. 2017 / www.preqin.com4 Private Equity & Venture Capital Spotlight | January 2017
Largest Investors by Region 91
Largest Investors by Type 92
9: INVESTMENT CONSULTANTS
Investment Consultant Outlook for 2017 94
10: FUND TERMS AND CONDITIONS
Fund Terms and Conditions Overview 98
Investor Attitudes towards Fund Terms and Conditions 100
Leading Law Firms 102
11: BUYOUT
Private Equity in Australia - Shannon Wolfers, Pacifi c Equity Partners
104
Buyout Fundraising 106
Buyout Fund Managers 107
Buyout Performance Benchmarks 108
Private Equity-Backed Buyout Deals 110
Deal Flow by Type, Value and Industry 112
Global Buyout Exit Overview 114
Industry Focus: Industrials 116
Industry Focus: Information Technology 117
Industry Focus: Consumer & Retail 118
Most Active Private Equity Firms, Debt Providers and Deal Advisors
119
Largest Buyout Deals and Exits 120
12: VENTURE CAPITAL
Venture Capital Fundraising 122
Venture Capital Fund Managers 123
Venture Capital Performance Benchmarks 124
Venture Capital Deals 126
Deal Flow by Stage and Industry 128
Global Venture Capital Exit Overview 130
Industry Focus: Internet 131
Industry Focus: Software & Gaming 132
Industry Focus: Healthcare 133
Most Active Firms, Largest Deals and Notable Exits 134
13: GROWTH
Growth Fundraising 138
Growth Fund Managers 139
Growth Performance Benchmarks 140
Growth Deals 141
14: FUNDS OF FUNDS
Fund of Funds Fundraising 144
Fund of Funds Managers 145
Fund of Funds Performance Benchmarks 146
15: SECONDARY MARKET
Public Equity & Political Uncertainty Drive 2016 Volume- Ian Charles & John Stott, Landmark Partners
148
Overview of the Secondary Market 149
Secondaries Fundraising 152
Secondary Fund of Funds Managers 154
Direct Secondaries 155
Intermediaries 156
16: TURNAROUND
Turnaround Overview 158
17: SERVICE PROVIDERS
Placement Agents 160
Fund Administrators 163
Fund Auditors 164
The data behind all of the charts featured in the Report is available to purchase in Excel format.
Ready-made charts are also included that can be used for presentations, marketing materials and
company reports.
To purchase the data pack, please visit:
www.preqin.com/gper
DATA PACK FOR 2017 PREQIN GLOBAL PRIVATE EQUITY & VENTURE CAPITAL REPORT
2017 PREQIN GLOBAL PRIVATE EQUITY & VENTURE CAPITAL REPORT
- SAMPLE PAGES
We congratulate our vintage year 2016 clients.
All closed above target.All oversubscribed.All well deserved.
Capstone is proud to be associated with such an exclusive group.
Global private equity fundraisingCapstone Partners (www.csplp.com) is a leading independent placementagent focused on raising capital for private equity, credit, real assetsand infrastructure firms. The Capstone team includes 30 experiencedprofessionals in North America, Europe and Asia.
www.csplp.comAmericas — Europe — Middle East — Asia Pacific
Securities placed through CSP Securities, LPMember FINRA/SIPCAuthorised by FINMA
© Preqin Ltd. 2017 / www.preqin.com7 Private Equity & Venture Capital Spotlight | January 2017
Since launching in Asia over a decade
ago, how has KKR’s strategy evolved in
the region?
Over the last 10 years, KKR has built a large regional footprint in Asia in a systematic and disciplined way. As a result, today we have one of the largest private equity platforms in Asia, with seven offi ces, more than 120 KKR executives and more than $10bn of capital deployed. In addition, 15 executives from KKR Capstone support our eff orts. In fact, some of our best returns globally in private equity at the fi rm have come out of Asia.
While we have grown in size, our strategy has – at a high level – stayed the same: maintain highly localized teams that are fully integrated with our global platform. Asia is not one big market – it is a collection of diff erent markets. By localizing our investment teams, executives can focus on unique origination channels in the local markets we want to do business in. At the same time, KKR’s global network is critically important as it off ers companies access to our operational capabilities, industry expertise and network of US or European contacts, all of which can help accelerate the growth of the local businesses we partner with.
In the next fi ve years, do you see KKR’s
Asia strategy continuing to change?
We think there is an increasing advantage to having multiple pools of capital. To succeed in Asia long-term, it is not simply about how big your private equity fund is, but rather about the fl exibility you have to partner with key entrepreneurs and stakeholders in the region. At KKR, we are fortunate to have many pools of fl exible capital beyond private equity, whether through special situations, direct lending, real estate, or even our Firm’s balance sheet. Our ability to take advantage of diff erent investment opportunities up and down the capital structure will be a critical piece in how we continue to succeed in Asia.
Where are you seeing attractive risk/
return opportunities in Asia in light
of emerging market declines and the
general concern about Asia’s slowdown?
The current macro growth environment is very diff erent from when we fi rst entered the market in 2005. In certain emerging markets, like China, we are seeing a deceleration of growth and a slowdown in global trade overall. Given these headwinds, we are most inclined to buy complexity and sell simplicity.
Particularly in China, we want to invest behind opportunities where our diff erentiator is not our capital but rather our ability to provide a solution. For example, we have made multiple investments in Chinese agricultural companies that focus on food safety and security for everything from poultry to milk, beef to feed. As the government works to ensure the country’s food safety practices keep pace with economic expansion, gaps in operations and quality control have led to a number of large, food-related incidents in the country, shaking consumers’ confi dence in the safety of their food. In the aftermath of such events, companies are looking for a partner who can add value and help them implement global best practices to emerge even stronger and safer than before. This is one way we have integrated Environmental, Social and Governance (ESG) principles into our investment process.
We also see unique opportunities in markets such as Japan, Korea and Australia where we believe we can create large-scale corporate carve-outs, taking our operational approach to investing and helping drive meaningful improvements at the companies we invest behind. In emerging markets such as India, we see a shift to more control-oriented opportunities and, therefore, do not focus on small minority growth deals. Instead, we are looking to invest in larger-scale opportunities which might be more
complex operationally, but where we are able to provide a solution in addition to supplying capital.
Where do you see the best investment
opportunities in Asia in terms of
geography?
From a pipeline standpoint, one of our busiest markets today is Japan and there are a number of reasons for that. The country’s focus on corporate governance, on corporate reform and the divestiture of non-core assets is creating signifi cant opportunities for fi rms like us to partner with leading Japanese corporates and acquire non-core businesses to fundamentally reposition their growth trajectory. Our carve-out of Panasonic’s healthcare business and its subsequent acquisition of Bayer’s global diabetes care business is a prime example of this.
Japan is also interesting in that valuations on a relative basis are quite low in comparison to other mature markets, such as the US and Europe. The fi nancing markets are among the most liquid in the world for Japanese banks and the potential for operational improvement is high. Finally, the competitive landscape within private equity is much more limited in the area given how diffi cult it is to penetrate the Japanese market. The combination of these factors – and the way KKR’s franchise is uniquely positioned in the region – makes Japan an attractive geography for us.
And with regards to sector?
We continue to be attracted to sectors tied to domestic consumption in emerging markets. This includes longer-term trends around a rising middle class, urbanization, services and consumption, and means we are spending a lot of time in healthcare, food, consumer and fi nancial services sectors. Nonetheless, a lot of those sectors today are overvalued, so we need to be quite disciplined about how we deploy capital into them. More recently, we have started investing in markets like Indonesia
KEYNOTE ADDRESS- Joseph Bae, KKR
1. 2017 PREQIN GLOBAL PRIVATE EQUITY &
VENTURE CAPITAL REPORT
2017 PREQIN GLOBAL PRIVATE EQUITY & VENTURE CAPITAL REPORT
- SAMPLE PAGES
© Preqin Ltd. 2017 / www.preqin.com8 Private Equity & Venture Capital Spotlight | January 2017
1. 2017 PREQIN GLOBAL PRIVATE EQUITY &
VENTURE CAPITAL REPORT
2017 PREQIN GLOBAL PRIVATE EQUITY & VENTURE CAPITAL REPORT
- SAMPLE PAGES
– where we made our fi rst two private equity investments this year – because we can get access to very signifi cant domestic consumption trends at a much more interesting valuation than we can in markets like China and India.
Are you seeing more buyout and control
deals across Asia-Pacifi c?
Absolutely. In markets like Korea and Japan, that has always been our core target deal. In India, there has been a meaningful shift in opportunity to do interesting control deals and we are hoping to see more buyout and control deals becoming available in China, especially given the succession issues entrepreneurs are facing in the region and the slowing growth environment.
We are seeing a record level of cross-
border M&A activity from companies
from markets such as China. What
is driving this activity, and what
opportunities are you seeing?
One of the distinct developments in the global M&A market over the last fi ve years is the emergence of Asian strategic buyers. Of all cross-border M&A deals today, approximately 25% involve Chinese buyers and 11% involve Japanese buyers. So, over one-third of today’s global M&A market is being dominated by Chinese and Japanese buyers. A big reason for this is the excess liquidity on-shore and companies’ fundamental desire to gain access to technologies, customers and new channels of growth abroad. This is especially true in the manufacturing sector, where Chinese companies want to migrate to higher value-added manufacturing and away from commodity manufacturing.
This is an opportunity for global fi rms like ours that are integrated across the US, Europe and Asia. For example, in the last year we executed on transformational cross-border deals with two of our portfolio companies: Haier, which acquired GE’s global home appliance business, and Panasonic Healthcare, which acquired Bayer’s global diabetes care unit. These acquisitions repositioned the companies as dominant global businesses and helped fulfi l a long-term strategic desire of the management teams to expand abroad. Being able to connect buyers and sellers
from around the world has also been a big reason for our achieving of premium prices for assets we are selling out of our portfolio.
What is your approach to deal sourcing
in Asia?
First and foremost, it is being positioned in the market as solutions providers, and not simply as fi nancial investors. We want to be chosen as a partner in order to fundamentally help improve companies and grow businesses.
We have a highly localized approach to deal sourcing. Maintaining a deep local network of relationships and teams is a key element of how we source deals. In the last decade, the majority of what we have done in Asia has been on a proprietary basis, participating in very few secondaries and auctions. We also try to develop a specialized expertise in certain areas, such as food safety and specialty agriculture, to diff erentiate ourselves in terms of industry knowledge.
Valuations in Asia have only corrected
to a moderate extent in light of market
uncertainty. How do you source deals in
this environment?
Equity markets have performed very diff erently in emerging markets over the last fi ve years than they have in the US and Europe. While valuations in those regions are very high, Asia has been in a 72-month downturn in equities. This is mostly driven by concerns around a slowdown in China as well as weakness in foreign currency with the expectation that the US dollar will rise. We believe we are close to where we think the market is stabilizing in the emerging markets. Therefore, now is an interesting vintage for us to be more aggressive in deploying capital as we believe we are closer to the bottom of the cycle than the top.
With the low valuation environment in
Asia today, how diffi cult has it been to
monetize your investments at attractive
prices?
In the last 10 years, we have invested $10bn and returned over $11bn back to our investors, with $9bn being returned in the last fi ve years alone. We have found that if you have a high-quality business in Asia that is growing, the exit will likely
take care of itself, either through the IPO market or through a strategic sale of the business. The key is being nimble, fl exible and ensuring you hit the windows for exit at the right time.
What are the main challenges heading
into 2017 and what is your advice to
navigate these?
Given the global political movement towards populism, I expect to see more volatility in addition to continued headwinds facing global trade. Another challenge would be the signifi cant structural changes needing to take place in the Chinese markets to rebalance their economy. To navigate these properly, I would stress the need to be fl exible, opportunistic and focused on the risk-reward you are looking to take in the marketplace. Investing across Asia today is not a simple bet. To succeed, you must have a very specifi c strategy in terms of how you are going to create value above and beyond what the macro market is doing.
KKRFounded in 1976, KKR is a leading global investment fi rm that invests in multiple asset classes. In our private equity business, we invest our own capital alongside third-party capital through a group of private equity funds and co-investment vehicles, for long-term appreciation, generally through controlling ownership of a company or strategic minority positions. In our investments, we aim to grow and build long-term value, which we believe ultimately benefi ts our fund investors as well as the companies in which we invest, their employees, and the communities in which the companies operate. JOSEPH BAEMr. Bae has been with KKR for over 20 years and is the Managing Partner of KKR Asia and the Global Head of KKR’s Infrastructure and Energy Real Asset businesses. He is the Chairman of KKR’s Asia Private Equity Investment Committee. He also serves as a member of KKR’s Americas and European Private Equity Investment Committees and KKR’s Energy, Infrastructure and Special Situations Investment Committees.
www.kkr.com
© Preqin Ltd. 2017 / www.preqin.com9 Private Equity & Venture Capital Spotlight | January 2017
2. OVERVIEW OF THE PRIVATE EQUITY
INDUSTRY
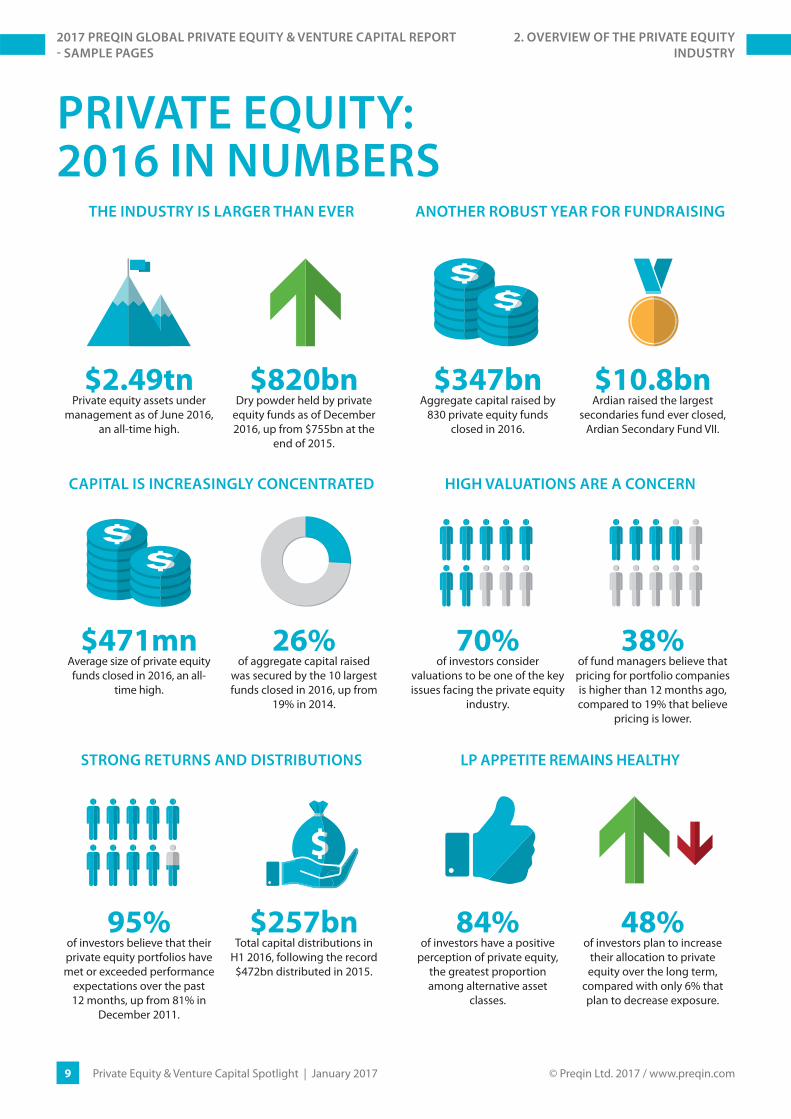
PRIVATE EQUITY: 2016 IN NUMBERS
THE INDUSTRY IS LARGER THAN EVER ANOTHER ROBUST YEAR FOR FUNDRAISING
$2.49tnPrivate equity assets under
management as of June 2016, an all-time high.
$820bnDry powder held by private
equity funds as of December 2016, up from $755bn at the
end of 2015.
$347bnAggregate capital raised by
830 private equity funds closed in 2016.
$10.8bnArdian raised the largest
secondaries fund ever closed, Ardian Secondary Fund VII.
CAPITAL IS INCREASINGLY CONCENTRATED HIGH VALUATIONS ARE A CONCERN
70%of investors consider
valuations to be one of the key issues facing the private equity
industry.
38%of fund managers believe that pricing for portfolio companies is higher than 12 months ago, compared to 19% that believe
pricing is lower.
$471mnAverage size of private equity funds closed in 2016, an all-
time high.
26%of aggregate capital raised
was secured by the 10 largest funds closed in 2016, up from
19% in 2014.
STRONG RETURNS AND DISTRIBUTIONS LP APPETITE REMAINS HEALTHY
95%of investors believe that their private equity portfolios have met or exceeded performance
expectations over the past 12 months, up from 81% in
December 2011.
$257bnTotal capital distributions in
H1 2016, following the record $472bn distributed in 2015.
84%of investors have a positive
perception of private equity, the greatest proportion among alternative asset
classes.
48%of investors plan to increase
their allocation to private equity over the long term,
compared with only 6% that plan to decrease exposure.
2017 PREQIN GLOBAL PRIVATE EQUITY & VENTURE CAPITAL REPORT
- SAMPLE PAGES

© Preqin Ltd. 2017 / www.preqin.com10 Private Equity & Venture Capital Spotlight | January 2017
2016 was another stellar year for private equity and the total AUM for the industry now stands at $2.49tn as of June 2016 (the latest data available), an all-time high. The question on many people’s minds is ‘how much longer will it continue?’ While the reality is that only time will tell, private equity is well positioned for another strong year in 2017, despite continuing economic concerns and wider political volatility.
PRIVATE EQUITY CONTINUES TO
DELIVER FOR INVESTORS
In the three years to June 2016, private equity investors have seen annualized returns of 16.4%, the highest among all private capital strategies. As a result of this strong performance, investors have continued to see distributions signifi cantly surpass capital calls: $257bn was distributed in the fi rst half of 2016 compared with $129bn in capital calls – so a net cash fl ow of $128bn back to LPs. The trend of capital distributions surpassing capital calls is now in its sixth year, and it is the third year in which net cash fl ows to investors have been well in excess of $100bn.
Fifty-seven percent of institutional investors now have an allocation to private equity, and as a result of high distribution levels, investor satisfaction is at an all-time high – 95% of investors recently surveyed (see pages 85-87) stated that private equity had met or exceeded their expectations in the past year; 48% of respondents plan to increase their allocations to private equity over the long term, while a further 46% will maintain their allocations. Similarly, 49% of LPs are looking to invest the same amount of capital and 40% are looking to invest more capital in private equity in the next 12 months than they did during 2016.
A THRIVING FUNDRAISING
ENVIRONMENT
Driven by LP demand and liquidity, 2016 was the fourth consecutive year in which
private equity fundraising surpassed $300bn. However, there is a clear trend towards greater concentration of capital among fewer funds – 12% fewer funds closed in 2016 than in 2015, resulting in the average fund size increasing to $471mn, an all-time high. Private equity accounted for 57% of all private capital raised in 2016, up from 52% the previous year.
Perhaps the greatest indication of the liquidity LPs currently have, as a result of the wave of distributions they have received over the past few years, is the fact that 76% of private equity funds closed in 2016 met or exceeded their target size. This represents the largest proportion of funds meeting or exceeding their target size in any year over the period 2009-2016, with the proportion failing to meet their target decreasing from 63% in 2009 to 25% in 2016.
STILL A SELLER’S MARKET
While the volume of private equity backed buyouts in 2016 (3,986) is expected to surpass the record number of transactions seen in 2014 (4,006) as more data becomes available, aggregate deal value ($319bn) was 25% lower than in 2015 and reached the lowest level seen since 2013 ($313bn). Venture capital deal fl ow in 2016 saw the opposite trend: 9,719 deals were recorded during the year, the lowest number since 2013, but the aggregate value of deals reached $134bn, just behind the record amount achieved in 2015 ($140bn).
Fund managers are clearly fi nding it tough going due to the current high entry prices for assets. They are also clearly seeing more competition for assets: Preqin’s latest survey found that 42% of fund managers feel that there is currently more competition for transactions, and 38% of respondents feel that pricing for portfolio companies is higher than it was 12 months ago.
Despite 2016 being the second consecutive year in which both buyout and venture capital exit activity has fallen (see pages 114 and 130), it is still very much a seller’s market, and exit activity is higher than all years prior to 2013. Thirty percent of fund managers expect exit activity to increase in 2017, and a further 46% expect it to remain at current levels.
OUTLOOK FOR 2017
The private equity model is working and in a low interest rate environment the asset class will continue to appeal to investors looking for high absolute returns and portfolio diversifi cation.
A record number of private equity funds are currently in market: 1,829 funds are seeking an aggregate $620bn. This will bring challenges, particularly for fi rst-time and emerging markets managers, in competing for investor capital as well as in meeting the demands of an increasingly sophisticated investor community. However, with the majority of LPs sitting very liquid as a result of continuing distributions and looking to maintain, if not increase, their exposure to the asset class, fundraising has rarely looked so appealing.
A signifi cant proportion of assets invested prior to the Global Financial Crisis (GFC) are yet to be realized, so should market conditions remain favourable it is likely that the fervent exit activity will continue in 2017. While pricing remains a very real concern, fund managers have record levels of capital available to them and our survey results indicate that many are looking to increase the amount of capital they deploy over the next 12 months.
PRIVATE EQUITY IN 2017- Christopher Elvin, Preqin
2. OVERVIEW OF THE PRIVATE EQUITY
INDUSTRY
2017 PREQIN GLOBAL PRIVATE EQUITY & VENTURE CAPITAL REPORT
- SAMPLE PAGES

© Preqin Ltd. 2017 / www.preqin.com11 Private Equity & Venture Capital Spotlight | January 2017
2016 FUNDRAISING MARKET
An aggregate $347bn was raised by 830 private equity funds closed in
2016, marking the fourth consecutive year in which fundraising has surpassed $300bn (Fig. 4.1). This fi gure is likely to increase as more data becomes available, and the fundraising total for 2016 is expected to exceed the level seen in 2014 ($348bn), therefore representing the largest amount of capital raised since the GFC. Private equity accounted for 57% of all private capital raised in 2016, up from 52% the previous year. The increased demand has been supported by continued high net distributions (see page 26), which have caused LPs to reinvest capital back into private equity in order to maintain their allocations.
Alongside the large sums of capital being invested through traditional fund structures, a substantial amount of capital is being invested via alternative structures such as co-investments and separate account mandates. Among LPs profi led on Preqin’s Private Equity Online, 42% actively make co-investments and a further 12% are considering doing so; 30% make use of separate accounts, with 9% considering this route.
QUARTERLY FUNDRAISING
The fl ow of capital into private equity funds is presented in Fig. 4.2, which
shows the capital raised each quarter via interim and fi nal closes, highlighting the strong fundraising in recent quarters. The methodology to calculate this involves analyzing the capital raised for each close that takes place in each quarter; only fresh capital is counted, with capital that has been raised via previous closes held in an earlier quarter excluded. The second quarter of 2016 was a particularly successful period, with $117bn secured, the largest sum of capital raised in a single quarter since Q2 2008, when $137bn was raised.
CAPITAL CONCENTRATION
The trend towards greater concentration of capital among fewer funds continued in 2016: 12% fewer funds closed than in 2015, resulting in the average fund size increasing to $471mn, an all-time high. LPs appear to be investing more capital with a smaller number of proven and well-known GPs, with the largest funds accounting for a greater proportion of overall fundraising. The 10 largest private equity funds closed in 2014 accounted for 19% of overall fundraising for that year; in 2016, the fi gure is 26%. Similarly, the proportion of capital accounted for by
343236
6273
65
54
7365
76
6169
49
72 72
100
83
103
829296
88
70
10094
117
8379
0
20
40
60
80
100
120
140
Q1
Q2
Q3
Q4
Q1
Q2
Q3
Q4
Q1
Q2
Q3
Q4
Q1
Q2
Q3
Q4
Q1
Q2
Q3
Q4
Q1
Q2
Q3
Q4
Q1
Q2
Q3
Q4
2010 2011 2012 2013 2014 2015 2016
Source: Preqin Private Equity Online
Aggr
egat
e Ca
pita
l Rai
sed
($bn
)
Fig. 4.2: Quarterly Global Private Equity Fundraising (Includes Final and Interim Closes), Q1 2010 - Q4 2016
19%
30%
24%
34%
26%
38%
0%
5%
10%
15%
20%
25%
30%
35%
40%
45%
10 Largest Funds Closed 20 Largest Funds Closed
2014
2015
2016
Source: Preqin Private Equity Online
Prop
ortio
n of
Agg
rega
te C
apita
l Rai
sed
Fig. 4.3: Proportion of Aggregate Capital Raised by Largest Funds Closed, 2014 - 2016
209
350410
516
750
603500
418
618
765
9081,009 1,001
706 742851 862
9391,019
945
830
31 70 107 135207
135 101 74137
248350
413 408
208 173 213 225310 348 329 347
0
200
400
600
800
1,000
1,200
1996
1997
1998
1999
2000
2001
2002
2003
2004
2005
2006
2007
2008
2009
2010
2011
2012
2013
2014
2015
2016
No. of Funds Closed Aggregate Capital Raised ($bn)Source: Preqin Private Equity Online
Year of Final Close
Fig. 4.1: Annual Global Private Equity Fundraising, 1996 - 2016
4. FUNDRAISING2017 PREQIN GLOBAL PRIVATE EQUITY & VENTURE CAPITAL REPORT
- SAMPLE PAGES
EUROPEAN FAMILY OFFICE WINTER SYMPOSIUM
1 - 2 February 2017One Great George Street, London, UK
Ref Code: PEFOWS17
Sponsorship and Exhibiting Opportunities are Available:If you are interested in attending, sponsoring, speaking or exhibiting at this event, please call 212-532-9898 or email
Register: To register, visit us online at
www.opalgroup.net or email us at [email protected]
As a part of our Private Wealth Series, this conference will be attended by High Net-Worth Individuals, Family
around the world. Our mission is to provide an intimate setting for the free exchange of ideas along with
winter symposium will include a blend of educational discussion panels, workshops, presentations, and pre-arranged one-to-one meetings.
FOR MORE INFORMATION, PLEASE CONTACT LEYANA DACCACHE:[email protected]
THE POLICY OF BEING TOO
CAUTIOUS IS THE GREATEST
RISK OF ALL.
March 20-21, 2017 | The Drake Hotel | Chicago, IL
NORTH AMERICAN PENSIONS SUMMIT
NETWORK WITH INDUSTRY EXPERTS LIKE:Chairperson: Larisa Mueller, Senior Investment Manager, The Ministers and Missionaries Benefit Board
Jim Maloney, Director, Illinois Public Pension Fund Association and Trustee-Chairman of the Investment Committee, Chicago Policemen’s Annuity and Benefit Fund
Aoifinn Devitt, Chief Investment Officer, Chicago Policemen’s Annuity and Benefit Fund
Kathleen Gallagher, Former Chief Investment Officer, Ford Motor Company
Paul Benjamin, Director, Pension Investments, Alcoa, Inc.
The North American Pensions Summit is the premium forum bringing elite buyers and sellers together. As an invitation-only event, taking place behind closed doors, the Summit offers senior investment executives and service providers an intimate environment for a focused discussion of key new drivers shaping asset allocations.

© Preqin Ltd. 2017 / www.preqin.com13 Private Equity & Venture Capital Spotlight | January 2017
5. FUND MANAGERS2017 PREQIN GLOBAL PRIVATE EQUITY & VENTURE CAPITAL REPORT
- SAMPLE PAGES
private equity assets over 2016 (Fig. 5.4). Furthermore, GPs were asked about the level of competition in distinct parts of the market:
■ Venture Capital: an average of 37% of surveyed GPs saw an increase in competition across all stages of venture capital investment over 2016, although the largest proportions across every stage had seen no change. Larger proportions of GPs are seeing less competition in earlier stages (seed: 25%; early stage: 22%), a refl ection of the large pool of start-up companies these fi rms look to target.
■ Growth: more GPs have observed increased competition for growth investments than for venture capital, making growth one of the most competitive markets in private equity; while 45% of respondents saw no change in competition over 2016, 43% witnessed more, behind only mid-market (51%) and large (44%) buyouts.
■ Buyout: as expected, GPs face the most competition for mid-market opportunities, where surveyed investors see the best opportunities at present (see page 87). More than half of respondents active in the area saw an increase in competition for mid-market assets over 2016. Signifi cant levels of capital secured by the largest private equity fi rms at the higher end of the market mean that competition for large buyout transactions has intensifi ed.
The low interest rate environment has reduced the cost of borrowing for GPs: 85% of fi rms surveyed have seen the terms of debt fi nancing for private equity investments remain the same or improve over 2016. Combined with greater levels of capital raised annually and record levels of dry powder available for investment (see pages 24-26), this has pushed valuations up: 38% of surveyed GPs have seen an increase in pricing over the past 12 months, with only 19% witnessing lower entry prices. This puts pressure on GPs that usually have three- to fi ve-year investment periods before exiting investments. However, respondents are confi dent in the exit opportunities available in the year ahead: while the largest proportion
believe exit activity will remain the same over 2017, more respondents predict exit activity will increase than decrease. Thirty-fi ve percent of fund managers surveyed believe there will be greater activity in the venture capital exit market over 2017, compared with 24% that believe there will be less; for exits in the rest of the private equity market, 30% believe there will be more activity in the year ahead compared to 23% that believe there will be less.
MORE INVESTMENT IN THE YEAR AHEAD
Despite more than half of GPs stating that there has been no change in the level of diffi culty in fi nding attractive opportunities over 2016, the majority of surveyed managers across all regions
expect to increase the amount of capital they deploy in private equity assets over the next 12 months (Fig. 5.5). This includes more than a quarter of respondents based in each of North America and Europe,
FUND MANAGER VIEWS ON PRICING FOR PORTFOLIO COMPANIES
COMPARED TO 12 MONTHS AGO
Pricing higher38%
Pricing lower19%
14% 11%
41% 47%
45% 42%
0%
10%
20%
30%
40%
50%
60%
70%
80%
90%
100%
Nov-15 Nov-16
Reviewing MoreOpportunities
No Change
Reviewing FewerOpportunities
Source: Preqin Fund Manager Survey, November 2015 - November 2016
Prop
ortio
n of
Res
pond
ents
Fig. 5.3: Fund Manager Views on the Number of Opportunities Reviewed per Investment Compared to 12 Months Ago
9%25% 22%
12% 16% 12% 15%5%
19%
48%38% 40% 54% 45% 45%
50%
43%
37%
42% 37% 38% 34% 39% 43% 35%51% 44%
0%10%20%30%40%50%60%70%80%90%
100%
Priv
ate
Equi
ty
Seed
Early
Sta
ge
Expa
nsio
n
Late
Sta
ge
Gro
wth
Smal
l
Mid
-Mar
ket
Larg
e
Venture Capital Buyout
More Competition
No Change
Less Competition
Source: Preqin Fund Manager Survey, November 2016
Prop
ortio
n of
Res
pond
ents
Fig. 5.4: Fund Manager Views on the Level of Competition for Transactions Compared to 12 Months Ago
© Preqin Ltd. 2017 / www.preqin.com14 Private Equity & Venture Capital Spotlight | January 2017
5. FUND MANAGERS2017 PREQIN GLOBAL PRIVATE EQUITY & VENTURE CAPITAL REPORT
- SAMPLE PAGES
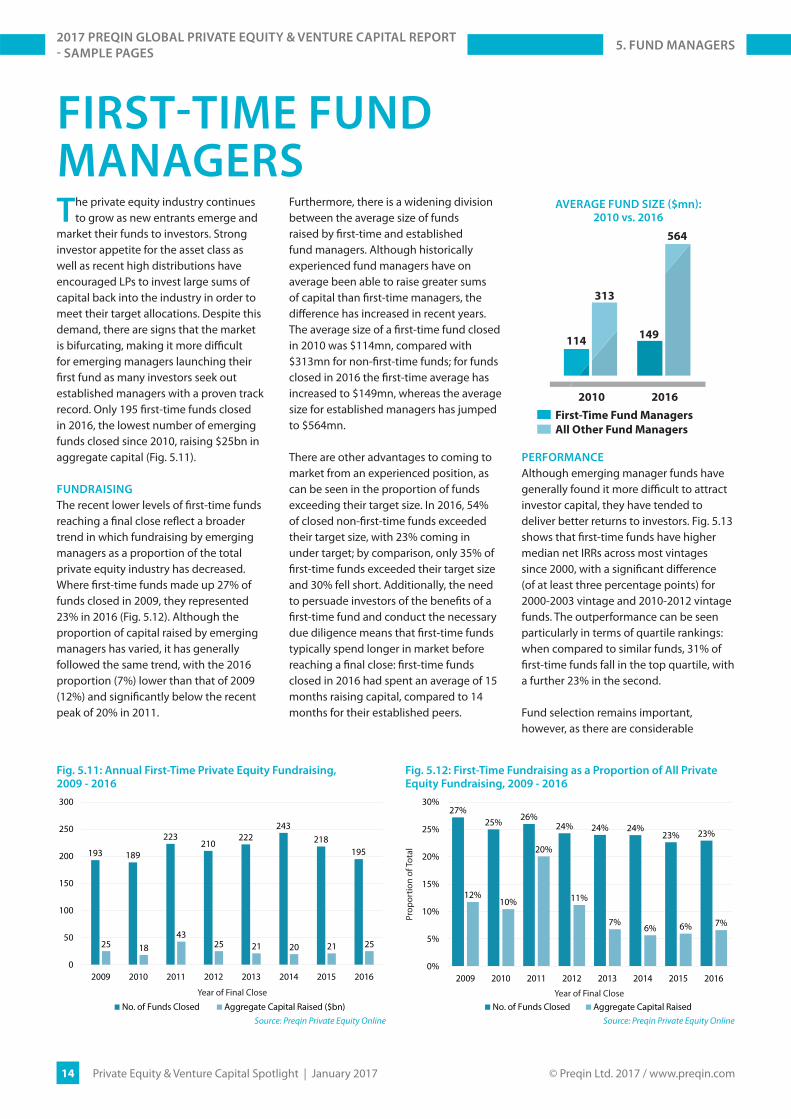
FIRST-TIME FUND MANAGERSThe private equity industry continues
to grow as new entrants emerge and market their funds to investors. Strong investor appetite for the asset class as well as recent high distributions have encouraged LPs to invest large sums of capital back into the industry in order to meet their target allocations. Despite this demand, there are signs that the market is bifurcating, making it more diffi cult for emerging managers launching their fi rst fund as many investors seek out established managers with a proven track record. Only 195 fi rst-time funds closed in 2016, the lowest number of emerging funds closed since 2010, raising $25bn in aggregate capital (Fig. 5.11). FUNDRAISING
The recent lower levels of fi rst-time funds reaching a fi nal close refl ect a broader trend in which fundraising by emerging managers as a proportion of the total private equity industry has decreased. Where fi rst-time funds made up 27% of funds closed in 2009, they represented 23% in 2016 (Fig. 5.12). Although the proportion of capital raised by emerging managers has varied, it has generally followed the same trend, with the 2016 proportion (7%) lower than that of 2009 (12%) and signifi cantly below the recent peak of 20% in 2011.
Furthermore, there is a widening division between the average size of funds raised by fi rst-time and established fund managers. Although historically experienced fund managers have on average been able to raise greater sums of capital than fi rst-time managers, the diff erence has increased in recent years. The average size of a fi rst-time fund closed in 2010 was $114mn, compared with $313mn for non-fi rst-time funds; for funds closed in 2016 the fi rst-time average has increased to $149mn, whereas the average size for established managers has jumped to $564mn. There are other advantages to coming to market from an experienced position, as can be seen in the proportion of funds exceeding their target size. In 2016, 54% of closed non-fi rst-time funds exceeded their target size, with 23% coming in under target; by comparison, only 35% of fi rst-time funds exceeded their target size and 30% fell short. Additionally, the need to persuade investors of the benefi ts of a fi rst-time fund and conduct the necessary due diligence means that fi rst-time funds typically spend longer in market before reaching a fi nal close: fi rst-time funds closed in 2016 had spent an average of 15 months raising capital, compared to 14 months for their established peers.
PERFORMANCE
Although emerging manager funds have generally found it more diffi cult to attract investor capital, they have tended to deliver better returns to investors. Fig. 5.13 shows that fi rst-time funds have higher median net IRRs across most vintages since 2000, with a signifi cant diff erence (of at least three percentage points) for 2000-2003 vintage and 2010-2012 vintage funds. The outperformance can be seen particularly in terms of quartile rankings: when compared to similar funds, 31% of fi rst-time funds fall in the top quartile, with a further 23% in the second. Fund selection remains important, however, as there are considerable
193 189
223210
222243
218195
25 1843
25 21 20 21 25
0
50
100
150
200
250
300
2009 2010 2011 2012 2013 2014 2015 2016
No. of Funds Closed Aggregate Capital Raised ($bn)Source: Preqin Private Equity Online
Year of Final Close
Fig. 5.11: Annual First-Time Private Equity Fundraising, 2009 - 2016
27%25% 26%
24% 24% 24%23% 23%
12%10%
20%
11%
7%6% 6% 7%
0%
5%
10%
15%
20%
25%
30%
2009 2010 2011 2012 2013 2014 2015 2016
No. of Funds Closed Aggregate Capital RaisedSource: Preqin Private Equity Online
Prop
ortio
n of
Tota
l
Year of Final Close
Fig. 5.12: First-Time Fundraising as a Proportion of All Private Equity Fundraising, 2009 - 2016
AVERAGE FUND SIZE ($mn): 2010 vs. 2016
2010 2016
First-Time Fund Managers
All Other Fund Managers
114
313
149
564
© Preqin Ltd. 2017 / www.preqin.com15 Private Equity & Venture Capital Spotlight | January 2017
7. PERFORMANCE2017 PREQIN GLOBAL PRIVATE EQUITY & VENTURE CAPITAL REPORT
- SAMPLE PAGES
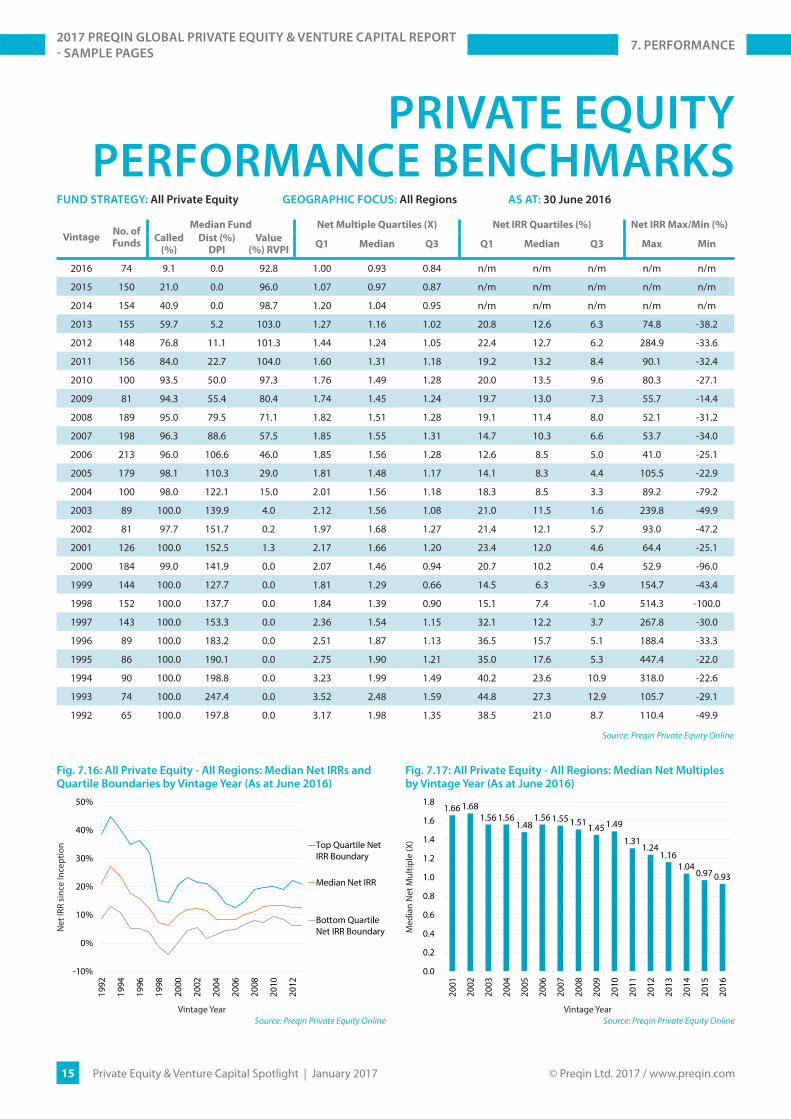
PRIVATE EQUITY PERFORMANCE BENCHMARKS
1.66 1.681.56 1.56
1.481.56 1.55 1.51 1.45 1.49
1.311.24
1.161.04
0.97 0.93
0.0
0.2
0.4
0.6
0.8
1.0
1.2
1.4
1.6
1.8
2001
2002
2003
2004
2005
2006
2007
2008
2009
2010
2011
2012
2013
2014
2015
2016
Source: Preqin Private Equity Online
Med
ian
Net
Mul
tiple
(X)
Vintage Year
Fig. 7.17: All Private Equity - All Regions: Median Net Multiples by Vintage Year (As at June 2016)
-10%
0%
10%
20%
30%
40%
50%
1992
1994
1996
1998
2000
2002
2004
2006
2008
2010
2012
Top Quartile NetIRR Boundary
Median Net IRR
Bottom QuartileNet IRR Boundary
Source: Preqin Private Equity Online
Net
IRR
sinc
e In
cept
ion
Vintage Year
Fig. 7.16: All Private Equity - All Regions: Median Net IRRs and Quartile Boundaries by Vintage Year (As at June 2016)
FUND STRATEGY: All Private Equity GEOGRAPHIC FOCUS: All Regions AS AT: 30 June 2016
VintageNo. of
Funds
Median Fund Net Multiple Quartiles (X) Net IRR Quartiles (%) Net IRR Max/Min (%)
Called
(%)
Dist (%)
DPI
Value
(%) RVPIQ1 Median Q3 Q1 Median Q3 Max Min
2016 74 9.1 0.0 92.8 1.00 0.93 0.84 n/m n/m n/m n/m n/m
2015 150 21.0 0.0 96.0 1.07 0.97 0.87 n/m n/m n/m n/m n/m
2014 154 40.9 0.0 98.7 1.20 1.04 0.95 n/m n/m n/m n/m n/m
2013 155 59.7 5.2 103.0 1.27 1.16 1.02 20.8 12.6 6.3 74.8 -38.2
2012 148 76.8 11.1 101.3 1.44 1.24 1.05 22.4 12.7 6.2 284.9 -33.6
2011 156 84.0 22.7 104.0 1.60 1.31 1.18 19.2 13.2 8.4 90.1 -32.4
2010 100 93.5 50.0 97.3 1.76 1.49 1.28 20.0 13.5 9.6 80.3 -27.1
2009 81 94.3 55.4 80.4 1.74 1.45 1.24 19.7 13.0 7.3 55.7 -14.4
2008 189 95.0 79.5 71.1 1.82 1.51 1.28 19.1 11.4 8.0 52.1 -31.2
2007 198 96.3 88.6 57.5 1.85 1.55 1.31 14.7 10.3 6.6 53.7 -34.0
2006 213 96.0 106.6 46.0 1.85 1.56 1.28 12.6 8.5 5.0 41.0 -25.1
2005 179 98.1 110.3 29.0 1.81 1.48 1.17 14.1 8.3 4.4 105.5 -22.9
2004 100 98.0 122.1 15.0 2.01 1.56 1.18 18.3 8.5 3.3 89.2 -79.2
2003 89 100.0 139.9 4.0 2.12 1.56 1.08 21.0 11.5 1.6 239.8 -49.9
2002 81 97.7 151.7 0.2 1.97 1.68 1.27 21.4 12.1 5.7 93.0 -47.2
2001 126 100.0 152.5 1.3 2.17 1.66 1.20 23.4 12.0 4.6 64.4 -25.1
2000 184 99.0 141.9 0.0 2.07 1.46 0.94 20.7 10.2 0.4 52.9 -96.0
1999 144 100.0 127.7 0.0 1.81 1.29 0.66 14.5 6.3 -3.9 154.7 -43.4
1998 152 100.0 137.7 0.0 1.84 1.39 0.90 15.1 7.4 -1.0 514.3 -100.0
1997 143 100.0 153.3 0.0 2.36 1.54 1.15 32.1 12.2 3.7 267.8 -30.0
1996 89 100.0 183.2 0.0 2.51 1.87 1.13 36.5 15.7 5.1 188.4 -33.3
1995 86 100.0 190.1 0.0 2.75 1.90 1.21 35.0 17.6 5.3 447.4 -22.0
1994 90 100.0 198.8 0.0 3.23 1.99 1.49 40.2 23.6 10.9 318.0 -22.6
1993 74 100.0 247.4 0.0 3.52 2.48 1.59 44.8 27.3 12.9 105.7 -29.1
1992 65 100.0 197.8 0.0 3.17 1.98 1.35 38.5 21.0 8.7 110.4 -49.9
Source: Preqin Private Equity Online
February 14 th 2017 | Grand Hotel Stockholm
Nordic Private Capital Day60+ LPs | 60+ GPs | 50+ CEOs
Thomas von Koch | EQT Partners Allan Polack | PFA PensionDr Marc-Oliver Jauch | Castik CapitalSverre Flåskjer | Herkules CapitalFrederik Cassel | Creandum
Featured Speakers:
Register now online:www.nordicprivatecapitalday.org
Preqin members receive 20% discount on all tickets
(apart from Super Early Bird).
Or contact [email protected] for more information.
One-day event
250 regional & international key players
50 + Speakers
1 Keynote
The best networking opportunity in the region.50+ speakers, 1 Keynote and 250 attendees from PE Funds, Limited Partners,Fund of Funds, VC, CEO of PE-backed companies, start-ups, Business Angels and many more.
Enter code:
NPCD_Preqin at the checkout.
10th Annual
Women’s Private Equity Summit March 8–10, 2017 The Ritz-Carlton, Half Moon Bay, California
Join more than 450 of the top women in private equity and venture capital — GPs, LPs, and
advisors to the industry — as we gather in March in Half Moon Bay for insightful and candid
discussions on fundraising, deal flow, portfolio management, liquidity, and more.
Register Now: WomensPrivateEquitySummit.com | T: + 1 781.652.0900FOUNDER AND PRODUCER:
THE MUST-ATTEND EVENT FOR SENIOR-LEVEL WOMEN IN PRIVATE EQUITY
PLATINUM SPONSORS:
GOLD SPONSORS:
WOMEN’S PRIVATE EQUITYS U M M I T
A Decade of Dealmaking
© Preqin Ltd. 2017 / www.preqin.com17 Private Equity & Venture Capital Spotlight | January 2017
fallen short of expectations over the past year, while only 16% feel that they have exceeded expectations.
There are signs that the continued strong performance of private equity funds may be making investors more ambitious in their return targets: the proportion of investors targeting returns of 4.1% or more above public markets has increased to 49%, up from 37% two years ago (Fig. 8.12). However, the fi gure remains down from the 63% of investors that targeted returns of this level in December 2011.
KEY ISSUES FACING INVESTORS
Going into 2017, valuations remain the greatest concern among institutional investors, cited by 70% of respondents (Fig. 8.13). With high company valuations, record levels of dry powder and stiff competition for assets, investors are increasingly concerned about the impact high pricing will have on returns in the future. The proportion of investors concerned about the exit environment is also signifi cant and has jumped from 24% of investors at the end of 2015 to 51% in 2016.
Investors are also concerned about the pipeline of available portfolio companies: 41% see deal fl ow as a concern, up from 34% at the end of 2015. This may be related to investors’ concerns about valuations, as it is becoming harder for GPs to fi nd assets at attractive prices. Nevertheless, the degree to which investors are concerned about performance has lessened slightly
compared to the end of 2015, from 40% to 33% in 2016, possibly due to strong returns over the past year.
Although there has been a long-running debate between investors and fund managers over the appropriate level and way to charge fund fees, these issues have attracted particular attention recently, with the SEC launching high-profi le
investigations of GPs that are believed to have given insuffi cient disclosure to investors about the fees they charge. This has resulted in many LPs now paying closer attention to their fee arrangements: the proportion of investors citing fees as one of the major issues facing the private equity industry has more than doubled from 19% in 2015 to 39%.
INVESTORS’ INTENTIONS FOR THEIR
PRIVATE EQUITY ALLOCATIONS
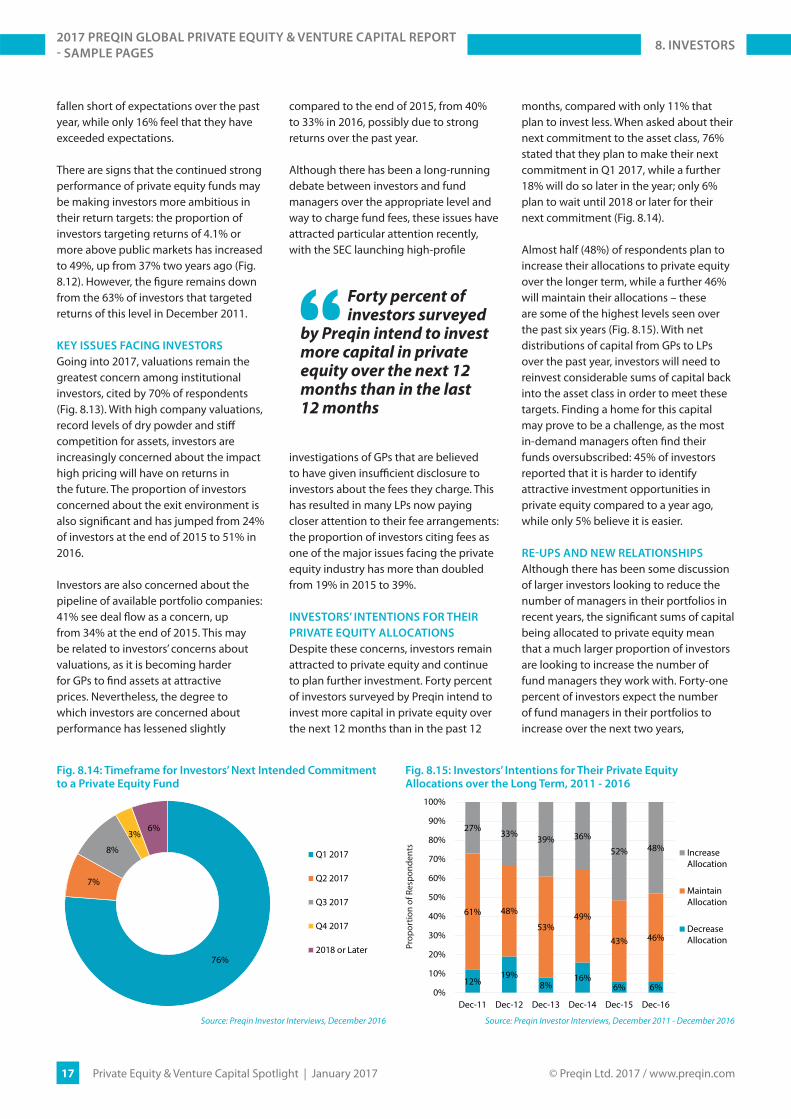
Despite these concerns, investors remain attracted to private equity and continue to plan further investment. Forty percent of investors surveyed by Preqin intend to invest more capital in private equity over the next 12 months than in the past 12
months, compared with only 11% that plan to invest less. When asked about their next commitment to the asset class, 76% stated that they plan to make their next commitment in Q1 2017, while a further 18% will do so later in the year; only 6% plan to wait until 2018 or later for their next commitment (Fig. 8.14).
Almost half (48%) of respondents plan to increase their allocations to private equity over the longer term, while a further 46% will maintain their allocations – these are some of the highest levels seen over the past six years (Fig. 8.15). With net distributions of capital from GPs to LPs over the past year, investors will need to reinvest considerable sums of capital back into the asset class in order to meet these targets. Finding a home for this capital may prove to be a challenge, as the most in-demand managers often fi nd their funds oversubscribed: 45% of investors reported that it is harder to identify attractive investment opportunities in private equity compared to a year ago, while only 5% believe it is easier.
RE-UPS AND NEW RELATIONSHIPS
Although there has been some discussion of larger investors looking to reduce the number of managers in their portfolios in recent years, the signifi cant sums of capital being allocated to private equity mean that a much larger proportion of investors are looking to increase the number of fund managers they work with. Forty-one percent of investors expect the number of fund managers in their portfolios to increase over the next two years,
Forty percent of investors surveyed
by Preqin intend to invest more capital in private equity over the next 12 months than in the last 12 months
76%
7%
8%
3%6%
Q1 2017
Q2 2017
Q3 2017
Q4 2017
2018 or Later
Source: Preqin Investor Interviews, December 2016
Fig. 8.14: Timeframe for Investors’ Next Intended Commitment to a Private Equity Fund
12%19%
8%16%
6% 6%
61% 48%
53%49%
43% 46%
27%33%
39% 36%
52% 48%
0%
10%
20%
30%
40%
50%
60%
70%
80%
90%
100%
Dec-11 Dec-12 Dec-13 Dec-14 Dec-15 Dec-16
IncreaseAllocation
MaintainAllocation
DecreaseAllocation
Source: Preqin Investor Interviews, December 2011 - December 2016
Prop
ortio
n of
Res
pond
ents
Fig. 8.15: Investors’ Intentions for Their Private Equity Allocations over the Long Term, 2011 - 2016
8. INVESTORS2017 PREQIN GLOBAL PRIVATE EQUITY & VENTURE CAPITAL REPORT
- SAMPLE PAGES

© Preqin Ltd. 2017 / www.preqin.com18 Private Equity & Venture Capital Spotlight | January 2017
LARGEST BUYOUT DEALS AND EXITSFig. 11.41: 10 Largest Private Equity-Backed Buyout Deals in 2016
Portfolio CompanyInvestment
Type
Deal
Date
Deal Size
(mn)Deal Status Investor(s)
Bought from/
Exiting CompanyLocation Industry
ADT Security Services, Inc.
Merger Feb-16 15,000 USD CompletedApollo Global Management, Koch Equity
Development LLC, Protection 1 / ASG Security**
- US Electronics
Supercell Oy Buyout Jun-16 8,600 USD Announced
AVIC Capital, CITIC Capital, Pagoda Investment, Shanghai Pudong
Development Bank, Sino-Rock Investment Management, Tencent**, Zheng Hong
Capital
Softbank Capital Finland Gaming
MultiPlan, Inc. Buyout May-16 7,500 USD CompletedGIC, Hellman & Friedman, Leonard Green
& Partners
Ardian, Partners Group, Starr
Investment HoldingsUS Healthcare IT
Team Health Holdings, Inc
Public-to-Private
Oct-16 6,100 USD Announced Blackstone Group - US Healthcare
Cabela's Inc Add-on Oct-16 5,500 USD AnnouncedBass Pro Shops**, Goldman Sachs Merchant
Banking Division, Pamplona Capital Management
- US Retail
Playtika Ltd Buyout Jul-16 4,400 USD AnnouncedCDH Investments, China Minsheng Trust, China Oceanwide Holdings Group, Giant
Interactive Group, Hony Capital, YF Capital
Caesars Entertainment
CorporationIsrael Gaming
Rackspace Hosting, Inc.
Public-to-Private
Aug-16 4,300 USD CompletedApollo Global Management**, Searchlight
Capital Partners- US IT
Ultimate Fighting Championship Ltd
Buyout Jul-16 4,000 USD AnnouncedKKR, MSD Capital, Silver Lake, William Morris Endeavor Entertainment, LLC**
- US Media
Vertiv Buyout Aug-16 4,000 USD Completed Platinum Equity** Emerson USIT
Infrastructure
Air Products' Performance Materials Operations
Add-on May-16 3,800 USD AnnouncedCVC Capital Partners, Evonik Industries
AG**Air Products &
ChemicalsUS Chemicals
Source: Preqin Private Equity Online
Fig. 11.42: 10 Largest Private Equity-Backed Buyout Exits in 2016
Portfolio
Company
Investment
Date
Investment
Type
Deal Size
(mn)Investor(s)
Exit
DateExit Type
Exit Value
(mn)Acquiror (Exit) Location Industry
MultiPlan, Inc.*
Feb-14 Buyout 4,400 USDArdian, Partners Group**, Starr
Investment Holdings**May-16 Sale to GP 7,500 USD
GIC, Hellman & Friedman, Leonard Green & Partners
US Healthcare IT
Hilton Worldwide*
Jul-07Public-to-
Private26,000 USD Blackstone Group** Oct-16 Trade Sale 6,500 USD HNA Group** US Leisure
Quirónsalud Jan-11 Buyout 900 EUR CVC Capital Partners** Sep-16 Trade Sale 5,760 EURFresenius Medical
Care AG**Spain Healthcare
Capsugel Apr-11 Buyout 2,375 USD KKR** Dec-16 Trade Sale 5,500 USD Lonza Group Ltd** US Pharmaceuticals
Blue Coat Systems, Inc.
Mar-15 Buyout 2,400 USD Bain Capital** Jun-16 Trade Sale 4,650 USD Symantec Corp** US IT Security
The Sun Products Corporation
Jul-08 Buyout 2,600 USD Vestar Capital Partners Jun-16 Trade Sale 3,600 USD Henkel AG** US Consumer Products
Epicor Software
Apr-11Public-to-
Private976 USD Apax Partners** Jul-16 Sale to GP 3,300 USD KKR** US Software
Metaldyne Performance Group Inc.
Aug-14 Merger -
American Securities, Grede Holdings LLC**, Hephaestus Holdings
Inc.**, Metaldyne**
Nov-16 Merger 3,300 USDAmerican Axle & Manufacturing**
US Manufacturing
Vogue International
Jan-14 Buyout - Carlyle Group** Jun-16 Trade Sale 3,300 USDJohnson & Johnson**
US Manufacturing
BATS Global Markets, Inc.
Aug-13 Buyout -Spectrum Equity, TA
AssociatesSep-16 Trade Sale 3,200 USD
CBOE Holdings, Inc.**
US Financial Services
*Denotes a partial exit.**Indicates lead investor(s)/acquiror(s).
Source: Preqin Private Equity Online
11. BUYOUT2017 PREQIN GLOBAL PRIVATE EQUITY & VENTURE CAPITAL REPORT
- SAMPLE PAGES
© Preqin Ltd. 2017 / www.preqin.com19 Private Equity & Venture Capital Spotlight | January 2017
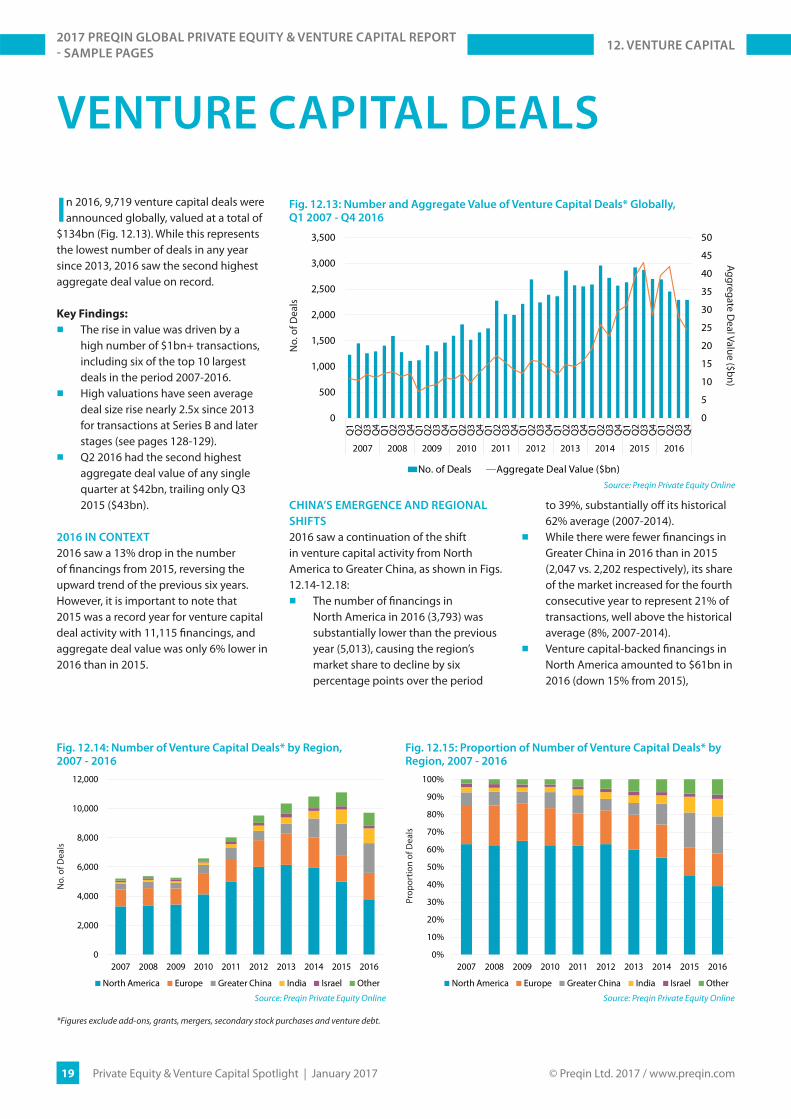
VENTURE CAPITAL DEALS
In 2016, 9,719 venture capital deals were announced globally, valued at a total of
$134bn (Fig. 12.13). While this represents the lowest number of deals in any year since 2013, 2016 saw the second highest aggregate deal value on record.
Key Findings:
■ The rise in value was driven by a high number of $1bn+ transactions, including six of the top 10 largest deals in the period 2007-2016.
■ High valuations have seen average deal size rise nearly 2.5x since 2013 for transactions at Series B and later stages (see pages 128-129).
■ Q2 2016 had the second highest aggregate deal value of any single quarter at $42bn, trailing only Q3 2015 ($43bn).
2016 IN CONTEXT
2016 saw a 13% drop in the number of fi nancings from 2015, reversing the upward trend of the previous six years. However, it is important to note that 2015 was a record year for venture capital deal activity with 11,115 fi nancings, and aggregate deal value was only 6% lower in 2016 than in 2015.
CHINA’S EMERGENCE AND REGIONAL
SHIFTS
2016 saw a continuation of the shift in venture capital activity from North America to Greater China, as shown in Figs. 12.14-12.18:
■ The number of fi nancings in North America in 2016 (3,793) was substantially lower than the previous year (5,013), causing the region’s market share to decline by six percentage points over the period
to 39%, substantially off its historical 62% average (2007-2014).
■ While there were fewer fi nancings in Greater China in 2016 than in 2015 (2,047 vs. 2,202 respectively), its share of the market increased for the fourth consecutive year to represent 21% of transactions, well above the historical average (8%, 2007-2014).
■ Venture capital-backed fi nancings in North America amounted to $61bn in 2016 (down 15% from 2015),
0
5
10
15
20
25
30
35
40
45
50
0
500
1,000
1,500
2,000
2,500
3,000
3,500
Q1
Q2
Q3
Q4
Q1
Q2
Q3
Q4
Q1
Q2
Q3
Q4
Q1
Q2
Q3
Q4
Q1
Q2
Q3
Q4
Q1
Q2
Q3
Q4
Q1
Q2
Q3
Q4
Q1
Q2
Q3
Q4
Q1
Q2
Q3
Q4
Q1
Q2
Q3
Q4
2007 2008 2009 2010 2011 2012 2013 2014 2015 2016
No. of Deals Aggregate Deal Value ($bn)Source: Preqin Private Equity Online
No.
of D
eals
Aggregate Deal Value ($bn)
Fig. 12.13: Number and Aggregate Value of Venture Capital Deals* Globally, Q1 2007 - Q4 2016
0
2,000
4,000
6,000
8,000
10,000
12,000
2007 2008 2009 2010 2011 2012 2013 2014 2015 2016
North America Europe Greater China India Israel Other
Source: Preqin Private Equity Online
No.
of D
eals
Fig. 12.14: Number of Venture Capital Deals* by Region, 2007 - 2016
0%
10%
20%
30%
40%
50%
60%
70%
80%
90%
100%
2007 2008 2009 2010 2011 2012 2013 2014 2015 2016
North America Europe Greater China India Israel Other
Source: Preqin Private Equity Online
Prop
ortio
n of
Dea
ls
Fig. 12.15: Proportion of Number of Venture Capital Deals* by Region, 2007 - 2016
*Figures exclude add-ons, grants, mergers, secondary stock purchases and venture debt.
12. VENTURE CAPITAL2017 PREQIN GLOBAL PRIVATE EQUITY & VENTURE CAPITAL REPORT
- SAMPLE PAGES

The 2017 Preqin Global Alternatives Reports are the most detailed and comprehensive reviews of the alternative assets industry available, off ering exclusive insight into the latest developments in the private equity, hedge fund, real estate and infrastructure asset classes.
■ Access in-depth analysis and comprehensive statistics, helping you to understand the latest trends in fundraising, performance, investors, deals, fund managers, secondaries, fund terms, placement agents, consultants, law fi rms and much more.
■ View historical data alongside the most important industry developments. Read contributions from some of the industry’s leading fi gures.
■ Improve your presentations, marketing materials and company reports. ■ Discover the most important players in every area of the industry. ■ Answer key questions: Who is investing? How much has been raised? Where are the centres of
activity? Where is the capital going? What are the biggest deals? What is the outlook for the industry?
2017 PREQIN GLOBAL ALTERNATIVES REPORTS
alternative assets. intelligent data.
For more information visit: www.preqin.com/reports
PAYMENT DETAILS: SHIPPING DETAILS:
Cheque enclosed (cheque payable to ‘Preqin’) Name:________________________________
Telephone:________________________________
Charge my: Visa Firm:________________________________
Email:________________________________
Mastercard Job Title:________________________________
Amex Address:________________________________
Please invoice me________________________________
________________________________
Card Number:________________________________
City:________________________________
Name on Card:________________________________
State:________________________________
Expiration Date:________________________________
Post/Zip:________________________________
Security Code:________________________________
Country:________________________________
COMPLETED ORDER FORMS
Post (to Preqin):
NEW YORKOne Grand Central Place60 E 42nd StreetSuite 630New YorkNY 10165Tel: +1 212 350 0100Fax: +1 440 445 9595
LONDON3rd FloorVintners’ Place68 Upper Thames StreetLondonEC4V 3BJTel: +44 (0)20 3207 0200Fax: +44 (0)870 330 589
SINGAPOREOne Finlayson Green#11-02Singapore049246
Tel: +65 6305 2200Fax: +65 6491 5365
SAN FRANCISCOOne Embarcadero CenterSuite 2850San FranciscoCA 94111
Tel: +1 415 316 0580 Fax: +1 440 445 9595
HONG KONGLevel 9, Central Building1-3 Pedder StreetCentral, Hong Kong
Tel: +852 3958 2819 Fax: +852 3975 2800
MANILAPascor DriveSto. NiñoParanaque CityMetro Manila 1700Philippines
American Express, four-digit code printed on the front of the card.
Visa and Mastercard, last three digits printed on the signature strip.
I would like to purchase:
PRINTName First Copy Each Additional Copy Quantity Data Pack* Private Equity & Venture Capital $175/£125/€150 $90/£65/€75 $300/£215/€260
Hedge Funds $175/£125/€150 $90/£65/€75 $300/£215/€260
Real Estate $175/£125/€150 $90/£65/€75 $300/£215/€260
Infrastructure $175/£125/€150 $90/£65/€75 $300/£215/€260
All Four Titles (25% Saving!) $525/£375/€450 $265/£190/€225 $900/£645/€770
Shipping Costs: $40/£10/€25 for single publication $20/£5/€12 for additional copies
(Shipping costs will not exceed a maximum of $60/£15/€37 per order when all shipped to same address. If shipped to multiple addresses then full postage rates apply for additional copies.)
If you would like to order more than 10 copies of one title, please contact us for a special rate
DIGITALName Single-User Licence Each Additional Copy Quantity Enterprise Licence** Data Pack* Private Equity & Venture Capital $175/£125/€150 $90/£65/€75 $1,000/£715/€860 $300/£215/€260
Hedge Funds $175/£125/€150 $90/£65/€75 $1,000/£715/€860 $300/£215/€260
Real Estate $175/£125/€150 $90/£65/€75 $1,000/£715/€860 $300/£215/€260
Infrastructure $175/£125/€150 $90/£65/€75 $1,000/£715/€860 $300/£215/€260
All Four Titles (25% Saving!) $525/£375/€450 $265/£190/€225 $3,000/£2,145/€2,500 $900/£645/€770
*Data packs feature all the chart and league table data in an Excel fi le. Must be purchased alongside the associated report.**Enterprise Licence allows for fi rm-wide digital access.Please note all prices quoted throughout are exclusive of sales taxes.
2017PREQIN GLOBALINFRASTRUCTUREREPORT
alternative assets. intelligent data.
ISBN: 978-1-907012-87-7$175 / £105 / €150www.preqin.com
2017PREQIN GLOBALHEDGE FUNDREPORT
alternative assets. intelligent data.
ISBN: 978-1-907012-87-7$175 / £105 / €150www.preqin.com
2017PREQIN GLOBALREAL ESTATEREPORT
alternative assets. intelligent data.
ISBN: 978-1-907012-87-7$175 / £105 / €150www.preqin.com
2017PREQIN GLOBALPRIVATE EQUITY & VENTURE CAPITALREPORT
alternative assets. intelligent data.
ISBN: 978-1-907012-87-7$175 / £105 / €150www.preqin.com
© Preqin Ltd. 2017 / www.preqin.com21 Private Equity & Venture Capital Spotlight | January 2017
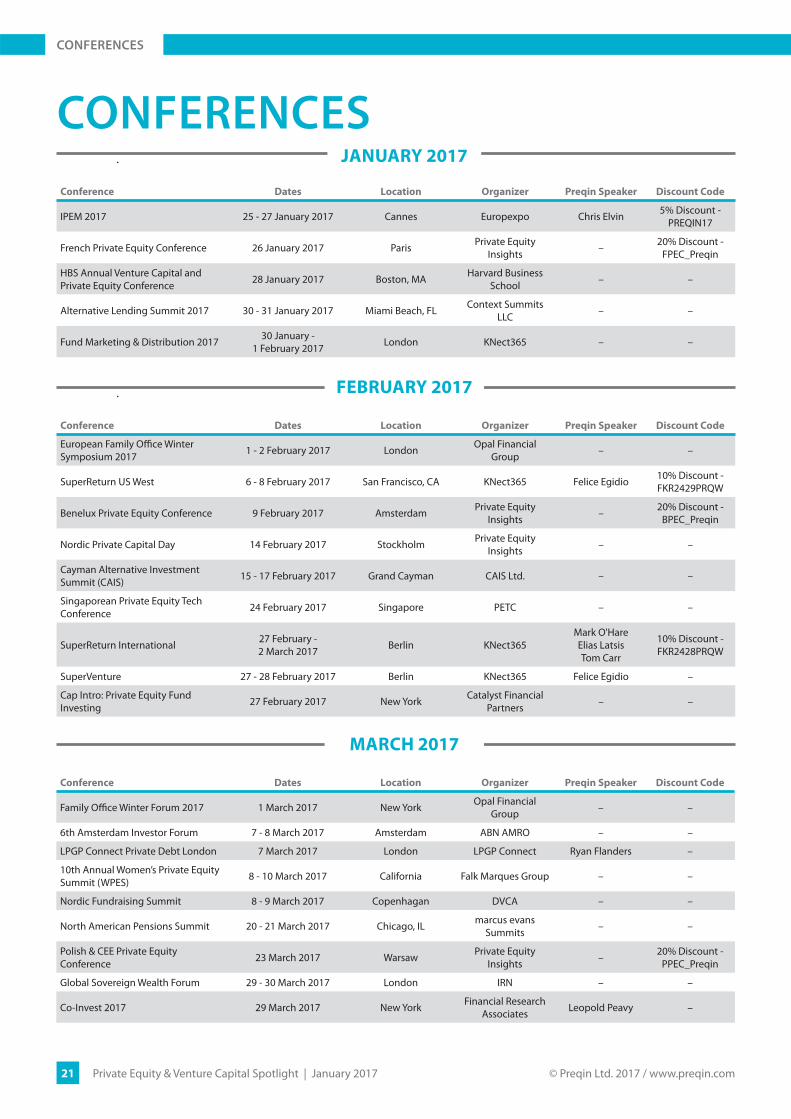
CONFERENCESJANUARY 2017
Conference Dates Location Organizer Preqin Speaker Discount Code
IPEM 2017 25 - 27 January 2017 Cannes Europexpo Chris Elvin 5% Discount - PREQIN17
French Private Equity Conference 26 January 2017 Paris Private Equity Insights – 20% Discount -
FPEC_Preqin
HBS Annual Venture Capital and Private Equity Conference 28 January 2017 Boston, MA Harvard Business
School – –
Alternative Lending Summit 2017 30 - 31 January 2017 Miami Beach, FL Context Summits LLC – –
Fund Marketing & Distribution 2017 30 January - 1 February 2017 London KNect365 – –
MARCH 2017
Conference Dates Location Organizer Preqin Speaker Discount Code
Family Offi ce Winter Forum 2017 1 March 2017 New York Opal Financial Group – –
6th Amsterdam Investor Forum 7 - 8 March 2017 Amsterdam ABN AMRO – –
LPGP Connect Private Debt London 7 March 2017 London LPGP Connect Ryan Flanders –
10th Annual Women’s Private Equity Summit (WPES) 8 - 10 March 2017 California Falk Marques Group – –
Nordic Fundraising Summit 8 - 9 March 2017 Copenhagan DVCA – –
North American Pensions Summit 20 - 21 March 2017 Chicago, IL marcus evans Summits – –
Polish & CEE Private Equity Conference 23 March 2017 Warsaw Private Equity
Insights – 20% Discount - PPEC_Preqin
Global Sovereign Wealth Forum 29 - 30 March 2017 London IRN – –
Co-Invest 2017 29 March 2017 New York Financial Research Associates Leopold Peavy –
Conference Dates Location Organizer Preqin Speaker Discount Code
European Family Offi ce Winter Symposium 2017 1 - 2 February 2017 London Opal Financial
Group – –
SuperReturn US West 6 - 8 February 2017 San Francisco, CA KNect365 Felice Egidio 10% Discount - FKR2429PRQW
Benelux Private Equity Conference 9 February 2017 Amsterdam Private Equity Insights – 20% Discount -
BPEC_Preqin
Nordic Private Capital Day 14 February 2017 Stockholm Private Equity Insights – –
Cayman Alternative Investment Summit (CAIS) 15 - 17 February 2017 Grand Cayman CAIS Ltd. – –
Singaporean Private Equity Tech Conference 24 February 2017 Singapore PETC – –
SuperReturn International 27 February - 2 March 2017 Berlin KNect365
Mark O'HareElias LatsisTom Carr
10% Discount - FKR2428PRQW
SuperVenture 27 - 28 February 2017 Berlin KNect365 Felice Egidio –
Cap Intro: Private Equity Fund Investing 27 February 2017 New York Catalyst Financial
Partners – –
FEBRUARY 2017
CONFERENCES

© Preqin Ltd. 2017 / www.preqin.com22 Private Equity & Venture Capital Spotlight | January 2017
DATE: 1 - 2 February 2017
INFORMATION: www.opalgroup.net/trk/eff owb1705.html
LOCATION: One Great George Street, London
ORGANIZER: Opal Group
As a part of our Private Wealth Series, this conference will be attended by high net-worth individuals, family offi ces, and invest-ment industry professionals from around the world. Our mission is to provide an intimate setting for the free exchange of ideas along with purposeful connections. The European Family Offi ce Winter Symposium will include a blend of educational discus-sion panels, workshops, presentations, and pre-arranged one-to-one meetings.
EUROPEAN FAMILY OFFICE WINTER SYMPOSIUM
DATE: 14 February 2017
INFORMATION: http://nordicprivatecapitalday.org/
LOCATION: Stockholm
ORGANIZER: Private Equity Insights Ltd
The Nordic Private Capital Day is a one-day event in Stockholm with inspirational keynote speakers, enriching panel discussions, and valuable networking opportunities. We gather 50+ speakers and 250 attendees from across the PE ecosystem. With over 60 LPs, 70 GPs and 50 CEOs, NPCD is the place to be on 14th February 2017.
NORDIC PRIVATE CAPITAL DAY
DATE: 27 February - 2 March 2017
INFORMATION: https://fi nance.knect365.com/superreturn-international/purchase/select-package/vip/FKR2428PRQSP
LOCATION: Pullman InterContinental Hotel, Berlin
ORGANIZER: KNect365
450+ LPs. 2000+ attendees. 400+ speakers. Countless opportunities. Create new contacts. Meet the key fi gures in private equity in one place at one time. 2000+ senior decision-makers will be fl ying in from 50+ countries.You won’t get another chance like this in 2017.
SUPERRETURN INTERNATIONAL 2017
DATE: 27 - 28 February 2017
INFORMATION: https://fi nance.knect365.com/superventure/purchase/select-package/vip/FKR2436PRQSP
LOCATION: Pullman Berlin Schweizerhof, Berlin
ORGANIZER: KNect365
Driving innovation. Developing opportunity. SuperVenture is co-located with SuperReturn International. This means that if you register for SuperVenture, you can attend whichever parts of day one of SuperReturn International you want. And have the opportunity to meet the 450+ LPs attending both events.
SUPERVENTURE 2017
CONFERENCES
© Preqin Ltd. 2017 / www.preqin.com23 Private Equity & Venture Capital Spotlight | January 2017
DATE: 8 - 9 March 2017
INFORMATION: www.nordicfundraisingsummit.com
LOCATION: Copenhagen, Denmark
ORGANIZER: DVCA - Danish Venture Capital and Private Equity Association
The Nordic Fundraising Summit is a speed-dating event that provides matchmaking between LPs and GPs in private equity. This event gives you the opportunity to meet up to 40 LPs and 50 GPs over the two-day event on March 8th and 9th 2017 in Copen-hagen, Denmark.
NORDIC FUNDRAISING SUMMIT
DATE: 20 - 21 March 2017
INFORMATION: http://events.marcusevans-events.com/nap-h1-17/
LOCATION: The Drake Hotel, Chicago
ORGANIZER: marcus evans
The North American Pensions Summit is the premium forum bringing elite buyers and sellers together. As an invitation-only event, taking place behind closed doors, the Summit off ers senior investment executives and service providers an intimate envi-ronment for a focused discussion of key new drivers shaping asset allocations.
NORTH AMERICAN PENSIONS
DATE: 8 - 10 March 2017
INFORMATION: http://www.womensprivateequitysummit.com/
LOCATION: The Ritz-Carlton, Half Moon Bay, California
ORGANIZER: Falk Marques Group
The 10th Annual Women’s Private Equity Summit. Every year over 450 of the world’s leading women in private equity and venture capital gather for insightful and candid discussions on fundraising, deal fl ow, portfolio management, liquidity, and more.
10TH ANNUAL WOMEN’S PRIVATE EQUITY SUMMIT (WPES)
CONFERENCES