Embed Size (px)
Citation preview

1
IDAX 300Insulation Diagnostic Analyzer
Dielectric Frequency ResponseAlso known as:
Frequency Domain Spectroscopy

2
Frequency Domain Spectroscopy
V
A
Hi
Lo
Ground CHL
CL
CH
I
UZ
and
PF tand,,C Z
Measure at several frequencies
Use Ohms law:

3
Capacitance and Dissipation Factor (Tan )
= Z (Impedance)
= Tan Loss tangent)
= Power Factor (cos or )
= C (Capacitance) j
Note: If cos and Tan small then cos =Tan
If Tan is 1*10-3 (0.001) then Iloss/I is 1/1000 which is equivalent to Iloss will be1m
and I 1000m, 1m / 1000m. Specification of instrument is 1*10-4 (1/10000).
ICAP @ 10nF, 200V and 50Hz ICAP = 2*Pi*f*U*C = 0.63mA
ICAP @ 1nF, 200V and 1Hz ICAP = 2*Pi*f*U*C = 1.26uA

4
IDAX Set-ups
IDA 200
Hi
Lo
Ground
A1
A2
V CX
Cs1
Cs2
UST - without Guard

5
IDAX Set-ups
IDA 200
Hi
Lo
Ground
A1
A2
V CX
Cs1
Cs2
UST - with Guard

6
IDAX Set-ups
IDA 200
Hi
Lo
Ground
A1
A2
V CX
Cs1
Cs2
GST - without Guard

7
IDAX Set-ups
IDA 200
Hi
Lo
Ground
A1
A2
V CX
Cs1
Cs2
GST - with Guard
8
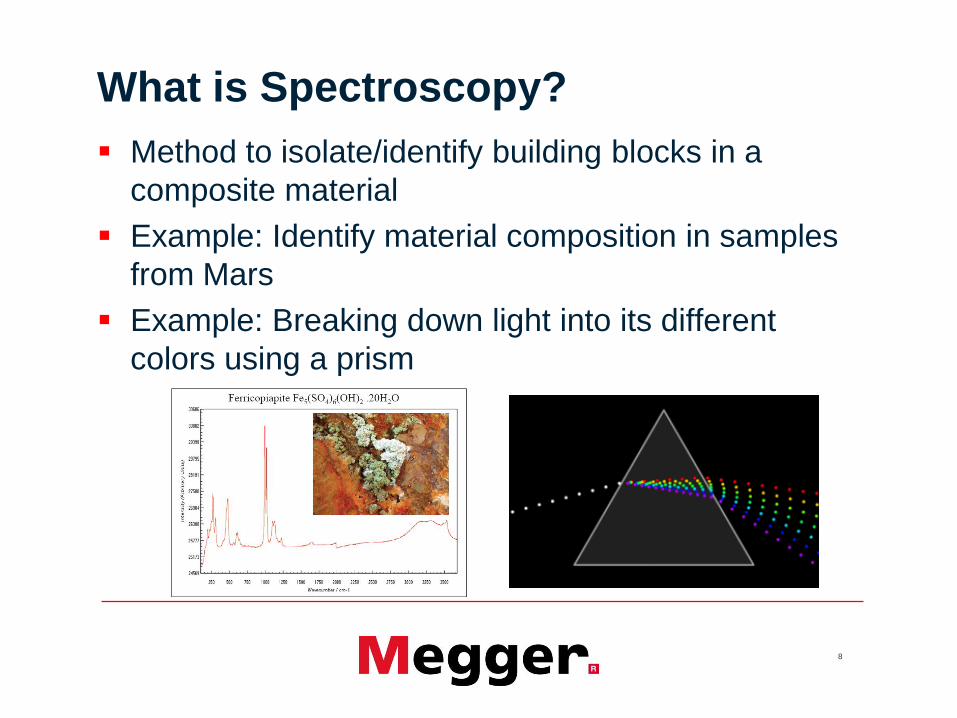
What is Spectroscopy?
Method to isolate/identify building blocks in a
composite material
Example: Identify material composition in samples
from Mars
Example: Breaking down light into its different
colors using a prism

9
Insulation testing/Dielectric response methods
Frequency, Hz0
1
2
3
4
5
6
7
0,000001 0,00001 0,0001 0,001 0,01 0,1 1 10 100 1000
FDS/DFR
HV Tan Delta
VLF
PDC
Polarization Index
"DC"

10
Dielectric Frequency Response - Power Factor Changes with Frequency
Frequency
Power factor 0.32 at 0.02 Hz
0.0031 at 60 Hz
11
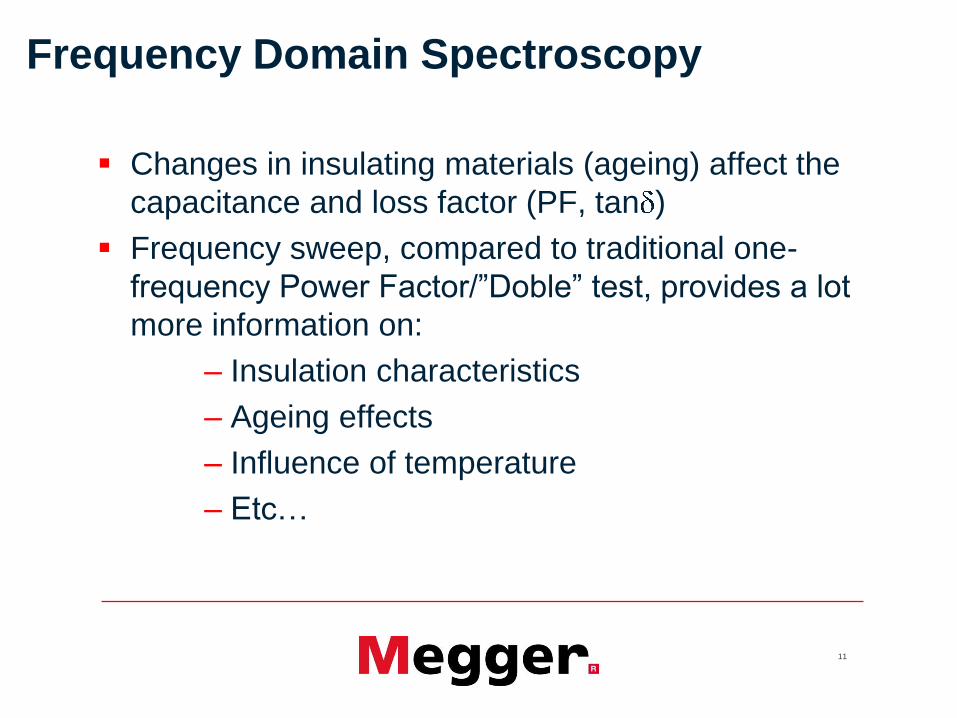
Frequency Domain Spectroscopy
Changes in insulating materials (ageing) affect the
capacitance and loss factor (PF, tan )
Frequency sweep, compared to traditional one-
frequency Power Factor/”Doble” test, provides a lot
more information on:
– Insulation characteristics
– Ageing effects
– Influence of temperature
– Etc…

12
Traditional Power Factor Testing
Dissipation
factor
Frequency
50 Hz1 mHz 1kHz
13
Dielectric Frequency Response
Dissipation
factor
Frequency
50 Hz1 mHz 1kHz

14
What affects the response?
- Oil Conductivity +
-M
ois
ture
+
-M
ois
ture
+
- Temperature +

15
Typical power factor values for oil
insulated transformers and bushings
IEEE 62-1995 states; “The power factors recorded for routine overall tests on
older apparatus provide information regarding the general condition of the
ground and inter-winding insulation of transformers and reactors. While the
power factors for most older transformers will also be <0.5% (20C), power
factors between 0.5% and 1.0% (20C) may be acceptable; however, power
factors >1.0% (20C) should be investigated.”
Typical power factor values @ 20 C
"New" "Old" Warning/alert limit
Power transformers,
oil insulated0.2-0.4% 0.3-0.5% > 0.5%
Bushings 0.2-0.3% 0.3-0.5% > 0.5%

16
Dielectric Frequency Response- Single tan delta value @ 0.7% is not enough to make the right decision
- Dielectric Frequency Response tells the story!
Wet transformer with good oil
Dry transformer with old
oil (high conductivity)
Same PF value at 60Hz

17
DFR Application Areas
Power transformers
Instrument transformers
Bushings
Motors and generators
Cables
Generic testing of insulation systems

19
Why measure moisture?
A transformer with low moisture content is
like a person in good condition
• A transformer can be loaded with confidence without
risk for catastrophic failure.
• A person can work hard without risk for heart attack
A wet transformer is like an overweight
person with clogged arteries.
• The transformer owner has to limit load to avoid
bubbling (explosion risk).
• Moisture in insulation increases the rate of aging

20
Moisture in Power Transformers
Power transformer insulation consists of oil impregnated cellulose and free oil. Almost all moisture is in the cellulose:
• 25 tons of oil with water content of 20 ppm = 0,5 kg
• 2.5 tons of cellulose with 3% water content = 75 kg

21
Water In Oil Analysis
Power transformer insulation consists of oil impregnated cellulose and free oil. Almost all water is in the cellulose:• 25 tons of oil with water content of 20 ppm = 0,5 kg
• 2.5 tons of cellulose with 3% water content = 75 kg
20ppm (parts per million) in 25 tons of oil
3% water in 2.5 tons of cellulose

22
Moisture in Power Transformers
Power transformer insulation consists of oil impregnated cellulose and free oil. Almost all moisture is in the cellulose: 25 tons of oil with water content of 20 ppm = 0,5 kg
2.5 tons of cellulose with 3% water content = 75 kg
Moisture content in oil (it is almost constant in the cellulose) varies with temperature and oil aging status: Aged oil resolves higher amounts of water than new oil
Small moisture concentration makes sampling difficult

23
Water In Oil Analysis
Oil samples taken at low temperatures have low accuracy because the water has migrated to the paper
Oil sample taken at 200C
4.0% water = 6 ppm
1.0 % water = 3 ppm

24
Moisture in Power Transformers
Power transformer insulation consists of oil impregnated cellulose and free oil. Almost all moisture is in the cellulose: 25 tons of oil with water content of 20 ppm = 0,5 kg
2.5 tons of cellulose with 3% water content = 75 kg
Moisture content in oil (it is almost constant in the cellulose) varies with temperature and oil aging status:
Aged oil resolves higher amounts of water than new oil
Small moisture concentration makes sampling difficult
Moisture changes the dielectric properties of the cellulose paper/pressboard

25
Water Changes Paper
Water changes the insulation properties of the paper
Relative permittivity
26
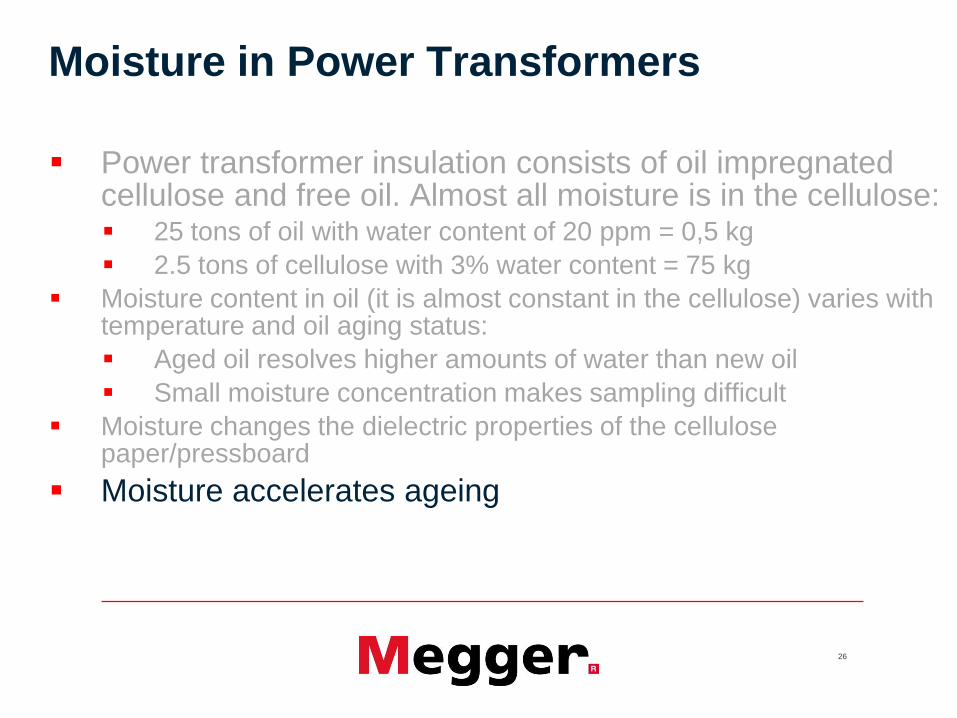
Moisture in Power Transformers
Power transformer insulation consists of oil impregnated cellulose and free oil. Almost all moisture is in the cellulose: 25 tons of oil with water content of 20 ppm = 0,5 kg
2.5 tons of cellulose with 3% water content = 75 kg
Moisture content in oil (it is almost constant in the cellulose) varies with temperature and oil aging status:
Aged oil resolves higher amounts of water than new oil
Small moisture concentration makes sampling difficult
Moisture changes the dielectric properties of the cellulose paper/pressboard
Moisture accelerates ageing

27
Moisture in Power Transformers
Moisture accelerates ageing
Dry (0.5%) insulation @ 900C = 40 Years
Medium wet (2.0%) insulation @ 900C = 4-5Years

28
Moisture in Power Transformers
Power transformer insulation consists of oil impregnated cellulose and free oil. Almost all moisture is in the cellulose: 25 tons of oil with water content of 20 ppm = 0,5 kg
2.5 tons of cellulose with 3% water content = 75 kg
Moisture content in oil (it is almost constant in the cellulose) varies with temperature and oil aging status:
Aged oil resolves higher amounts of water than new oil
Small moisture concentration makes sampling difficult
Moisture changes the dielectric properties of the cellulose paper/pressboard
Moisture accelerates ageing
Moisture limits loading capability
29
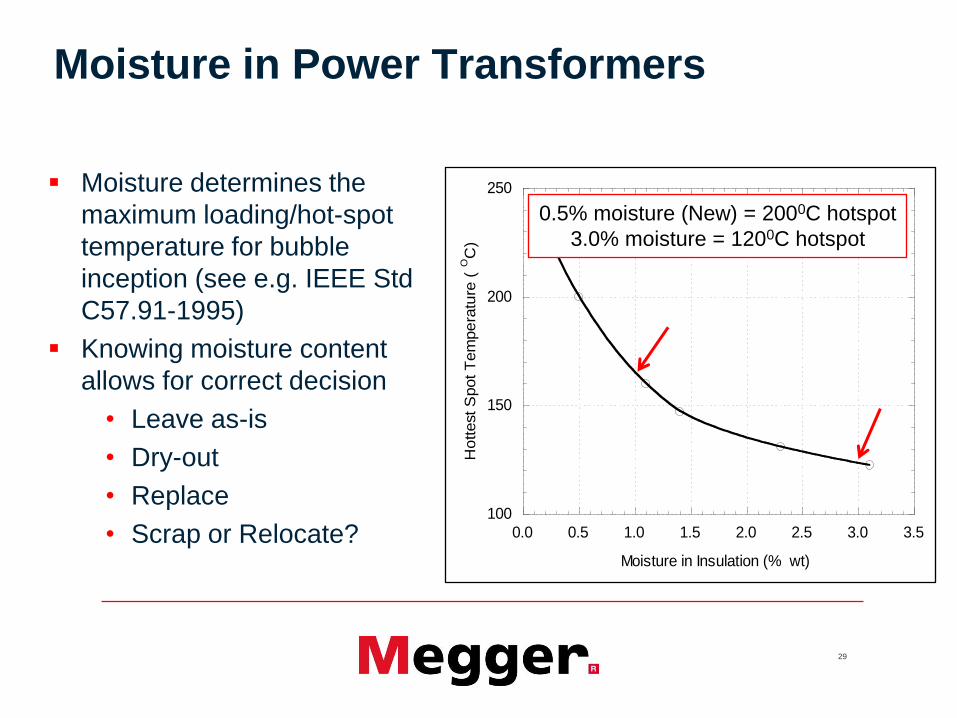
Moisture in Power Transformers
Moisture determines the
maximum loading/hot-spot
temperature for bubble
inception (see e.g. IEEE Std
C57.91-1995)
Knowing moisture content
allows for correct decision
• Leave as-is
• Dry-out
• Replace
• Scrap or Relocate?100
150
200
250
0.0 0.5 1.0 1.5 2.0 2.5 3.0 3.5
Hottest S
pot T
em
pera
ture
(OC
)
Moisture in Insulation (% wt)
0.5% moisture (New) = 2000C hotspot
3.0% moisture = 1200C hotspot

30
Interpretation of moisture content
< 0.5 % New transformer
0.5 - 1.5% Dry insulation
1.5 - 2.5% Medium wet insulation
2.5 - 4% Wet insulation
> 4% Very wet insulation
Interpretation of moisture content of solid insulation (% of
weight water per weight cellulose):

31
Moisture levels
1.0 %
4.2 %
2.6 %
?

32
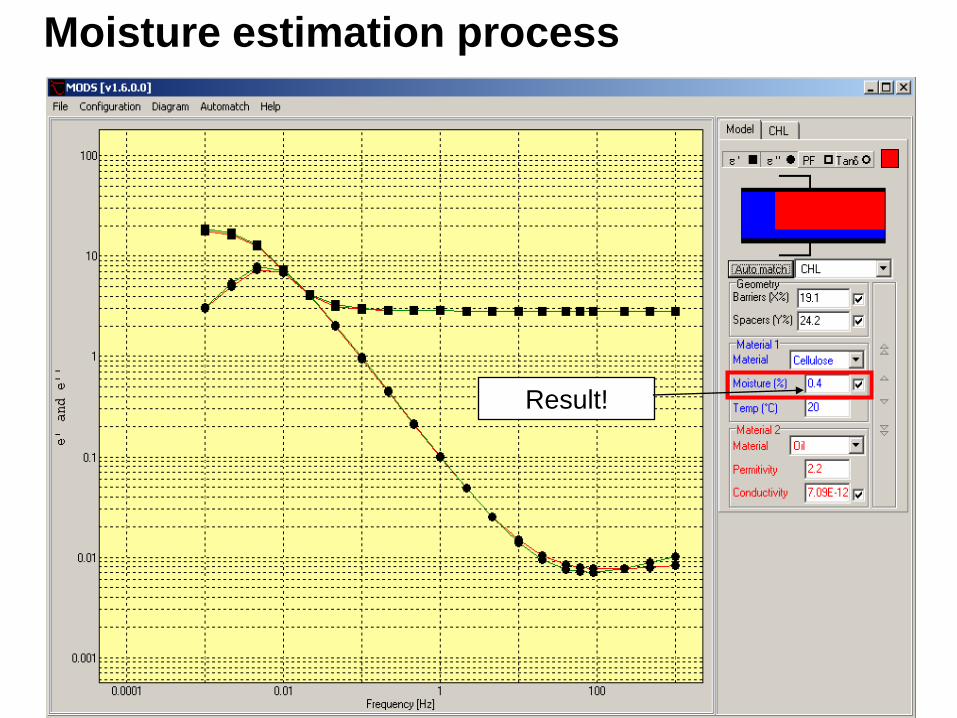
Moisture estimation process
Measure tan delta/power factor from 1 kHz to 2 mHz
Send results to MODS
Enter insulation temperature (top-oil temperature)
MODS matches measured curve to modeled curve
(automatically) by varying parameters that affects
the shape of curve to find best match
Results:
• Relation of solid (cellulose) vs. liquid (oil) insulation
between winding (if not known)
• Moisture in solid insulation
• Oil conductivity

33
X-Y model of power transformer insulation
Typical values:X = % barriers in the main duct (15-55%)Y= % spacers of the circumference (15-25%)
Cellulose: Blue colorOil: Red color

34
Oil – paper – and combination

35
Measured
curve
Moisture estimation process
Right click
Select
Send to…MODS

36
Measured
curve
Moisture estimation process
% SpacersAmount of oil
Model curve
% Barriers

37
Moisture estimation process
2. Enter
temperature
1. Check all
checkboxes
3. Click
Auto match
38
Moisture estimation process
Result!

39
Why a Sense lead? Ideal situation
40
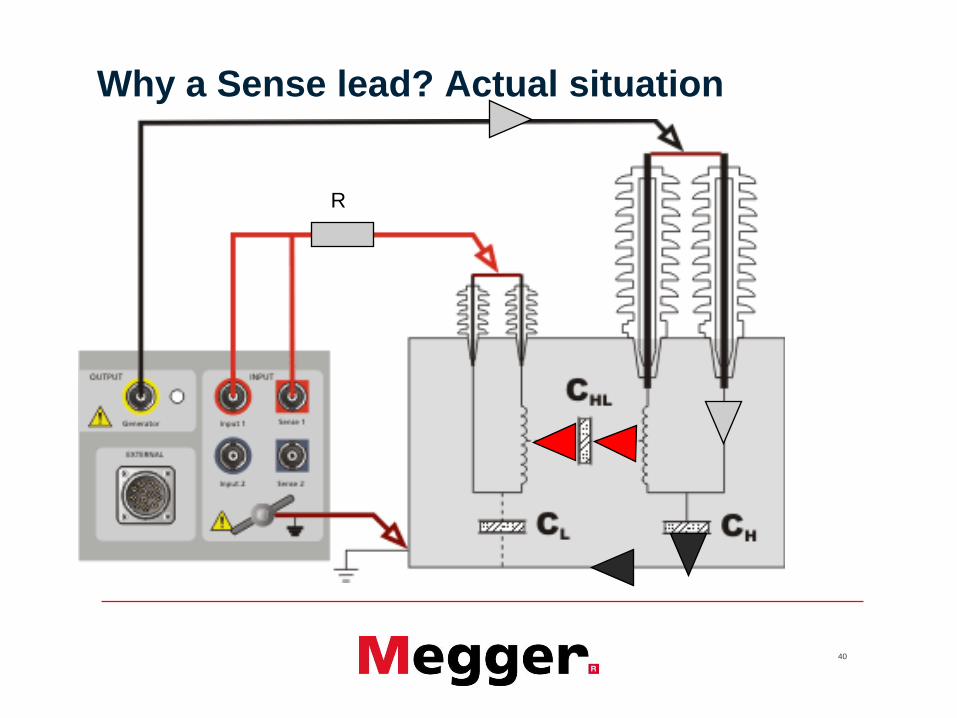
Why a Sense lead? Actual situation
R

41
Why a Sense lead? Actual situation
R

42
High frequency CHL measurements – Results
2-w CHL measurement
CHL=5729 pF
CL=8755 pF
Single-wire ampmeter
connection (IDA, Dirana)
2-wire ampmeter
connection (IDAX300)
Tand delta=0.56%
Tan delta=1.3 %

43
V
A
Hi
Lo
Ground CHL
CL
CH
High frequency CHL measurements – Issues
1. Ampmeter input + cable
Z is small but not zero...
2. Z is high but
not infinite...3. ”Leakage” current causes
measurement error at high frequencies

44
V
A
Hi
Lo
Ground CHL
CL
CH
High frequency CHL measurements – Solution
1. Ampmeter input + cable
Z is small but not zero...
2. Z is high but
not infinite...No ”leakage” current causing
measurement error at high frequencies!
Sense/Voltage output
Compensates for Z and
sets potential to ground

45
Noise in substations
Induced AC (50/60Hz)
Induced DC (HVDC stations)
DC offset from ground potential
Other disturbancies (RF, harmonics etc)

46
Noise in substations - AC
88 randomly selected IDA/IDAX measurements
“Noisy” limit set to 50µA
About 10-20% of all measurements are performed at > 50µA
noise current
Noise level, dB rel 10µA
-140,0
-120,0
-100,0
-80,0
-60,0
-40,0
-20,0
0,0
20,0
40,0
1 4 7 10 13 16 19 22 25 28 31 34 37 40 43 46 49 52 55 58 61 64 67 70 73 76 79 82 85 88
Sorozatok1

47
Bushings and rotating machinery

48
Bushing Failures

49
DFR on Bushings
General Electric, ”Type U”
Bad condition
Good condition

50
High-Voltage DFR on Bushings (0.13-14kV)

51
DFR for Motors and Generators
Measure tan delta vs frequency to detect ageing
deterioration (end-of-life)

52
Verification of DFR/IDAX performance
Accredited test system at ABB transformers
Project REDIATOOL comparing DFR with other methods for measuring moisture in transformers. Results published at CIGRE 2006 (paper D1-207).http://www.uni-stuttgart.de/ieh/forschung/veroeffentlichungen/CIGRE_paperD1-207_Gubanski.pdf
Examples of other independent verification bodies• IREQ (Canada)
• EPRI (China)
• IEPS/Schering-Institute (Germany)
• CESI (Italy)
• KTH (Sweden)
• Tennesse Tech (USA)
53
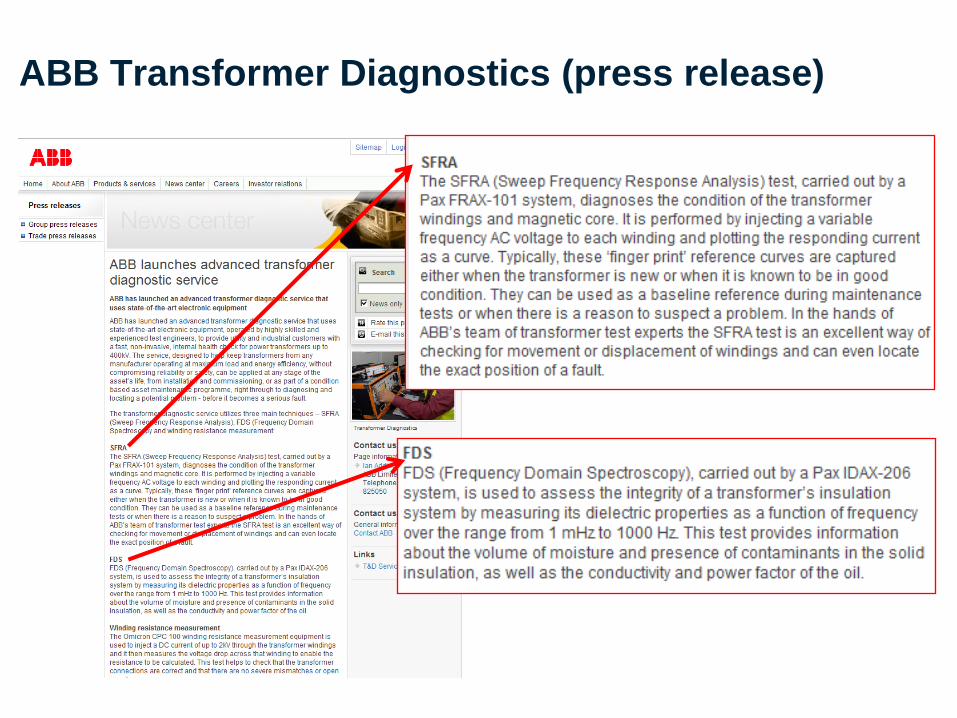
ABB Transformer Diagnostics (press release)

54
IDAX 300 – Insulation Diagnostic Analyzer

55
IDAX 206FR – Insulation Diagnostic Analyzer

56
IDAX System
HW
Test signal: 0 – 200 V peak 0 – 50 mA peak
Frequency: 0.0001 Hz – 10000 Hz (IDAX-300)
Sample range: 10 pF – 100 µF
2-ch measurement (IDAX-300)
SW
IDAX SW for measurement control and analysis
Moisture analysis SW (MODS)
• Automatic moisture assessment in oil impregnated cellulose

57
Cables

58
IDAX Software
Nameplate InfoObject and Test
Browser

59
IDAX Software
Test settings
Graphical
Hook-Up
Diagram

60
Software
Graph View
Presentation
selector
Power Factor
Chosen

61
IDAX Software
Result at
50/60Hz

62
Summary IDAX 300
Instrument for moisture assessment in transformer insulation
Built in modeling software for quick and reliable results
Measures the moisture where it is, at any temperature
Light weight, fast and accurate
Can also be used for other applications
• CT‟s
• Bushings
• Rotating machines
• Cables
Reveals the reason for high tan delta values - Moisture or
contamination?
Well documented and well proven method

63
Cable Diagnostics

64
Paper Insulated (PILC) Cables
Moisture in cable insulation
• is generated by ageing due to water ingress
from outside
• accelerates the ageing process
Presence of elevated moisture content
can be detected by DFR (IDAX)
measurements

65
Cable Paper – Effect of Moisture
Tan
0.001
0.01
0.1
1
10
0.001 0.01 0.1 1 10 100 1000
mc < 0.20 %
mc = 1.60 %
mc = 1.99 %
mc = 2.62 %
mc = 3.50 %
mc = 4.20 %
frequency, [Hz]
60 Hz
50 Hz
Tan minimum

66
Examples of Field Measurements
Measurements performed at 200 Vpeak on field installed cables in Sweden
1 0-3
1 0-2
1 0-1
1 00
1 0-3
1 0-2
1 0-1
1 00
1 01
1 02
1 03
H 1 0 1 T K , L 1
B e kö , f3
R a v , f2
S kra d d , f2
los
s t
an
ge
nt,
ta
n
f re q u e n cy , [H z ]
1 0-3
1 0-2
1 0-1
100
10-3
1 0-2
1 0-1
100
101
1 02
1 03
P eder, f1
L50 56 , f1
R åd m g 2 , f2
los
s t
an
ge
nt,
ta
n
f requ ency , [H z ]

67
Estimation of Moisture Content
Minimum
PF/tan
Estimated moisture
contentCondition
0.002-0.0035 Below 1% Good
0.0035-0.005 1 – 2.5 % Moderately aged/moistened
0.005-0.01 2.5 – 3.5 % Considerably aged/moistened
Above 0.01Above 3.5% or a local
defect
In bad condition/high moisture
content

68
Summary: Paper Insulated Cables
Moisture gives a characteristic increase of the frequency dependent capacitance and loss of cellulose paper
Temperature affects the frequency response of cellulose paper
• By using measurement data in a frequency interval accurate temperature corrections are possible
Loss tangent minimum can be used as a criterion for assessment of moisture content

69
Medium Voltage XLPE Cable Circuit Problems
Terminations
• Manufacturing defects
• Bad mounting
• Aging
Joints
• Manufacturing defects
• Bad mounting
• Aging
Cables
• Manufacturing defects
• Damaged during installation
• Aging (water trees)

70
After installation diagnostic
measurements and voltage tests
Terminations
• Partial discharges (acoustic or electrical)
• Voltage test (not very effective)
Joints
• Partial discharges (acoustic or electrical)
• Voltage test (may be effective)
XLPE cables
• Voltage test
• (Partial discharge measurements)

71
Voltage tests
DC
• Not effective in most cases. Using high voltages may damage the
cable
50 Hz
• Requires very large equipment
VLF (very low frequency, 0.1 Hz)
• Cost-effective, moderate sized equipment

72
Water Tree Deterioration of MV XLPE Cables
Water trees are growing in the insulation and lower
the electrical withstand
The water tree aging process is very slow
A heavily aged cable fail if the insulation stress is
increased (lightning impulses, faults, etc)

73
Medium Voltage XLPE Cables
High voltage tests shorten cable life significantly
Non-destructive diagnostics should be used
Water-treeing can only be detected with
increasing voltage level (non-linear effect)
Use IDAX + VAX high-voltage unit!

74
Measurement Procedure
1. Measurements of short frequency sweeps, from
about 10 Hz down to 0.1 Hz at 25, 50, 75, 100 and
(repeat) 50% service voltage level, U0
2. Classification of cable quality

75
Cable quality classification
1. Low Losses and No Voltage Dependence
2. VDP Response (Voltage Dependent Permittivity)
• A voltage dependent increase of capacitance and loss.
3. TLC Response (Transition to Leakage Current)
• A VDP response at initial low voltage levels. At a higher
voltage level, the response characteristics changes due
to leakage current.
4. LC Response (Leakage Currents)
• Leakage currents through water trees are present
already at low voltage levels.

76
Capacitance part Loss (Tan ) part
New/non-deteriorated XLPE cable: Low losses and no voltage dependence
10-4
10-3
10-2
10-1
0,01 0,1 1 10
3 kV6 kV
Frequency (Hz)
'
10-4
10-3
10-2
10-1
0,01 0,1 1 10
3 kV6 kV
Frequency (Hz)
''

77
10-4
10-3
10-2
10-1
0,01 0,1 1 10
3 kV 4,5 kV 6 kV 3 kV 6 kV 3 kV
Frequency (Hz)
'''''''
10-4
10-3
10-2
10-1
0,01 0,1 1 10
3 kV 4,5 kV 6 kV 3 kV 6 kV 3 kV
Frequency (Hz)
''
''''''''''''
Capacitance part Loss (Tan ) part
VDP Response: Voltage dependent increase of loss and capacitance

78
Capacitance part Loss (Tan ) part
TLC Response: Leakage current detected at increasing voltage level + “memory effect”
10-4
10-3
10-2
10-1
0,01 0,1 1 10
1,5 kV 3 kV 4,5 kV 6 kV 3 kV
Frequency (Hz)
'
'
''
'
'
10-4
10-3
10-2
10-1
0,01 0,1 1 10
at 1,5 kV at 3 kV at 4,5 kV at 6 kV at 3 kV
Frequency (Hz)
"
"""
""

79
Capacitance part Loss (Tan ) part
LC Response:Leakage current (through water-trees) already at low voltage levels
10-4
10-3
10-2
10-1
0,01 0,1 1 10
at 3 kV at 6 kV at 9 kV
Frequency (Hz)
'
''
'
10-4
10-3
10-2
10-1
0,01 0,1 1 10
at 3 kV at 6 kV at 9 kV
Frequency (Hz)
"
"""

80
Evaluation of Water-Tree Deteriorated Cables based on laboratory and field experience
LC or TLC response• The cable is judged bad. The voltage withstand level is usually below 2.5
times service voltage level. Depending on the leakage current level, cable
design and the voltage level of the network, the cable can be used for a
short time or must be replaced immediately.
VDP response (Significantly aged)• The cable is significantly aged. The voltage withstand is typically 2.5 – 4
times the service voltage level. Depending on cable design and loading,
the cable can remain in service for several years or should be scheduled
for replacement.
No ageing detected• The cable is judged good and has typically a voltage withstand above 4
times service voltage. However „good‟ condition does not necessary mean
that the cable does not have any water trees. Repeated measurement is
recommended within a 5-10 year period.

81
No cable judged good has been reported to fail in
service
Significant aged cables, i.e. cables with VDP response,
can withstand many years of service life without failure
Cables with TLC and LC currents are bad. Such a cable
may be allowed remain in service a few months in 6 or
10 kV networks
Experience from a project

82
Approximately 60 cables circuits installed in early
seventies
Increasingly rate of cable failures
Cable circuits failed during VLF testing
In 1996, all circuits were measured and LC and TLC
cables were replaced (only a few)
25-30 cable circuits were replaced 1997-1999 based on
level on VDP response
Case Study: North Botkyrka

83
0
2
4
6
8
10
12
1993 1994 1995 1996 1997 1998 1999
Cable Faults in North Botkyrka
Fau
lts/
100
km
/Yea
r
Year
• No faults 1997- 2000. One
fault 2001. 5 faults summer
2003.
• All faults were in cables with
strong VDP-response in
1995 or 1996.
• A few circuits was re-
measured autumn 2002.
The response of slightly
aged cables indicated that
they still are in good shape
(6-7 years later)
Case Study: North Botkyrka

84
Summary: Using DFR on MV XLPE Cables
• Voltage test may damage water tree deteriorated XLPE
cables
• Relatively low voltage levels (up to service voltage) are
used in order to ensure non-destructive measurements
• The process of water tree deterioration is very slow
• By non-destructive measurements cable replacement can
be postponed and scheduled
• The response of water trees can be identified and
classified