Embed Size (px)
Citation preview

Aerosol particles
and mountain regions
Alpine Summer School 25 June 2013
Angela Marinoni

Mountains are barometers of climate change. As
the world heats up, mountain glaciers — the
source of water for many of the world’s river
systems and people — are melting at
unprecedented rates, while rare plants and animals
struggle to survive over ever diminishing areas.
Mountain people, already among the
world’s most disadvantaged, face
greater hardships.
Understanding how climate
change affects mountains,
and learning how to manage
and mitigate any negative
effects, is vital for all of us,
wherever we live. FAO focus on mountains
by J Ross and T Hofer
The mountain regions has gained growing attention due to its
significant role in global atmospheric circulation and its sensitivity
for providing a first indication of climate changes, and thus is vital
for a better understanding of global climate and environmental
changes and their impacts and interactions to human activities.
MOUNTAINS: BAROMETERS OF CLIMATE CHANGE


BC deposition on snow/ice surfaces
Deposition of black carbon is a major driver of glacial retreat in the Hindu-Kush-
Himalaya-Tibetan region (ABC Regional assessment, 2008).
Ramanathan and Carmichael report that the impact of BC on melting snow and
glaciers may equal the impact of increased atmospheric CO2.
Flanner et al (2007) estimated that BC-induced reduction of snow albedo is a major
forcing term (about 20 W m-2) in the
Tibetan side of the Himalayas.
Starting from BC concentrations at NCO-P
in pre-monsoon season we estimate:
26-68 µg Kg-1 BC snow concentration
2 – 5.2 % snow albedo reduction
70 – 204 mm (we) runoff increase from
a typical Tibetan glacier equal to
24 % of the seasonal runoff
[Yasunari et al., ACP, 2010]

What is black carbon?
Black carbon is a particulate aerosol resulting from the incomplete combustion of
fossil fuels, biomass and biofuels. It is emitted from both anthropogenic and natural
sources. It consists of pure carbon in several linked forms.
Aerosols in the atmosphere
scatter and/or absorb
sunlight, cooling or warming
the atmosphere accordingly.
Radiative Forcing (W/m2) 1750-2005
Courtesy of Dennis Clare
BC is the most efficient aerosol in warming the atmosphere

How changed BC emissions?
Source: Bond et al, 2007
Source: Ramanathan et al, 2008
In Asia (China, India) coal and biomass burning emit the majority of black
carbon, with diesel vehicles contributing in a smaller proportion, while in USA
and Europe diesel vehicles and use of fossil fuels are the most important source
of black carbon.

Estimated vertical temperature profile for
the period 1950-2002 due to greenhouse
gases and sulphate aerosols (CO2+SO4
curve) and that due to the addition of ABCs to
CO2+SO4 (ABC+CO2+SO4)
(Source: Ramanathan and others 2007).
BC can reduce the radiation at surface
The aerosols in ABCs reduce the amount of
solar radiation reaching the surface and such
reduction can decrease crop productivity


Global Atmospheric
Watch
It is a program of the World Meteorological Organization Mondiale for evaluating the “health conditions” of the atmosphere with the aim to support correct environmental interventions.
http://gaw.kishou.go.jp/

High
altitude
stations
The Global Atmosphere Watch (GAW) programme take place in 1989 with the aims: to monitor background conditions of the atmosphere, to evaluate pollution transport, to study pollutants trend, to study climate environemnt interactions

Stratospheric intrusions,
free troposphere transports
Long-range
transport
Local and regional
scales Emissions
(ABC)
Free Troposphere
Planetary
Boundary Layer
Mountain ridges can represent a source of particles in the free troposphere


Mt. Everest “NCO-Pyramid”
27.9N, 86.7E; 5079 m asl
Mt. Cimone “O. Vittori” Station
44.1N, 10.4E; 2165 m asl
4/2009

Surface Ozone
GreenHouse Gaese (CO2, CH4, N2O, SF6)
Black Carbon
Aerosol size distribution (10nm to 20µm)
Aerosol Mass (PM10)
Halocarbons (CFC, HFC, HCFC,...)
Natural Radioactivity (Be7, Pb210, Rn222)
Meteorological Parameters
Aerosol Chemistry
Aerobiology (pollen and spores)
Measurements performed at Mt. Cimone Station

Lat. N 27°57' Lon. E 86°48'
Altitude: 5079 m asl
Khumbu Valley (Nepal),
at 5079 m a.s.l.
not far from the Italian Pyramid Observatory

Atmospheric
Brown Clouds
Himalaya
(Nepal) April
2009
Po Valley
(Italy)
Summer
2006
Atmospheric background conditions and tropospheric composition
can profitably be studied by means of continuous monitoring activities at High Mountain Stations
that provide unique opportunities to detect and analyses global change processes
Mt.Cimone NCO-P
Black Carbon

0
100
200
300
400
500
600
700
800
900
1000
0:00 2:00 4:00 6:00 8:00 10:00 12:00 14:00 16:00 18:00 20:00 22:00 0:00
UTC + 4:45
ng
m-3
PRE-MONSOON
MONSOON
POST-MONSOON
DRY
black carbon diurnal variations
[Marinoni et al., 2010]
00 06 12 18
Vy
(m/s
)
-2
-1
0
1
2
3
4Monsoon
Pre-monsoon
Post-monsoon
Dry season
[Bonasoni et al., 2010]

High pollution can reach the high Himalayan region,
in particular during pre-monsoon season carrying high
concentrations of atmospheric pollutants
Photo: Khumbu Valley, April 2009
4/2009
NCO-P: Wildfires in South Asia (April 2009)

NCO-P, Khumbu Valley, April 27 2009
Forest Fire Hot Spots April 24-25, 2009
Fire had spread to at least
four high altitude protected
areas, including Annapurna,
Kanchanjunga, Langtang and
Makalu Barun national parks
for an unusually long period,
(Department of National Parks
and Wildlife Conservation) 358 fire Incidents in
Nepal on April 25
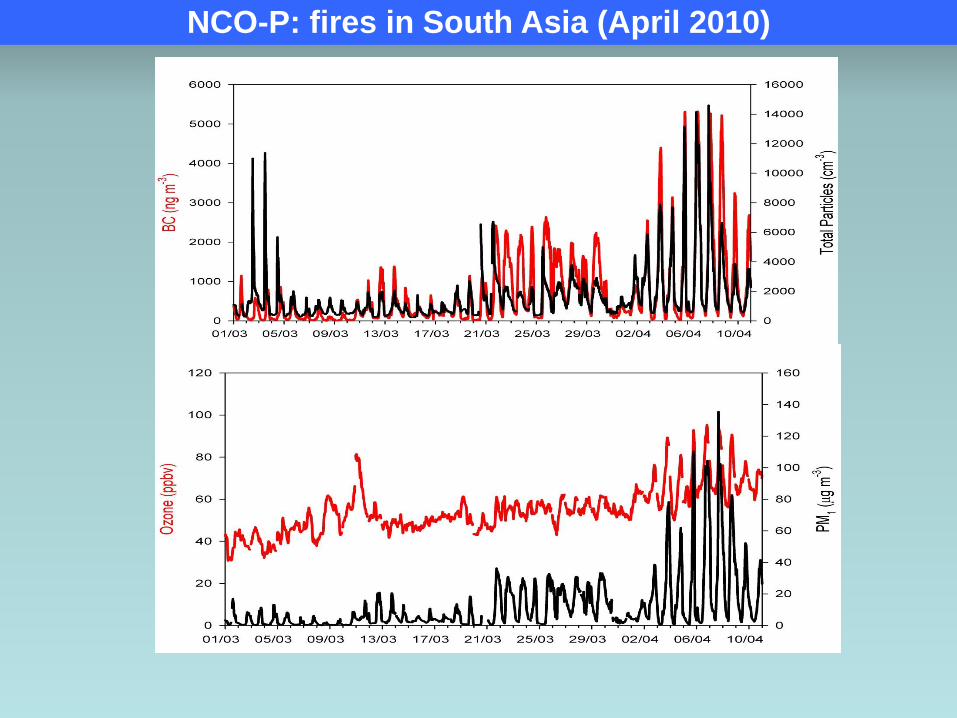
NCO-P: fires in South Asia (April 2010)

ACUTE POLLUTION EPISODE OF APRIL
2010
L evog luc os an
0
400
800
1200
22/03/10 23/03/10 24/03/10 25/03/10 26/03/10 27/03/10 28/03/10 29/03/10 30/03/10 31/03/10 01/04/10 02/04/10 03/04/10 04/04/10 05/04/10 06/04/10 07/04/10 08/04/10 09/04/10 10/04/10
ng
m
-3
ng
m-3

AP
RIL,
7 2
01
0
NC
O-P
web
cam
im
ag
es
10:46 NST
16:46 NST


Nucleation Event : 24 February 2006 •Locally >5000 part. cm-3
•Linked to windslope
•Takes place after
decrease on
condensational sink
•Not seen in Mass (BC or
PM)
•Peak of nanoparticles
takes place before
accumulation mode - 4h
delay-
• Not always « banana »
shaped: spatial
extention of nucleation
event.
4 h

DIam
ete
r (
nm
)
Local time (UTC + 4:45)
Dry season 25-50%RH
Monsoon 84-98%RH
Post-Monsoon 25-45%RH
Pre-Monsoon 45-85%RH
• High CN conc. locally (over 5000 # cm-3)
• Ultrafine particles
appear with frequency 0.5 (up to 0.8 in July)
• Nucleation event
control the free tropospheric background?
Which are the precursor?
Daily variability of particle size distribution
[Sellegri et al., ACP, 2010]
[Venzac et al., PNAS, 2009]

Evidence of high pollution event in the Himalaya during summer monsoon break 2006.
Surface ozone, black carbon
Nepal Climate Observatory – Pyramid, 12 – 22 June 2006
Long-range transport of dust and pollution during Monsoon break

0
2
4
6
8
10
12
7 8
night
10 11
afternoon
18 19
afternoon
22 23
night
25 26
afternoon
Days of June
mg
m-3
crustal matter
Inorganic Cations
Cl
organic anions
SO4
NO3
NH4
WSOM
WINSOM
NAINITAL
Coarse, fine particles
NCO-P
Coarse, fine particles
chemical composition PM10

Northern - Southern Himalaya stations: DAILY RAINFALL June-July 2006
0
5
10
15
20
25
30
35
01/0
6/20
06
05/0
6/20
06
09/0
6/20
06
13/0
6/20
06
17/0
6/20
06
21/0
6/20
06
25/0
6/20
06
29/0
6/20
06
03/0
7/20
06
07/0
7/20
06
11/0
7/20
06
15/0
7/20
06
19/0
7/20
06
23/0
7/20
06
27/0
7/20
06
31/0
7/20
06
mm
Xigaze Tingri Lhasa NCO-P