Embed Size (px)
Citation preview

Allied Electronics Corporation (ATN, ATNP)Powertech Investor Day – 9 February 2007
Robert Venter, Chief Executive

Our profile
TelecomsInformationTechnology Multi-media and
Power Electronics

Group structure
****
Telecoms, Multi-media, InformationTechnology (TMT)
Information Technology Power Electronics
Market Cap: R 6.7bn Employees: 3344CEO: Craig Venter
Market Cap: R 2.3bn Employees: 2720
CEO: David Redshaw
Market Cap: N/AEmployees: 4974
CEO: Norbert Claussen
JSE listed **
**
CEO: Robert Venter
Revenue: over R 15bn
Market cap: R 12.4bn
Employees: ± 11,000
Venter Family: 62.7% voting control
32.2% economic control
Based on share prices of 8 February 2007
58% 59% 100%
**

Management structure
RE Venter (46)CEO & Chairman of Executive Committee,Altron
DC Radley (40)CFO, Altron
CG Venter (43)CEO, Altech
N Claussen (45)CEO, Powertech
PD Redshaw (64)CEO, BTG
PMO Curle (60)Corporate Finance
Dr. WP Venter (71)ChairmanAltron
Dr. HA Serebro (66)Snr. Executive Director
Office of the Chairman Executive Committee
D Ramaphosa (49)Group Executive, Corporate Affairs
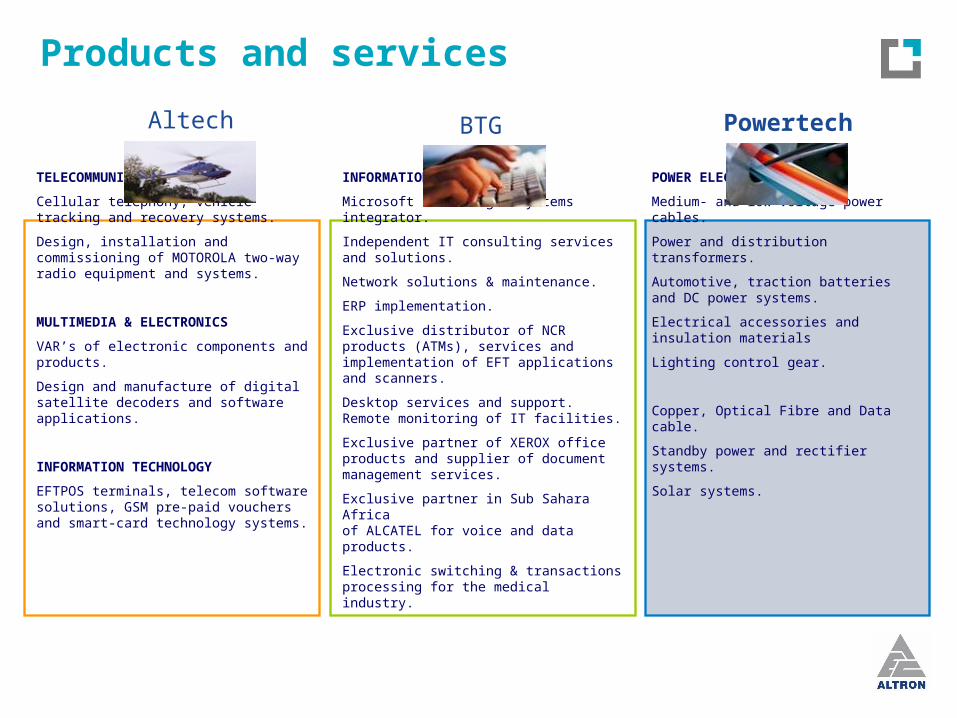
Products and services
TELECOMMUNICATIONS
Cellular telephony, vehicle tracking and recovery systems.
Design, installation and commissioning of MOTOROLA two-way radio equipment and systems.
MULTIMEDIA & ELECTRONICS
VAR’s of electronic components and products.
Design and manufacture of digital satellite decoders and software applications.
INFORMATION TECHNOLOGY
EFTPOS terminals, telecom software solutions, GSM pre-paid vouchers and smart-card technology systems.
INFORMATION TECHNOLOGY
Microsoft licensing & systems integrator.
Independent IT consulting services and solutions.
Network solutions & maintenance.
ERP implementation.
Exclusive distributor of NCR products (ATMs), services and implementation of EFT applications and scanners.
Desktop services and support. Remote monitoring of IT facilities.
Exclusive partner of XEROX office products and supplier of document management services.
Exclusive partner in Sub Sahara Africa of ALCATEL for voice and data products.
Electronic switching & transactions processing for the medical industry.
POWER ELECTRONICS
Medium- and low-voltage power cables.
Power and distribution transformers.
Automotive, traction batteries and DC power systems.
Electrical accessories and insulation materials
Lighting control gear.
Copper, Optical Fibre and Data cable.
Standby power and rectifier systems.
Solar systems.
Altech PowertechBTG

Primary market verticals
Consumer
Telecoms
Financial institutions
Building and construction
Power infrastructure
Mining
Telecoms
Transport
Financial institutions
Corporates
Education
Retail

Empowerment partners
Altech BTG Powertech
Pamodzi *
• 28% AltechNamITech
• 25.01% Altech Data
• Key principal: Ndaba Ntsele, Solly Sithole
Kagiso Ventures *
• 27% BTG SA
• Key principals: Roger Jardine, Afzal Patel
Izingwe Capital *• 30% Aberdare Cables (in consortium with
Matomo)• Key principal: Sipho Pityana
Kagiso• 25.1% Battech• Key principals: Roger Jardine• Afzal Patel
Wiphold• 20% ABB SA - 10% ABB Powertech Transformers• Key principal: Louisa Mojela
Power Matla• 25.05% Desta Power Matla• Key principal: Solly Moloko
Mahogany Capital• 25.1% Calidus Whiteleys• Key principal: Taurai Muranda
* anchor partners

Financial summary(for the 6 months ended 31 August 2006)
R millions Aug 06 Aug 05 % change
Revenue 8 339 6 954 20
EBITDA 828 602 38
Operating profit 711 502 42
Operating margin (%) 8.5 7.2
HEPS (cents) 124 81 52
Diluted HEPS (cents) 109 76 43
RONA 35.9% 24.0%
Cash on hand 1 516 875

Altron balance sheet ratios
Aug-06 Aug-05
Return on capital employed (operating income: debt and equity)
31.4% 23.5%
Return on equity (attributable income: equity) 23.5% 16.8%
Return on operating assets 22.4% 18.0%
Return on net assets 35.9% 24.0%

Subsidiary company results (for the 6 months ended 31 August 2006)
* JSE listed
Revenue: R3.0bn 32% Heps: 64c 140%
Op profit: R272m 114% Cash: R338m
Op margin 5.5% 8.9% ROCE: 16.2% 30.4%
Revenue: R3.3bn 13% Heps: 197c 9%
Op profit: R289m 16% Cash: R1,272m
Op margin 8.5% 8.7% ROCE: 29.4% 32.3%
Revenue: R2.0bn 15% Heps: 58c 25%
Op profit: R157m 23% Cash: R(83)m
Op margin 7.5% 8.0% ROCE: 44.1% 38.9%
Shareholding 57.7%
Shareholding 57.8%
Shareholding: 100%
*
*
*

Subsidiary contribution to growth
6,950
8,330388
251
741
6,000
6,500
7,000
7,500
8,000
8,500
Aug-05 Altech BTG Powertech Aug-06
R m
505
39
718
29
145
200
300
400
500
600
700
Aug-05 Altech BTG Powertech Aug-06
R mRevenue bridge * Operating profit bridge *
Headline earnings bridge
* Excludes corporate & financial services
227
98
3509
16
150
200
250
300
350
400
Aug-05 Altech BTG Powertech Aug-06
R m

0
50
100
150
200
250
300
350
400
Contribution per subsidiary
0
1000
2000
3000
4000
5000
6000
7000
8000
9000
Aug 06 Aug 05
0
100
200
300
400
500
600
700
800
Aug 06 Aug 05
Revenue Operating profit * Headline earnings
Altech BTG Powertech
Aug 06 Aug 05 Aug 06 Aug 05 Aug 06 Aug 05
40%
23%
37%
42%
25%
33%
41%
22%
38%
50%
26%
25%
32%
16%
48%
45%
17%
32%
Corporate & financial
4%
6%
Rm Rm Rm
* Corporate and financial Aug 06 & Aug 05 = (1%)

Strategic philosophies
Improve existing operationsExpand organically
Acquire and disposeAllocate capital
Strategic alliances
Ownership of IPR
Annuity income
Value added services
Market leadership / Critical mass
Quality / Sustainability of Income
Superior human capital
Global expansion in niche markets
Black Economic Empowerment
Increase shareholder value

10 year track record
0
4000
8000
12000
16000
1997 1998 1999 2000 2001 2002 2003 2004 2005 20060
50
100
150
200
1997 1998 1999 2000 2001 2002 2003 2004 2005 2006
0
200
400
600
800
1000
1200
1997 1998 1999 2000 2001 2002 2003 2004 2005 20060
20
40
60
80
1997 1998 1999 2000 2001 2002 2003 2004 2005 2006
10yr CAGR12%
Revenue
Net asset value per share
HEPS
Dividends per share
10yr CAGR12.5%
10yr CAGR12.6%
10yr CAGR14.0%

Key external growth drivers for the group
Infrastructure spend
Technology convergence
Financial sector
Global footprint

Infrastructure spend
Eskom expenditure and expansion continues
Gautrain commenced - cross group opportunities with first orders received
Building and construction industry activity remains buoyant but shift from residential to commercial
Local municipalities upgrading infrastructure for compliance
Soccer world cup projects commencing (upgrading of stadiums, activity in hospitality industry, infrastructure etc.)
Strength of resources allowing greater expenditure by mining industry
Global trend in infrastructure development
Conclusion of JV with Reunert allows exposure to telecoms infrastructure

Fixed investment trends
-30
-20
-10
0
10
20
30
65 68 71 74 77 80 83 86 89 92 95 98 01 04
0
5
10
15
20
25
30
35
Y-o-y % change As % of gdp
Y-o-y % change in GDFI % of gdp

Eskom capacity project funnel
Research
Prefeasibility
Opportunity Identification
Feasibility, business case, contract
concludingBuild
17 375 MW 7 800 MW 20 850 MW 8 391 MW
165
100
112
0
0
1800
3500
500
1200
500
42002400
4200
4200
1000
1520
2100
961
300
1128
2100
1000600 600
1332
1300
1775
6000
800
800
1600
1600
1050
800
1050
0
0
5000
2000
PBMR
UCG
Concentrating Solar
New Coal Supply
Discard Coal
Oscar
Uniform Victor
Rainbow Millennium Zulu
Trans KalahariInterconnector
November
Yankee
Mike Tango
Whiskey
Foxtrot
Sierra
X-ray
Songo ApolloHVDC LinkCapacityUpgrade
LimaIndia
*Pap
Julliet
RomeoDelta
Bravo
Quebec Echo
Golf
765kV CapeStrengthening
Charlie
Kilo
Hotel
Komati
Camden
ArnotP18
Grootvlei
AlphaOCGT
* Possible 2 400 MW Mid Merit
Hydro
Nuclear
Gas
Coal
Solar
Transmission
Source: Eskom

Thank you