Embed Size (px)
Citation preview

USENIX Association 17th USENIX Security Symposium 1
All Your iFRAMEs Point to Us
Niels Provos Panayiotis MavrommatisGoogle Inc.
{niels, panayiotis}@google.com
Moheeb Abu Rajab Fabian MonroseJohns Hopkins University
{moheeb, fabian}@cs.jhu.edu
AbstractAs the web continues to play an ever increasing role
in information exchange, so too is it becoming the pre-vailing platform for infecting vulnerable hosts. In thispaper, we provide a detailed study of the pervasivenessof so-called drive-by downloads on the Internet. Drive-by downloads are caused by URLs that attempt to exploittheir visitors and cause malware to be installed and runautomatically. Over a period of 10 months we processedbillions of URLs, and our results shows that a non-trivialamount, of over 3 million malicious URLs, initiate drive-by downloads. An even more troubling finding is thatapproximately 1.3% of the incoming search queries toGoogle’s search engine returned at least one URL labeledas malicious in the results page. We also explore sev-eral aspects of the drive-by downloads problem. Specifi-cally, we study the relationship between the user brows-ing habits and exposure to malware, the techniques usedto lure the user into the malware distribution networks,and the different properties of these networks.
1 Introduction
It should come as no surprise that our increasing relianceon the Internet for many facets of our daily lives (e.g.,commerce, communication, entertainment, etc.) makesthe Internet an attractive target for a host of illicit ac-tivities. Indeed, over the past several years, Internet ser-vices have witnessed major disruptions from attacks, andthe network itself is continually plagued with malfea-sance [1�]. While the monetary gains from the myriadof illicit behaviors being perpetrated today (e.g., phish-ing, spam) is just barely being understood [11], it is clearthat there is a general shift in tactics—wide-scale attacksaimed at overwhelming computing resources are becom-ing less prevalent, and instead, traditional scanning at-
tacks are being replaced by other mechanisms. Chiefamong these is the exploitation of the web, and the ser-vices built upon it, to distribute malware.
This change in the playing field is particularly alarm-ing, because unlike traditional scanning attacks that usepush-based infection to increase their population, web-based malware infection follows a pull-based model. Forthe most part, the techniques in use today for deliver-ing web-malware can be divided into two main cate-gories. In the first case, attackers use various social en-gineering techniques to entice the visitors of a websiteto download and run malware. The second, more de-vious case, involves the underhanded tactic of targetingvarious browser vulnerabilities to automatically down-load and run—i.e., unknowingly to the visitor—the bi-nary upon visiting a website. When popular websitesare exploited, the potential victim base from these so-called drive-by downloads can be far greater than otherforms of exploitation because traditional defenses (e.g.,firewalls, dynamic addressing, proxies) pose no barrierto infection. While social engineering may, in general,be an important malware spreading vector, in this workwe restrict our focus and analysis to malware deliveredvia drive-by downloads.
Recently, Provos et al. [�0] provided insights on thisnew phenomenon, and presented a cursory overview ofweb-based malware. Specifically, they described a num-ber of server- and client-side exploitation techniques thatare used to spread malware, and elucidated the mecha-nisms by which a successful exploitation chain can startand continue to the automatic installation of malware. Inthis paper, we present a detailed analysis of the malwareserving infrastructure on the web using a large corpus ofmalicious URLs collected over a period of ten months.Using this data, we estimate the global prevalence ofdrive-by downloads, and identify several trends for dif-
� 17th USENIX Security Symposium USENIX Association
ferent aspects of the web malware problem. Our resultsreveal an alarming contribution of Chinese-based websites to the web malware problem: overall, �7% of themalware distribution servers and ��% of the web sitesthat link to them are located in China. These results raiseserious question about the security practices employedby web site administrators.
Additionally, we study several properties of the mal-ware serving infrastructure, and show that (for the mostpart) the malware serving networks are composed oftree-like structures with strong fan-in edges leading tothe main malware distribution sites. These distributionsites normally deliver the malware to the victim after anumber of indirection steps traversing a path on the dis-tribution network tree. More interestingly, we show thatseveral malware distribution networks have linkages thatcan be attributed to various relationships.
In general, the edges of these malware distributionnetworks represent the hop-points used to lure users tothe malware distribution site. By investigating theseedges, we reveal a number of causal relationships thateventually lead to browser exploitation. More troubling,we show that drive-by downloads are being induced bymechanisms beyond the conventional techniques of con-trolling the content of compromised websites. In par-ticular, our results reveal that Ad serving networks areincreasingly being used as hops in the malware servingchain. We attribute this increase to syndication, a com-mon practice which allows advertisers to rent out part oftheir advertising space to other parties. These findingsare problematic as they show that even protected web-servers can be used as vehicles for transferring malware.Additionally, we also show that contrary to common wis-dom, the practice of following “safe browsing” habits(i.e., avoiding gray content) by itself is not an effectivesafeguard against exploitation.
The remainder of this paper is organized as follows.In Section �, we provide background information on howvulnerable computer systems can be compromised solelyby visiting a malicious web page. Section � gives anoverview of our data collection infrastructure and in Sec-tion � we discuss the prevalence of malicious web siteson the Internet. In Section �, we explore the mecha-nisms used to inject malicious content into web pages.We analyze several aspects of the web malware distribu-tion networks in Section �. In Section 7 we provide anoverview of the impact of the installed malware on theinfected system. Section � discusses implications of ourresults and Section � presents related work. Finally, weconclude in Section 10.
2 Background
Unfortunately, there are a number of existing exploita-tion strategies for installing malware on a user’s com-puter. One common technique for doing so is by re-motely exploiting vulnerable network services. How-ever, lately, this attack strategy has become less suc-cessful (and presumably, less profitable). Arguably, theproliferation of technologies such as Network AddressTranslators (NATs) and firewalls make it difficult to re-motely connect and exploit services running on users’computers. This, in turn, has lead attackers to seek otheravenues of exploitation. An equally potent alternative isto simply lure web users to connect to (compromised)malicious servers that subsequently deliver exploits tar-geting vulnerabilities of web browsers or their plugins.
Adversaries use a number of techniques to inject con-tent under their control into benign websites. In manycases, adversaries exploit web servers via vulnerablescripting applications. Typically, these vulnerabilities(e.g., in phpBB� or InvisionBoard) allow an adversaryto gain direct access to the underlying operating sys-tem. That access can often be escalated to super-userprivileges which in turn can be used to compromise anyweb server running on the compromised host. In general,upon successful exploitation of a web server the adver-sary injects new content to the compromised website. Inmost cases, the injected content is a link that redirectsthe visitors of these websites to a URL that hosts a scriptcrafted to exploit the browser. To avoid visual detectionby website owners, adversaries normally use invisibleHTML components (e.g., zero pixel IFRAMEs) to hidethe injected content.
Another common content injection technique is to usewebsites that allow users to contribute their own con-tent, for example, via postings to forums or blogs. De-pending on the site’s configuration, user contributed con-tent may be restricted to text but often can also containHTML such as links to images or other external content.This is particularly dangerous, as without proper filter-ing in place, the adversary can simply inject the exploitURL without the need to compromise the web server.
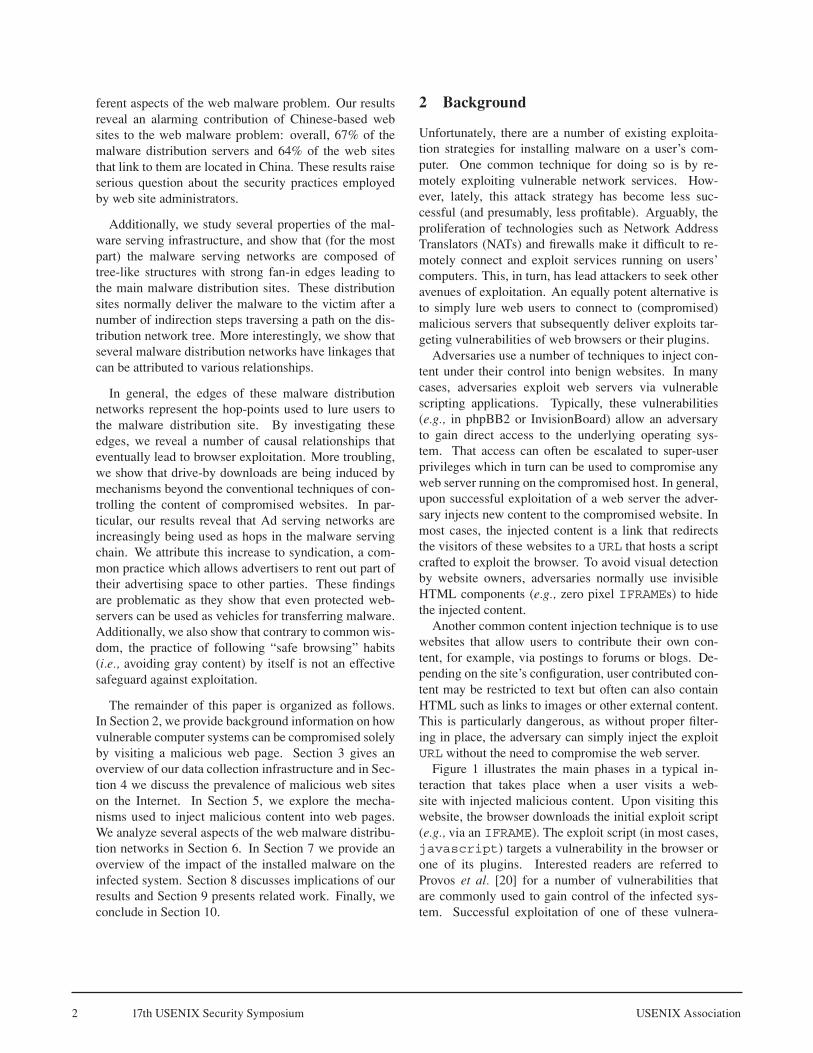
Figure 1 illustrates the main phases in a typical in-teraction that takes place when a user visits a web-site with injected malicious content. Upon visiting thiswebsite, the browser downloads the initial exploit script(e.g., via an IFRAME). The exploit script (in most cases,javascript) targets a vulnerability in the browser orone of its plugins. Interested readers are referred toProvos et al. [�0] for a number of vulnerabilities thatare commonly used to gain control of the infected sys-tem. Successful exploitation of one of these vulnera-

USENIX Association 17th USENIX Security Symposium �
Figure 1: A typical Interaction with of drive-by down-load victim with a landing URL .
bilities results in the automatic execution of the exploitcode, thereby triggering a drive-by download. Drive-bydownloads start when the exploit instructs the browser toconnect to a malware distribution site to retrieve malwareexecutable(s). The downloaded executable is then auto-matically installed and started on the infected system1.
Finally, attackers use a number of techniques to evadedetection and complicate forensic analysis. For example,the use of randomly seeded obfuscated javascript intheir exploit code is not uncommon. Moreover, to com-plicate network based detection attackers use a numberor redirection steps before the browser eventually con-tacts the malware distribution site.
3 Infrastructure and Methodology
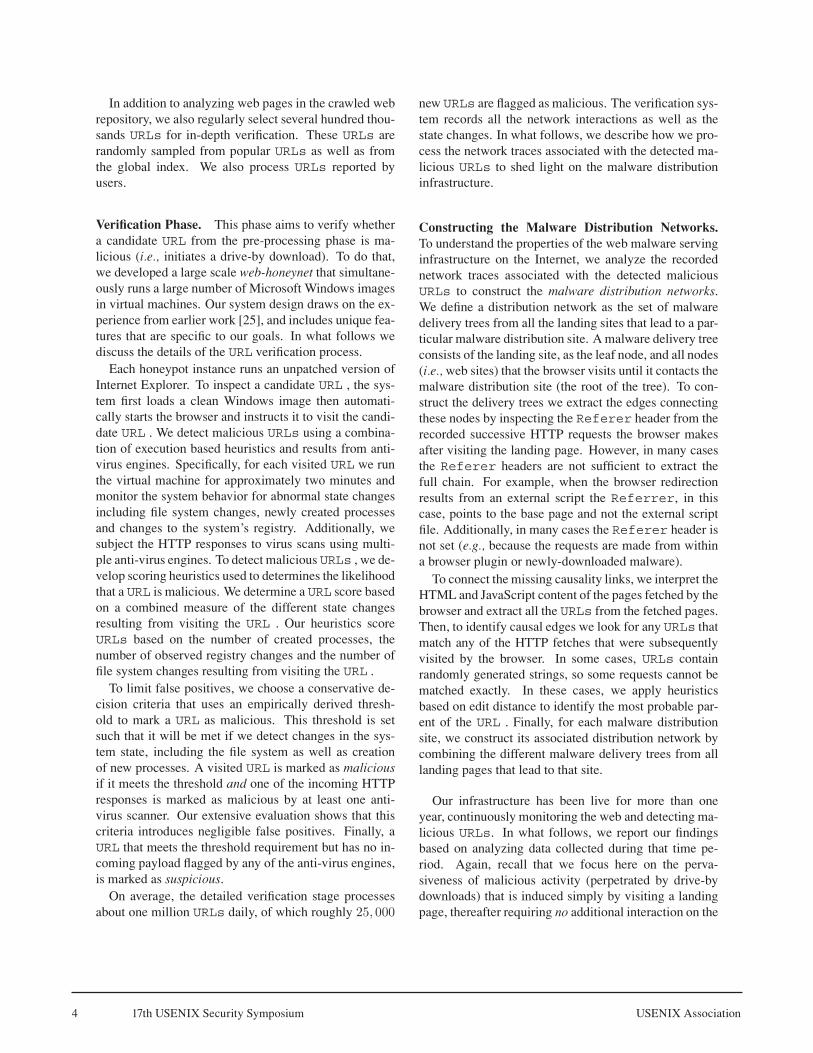
Our primary objective is to identify malicious web sites(i.e., URLs that trigger drive-by downloads) and helpimprove the safety of the Internet. Before proceedingfurther with the details of our data collection methodol-ogy, we first define some terms we use throughout thispaper. We use the terms landing pages and maliciousURLs interchangeably to denote the URLs that initiatedrive-by downloads when users visit them. In our subse-quent analysis, we group these URLs according to theirtop level domain names and we refer to the resulting setas the landing sites. In many cases, the malicious pay-load is not hosted on the landing site, but instead loadedvia an IFRAME or a SCRIPT from a remote site. Wecall the remote site that hosts malicious payloads a dis-tribution site. In what follows, we detail the differentcomponents of our data collection infrastructure.
Pre-processing Phase. As Figure 2 illustrates, the dataprocessing starts from a large web repository maintainedby Google. Our goal is to inspect URLs from this repos-itory and identify the ones that trigger drive-by down-loads. However, exhaustive inspection of each URL inthe repository is prohibitively expensive due to the largenumber of URLs in the repository (on the order of bil-lions). Therefore, we first use light-weight techniques toextract URLs that are likely malicious then subject themto a more detailed analysis and verification phase.
Figure 2: URL selection and verification workflow.
We employ the mapreduce [9] framework to processbillions of web pages in parallel. For each web page, weextract several features, some of which take advantage ofthe fact that many landing URLs are hijacked to includemalicious payload(s) or to point to malicious payload(s)from a distribution site. For example, we use “out ofplace” IFRAMEs, obfuscated JavaScript, or IFRAMEs toknown distribution sites as features. Using a specializedmachine-learning framework [7], we translate these fea-tures into a likelihood score. We employ five-fold cross-validation to measure the quality of the machine-learningframework. The cross-validation operates by splittingthe data set into 5 randomly chosen partitions and thentraining on four partitions while using the remaining par-tition for validation. This process is repeated five times.For each trained model, we create an ROC curve and usethe average ROC curve to estimate the overall accuracy.Using this ROC curve, we estimate the false positive anddetection rate for different thresholds. Our infrastructurepre-processes roughly one billion pages daily. In order tofully utilize the capacity of the subsequent detailed ver-ification phase, we choose a threshold score that resultsin an outcome false positive rate of about 10−3 with acorresponding detection rate of approximately 0.9. Thisamounts to about one million URLs that we subject tothe computationally more expensive verification phase.
� 17th USENIX Security Symposium USENIX Association
In addition to analyzing web pages in the crawled webrepository, we also regularly select several hundred thou-sands URLs for in-depth verification. These URLs arerandomly sampled from popular URLs as well as fromthe global index. We also process URLs reported byusers.
Verification Phase. This phase aims to verify whethera candidate URL from the pre-processing phase is ma-licious (i.e., initiates a drive-by download). To do that,we developed a large scale web-honeynet that simultane-ously runs a large number of Microsoft Windows imagesin virtual machines. Our system design draws on the ex-perience from earlier work [��], and includes unique fea-tures that are specific to our goals. In what follows wediscuss the details of the URL verification process.
Each honeypot instance runs an unpatched version ofInternet Explorer. To inspect a candidate URL , the sys-tem first loads a clean Windows image then automati-cally starts the browser and instructs it to visit the candi-date URL . We detect malicious URLs using a combina-tion of execution based heuristics and results from anti-virus engines. Specifically, for each visited URL we runthe virtual machine for approximately two minutes andmonitor the system behavior for abnormal state changesincluding file system changes, newly created processesand changes to the system’s registry. Additionally, wesubject the HTTP responses to virus scans using multi-ple anti-virus engines. To detect malicious URLs , we de-velop scoring heuristics used to determines the likelihoodthat a URL is malicious. We determine a URL score basedon a combined measure of the different state changesresulting from visiting the URL . Our heuristics scoreURLs based on the number of created processes, thenumber of observed registry changes and the number offile system changes resulting from visiting the URL .
To limit false positives, we choose a conservative de-cision criteria that uses an empirically derived thresh-old to mark a URL as malicious. This threshold is setsuch that it will be met if we detect changes in the sys-tem state, including the file system as well as creationof new processes. A visited URL is marked as maliciousif it meets the threshold and one of the incoming HTTPresponses is marked as malicious by at least one anti-virus scanner. Our extensive evaluation shows that thiscriteria introduces negligible false positives. Finally, aURL that meets the threshold requirement but has no in-coming payload flagged by any of the anti-virus engines,is marked as suspicious.
On average, the detailed verification stage processesabout one million URLs daily, of which roughly 25, 000
new URLs are flagged as malicious. The verification sys-tem records all the network interactions as well as thestate changes. In what follows, we describe how we pro-cess the network traces associated with the detected ma-licious URLs to shed light on the malware distributioninfrastructure.
Constructing the Malware Distribution Networks.To understand the properties of the web malware servinginfrastructure on the Internet, we analyze the recordednetwork traces associated with the detected maliciousURLs to construct the malware distribution networks.We define a distribution network as the set of malwaredelivery trees from all the landing sites that lead to a par-ticular malware distribution site. A malware delivery treeconsists of the landing site, as the leaf node, and all nodes(i.e., web sites) that the browser visits until it contacts themalware distribution site (the root of the tree). To con-struct the delivery trees we extract the edges connectingthese nodes by inspecting the Referer header from therecorded successive HTTP requests the browser makesafter visiting the landing page. However, in many casesthe Referer headers are not sufficient to extract thefull chain. For example, when the browser redirectionresults from an external script the Referrer, in thiscase, points to the base page and not the external scriptfile. Additionally, in many cases the Referer header isnot set (e.g., because the requests are made from withina browser plugin or newly-downloaded malware).
To connect the missing causality links, we interpret theHTML and JavaScript content of the pages fetched by thebrowser and extract all the URLs from the fetched pages.Then, to identify causal edges we look for any URLs thatmatch any of the HTTP fetches that were subsequentlyvisited by the browser. In some cases, URLs containrandomly generated strings, so some requests cannot bematched exactly. In these cases, we apply heuristicsbased on edit distance to identify the most probable par-ent of the URL . Finally, for each malware distributionsite, we construct its associated distribution network bycombining the different malware delivery trees from alllanding pages that lead to that site.
Our infrastructure has been live for more than oneyear, continuously monitoring the web and detecting ma-licious URLs. In what follows, we report our findingsbased on analyzing data collected during that time pe-riod. Again, recall that we focus here on the perva-siveness of malicious activity (perpetrated by drive-bydownloads) that is induced simply by visiting a landingpage, thereafter requiring no additional interaction on the

USENIX Association 17th USENIX Security Symposium �
client’s part (e.g., clicking on embedded links). Finally,we note that due to the large scale of our data collectionand some infrastructural constraints, a number longitu-dinal aspects of the web malware problem (e.g., the life-time of the different malware distribution networks) arebeyond the scope of this paper and are a subject of ourfuture investigation.
4 Prevalence of Drive-by Downloads
We provide an estimate of the prevalence of web-malware based on data collected over a period of tenmonths (Jan �007 - Oct �007). During that period, wesubjected over �0 million URLs for in-depth processingthrough our verification system. Overall, we detectedmore than 3 million malicious URLs hosted on more than180 thousand landing sites. Overall, we observed morethan 9 thousand different distribution sites. The findingsare summarized in Table 1. Overall, these results showthe scope of the problem, but do not necessarily reflectthe exposure of end-users to drive-by downloads. In whatfollows, we attempt to address this question by estimat-ing the overall impact of the malicious web sites.
Data collection period Jan - Oct �007Total URLs checked in-depth 66, 534, 330
Unique suspicious landing URLs 3, 385, 889
Unique malicious landing URLs 3, 417, 590
Unique malicious landing sites 181, 699
Unique distribution sites 9, 340
Table 1: Summary of collected data.
To study the potential impact of malicious web siteson the end-users, we first examine the fraction of incom-ing search queries to Google’s search engine that returnat least one URL labeled as malicious in the results page.Figure � provides a running average of this fraction. Thegraph shows an increasing trend in the search queries thatreturn at least one malicious result, with an average ap-proaching 1.3% of the overall incoming search queries.This finding is troubling as it shows that a significantfraction of search queries return results that may exposethe end-user to exploitation attempts.
To further understand the importance of this finding,we inspect the prevalence of malicious sites among thelinks that appear most often in Google search results.From the top one million URLs appearing in the searchengine results, about 6, 000 belong to sites that have beenverified as malicious at some point during our data col-lection. Upon closer inspection, we found that these sites
Apr-2007 May-2007 Jun-2007 Jul-2007 Aug-2007Sep-2007 Oct-2007 Nov-2007Dec-2007Dec-2007 Jan-2008
Date
0
0.2
0.4
0.6
0.8
1
1.2
1.4
1.6
Sea
rch
quer
ies
with
res
ults
labe
led
as m
alic
ious
(%
)
Figure �: Percentage of search queries that resulted in atleast one URL labeled as malicious; 7-day running avg.
appear at uniformly distributed ranks within the top mil-lion web sites—with the most popular landing page hav-ing a rank of 1, 588. These results further highlight thesignificance of the web malware threat as they show theextent of the malware problem; in essence, about 0.6%
of the top million URLs that appeared most frequentlyin Google’s search results led to exposure to maliciousactivity at some point.
An additional interesting result is the geographic lo-cality of web based malware. Table � shows the ge-ographic breakdown of IP addresses of the top � mal-ware distribution sites and the landing sites. The resultsshow that a significant number of Chinese-based sitescontribute to the drive-by problem. Overall, 67% of themalware distribution sites and 64.6% of the landing sitesare hosted in China. These findings provide more evi-dence [1�] of poor security practices by web site admin-istrators, e.g., running out-dated and unpatched versionsof the web server software.
dist. site % of all landing site % of allhosting country dist. sites hosting country landing sites
China �7.0% China ��.�%United States 1�.0% United States 1�.�%
Russia �.0% Russia �.�%Malaysia �.�% Korea �.0%
Korea �.0% Germany �.0%
Table �: Top � Hosting countries
Upon closer inspection of the geographic locality ofthe web-malware distribution networks as a whole (i.e.,the correlation between the location of a distribution siteand the landing sites pointing to it), we see that the mal-ware distribution networks are highly localized withincommon geographical boundaries. This locality varies

� 17th USENIX Security Symposium USENIX Association
across different countries, and is most evident in China,with 96% of the landing sites in China pointing to mal-ware distribution servers hosted in that country.
4.1 Impact of browsing habits
In order to examine the impact of users’ browsing habitson their exposure to exploitation via drive-by downloads,we measure the prevalence of malicious websites acrossthe different website functional categories based on theDMOZ classification [1]. Using a large random sampleof about 7.2 million URLs , we first map each URL toits corresponding DMOZ category. We were able to findthe corresponding DMOZ categories for about �0% ofthese URLs�. We further inspect each URL through ourindepth verification system then measure the percentageof malicious URLs in each functional category. Figure �shows the prevalence of detected malicious and suspi-cious websites in each top level DMOZ category.
As the graph illustrates, website categories associ-ated with “gray content” (e.g., adult websites) show astronger connection to malicious content. For instance,about 0.�% of the URLs in the Adult category exhibiteddrive-by download activity upon visiting these websites.These results suggest that users who browse such web-sites will likely be more exposed to exploitation com-pared to users who browse websites from the other func-tional categories. However, an important observationfrom the same figure is that the distribution of maliciouswebsites is not significantly skewed toward pages thatserve gray content. In fact, the distribution shows thatmalicious websites are generally present in all websitecategories we observed. Overall, these results show thatwhile “safe browsing” habits may limit users’ exposureto drive-by downloads it does not provide an effectivesafeguard against exploitation.
0.0%
0.1%
0.2%
0.3%
0.4%
0.5%
0.6%
0.7%
0.8%
AdultFinance/Insurance
Games
Industries
Online Comm
unities
Business
Entertainment
Unknown
Computers/Electronics
Internet
Telecomm
unications
Real Estate
Society
Lifestyles
Travel
Health
Beauty/Personal Care
Shopping
Automotive
Home/Garden
Local
News/Current Events
Arts/Humanities
Reference
Food/Drink
Animals
Pre
vala
nce
of m
alic
ious
UR
Ls in
cat
egor
y
SuspiciousMalware
Figure �: Prevalence of suspicious and malicious pages.
5 Malicious Content Injection
In Section �, we showed that exposure to web-malwareis not strongly tied to a particular browsing habit. Our as-sertion is that this is due, in part, to the fact that drive-bydownloads are triggered by visiting staging sites that arenot necessarily of malicious intent but have content thatlures the visitor into the malware distribution network.
In this section, we validate this conjecture by study-ing the properties of the web sites that participate in themalware delivery trees. As discussed in Section �, at-tackers use a number of techniques to control the con-tent of benign web sites and turn them into nodes in themalware distribution networks. These techniques can bedivided into two categories: web server compromise andthird party contributed content (e.g., blog posts). Unfor-tunately, it is generally difficult to determine the exactcontribution of either category. In fact, in some caseseven manual inspection of the content of each web sitemay not lead to conclusive evidence regarding the man-ner in which the malicious content was injected into theweb site. Therefore, in this section we provide insightsinto some features of these web sites that may explaintheir presence in the malware delivery trees. We only fo-cus on the features that we can determine in an automatedfashion. Specifically, where possible, we first inspectthe version of the software running on the web serverfor each landing site. Additionally, we explore one im-portant angle that we discovered which contributes sig-nificantly to the distribution of web malware—namely,drive-by downloads via Ads.
5.1 Web Server Software
We first begin by examining (where possible) the soft-ware running on the web-servers for all the landing sitesthat lead to the malware distribution sites. Specifically,we collected all the “Server” and “X-Powered-By”header tokens from each landing page (see Table �).Not surprisingly, of those servers that reported this in-formation, a significant fraction were running outdatedversions of software with well known vulnerabilities�.For example, ��.1% of the Apache servers and ��.�%of servers with PHP scripting support reported a versionwith security vulnerabilities. Overall, these results reflectthe weak security practices applied by the web site ad-ministrators. Clearly, running unpatched software withknown vulnerabilities increases the risk of content con-trol via server exploitation.
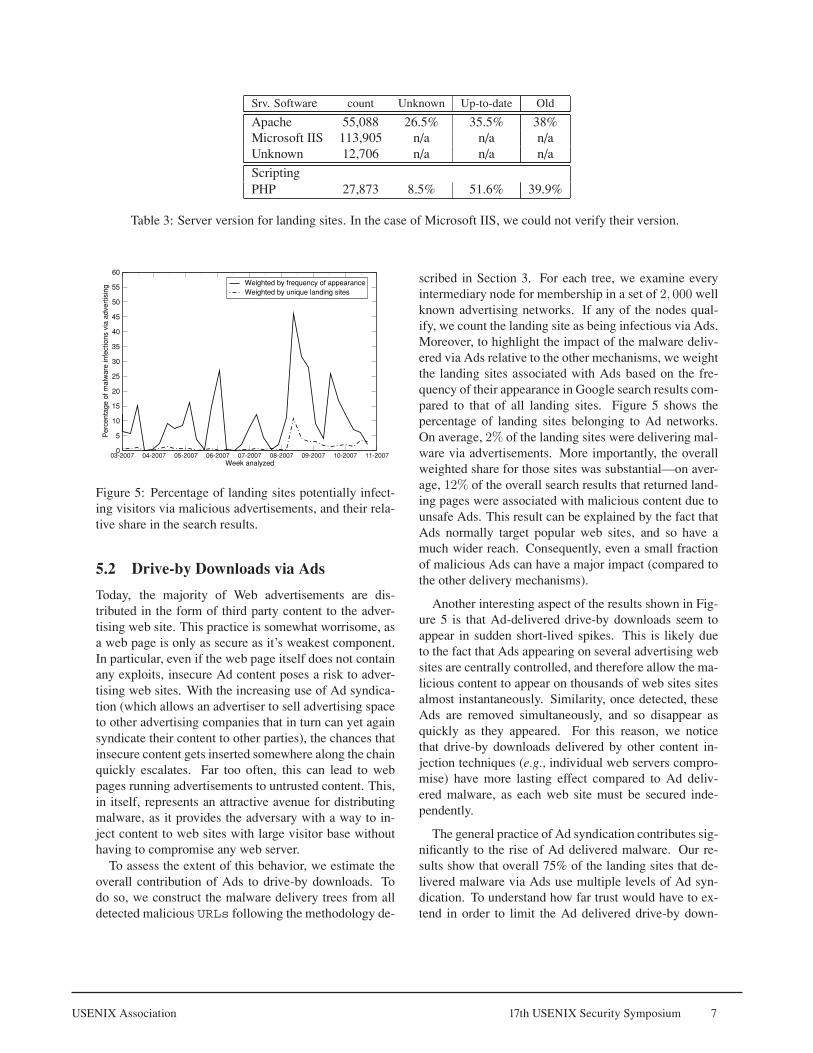
USENIX Association 17th USENIX Security Symposium 7
Srv. Software count Unknown Up-to-date Old
Apache ��,0�� ��.�% ��.�% ��%Microsoft IIS 11�,�0� n/a n/a n/aUnknown 1�,70� n/a n/a n/a
ScriptingPHP �7,�7� �.�% �1.�% ��.�%
Table �: Server version for landing sites. In the case of Microsoft IIS, we could not verify their version.
03-2007 04-2007 05-2007 06-2007 07-2007 08-2007 09-2007 10-2007 11-2007Week analyzed
0
5
10
15
20
25
30
35
40
45
50
55
60
Per
cent
age
of m
alw
are
infe
ctio
ns v
ia a
dver
tisin
g Weighted by frequency of appearanceWeighted by unique landing sites
Figure �: Percentage of landing sites potentially infect-ing visitors via malicious advertisements, and their rela-tive share in the search results.
5.2 Drive-by Downloads via Ads
Today, the majority of Web advertisements are dis-tributed in the form of third party content to the adver-tising web site. This practice is somewhat worrisome, asa web page is only as secure as it’s weakest component.In particular, even if the web page itself does not containany exploits, insecure Ad content poses a risk to adver-tising web sites. With the increasing use of Ad syndica-tion (which allows an advertiser to sell advertising spaceto other advertising companies that in turn can yet againsyndicate their content to other parties), the chances thatinsecure content gets inserted somewhere along the chainquickly escalates. Far too often, this can lead to webpages running advertisements to untrusted content. This,in itself, represents an attractive avenue for distributingmalware, as it provides the adversary with a way to in-ject content to web sites with large visitor base withouthaving to compromise any web server.
To assess the extent of this behavior, we estimate theoverall contribution of Ads to drive-by downloads. Todo so, we construct the malware delivery trees from alldetected malicious URLs following the methodology de-
scribed in Section �. For each tree, we examine everyintermediary node for membership in a set of 2, 000 wellknown advertising networks. If any of the nodes qual-ify, we count the landing site as being infectious via Ads.Moreover, to highlight the impact of the malware deliv-ered via Ads relative to the other mechanisms, we weightthe landing sites associated with Ads based on the fre-quency of their appearance in Google search results com-pared to that of all landing sites. Figure � shows thepercentage of landing sites belonging to Ad networks.On average, 2% of the landing sites were delivering mal-ware via advertisements. More importantly, the overallweighted share for those sites was substantial—on aver-age, 12% of the overall search results that returned land-ing pages were associated with malicious content due tounsafe Ads. This result can be explained by the fact thatAds normally target popular web sites, and so have amuch wider reach. Consequently, even a small fractionof malicious Ads can have a major impact (compared tothe other delivery mechanisms).
Another interesting aspect of the results shown in Fig-ure � is that Ad-delivered drive-by downloads seem toappear in sudden short-lived spikes. This is likely dueto the fact that Ads appearing on several advertising websites are centrally controlled, and therefore allow the ma-licious content to appear on thousands of web sites sitesalmost instantaneously. Similarity, once detected, theseAds are removed simultaneously, and so disappear asquickly as they appeared. For this reason, we noticethat drive-by downloads delivered by other content in-jection techniques (e.g., individual web servers compro-mise) have more lasting effect compared to Ad deliv-ered malware, as each web site must be secured inde-pendently.
The general practice of Ad syndication contributes sig-nificantly to the rise of Ad delivered malware. Our re-sults show that overall 7�% of the landing sites that de-livered malware via Ads use multiple levels of Ad syn-dication. To understand how far trust would have to ex-tend in order to limit the Ad delivered drive-by down-

� 17th USENIX Security Symposium USENIX Association
0 2 4 6 8 10 12 14 16 18 20Number of redirection steps
0
0.2
0.4
0.6
0.8
1
CD
FNo AdsAds
Figure �: CDF of the number of redirection steps for Adsthat successfully delivered malware.
loads, we plot the distribution of the path length from thelanding site leading to the malware distribution sites foreach delivery tree. The edges connecting the nodes inthese paths reflect the number of redirects a browser hasto follow before receiving the final payload. Hence, forsyndicated Ads that delivered malware the path lengthis indicative of the number of syndication steps beforereaching the final Ad; in our case, the malware payload.Figure � shows the distribution of the number of redi-rects for syndicated Ads that delivered malware relativeto the other malicious landing URLs. The results arequite telling: malware delivered via Ads exhibits longerdelivery chains, in 50% percent of all cases, more than 6
redirection steps were required before receiving the mal-ware payload. Clearly, it is increasingly difficult to main-tain trust along such long delivery chains.
Inspecting the delivery trees that featured syndicationreveals a total of �� unique Ad networks participatingin these trees. We further studied the relative role of thedifferent networks by evaluating the frequency of appear-ance of each Ad network in the malware delivery trees.Interestingly, our results show that five advertising net-works appear in approximately 75% of all malware deliv-ery trees. Figure 7 shows the distribution of the relativeposition of each network in the malware delivery chainsit participated in. The normalized position is calculatedby dividing the index of the Ad network in each chainby the length of the chain. The graph shows that theseadvertising networks split into three different categories:In the first category, which includes network I, the ad-vertising network appears at the beginning of the deliv-ery chain. In the second category, which includes net-works II-IV, advertising networks appear frequentlyin the middle of the delivery chains. In both these cat-
0
0.2
0.4
0.6
0.8
1
0 0.2 0.4 0.6 0.8 1
CD
F
Normalized Ad network position in the chain
Network IIIIIIIVV
Figure 7: CDF of the normalized position of the top fiveAd networks most frequently participating in malwaredelivery chains.
egories advertising networks do not participate directlyin delivering malware. However, the relative position ofnetworks in the delivery chain may be used as an indi-cation of their relationship with the malware distributionsites – the deeper a network’s relative position the closerit is related to the malware distribution site. Finally, inthe third category, indicated by network V, our analysisrevealed that in almost 50% of all incidents, the advertis-ing network is directly delivering malware. For example,advertising network V pushes Ads that install malware inthe form of a browser toolbar.
Finally we further elucidate this problem via an in-teresting example from our data corpus. The landingpage in our example refers to a Dutch radio station’s website. The radio station in question was showing a ban-ner advertisement from a German advertising site. Us-ing JavaScript, that advertiser redirected to a prominentadvertiser in the US, which in turn redirected to yet an-other advertiser in the Netherlands. That advertiser redi-rected to another advertisement (also in the Netherlands)that contained obfuscated JavaScript, which when un-obfuscated, pointed to yet another JavaScript hosted inAustria. The final JavaScript was encrypted and redi-rected the browser via multiple IFRAMEs to adxtnet.net,an exploit site hosted in Austria. This resulted in theautomatic installation of multiple Trojan Downloaders.While it is unlikely that the initial advertising companieswere aware of the malware installations, each redirectiongave another party control over the content on the origi-nal web page—with predictable consequences.
USENIX Association 17th USENIX Security Symposium �
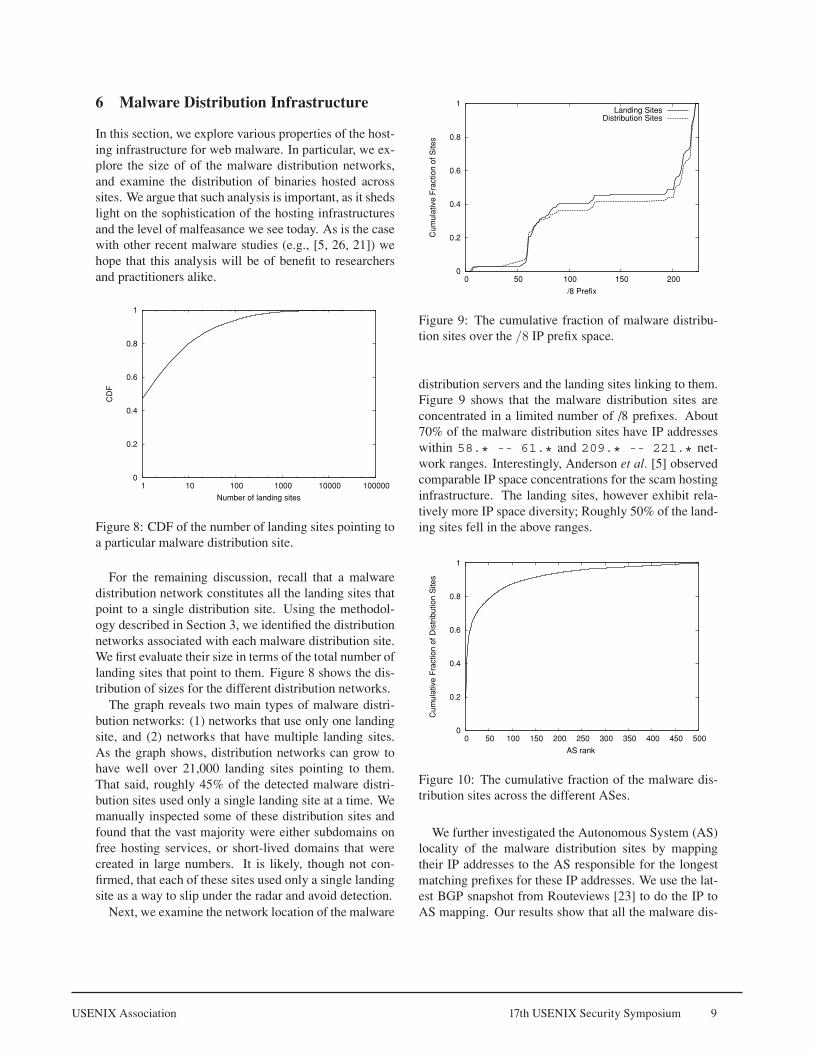
6 Malware Distribution Infrastructure
In this section, we explore various properties of the host-ing infrastructure for web malware. In particular, we ex-plore the size of of the malware distribution networks,and examine the distribution of binaries hosted acrosssites. We argue that such analysis is important, as it shedslight on the sophistication of the hosting infrastructuresand the level of malfeasance we see today. As is the casewith other recent malware studies (e.g., [�, ��, �1]) wehope that this analysis will be of benefit to researchersand practitioners alike.
0
0.2
0.4
0.6
0.8
1
1 10 100 1000 10000 100000
CD
F
Number of landing sites
Figure �: CDF of the number of landing sites pointing toa particular malware distribution site.
For the remaining discussion, recall that a malwaredistribution network constitutes all the landing sites thatpoint to a single distribution site. Using the methodol-ogy described in Section �, we identified the distributionnetworks associated with each malware distribution site.We first evaluate their size in terms of the total number oflanding sites that point to them. Figure � shows the dis-tribution of sizes for the different distribution networks.
The graph reveals two main types of malware distri-bution networks: (1) networks that use only one landingsite, and (�) networks that have multiple landing sites.As the graph shows, distribution networks can grow tohave well over �1,000 landing sites pointing to them.That said, roughly ��% of the detected malware distri-bution sites used only a single landing site at a time. Wemanually inspected some of these distribution sites andfound that the vast majority were either subdomains onfree hosting services, or short-lived domains that werecreated in large numbers. It is likely, though not con-firmed, that each of these sites used only a single landingsite as a way to slip under the radar and avoid detection.
Next, we examine the network location of the malware
0
0.2
0.4
0.6
0.8
1
0 50 100 150 200
Cum
ulat
ive
Fra
ctio
n of
Site
s
/8 Prefix
Landing SitesDistribution Sites
Figure �: The cumulative fraction of malware distribu-tion sites over the /8 IP prefix space.
distribution servers and the landing sites linking to them.Figure � shows that the malware distribution sites areconcentrated in a limited number of /� prefixes. About70% of the malware distribution sites have IP addresseswithin 58.* -- 61.* and 209.* -- 221.* net-work ranges. Interestingly, Anderson et al. [�] observedcomparable IP space concentrations for the scam hostinginfrastructure. The landing sites, however exhibit rela-tively more IP space diversity; Roughly �0% of the land-ing sites fell in the above ranges.
0
0.2
0.4
0.6
0.8
1
0 50 100 150 200 250 300 350 400 450 500
Cum
ulat
ive
Fra
ctio
n of
Dis
trib
utio
n S
ites
AS rank
Figure 10: The cumulative fraction of the malware dis-tribution sites across the different ASes.
We further investigated the Autonomous System (AS)locality of the malware distribution sites by mappingtheir IP addresses to the AS responsible for the longestmatching prefixes for these IP addresses. We use the lat-est BGP snapshot from Routeviews [��] to do the IP toAS mapping. Our results show that all the malware dis-

10 17th USENIX Security Symposium USENIX Association
tribution sites’ IP addresses fall into a relatively small setof ASes — only �00 as of this writing. Figure 10 showsthe cumulative fraction of these sites across the ASeshosting them (sorted in descending order by the numberof sites in each AS). The graph further shows the highlynonuniform concentration of the malware distributionsites: 95% of these sites map to only 210 ASes. Finally,the results of mapping the landing sites (not shown) pro-duced 2, 517 ASes with 95% of the sites falling in these500 ASes.
Lastly, the distribution of malware across domainsalso gives rise to some interesting insights. Figure 11shows the distribution of the number of unique mal-ware binaries (as inferred from MD� hashes) down-loaded from each malware distribution site. As the graphshows, approximately ��% of the distribution sites deliv-ered a single malware binary. The remaining distributionsites hosted multiple distinct binaries over their observa-tion period in our data, with �% of the servers hostingmore than 100 binaries. In many cases, we observed thatthe multiple payloads reflect deliberate obfuscation at-tempts to evade detection. In what follows, we take amore in-depth look by studying the different forms of re-lationships among the various distribution networks.
0
0.2
0.4
0.6
0.8
1
1 10 100 1000 10000 100000
CD
F
Number of Unique Malware Binary Hashes
Figure 11: CDF of the number of unique binaries down-loaded from each malware distribution site.
6.1 Relationships Among Networks
To gain a better perspective on the degree of connectiv-ity between the distribution networks, we investigate thecommon properties of the hosting infrastructure acrossthe malware distribution sites. We also evaluate the de-gree of overlap among the landing sites linking to thedifferent malware distribution sites.
Malware hosting infrastructure. Throughout ourmeasurement period we detected 9, 430 malware distri-bution sites. In 90% of the cases each site is hostedon a single IP address. The remaining 10% sites arehosted on IP addresses that host multiple malware distri-bution sites. Our results show IP addresses that hosted upto 210 malware distribution sites. Closer inspection re-vealed that these addresses refer to public hosting serversthat allow users to create their own accounts. Theseaccounts appear as sub-folders of the the virtual host-ing server DNS name (e.g., 512j.com/akgy, 512j.com/alavin, 512j.com/anti) or in many cases asseparate DNS aliases that resolve to the IP address of thehosting server. We also observed several cases where thehosting server is a public blog that allows users to havetheir own pages (e.g., mihanblog.com/abadan2,mihanblog.com/askbox).
0
0.2
0.4
0.6
0.8
1
0 0.1 0.2 0.3 0.4 0.5 0.6 0.7 0.8 0.9 1
CD
F
Normalized Pairwise Intersection
Figure 1�: CDF of the normalized pairwise intersectionbetween landing sites across distribution networks.
Overlapping landing sites. We further evaluate theoverlap between the landing sites that point to the dif-ferent malware distribution sites. To do so, we calculatethe pairwise intersection between the sets of the landingsites pointing to each of the distribution sites in our dataset. For a distribution network i with a set of landingsites Xi and network j with the set of landing sites Xj ,the normalized pairwise intersection of the two networks,Ci,j , is calculated as,
Ci,j =|Xi ∩ Xj |
|Xi|(1)
Where |X| is the number of elements in the set X . In-terestingly, our results showed that 80% of the distribu-tion networks share at least one landing page. Figure 1�

USENIX Association 17th USENIX Security Symposium 11
shows the normalized pair-wise landing sets intersectionacross these distribution networks. The graph reveals astrong overlap among the landing sites for the related net-work pairs. These results suggest that many landing sitesare shared among multiple distribution networks. For ex-ample, in several cases we observed landing pages withmultiple IFRAMEs linking to different malware distribu-tion sites. Finally, we note that the sudden jump to apair-wise score of one is mostly due to network pairs inwhich the landing sites for one network are a subset ofthose for the other network.
0
0.2
0.4
0.6
0.8
1
0 0.1 0.2 0.3 0.4 0.5 0.6 0.7 0.8 0.9 1
CD
F
Normalized Pairwise Intersection
Figure 1�: CDF of the normalized pairwise intersectionbetween malware hashes across distribution networks.
Content replication across malware distribution sites.We finally evaluate the extent to which malware is repli-cated across the different distribution sites. To do so,we use the same metric in Equation 1 to calculate thenormalized pairwise intersection of the set of malwarehashes served by each pair of distribution sites. Our re-sults show that in 25% of the malware distribution sites,at least one binary is shared between a pair of sites.While malware hashes exhibit frequent changes as a re-sult of obfuscation, our results suggest that there is still alevel of content replication across the different sites. Fig-ure 1� shows the normalized pair-wise intersection of themalware sets across these distribution networks. As thegraph shows, binaries are less frequently shared betweendistribution sites compared to landing sites, but taken asa whole, there is still a non-trivial degree of similarityamong these networks.
7 Post Infection Impact
Recall that upon visiting a malicious URL, the browserdownloads the initial exploit. The exploit (in most cases,
javascript) targets a vulnerability in the browser orone of its plugins and takes control of the infected sys-tem, after which it retrieves and runs the malware ex-ecutable(s) downloaded from the malware distributionsite. Rather than inspecting the behavior of each phasein isolation, our goal is to give an overview of the col-lective changes that happen to the system state after vis-iting a malicious URL . Figure 1� shows the distributionof the number of Windows executables downloaded af-ter visiting a malicious URL as observed from monitor-ing the interaction between the browser and the malwaredistribution site. As the graph shows, visiting maliciousURLs can lead to a large number of downloads (� on av-erage, but as large as �0 in the extreme case).
0
0.2
0.4
0.6
0.8
1
0 10 20 30 40 50 60
CD
F
Number of Downloaded Executables
Figure 1�: CDF of the number of downloaded executa-bles as a result of visiting a malicious URL
Another noticeable outcome is the increase in thenumber of running processes on the virtual machine.This increase is associated with the automatic executionof binaries. For each landing URL , we collected thenumber of processes that were started on the guest op-erating system after being infected with malware. Fig-ure 1� shows the CDF of the number of processeslaunched after the system is infected. As the graph showsvisiting malicious URLs produces a noticeable increasein the number of processes, in some cases, inducing somuch overhead that they “crashed” the virtual machine.
Additionally, we examine the type of registry changesthat occur when the malware executes. Overall, wedetected registry changes after visiting 57.5% of thelanding pages. We divide these changes into the fol-lowing categories: BHO indicates that the malware in-stalled a Browser Helper Object that can access privi-leged state in the browser; Preferences means that thebrowser home page, default search engine or name serverwhere changed by the malware; Security indicates that

1� 17th USENIX Security Symposium USENIX Association
0 20 40 60 80 100 120 140 160 180 200 220 240 260 280 300Number of processes launched after infection
0
0.1
0.2
0.3
0.4
0.5
0.6
0.7
0.8
0.9
1C
DF
Figure 1�: CDF of the number of processes started aftervisiting a malicious URL
malware changed firewall settings or even disabled au-tomatic software updates; Startup indicates that the mal-ware is trying to persist across reboots. Notice that thesecategories are not mutually exclusive (i.e., a single ma-licious URL may cause changes in multiple categories).Table � summarizes the percentage of registry changesper category. Notice that “Startup” changes are moreprevalent indicating that malware tries to persist even af-ter the machine is rebooted.
Category BHO Preferences Security StartupURLs % �.��% ��.�% ��.1�% �1.�7%
Table �: Registry changes from drive-by downloads.
In addition to the registry changes, we analyzed thenetwork activity of the virtual machine post infection. Inour system, the virtual machines are allowed to performonly DNS and HTTP connections. Table � shows thepercentage of connection attempts per destination port.Even though we omit the HTTP connections originat-ing from the browser, HTTP is still the most prevalentport for malicious activity post-infection. This is dueto “downloader” binaries that fetch, in some cases, upto 60 binaries over HTTP. We also observe a significantpercentage of connection attempts to typical IRC ports,accounting for more than 50% of all non-HTTP connec-tions. As a number of earlier studies have already shown(e.g., [�, 1�, �, �1, ��, 1�]), the IRC connection attemptsare most likely for unwillingly (to the owner) adding thecompromised machine to an IRC botnet, confirming theearlier conjecture by Provos et al. [�0] regarding the con-nection between web malware and botnets. More de-tailed examples of malware’s behavior can be found in
Protocol/Port Connections %HTTP (�0, �0�0) �7%IRC (���0-7001) �.�%FTP (�1) 0.�%UPnP (1�00) 0.�%Mail (��) 0.7�%Other �.��%
Table �: Most frequently contacted ports directly by thedownloaded malware.
Polychronakis et al. [1�].
7.1 Anti-virus engine detection rates
As we discussed earlier, web based malware uses a pull-based delivery mechanism in which a victim is requiredto visit the malware hosting server or any URL linking toit in order to download the malware. This behavior putsforward a number of challenges to defense mechanisms(e.g., malware signature generation schemes) mainly dueto the inadequate coverage of the malware collection sys-tem. For example, unlike active scanning malware whichuses a push-based delivery mechanism (and so sufficientplacement of honeypot sensors can provide good cover-age), the web is significantly more sparse and, therefore,more difficult to cover.
In what follows, we evaluate the potential implicationsof the web malware delivery mechanism by measuringthe detection rates of several well known anti-virus en-gines. Specifically, we evaluate the detection rate of eachanti-virus engine against the set of suspected malwaresamples collected by our infrastructure. Since we can notrely on anti-virus engines, we developed a heuristic todetect these suspected binaries before subjecting them tothe anti-virus scanners. For each inspected URL via ourin-depth verification system we test whether visiting theURL caused the creation of at least one new process onthe virtual machine. For the URLs that satisfy this condi-tion, we simply extract any binary� download(s) from therecorded HTTP response and “flag” them as suspicious.
We applied the above methodology to identify suspi-cious binaries on a daily basis over a one month periodof April, �007. We subject each binary for each of theanti-virus scanners using the latest virus definitions onthat day. Then, for an anti-virus engine, the detectionrate is simply the number of detected (flagged) samplesdivided by the total number of suspicious malware in-stances inspected on that day. Figure 1� illustrates theindividual detection rates of each of the anti-virus en-gines. The graph reveals that the detection capability of
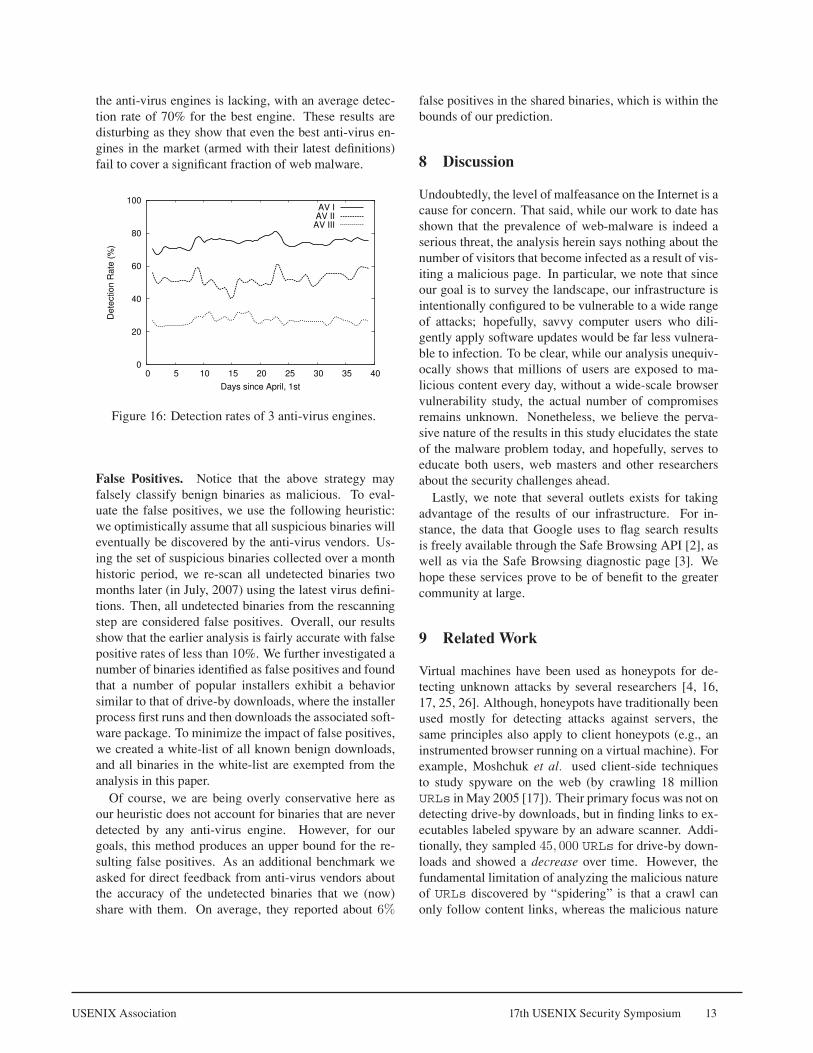
USENIX Association 17th USENIX Security Symposium 1�
the anti-virus engines is lacking, with an average detec-tion rate of 70% for the best engine. These results aredisturbing as they show that even the best anti-virus en-gines in the market (armed with their latest definitions)fail to cover a significant fraction of web malware.
0
20
40
60
80
100
0 5 10 15 20 25 30 35 40
Dete
ction R
ate
(%
)
Days since April, 1st
AV IAV II
AV III
Figure 1�: Detection rates of � anti-virus engines.
False Positives. Notice that the above strategy mayfalsely classify benign binaries as malicious. To eval-uate the false positives, we use the following heuristic:we optimistically assume that all suspicious binaries willeventually be discovered by the anti-virus vendors. Us-ing the set of suspicious binaries collected over a monthhistoric period, we re-scan all undetected binaries twomonths later (in July, �007) using the latest virus defini-tions. Then, all undetected binaries from the rescanningstep are considered false positives. Overall, our resultsshow that the earlier analysis is fairly accurate with falsepositive rates of less than 10%. We further investigated anumber of binaries identified as false positives and foundthat a number of popular installers exhibit a behaviorsimilar to that of drive-by downloads, where the installerprocess first runs and then downloads the associated soft-ware package. To minimize the impact of false positives,we created a white-list of all known benign downloads,and all binaries in the white-list are exempted from theanalysis in this paper.
Of course, we are being overly conservative here asour heuristic does not account for binaries that are neverdetected by any anti-virus engine. However, for ourgoals, this method produces an upper bound for the re-sulting false positives. As an additional benchmark weasked for direct feedback from anti-virus vendors aboutthe accuracy of the undetected binaries that we (now)share with them. On average, they reported about 6%
false positives in the shared binaries, which is within thebounds of our prediction.
8 Discussion
Undoubtedly, the level of malfeasance on the Internet is acause for concern. That said, while our work to date hasshown that the prevalence of web-malware is indeed aserious threat, the analysis herein says nothing about thenumber of visitors that become infected as a result of vis-iting a malicious page. In particular, we note that sinceour goal is to survey the landscape, our infrastructure isintentionally configured to be vulnerable to a wide rangeof attacks; hopefully, savvy computer users who dili-gently apply software updates would be far less vulnera-ble to infection. To be clear, while our analysis unequiv-ocally shows that millions of users are exposed to ma-licious content every day, without a wide-scale browservulnerability study, the actual number of compromisesremains unknown. Nonetheless, we believe the perva-sive nature of the results in this study elucidates the stateof the malware problem today, and hopefully, serves toeducate both users, web masters and other researchersabout the security challenges ahead.
Lastly, we note that several outlets exists for takingadvantage of the results of our infrastructure. For in-stance, the data that Google uses to flag search resultsis freely available through the Safe Browsing API [�], aswell as via the Safe Browsing diagnostic page [�]. Wehope these services prove to be of benefit to the greatercommunity at large.
9 Related Work
Virtual machines have been used as honeypots for de-tecting unknown attacks by several researchers [�, 1�,17, ��, ��]. Although, honeypots have traditionally beenused mostly for detecting attacks against servers, thesame principles also apply to client honeypots (e.g., aninstrumented browser running on a virtual machine). Forexample, Moshchuk et al. used client-side techniquesto study spyware on the web (by crawling 1� millionURLs in May �00� [17]). Their primary focus was not ondetecting drive-by downloads, but in finding links to ex-ecutables labeled spyware by an adware scanner. Addi-tionally, they sampled 45, 000 URLs for drive-by down-loads and showed a decrease over time. However, thefundamental limitation of analyzing the malicious natureof URLs discovered by “spidering” is that a crawl canonly follow content links, whereas the malicious nature
1� 17th USENIX Security Symposium USENIX Association
of a page is often determined by the web hosting infras-tructure. As such, while the study of Moshchuk et al.provides valuable insights, a truly comprehensive analy-sis of this problem requires a much more in-depth crawlof the web. As we were able to analyze many billions ofURLs , we believe our findings are more representativeof the state of the overall problem.
More closely related is the work of Provos et al. [�0]and Seifert et al. [��] which raised awareness of thethreat posed by drive-by downloads. These works areaimed at explaining how different web page compo-nents are used to exploit web browsers, and provides anoverview of the different exploitation techniques in usetoday. Wang et al. proposed an approach for detectingexploits against Windows XP when visiting webpages inInternet Explorer [��]. Their approach is capable of de-tecting zero-day exploits against Windows and can de-termine which vulnerability is being exploited by expos-ing Windows systems with different patch levels to dan-gerous URLs. Their results, on roughly 17, 000 URLs,showed that about 200 of these were dangerous to users.
This paper differs from all of these works in that it of-fers a far more comprehensive analysis of the differentaspects of the problem posed by web-based malware, in-cluding an examination of its prevalence, the structure ofthe distribution networks, and the major driving forces.
Lastly, malware detection via dynamic tainting analy-sis may provide deeper insight into the mechanisms bywhich malware installs itself and how it operates [10, 1�,�7]. In this work, we are more interested in structuralproperties of the distribution sites themselves, and howmalware behaves once it has been implanted. Therefore,we do not employ tainting because of its computationalexpense, and instead, simply collect changes made by themalware that do not require having the ability to trace theinformation flow in detail.
10 Conclusion
The fact that malicious URLs that initiate drive-by down-loads are spread far and wide raises concerns regardingthe safety of browsing the Web. However, to date, littleis known about the specifics of this increasingly commonmalware distribution technique. In this work, we attemptto fill in the gaps about this growing phenomenon by pro-viding a comprehensive look at the problem from severalperspectives. Our study uses a large scale data collectioninfrastructure that continuously detects and monitors thebehavior of websites that perpetrate drive-by downloads.Our in-depth analysis of over 66 million URLs (spanninga 10 month period) reveals that the scope of the problem
is significant. For instance, we find that 1.3% of the in-coming search queries to Google’s search engine returnat least one link to a malicious site.
Moreover, our analysis reveals several forms of rela-tions between some distribution sites and networks. Amore troubling concern is the extent to which users maybe lured into the malware distribution networks by con-tent served through online Ads. For the most part, thesyndication relations that implicitly exist in advertisingnetworks are being abused to deliver malware throughAds. Lastly, we show that merely avoiding the darkcorners of the Internet does not limit exposure to mal-ware. Unfortunately, we also find that even state-of-the-art anti-virus engines are lacking in their ability to protectagainst drive-by downloads. While this is to be expected,it does call for more elaborate defense mechanisms tocurtail this rapidly increasing threat.
Acknowledgments
We would like to thank Oliver Fisher, Dean Mc-Namee, Mark Palatucci and Ke Wang for their help withGoogle’s malware detection infrastructure. This workwas funded in part by NSF grants CNS-0��7�11 andCNS-0��0���.
References
[1] The open directory project. See http://www.news.com/2100-1023-877568.html.
[�] Safe Browsing API, June �007. See http://code.google.com/apis/safebrowsing/.
[�] Safe Browsing diagnostic page, May �00�. Seehttp://www.google.com/safebrowsing/diagnostic?site=yoursite.com.
[�] ANAGNOSTAKIS, K. G., SIDIROGLOU, S., AKRITIDIS,P., XINIDIS, K., MARKATOS, E., AND KEROMYTIS,A. D. Detecting Targeted Attacks Using Shadow Hon-eypots.
[�] ANDERSON, D. S., FLEIZACH, C., SAVAGE, S., AND
VOELKER, G. M. Spamscatter: Characterizing Inter-net Scam Hosting Infrastructure. In Proceedings of theUSENIX Security Symposium (August �007).
[�] BARFORD, P., AND YAGNESWARAN, V. An Inside Lookat Botnets. Advances in Information Security. Springer,�007.
[7] BEM, J., HARIK, G., LEVENBERG, J., SHAZEER, N.,AND TONG, S. Large scale machine learning and meth-ods. US Patent: 7���1�7.
[�] COOKE, E., JAHANIAN, F., AND MCPHERSON, D. TheZombie Roundup: Understanding, Detecting, and Dis-turbing Botnets. In Proceedings of the first Workshop on

USENIX Association 17th USENIX Security Symposium 1�
Steps to Reducing Unwanted Traffic on the Internet (July�00�).
[�] DEAN, J., AND GHEMAWAT, S. Mapreduce: Simplifieddata processing on large clusters. In Proceedings of theSixth Symposium on Operating System Design and Imple-mentation (Dec �00�), pp. 1�7–1�0.
[10] EGELE, M., KRUEGEL, C., KIRDA, E., YIN, H., AND
SONG, D. Dynamic Spyware Analysis. In Proceedings ofthe USENIX Annual Technical Conference (June �007).
[11] FRANKLIN, J., PAXSON, V., PERRIG, A., AND SAVAGE,S. An Inquiry into the Nature and Causes of the Wealth ofInternet Miscreants. In Proceedings of the ACM Confer-ence on Computer and Communications Security (CCS)(October �007).
[1�] GU, G., PORRAS, P., YEGNESWARAN, V., FONG, M.,AND LEE, W. BotHunter: Detecting Malware Infectionthrough IDS-driven Dialog Correlation. In Proceedings ofthe 16
th USENIX Security Symposium (�007), pp. 1�7–
1��.
[1�] MODADUGU, N. Web Server Soft-ware and Malware, June �007. Seehttp://googleonlinesecurity.blogspot.com/2007/06/web-server-software-and-malware.html.
[1�] MOORE, D., VOELKER, G. M., AND SAVAGE, S. Infer-ring Internet Denial of Service Activity. In Proceedingsof 10
th USENIX Security Symposium (Aug. �001).
[1�] MOSER, A., KRUEGEL, C., AND KIRDA, E. ExploringMultiple Execution Paths for Malware Analysis. In Pro-ceedings of the 2007 IEEE Symposium on Security andPrivacy (May �007).
[1�] MOSHCHUK, A., BRAGIN, T., DEVILLE, D., GRIBBLE,S., AND LEVY, H. SpyProxy: Execution-based Detectionof Malicious Web Content.
[17] MOSHCHUK, A., BRAGIN, T., GRIBBLE, S., AND
LEVY, H. A crawler-based study of spyware in the web.In Proceedings of Network and Distributed Systems Secu-rity Symposium (�00�).
[1�] POLYCHRONAKIS, M., MAVROMMATIS, P., AND
PROVOS, N. Ghost Turns Zombie: Exploring the LifeCycle of Web-based Malware. In Proceedings of the 1stUSENIX Workshop on Large-Scale Exploits and Emer-gent Threats (LEET) (April �00�).
[1�] PROJECT, H., AND ALLIANCE, R. Know your enemy:Tracking Botnets, March �00�. See http://www.honeynet.org/papers/bots/.
[�0] PROVOS, N., MCNAMEE, D., MAVROMMATIS, P.,WANG, K., AND MODADUGU, N. The Ghost in theBrowser: Analysis of Web-based Malware. In Proceed-ings of the first USENIX workshop on hot topics in Bot-nets (HotBots’07). (April �007).
[�1] RAJAB, M. A., ZARFOSS, J., MONROSE, F., AND
TERZIS, A. A Multifaceted Approach to Understand-ing the Botnet Phenomenon. In Proceedings of ACMSIGCOMM/USENIX Internet Measurement Conference(IMC) (Oct., �00�), pp. �1–��.
[��] RAMACHANDRAN, A., FEAMSTER, N., AND DAGON,D. Revealing Botnet Membership using DNSBLCounter-Intelligence. In Proceedings of the 2nd Work-shop on Steps to Reducing Unwanted Traffic on the Inter-net (SRUTI) (July �00�).
[��] The Route Views Project. http://www.antc.uoregon.edu/route-views/.
[��] SEIFERT, C., STEENSON, R., HOLZ, T., BING, Y., AND
DAVIS, M. A. Know Your Enemy: Malicious WebServers. http://www.honeynet.org/papers/mws/, August �007.
[��] WANG, Y.-M., BECK, D., JIANG, X., ROUSSEV, R.,VERBOWSKI, C., CHEN, S., AND KING, S. Automatedweb patrol with strider honeymonkeys. In Proceedingsof Network and Distributed Systems Security Symposium(�00�), pp. ��–��.
[��] WANG, Y.-M., NIU, Y., CHEN, H., BECK, D.,JIANG, X., ROUSSEV, R., VERBOWSKI, C., CHEN,S., AND KING, S. Strider honeymonkeys: Ac-tive, client-side honeypots for finding malicious web-sites. See http://research.microsoft.com/users/shuochen/HM.PDF.
[�7] YIN, H., SONG, D., EGELE, M., KRUEGEL, C., AND
KIRDA, E. Panorama: Capturing System-wide Informa-tion Flow for Malware Detection and Analysis. In Pro-ceedings of the 14th ACM Conference of Computer andCommunication Security (October �007).
Notes1Some compromised web servers also trigger dialog windows ask-
ing users to manually download and run malware. However, this anal-ysis considers only malware installs that require no user interaction.
�This mapping is readily available at Google.�We consider a version as outdated if it is older than the latest corre-
sponding version released by January, �007 (the start date for our datacollection).
�We restrict our analysis to Windows executables identified bysearching for PE headers in each payload.