Embed Size (px)
Citation preview

ALL THE BEST FOR THE FUTUREAnnual Report 2015/16
Ann
ual R
epor
t 201
5/16
All
the
Best
for t
he F
utur
e

5.4.3.2.1.
REASONS TO INVEST IN AURUBIS SHARES
THE AURUBIS GROUP IN FIGURES
Sustainable investment, stable shareholder
structure and a consistent dividend policy
Diversified business model with leading position along the
copper value chain
Innovative, strong company with extensive
expertise in metal extraction, processing
and recycling
Risk-averse business model with first-class risk
management systems
Good earnings history; stable balance sheet
structure and robust cash flows
Concentra
te th
rough
put
Copper scr
ap in
put
Cathode o
utput
Wire
rod outp
ut
Continuous c
ast s
hapes
output
Flat r
olled pro
ducts an
d
spec
ialty
wire outp
ut
Input/outputin thousand t (previous year in parentheses)
Human resourcesNumber of employees (personnel expenses in € million in parentheses)
IFRS 2015/16 3) 2014/15 3) Change
ResultsRevenues € million 9,475 10,995 –14 %EBITDA € million 312 336 –7 %Operating EBITDA € million 358 500 –28 %EBIT € million 177 200 –12 %Operating EBIT € million 229 370 –38 %EBT € million 159 170 –6 %Operating EBT 1) € million 213 343 –38 %Consolidated net income € million 124 134 –7 %Operating consolidated net income € million 165 257 –36 %Net cash flow € million 236 365 –35 %Operating ROCE 1) % 10.9 18.7 – Aurubis sharesMarket capitalization € million 2,242 2,558 –12 %Earnings per share € 2.71 2.95 –8 %Operating earnings per share € 3.64 5.68 –36 %Dividend per share 2) € 1.25 1.35 –7 %
1) Corporate control parameters.2) 2015/16 figure is the proposed dividend.3) Values have been “operationally” adjusted for measurement effects deriving from the use of the average cost method in accordance with IAS 2, from copper price-related
measurement effects on inventories and from purchase price allocation impacts, primarily on property, plant and equipment, commencing from fiscal year 2010/11 onwards.
o T 001
2011/
12
2012/13
2013/
14
2014
/15
2015/
16
1) Excluding Schwermetall Halbzeugwerk GmbH & Co. KG.
6,372(421)
6,563(429)
6,359 1)
(415)6,321 1)
(431)6,454 1)
(449)2,156
(2,295)
253(294)
1,084(1,138) 758
(764)172
(170)218
(216)

AURUBIS – ALL THE BEST FOR THE FUTUREWe are 150 years young and still have many good years ahead of us. That’s because we supply high-purity copper, a material that is essential for many emerging technologies, and thus a key element in modern society. It’s because we take the expectations of our employees, suppliers, customers and other interest groups seriously and learn from these stakeholders. And it’s because we are increasingly creating real closed cycles in the copper value chain, making our production processes even more sustainable and environmentally friendly.
The next 150 years of Aurubis have just begun – read about our successful start in this report.
TABLE OF CONTENTS
2 Letter from the Management Board
4 Interview with Jürgen Schachler
8 All the Best for the Future
10 All the Best for the World
14 All the Best for Our Group
18 All the Best for People
22 Company Management
26 Supervisory Board Report
31 Corporate Governance
45 Aurubis Shares on the
Capital Market
51 Combined Management Report
11 1 Consolidated Financial Statements
118 Notes to the Consolidated
Financial Statements
192 Responsibility Statement
193 Auditors’ Report
195 Further Information
Detailed tables of contents for the Combined Management Report and the Consolidated Financial Statements can be found on pages 51 and 111.
2016 SITES
EUROPE22 sites
USA2 sites
Entire Aurubis Group33 sites worldwide
ASIA9 sites
Aurubis Annual Report 2015/16
1

Dr. Stefan BoelExecutive Board Member for Business Unit Copper Products
Erwin FaustChief Financial Officer
Jürgen SchachlerExecutive Board Chairman
2

We successfully concluded Aurubis AG’s fiscal year 2015/16 at the end of September and are wrapping up our anniversary year 2016 as well. The past several months have been very poignant. We received many words of congratulation – from employees and their families, from business partners around the world, from representatives of government and society, from institutions and interest groups and, not least, from our company’s shareholders. Feeling the strength of these bonds during our anniversary year moved us, and pushes us to continue adding chapters to the Aurubis success story.
Times have not become easier, and uncertainties have increased. The past fiscal year showed once again that the international commodity markets are influenced by political and economic events. Pure market data is not enough to provide accurate analyses and assessments.
The year 2016 was marked in particular by the historic vote of the British people to remove their country from the European Union. The reduced economic growth of commodity giant China was on market analysts’ risk list yet again. We followed the development of the US interest rate policy and the US dollar as well as the polarizing election of the US president just as closely as we did the escalation of tensions in the Middle East.
The uncertain overall economic and political conditions were also reflected in an unusually varied price trend for industrial and precious metals. While gold and zinc were the big price winners in 2016, the price recovery bypassed copper this time. This is notable because the global copper market indicated a distinct production deficit in the first half of 2016. From our perspective, the fact that there wasn’t another, more dramatic price decline on the London Metal Exchange up to the end of the year is only a small consolation.
The trend on the markets for our raw materials and products was also varied. While the supply of copper concentrates allowed for good volume levels and high treatment and refining charges, the supply situation for copper scrap
Aurubis Annual Report 2015/16
3

Dr. Stefan BoelExecutive Board Member for Business Unit Copper Products
Erwin FaustChief Financial Officer
Jürgen SchachlerExecutive Board Chairman
2

was unsatisfactory for long periods of the fiscal year. Sales of sulfuric acid were not very convincing either, as prices on the market were weak. In contrast, the copper products business was satisfactory overall, with a good trend in rod sales.
The results of fiscal year 2015/16 were good when compared with past years, allowing for a suitable dividend for our shareholders. However, it did not come close to the record results of the previous year, in which all of the relevant factors developed positively. So we ask ourselves if we are satisfied by this – the answer is a clear “no”.
To set the course for a successful future, we have to remove ourselves from a short-term mindset, now more than ever. For this reason, we started several different initiatives in late July 2016. We want to know: What do we do well? How do we compare to the competition? First and foremost, what can we improve? External consultancies are supporting us in answering these questions. The results will lead to concrete improvements starting in 2017. At the same time, we are working within the Executive Board on developing a clear vision for Aurubis with an internal management team. Based on this vision, we will adjust the company strategy before spring 2017.
We will therefore create a starting point from which to continue successfully developing the company. So fiscal year 2016/17 will be a year of change. We will improve Aurubis from the inside out to prepare ourselves for all of the changes in our business environment. We hope that you will continue to join us on this path. We will of course update you about the progress we make along the way.
Sincerely,
Jürgen Schachler Dr. Stefan Boel
Executive Board CVs »
Aurubis Annual Report 2015/16
3

Dr. Stefan BoelExecutive Board Member for Business Unit Copper Products
Erwin FaustChief Financial Officer
Jürgen SchachlerExecutive Board Chairman
2

EXECUTIVE BOARD
Jürgen Schachlerstarted his career in the chemical industry after studying economics. He then switched to the metal processing industry, where he initially held positions in marketing and sales. Starting in 1993, he served in the management of various companies of ArcelorMittal Luxembourg. He has worked in management positions abroad in the USA, Thailand and Canada. In 2013 Jürgen Shachler assumed the position of CEO of ArcelorMittal Europe, Flat Product, Business Division South West, where he was responsible for 10,000 employees. Effective July 1, 2016, he was appointed Chairman of the Aurubis AG Executive Board. In addition, he oversees BU Primary Copper and serves as Director of Industrial Relations.
Dr. Stefan Boelworked from 2001 in Product Development and Marketing in the former Copper Division of Umicore and subsequently became the commercial director of the Umicore plant in Bulgaria. After the demerger of Cumerio from the Umicore Group, Dr. Boel became Vice President Copper Refining and Mining Projects and a member of the Executive Committee. As part of the integration of Cumerio in the Aurubis Group, he joined the Executive Board in 2008. He is responsible for BU Copper Products.
Erwin Faustheld managerial positions in the Volkswagen Group, at VAW Aluminium and from 2003 at Novelis Europa, a sub-group of Novelis Inc. (formerly Alcan Inc.). As the Chief Financial Officer there, he served on the supervisory committees of the European companies and for a time as the commercial director of the German company. Erwin Faust was appointed Chief Financial Officer of the Aurubis Executive Board in 2008. He was interim Executive Board Spokesman from November 1, 2015 to June 30, 2016.
Aurubis Annual Report 2015/16
3

4

“ We have to make the Group even more crisis-proof and fit for the future. There is potential for this in
many areas.” – Jürgen Schachler
Jürgen Schachler assumed the role of Aurubis AG Executive Board Chairman on July 1, 2016. The 62-year-old manager comes from the steel sector and worked for the steel group ArcelorMittal for many years. He has extensive management experience and most recently oversaw ArcelorMittal’s flat product line in southwest Europe with 10,000 employees.
Mr. Schachler, the post of Aurubis Executive Board Chairman was vacant for a while, so in the interim Dr. Drouven from the Supervisory Board stepped in, and later Mr. Faust from the Aurubis Executive Board. How did Aurubis find you?
An HR consultant established contact initially. The non-ferrous metals industry is relatively small, and the search for a suitable manager quickly reaches its limits based on that fact alone. So it makes sense to look to the steel industry, which, despite all the differences, is also a metal sector. And that’s where they found me.
It’s the first time that the position of Executive Board Chairman has been filled by someone from outside the company. Does this provide a special kind of motivation for you?
I can’t deny that it does. In my new job, I can certainly contribute a great deal of experience from my long career, the international business and my
involvement with many nations and employees in a global company. What I find especially exciting about this new role is that the possibilities for shaping things are different in a company in the copper industry than they were in my earlier work in steel – an industry driven by circumstances that can’t be controlled. Aurubis is a company with a solid business model, a leading market position and healthy corporate development. The 150-year history speaks for itself. However, a new phase begins for Aurubis with this anniversary – and in times that aren’t exactly calm. We have to adjust to this and make the Group even more crisis-proof and fit for the future. There is potential for this in many areas.
That sounds like a lot of work. Do you have any particular focal points for this process?
I’ve now been in the company for a good half-year and have had many discussions during this period that have helped me get to know people better and gain a good overview. I’ve seen many positive approaches and a strategy that, in my opinion, makes a lot of sense. Nevertheless, I think that previously established strategies shouldn’t be viewed as guidelines that are set in stone but should be critically assessed and questioned again and again as they are implemented. This can’t be done by one person from above but only works in a controlled
INTERVIEW WITH JÜRGEN SCHACHLER
Aurubis Annual Report 2015/16
5

“I enjoy listening, balancing ideas and trying in discussions to collaborate and establish a common position from
different opinions.” – Jürgen Schachler
process involving different levels and divisions. This process started in the fall and is expected to deliver initial results in spring 2017. Furthermore, we have a number of other projects in the company that tangibly serve to make Aurubis even more crisis-proof. This report includes a few details about these projects.
So you want to make the company even more successful. What is needed to achieve that?
First and foremost, our employees. I’ve already spoken with many of them, and not just at the headquarters in Hamburg. I’ve been able to form an idea of employees’ ways of thinking and their views at the other sites as well. Furthermore, we’ve started a group-wide employee survey that should provide us with indications about the “health” of the organization. When I talk about employees as a success factor, I think about their qualifications, their motivation. Do I sense some kind of enthusiasm for the work that they do? What are the attitudes towards management and collaboration within the company? Appreciative, cooperative? And above all: Do I see a willingness to learn with the goal of improving the situation? If this is the case, then success should be attainable.
And you yourself? How do you view yourself in this process?
I rarely take extreme positions. Instead, I like to build bridges and seek out direct contact with people. I enjoy listening, balancing ideas and trying in discussions to collaborate and establish a common position from different opinions. I’m a strong advocate of teamwork and ultimately think that it is more successful than an “every man for himself” mentality.
Mr. Schachler, Aurubis is a stock corporation and the shares are listed on the German stock index MDAX. Would you invest in Aurubis shares even if you weren’t Aurubis’ CEO?
When I introduced myself at the last Annual General Meeting, I mentioned that I had already invested in Aurubis shares before my initial contact with the HR consultant. At that time, the shares fit into my investing strategy, which, among other things, is focused on shareholding in companies that have a solid business model and a real history. This was true of Aurubis then, and it still applies today.
Aurubis Annual Report 2015/16
6

7

8

The first 150 years of Aurubis are behind us. We marked this milestone in appropriate style during 2016 at a number of events and with a comprehensive anniversary book. There were countless talks and we received many good wishes – for what we have already achieved, but first and foremost for a successful future. And this is what ultimately matters.
Fiscal year 2015/16 wasn’t just a year of celebration and recollection for Aurubis, but also a year of transition, of defining our position, of taking a deep breath before starting on a new chapter in our story, into the next 150 years. Because Aurubis will change just as much as the world around us in the coming years. It is a world full of possibilities, but also of challenges – for the employees and for the company. Together, it is up to us to make the best of it.
ALL THE BEST FOR THE FUTURE
Aurubis Annual Report 2015/16
9

>
Sought-after qualities
For 150 years we have supplied the world with copper – a basic material that is crucial for the development of modern societies. The diverse qualities of the “red metal” are what make it so valuable: copper conducts electricity and heat better than any other metal apart from silver; it is easily processed and alloyed; it is exceptionally durable and corrosion-resistant, and it can be reprocessed an infinite number of times – without any reduction in quality.
Whenever electricity production, conversion and distribution or electronic applications are involved, copper is indispensable: in developing energy grids in newly industrialized countries, as well as in converting existing grids to accommodate alternative energies and decentralized structures. From wind turbines to power plants to electrical outlets – copper transports energy efficiently. Whether in building technology, in machines and equipment, or in cars present and future, copper always plays a part.
Square yet versatile
Demand for copper is increasing strongly in regions where living standards are rising. For example, China in particular has become a leading driver of growth in the copper market. But the further developed industrialized countries have also stayed true to the metal and are recording demand growth. We reach the international markets via a global marketing and distribution network that is guided centrally from the Group headquarters in Hamburg. Continuous cast wire rod, continuous cast shapes, rolled products for industry and architecture, bars and profiles are marketed and sold – all in different compositions and dimensions. The classic starting product for the manufacture of all of these products is the copper cathode, a square copper plate of the highest purity, which is the format for the international copper trade on the metal exchanges. Surplus volumes from the four tankhouses in the Aurubis Group, i.e. volumes that aren’t used to manufacture products internally, are therefore easily marketed internationally as well.
ALL THE BEST FOR THE WORLD
was the official settlement price for a ton of copper cathodes
on the London Metal Exchange on September 30, 2016
CONNECTED WITH THE WORLD
It’s a long way from the mine to our smelters. After thousands of nautical miles, the raw material, copper concentrate, reaches us from countries such as Chile, Peru and Canada. Once it arrives in maritime vessels, it is transported to our plants in Pirdop and Hamburg by rail or by water with smaller barges.
More information about the London Metal Exchange: www.lme.com
US$ 4,832
10

11

AURUBIS ALSO DRIVES WITH ELECTRICITY
Jan-Philip Drzymalla and the Environmental Protection Department’s electric car
12

The future contains copper
Copper is timeless. It was already in use before our modern calendar was established, and new applications are continually being developed. Entire growth sectors rely on copper as a basic material. The German Raw Material Agency confirms this trend, stating in a recent study: “Most emerging technologies are inconceivable without copper.” In
the year 2035, a total of 5,000,000 t of copper will be needed for electric transaction engines in hybrid, electric and fuel cell vehicles alone. Wind turbines and 3D printing are two other growth areas with copper demand. And yet another feature makes copper especially viable for the future: it is a sustainable metal thanks to its optimal recyclability.
of copper are used in an electric car on average, and about 25 kg can be
found in any mid-range car
Up to 100 kg
Source: Marscheider-Weidemann, F., Langkau, S., Hummen, T., Erdmann, L., Tercero Espinoza, L., Angerer, G., Marwede, M. & Benecke, S. (2016): Raw Materials for Emerging Technologies 2016. DERA Raw Material Information 28, Berlin
2013Marginal
2013162
201346
2013103,000
20355,000,000
203510,800
20359,380
2035244,098
Engines for electric cars 3D printing RFID chips Wind power
Copper demand in selected emerging technologies in t
Aurubis Annual Report 2015/16
13

ALL THE BEST FOR OUR GROUP
of refined copper are needed worldwide each year, and demand is growing steadily
23 million t
Our place in a new world
There has been more change in the last 10 years than during the 90 years before, and developments are progressing more and more quickly. We are orienting ourselves to this reality. Our corporate strategy was last updated in fiscal year 2012/13, when we recognized that our business is especially influenced by megatrends: energy is being generated using increasingly decentralized methods, transferred in new ways and consumed in larger and larger volumes worldwide. The global population is growing – and, along with it, large urban centers. The world’s expanding middle class is using more and more electronics and new forms of transportation. All of these developments have one thing in common: copper. Copper resources are not infinitely available. The importance of recycling as a copper production
method will therefore increase. Since the complexity of products and raw materials is rising, however, expertise is in high demand. Expertise that we have in spades.
Issues that move us
Even as conditions are shifting, some established truths remain constant: our expertise in copper production and processing, our innovative strength, our qualified employees and our knowledge about copper. Building on this solid foundation, we want to pursue new paths to an even larger extent in the future – for example, the stronger orientation towards value in the sourcing and processing of complex raw materials.
Aurubis Annual Report 2015/16
14

15

16

>
Furthermore, we will regularly review our well-functioning business model to ensure that it is equipped for the future. In what areas are we better than our competitors? Where do opportunities present themselves? How are our suppliers and customers changing? How do we approach these changes? Where will the boundaries between suppliers, competitors and customers be in the years to come? A single company could assume all of these roles in the future – and also be our partner at the same time, for instance in strategic raw material procurement, brokering of project financing or technical product development.
As part of the “closing the loop” concept, we are investigating ways that we can connect the sale of our copper products directly with the return of production residues to us. These kinds of closed cycles offer advantages for all participants when it comes to efficiency, predictability and supply security.
Issues that move us – these topics will be considered intensively when we put the Aurubis Group’s vision and strategy to the test again in fiscal year 2016/17.
All the best for Aurubis: a wish and a standard that will guide us in our strategy discussion.
No victory ceremonies without copper
A total of 2,448 medals were produced for the Olympic Games in Rio de Janeiro. The main goal for all athletes: the gold medal. Strictly speaking, its name is a little misleading because each gold medal is 98.8 % silver and only 1.2 % gold, although the silver medals in Rio were actually 100 % silver. And copper is always on the winners’ podium as well, as bronze medals are 95 % “red gold” and 5 % tin.
Additional information: www.compoundchem.com
Ready to be reused after an average of 30 years – the recycling potential of copper is increasingProcessed copper in products and infrastructure worldwide, in million t Cu
0
100
200
300
400
1980 19851990
199520
0020
0520
1020
15
Source: Fraunhofer Institute, Aurubis
Aurubis Annual Report 2015/16
17

>
Copper is good for you
Did you know that you have a little bit of copper inside you? Copper is an essential element for all organisms. The recommended daily allowance for an adult is 1.4 mg, which is normally ingested through food – such as avocados, nuts, dark chocolate, granola and oysters. And copper is also good for human health outside of the body, as it is antimicrobial, i.e. it provides protection from bacteria. This is the main reason why water pipes in houses are made of copper. The same feature can also improve health in public buildings, as a majority of all contagious illnesses are transmitted through contact. It therefore makes sense to produce door handles, light switches and handrails from copper – especially in locations where many people are present and in sensitive facilities such as hospitals. For example, hospital bacteria are reduced by over 90 % with the use of copper. Handles made of antimicrobial copper are already being used in public transport as well.
ALL THE BEST FOR PEOPLE
less bacteria in hospitals as a result of copper’s
antimicrobial properties
90 %
Additional information about copper’s antimicrobial properties: www.antimicrobialcopper.org
Furthermore, the antimicrobial effect of copper surfaces never decreases – even when they are used intensively.
Benefits for our employees, too
We thus produce a product that promotes human health. Health promotion is a key topic for Aurubis as an employer as well. At all Group sites, we have initiated occupational safety programs to limit the risk of accidents as much as possible. Avoiding injuries is the minimum target, while ensuring employees’ health is the larger objective. Our company health management is part of the Group strategy; it has been established sustainably and is linked to clearly defined goals. For instance, we have set up a number of preventive programs to maintain employees’ health, including flu vaccinations, expanded preventive check-ups and analysis-based intensive training for the stomach and back muscles. Ultimately, there can only be one goal: zero work-related accidents, injuries and illnesses.
PLEASE TOUCH!
Hospitals including, for example, Charité in Berlin, the Niederberg Velbert Clinic, Hagen General Hospital and the Asklepios Clinic in Hamburg have all had good experience with contact surfaces made of copper. A US study showed that in intensive care units, copper surfaces can reduce infections caused by hospital stays by 58 %.
Aurubis Annual Report 2015/16
18

Aurubis Annual Report 2015/16
19

apprentices at the Hamburg plant alone are learning
skills to equip them for their future work
180
20

442
6
174
Ø KupferhüttenWelt
AurubisHamburg
Aurubis Pirdop
Ø KupferhüttenEuropa
Im internationalen Vergleich nimmt Aurubis eine Spitzenposition bei der Verminderung der spezifischen Schwefeldioxidemissionen ein, die bei der Kupfererzeugung aus Kupfererzkonzentraten entstehen.
442
6
174
Ø Internationalcopper smelters
AurubisHamburg
Aurubis Pirdop
Ø Europeancopper smelters
When compared internationally, Aurubis has a top position in decreasing specific sulfur dioxide emissions, which are formed when copper is produced from copper concentrates.
442
6
174
Ø KupferhüttenWelt
AurubisHamburg
Aurubis Pirdop
Ø KupferhüttenEuropa
Im internationalen Vergleich nimmt Aurubis eine Spitzenposition bei der Verminderung der spezifischen Schwefeldioxidemissionen ein, die bei der Kupfererzeugung aus Kupfererzkonzentraten entstehen.
442
6
174
Ø KupferhüttenWelt
AurubisHamburg
Aurubis Pirdop
Ø KupferhüttenEuropa
Im internationalen Vergleich nimmt Aurubis eine Spitzenposition bei der Verminderung der spezifischen Schwefeldioxidemissionen ein, die bei der Kupfererzeugung aus Kupfererzkonzentraten entstehen.
442
6
174
Ø KupferhüttenWelt
AurubisHamburg
Aurubis Pirdop
Ø KupferhüttenEuropa
Im internationalen Vergleich nimmt Aurubis eine Spitzenposition bei der Verminderung der spezifischen Schwefeldioxidemissionen ein, die bei der Kupfererzeugung aus Kupfererzkonzentraten entstehen.
442
6
174
Ø KupferhüttenWelt
AurubisHamburg
Aurubis Pirdop
Ø KupferhüttenEuropa
Im internationalen Vergleich nimmt Aurubis eine Spitzenposition bei der Verminderung der spezifischen Schwefeldioxidemissionen ein, die bei der Kupfererzeugung aus Kupfererzkonzentraten entstehen.
Resources are finite and must be managed sustainably. The importance of recycling processes is therefore growing steadily for us. This applies to copper first and foremost, which is in countless products and can be reused without a loss of quality. However, we can also process a number of other elements through multi-metal recycling, including precious metals, nickel, tin, lead and zinc. Last year alone, we directed up to 700,000 t of material to suitable recycling processes in this way. We therefore close the material cycle for many raw materials, open up new business areas and contribute to conserving natural resources at the same time.
Incidentally, there is not only competition for resources. On the labor market, too, we have to continuously prove ourselves to be an attractive employer. Demographic change is intensifying this competition for skilled employees. Training and continuing education are central for the sustainable success of our Group. Our high training and apprentice retention rates are therefore not only good for our employees, but also for Aurubis as a whole.
Highest environmental standard worldwideCopper smelters’ SO2
emissions in kg SO2 /t copper output
Our commitment doesn’t end at the plant gates
We are aware of our responsibility as a manufacturing company. It is self-evident to us that the impact of our business activities on the environment and people should be kept as low as possible. It is a complex challenge in light of the high throughput volume and energy consumption necessarily associated with copper production. To fulfill this responsibility, we integrate sustainability directly into our corporate strategy. It starts with sustainability monitoring in the supply chains and is also evident in the fact that we spend large sums on environmental protection in copper production every year. In general, one-third of all Group investments is spent on related measures. This is why we are one of the most progressive copper producers in the world when it comes to climate and environmental protection.
Our targets don’t only apply to the Group as a whole. We have also set targets for individual sites – both in terms of environmental protection and energy efficiency. We utilized scheduled production shutdowns at our plants in Hamburg and Pirdop not just to overhaul certain facilities and optimize processes – but also to implement more extensive environmental protection measures. In Hamburg, for example, a new facility was installed to optimize the recovery of silver and gold from anode slime, an intermediate product. This allows us to reduce energy consumption by 35 % and CO2 by 460 t.
FIT FOR THE FUTURE
Robin Brasch and Eloge Lossa Sossou, first-year apprentices, take measurements. Our comprehensive vocational program to train young people as experts in various fields is also a good fit. We focus on continuity and thus take on the demographic challenges of the future.
Aurubis Annual Report 2015/16
21

Executive Board
Jürgen Schachler, HamburgBorn: July 31, 1954Chief Executive Officer, Director of Industrial Relations and Executive Board Member for Business Unit Primary Copper since July 1, 2016,appointed until June 30, 2019 Dr. Stefan Boel, Hamme, BelgiumBorn: June 9, 1966Executive Board Member for Business Unit Copper Products, from November 1, 2015 to June 30, 2016 Executive Board Member for Business Unit Primary Copper on an interim basis,appointed until April 30, 2021
» Aurubis Belgium nv/sa, Brussels, Belgium Chairman of the Board of Directors
Erwin Faust, HamburgBorn: January 4, 1957Chief Financial Officer, from November 1, 2015 to June 30, 2016 Executive Board Spokesman, Director of Industrial Relations and responsible for Corporate Functions on an interim basis, appointed until September 30, 2018
» Aurubis Belgium nv/sa, Brussels, Belgium Director
The Supervisory Board passed a resolution to temporarily release Mr. Faust, by mutual agreement, from his duties and obligations as CFO of Aurubis AG due to illness. Dr. Bernd Drouven, Hamburg, until October 31, 2015Born: September 19, 1955Chief Executive Officer and Executive Board Member for Business Unit Primary Copper, from July 1, 2015 to October 31, 2015 Director of Industrial Relations (dispatched from the Supervisory Board to the Executive Board from November 1, 2014 to October 31, 2015)
» NITHH gGmbH, Hamburg Chairman of the Supervisory Board
Company Management
Aurubis Annual Report 2015/16
22

Supervisory Board
Prof. Dr.-Ing. Heinz Jörg Fuhrmann, SalzgitterChairman, Chairman of the Executive Board of Salzgitter AG, Salzgitter
» Hüttenwerke Krupp Mannesmann GmbH, Duisburg + Chairman of the Supervisory Board since July 2, 2016
» Ilsenburger Grobblech GmbH, Ilsenburg + Chairman of the Supervisory Board
» KHS GmbH, Dortmund + Chairman of the Supervisory Board
» Mannesmannröhren-Werke GmbH, Mülheim/Ruhr + Chairman of the Supervisory Board
» Öffentliche Lebensversicherung Braunschweig, Braunschweig Member of the Supervisory Board
» Öffentliche Sachversicherung Braunschweig, Braunschweig Member of the Supervisory Board
» Peiner Träger GmbH, Peine + Chairman of the Supervisory Board
» Salzgitter Flachstahl GmbH, Salzgitter + Chairman of the Supervisory Board
» Salzgitter Mannesmann Grobblech GmbH, Mülheim/Ruhr +
Chairman of the Supervisory Board » Salzgitter Mannesmann Handel GmbH, Düsseldorf +
Chairman of the Supervisory Board » TÜV Nord AG, Hanover
Member of the Supervisory Board
Renate Hold-Yilmaz, Hamburg *Deputy Chairwoman, clerical employee,Chairwoman of the Works Council of Aurubis AG
Burkhard Becker, HattingenMember of the Executive Board of Salzgitter AG, Salzgitter
» EUROPIPE GmbH, Mülheim/Ruhr + Member of the Supervisory Board
» Ilsenburger Grobblech GmbH, Ilsenburg + Member of the Supervisory Board
» KHS GmbH, Dortmund + Member of the Supervisory Board since July 1, 2016
» Mannesmannröhren-Werke GmbH, Mülheim/Ruhr + Member of the Supervisory Board
» Nord/LB Asset Management AG, Hanover Member of the Supervisory Board
» Peiner Träger GmbH, Peine + Member of the Supervisory Board
» Salzgitter Flachstahl GmbH, Salzgitter + Member of the Supervisory Board until September 30, 2016
» Salzgitter Mannesmann Grobblech GmbH, Mülheim/Ruhr + Member of the Supervisory Board
» Salzgitter Mannesmann Handel GmbH, Düsseldorf + Member of the Supervisory Board since July 1, 2016
» Salzgitter Mannesmann Precision GmbH, Mülheim/Ruhr + Member of the Supervisory Board
Dr. Bernd Drouven, HamburgReturned to the Supervisory Board on November 1, 2015,former Chief Executive Officer of Aurubis AG
» NITHH gGmbH, Hamburg Chairman of the Supervisory Board
+ group companies of Salzgitter AG* elected by the employees
Company Management
Aurubis Annual Report 2015/16
2331 Corporate Governance45 Aurubis Shares
22 Executive Board23 Supervisory Board26 Supervisory Board Report

Jan Koltze (formerly Eulen), Kummerfeld *District Manager of the Mining, Chemical and Energy Industrial Union Hamburg-Harburg
» ESSO Deutschland GmbH, Hamburg Member of the Supervisory Board
» ExxonMobil Central Europe Holding GmbH, Hamburg Member of the Supervisory Board
Dr.-Ing. Joachim Faubel, Hamburg *Employee in Corporate Controlling at Aurubis AG
Dr. Sandra Reich, SingaporeMember of the Executive Board of BÖAG Börsen AG, Hamburg and Hanover, until March 31, 2016Director, Head of German Desk, NORD/LB Singapore Branch, Norddeutsche Landesbank Girozentrale, Singapore, since August 1, 2016
Dr. med. Dipl.-Chem. Thomas Schultek, Lübeck *Head of Corporate Health Protection at Aurubis AG, Member of the Committee of Executive Representatives at Aurubis AG, Hamburg
Rolf Schwertz, Datteln *Bricklayer and boiler operator,Member of the Works Council of Aurubis AG, Lünen, and Chairman of the Central Representative Council of Employees with Disabilities of Aurubis AG
Prof. Dr. Fritz Vahrenholt, HamburgChairman of the Deutsche Wildtier Stiftung, Hamburg
» Capital Stage AG, Hamburg Member of the Supervisory Board
» Putz & Partner Unternehmensberatung AG, Hamburg Member of the Supervisory Board until March 31, 2016
Ralf Winterfeldt, Hamburg *Power electronics technician,Chairman of the General Works Council of Aurubis AG,Deputy Chairman of the Works Council of Aurubis AG
Dr.-Ing. Ernst J. Wortberg, DortmundSelf-employed consultant
+ group companies of Salzgitter AG* elected by the employees
Company Management
Aurubis Annual Report 2015/16
24

Supervisory Board Committees
Conciliation Committee in accordance with Section 27 (3) Law on Co-determinationProf. Dr.-Ing. Heinz Jörg Fuhrmann (Chairman) Renate Hold-Yilmaz (Deputy Chairwoman) Dr. Sandra Reich Ralf Winterfeldt
Audit CommitteeDr.-Ing. Ernst J. Wortberg (Chairman) Burkhard Becker Jan Koltze (formerly Eulen) Renate Hold-Yilmaz
Personnel CommitteeProf. Dr.-Ing. Heinz Jörg Fuhrmann (Chairman) Dr. Bernd Drouven (returned to the committee on November 1, 2015)Renate Hold-YilmazDr. med. Dipl.-Chem. Thomas SchultekProf. Dr. Fritz VahrenholtRalf Winterfeldt
Nomination CommitteeProf. Dr.-Ing. Heinz Jörg Fuhrmann (Chairman) Burkhard Becker Prof. Dr. Fritz Vahrenholt Dr.-Ing. Ernst J. Wortberg
Technology Committee Dr. Bernd Drouven (Chairman)Prof. Dr.-Ing. Heinz Jörg FuhrmannRenate Hold-YilmazDr. med. Dipl.-Chem. Thomas Schultek
Company Management
Aurubis Annual Report 2015/16
2531 Corporate Governance45 Aurubis Shares
22 Executive Board23 Supervisory Board26 Supervisory Board Report

Prof. Dr.-Ing. Heinz Jörg Fuhrmann
See Glossary, page 197.
Supervisory Board Report
The Aurubis Group generated operating earnings before taxes (operating EBT) of € 213 million in fiscal year 2015/16. The accomplishments of the Executive Board, management and employees in every department deserve our acknowl-edgement once again.
High sales of wire rod and shapes products, improved treat-ment and refining charges for copper concentrates and the optimized input mix had a positive impact. The strong dollar also contributed to the result.
The result was negatively influenced in particular by the scheduled shutdown in Pirdop, a lower copper scrap supply, a surplus of sulfuric acid with corresponding price pressure, a lower metal yield with falling metal prices and a lower cathode premium.
Collaboration between the Supervisory Board and Executive BoardThe joint target of the Executive Board and Supervisory Board is to increase the enterprise value of Aurubis AG and its Group companies in the long term.
The Executive Board notified the Supervisory Board regu-larly, promptly and comprehensively on all issues concerning the Company, both verbally and in two written reports per month. These issues included the corporate strategy, the planning process and important business transactions in the Company and the Group, the associated opportunities and risks, and issues of compliance.
With respect to Company management, the Supervisory Board and its committees closely supervised, carefully mon-itored and advised the Executive Board once again during fiscal year 2015/16, and performed the functions incumbent upon it by law, the Articles of Association and rules of procedure. The Supervisory Board is confident that the Company was managed lawfully and appropriately. The Supervisory Board was promptly and directly included in all decisions of fundamental importance for the Company, as explained in more detail below.
The Supervisory Board discussed in detail all transactions that were of importance for the Group on the basis of the Executive Board’s reports. The Supervisory Board agreed on the Executive Board’s suggested resolutions after thorough review and consultation.
The Supervisory Board continuously received detailed information about the Group’s earnings and employment developments, the individual Business Units and the Company’s financial position. The Executive Board provided extensive explanation of any deviations from established plans in terms of business performance, discussed their underlying causes and initiated measures in conjunction with the Supervisory Board.
The Chairman of the Supervisory Board was also in contact with the Executive Board, in particular the Executive Board
Company Management
Aurubis Annual Report 2015/16
26

Chairman, outside meetings, and communicated with them about current developments.
Consultations in the Supervisory BoardFour scheduled Supervisory Board meetings (on December 10, 2015; February 23, 2016; June 7, 2016; and September 28, 2016) and one extraordinary Supervisory Board meeting (on Octo-ber 2, 2015) were held in fiscal year 2015/16. Two resolutions were adopted by written consent in lieu of a meeting. Dr. Faubel was unable to participate in the extraordinary meet-ing (October 2, 2015) and was excused. In the Super visory Board meeting of February 23, 2016, Prof. Vahrenholt partici-pated by telephone due to illness. The average participation rate for Supervisory Board members was over 98 %. The Executive Board was not present for part of one Super visory Board meeting. Dr. Drouven’s mandate was put on hold until October 31, 2015 due to his dispatch to the Executive Board.
Meeting topics which arose regularly for Supervisory Board consultation included the performance of the business, Group human resources, development of results and the raw material, foreign exchange and energy markets. The Supervi-sory Board also dealt with the financial situation and the sta-tus of capital expenditure. In particular, the Super visory Board oversaw the planning of the Future Complex Metal-lurgy (FCM) and Metallurgical Slag Opti mization (MSO) proj-ects, the earnings trend of Business Line Flat Rolled products and various optimization and development projects (Step Up) that were presented by employees at the first and sec-ond management levels below the Executive Board. The chairmen of the Personnel Committee, the Audit Committee and the Technology Committee also reported at meetings on the committees’ work, suggestions made and the results achieved.
In the Supervisory Board’s extraordinary meeting of Octo-ber 2, 2015, Mr. Schachler was appointed Executive Board Chairman from April 1, 2016 and Ms. Renate Hold-Yilmaz was elected Deputy Chairwoman of the Supervisory Board. Furthermore, the Supervisory Board filled the positions in the Conciliation, Personnel and Audit Committees that had opened up due to the retirement of the former Deputy Chairman of the Supervisory Board, Mr. Grundmann. The
Supervisory Board adopted a resolution, by written consent in lieu of a meeting, to appoint Mr. Erwin Faust as Executive Board Spokesman until Mr. Schachler took office. In the same process, the responsibilities of the individual Executive Board members were redistributed on an interim basis until Mr. Schachler took office. Likewise, the Supervisory Board passed a resolution, using equitable discretion, to grant the two Executive Board members special compensation for their temporary additional responsibilities.
In the meeting of December 10, 2015, the Supervisory Board determined compensation levels for the Executive Board members for fiscal year 2014/15 contingent on the established objectives. Details are explained as part of this Annual Report in the Compensation Report.
In the same meeting, consultations focused on reviewing the consolidated financial statements and the separate financial statements for Aurubis AG for 2014/15, including the corporate governance report, and the preparations for the 2016 Annual General Meeting.
In the meantime, Mr. Schachler had notified the Company that he would only be available to serve as Executive Board Chairman starting July 1, 2016. Accordingly, the Supervisory Board made the required resolutions to accommodate the new situation. In this context, the Supervisory Board made a modest increase to the Executive Board’s special compensa-tion. The Executive Board reported on the development of Business Line Flat Rolled Products and the planning for the FCM project. Furthermore, the Supervisory Board approved the amendment to the “Catalogue of Transactions Requiring Approval”.
In the meeting of February 23, 2016, the Supervisory Board addressed the results of operations following the end of the first quarter of the fiscal year, as well as the developments in Business Line Flat Rolled Products. The employee responsi-ble for monitoring the Step Up program provided the Super-visory Board with a general status overview of the optimiza-tion and development projects established in the scope of this program.
Company Management
Aurubis Annual Report 2015/16
2731 Corporate Governance45 Aurubis Shares
22 Executive Board23 Supervisory Board26 Supervisory Board Report

The chairman of the Technology Committee reported on the committee’s first meeting and addressed the status of the FCM project planning and the SCOPE (Supply Chain Optimization and Excellence) project’s degree of implemen-tation, among other topics. The Supervisory Board approved a long-term contract with a Bulgarian service pro-vider that encompasses the construction of tank capacities and transshipment facilities for external sulfuric acid logis-tics in the Burgas, Bulgaria harbor starting in late 2017.
In the meeting of June 7, 2016, the Supervisory Board discussed the progress of the shutdown in Pirdop and the effects of a lower concentrate throughput on the Aurubis Group’s earnings. The Executive Board and the respective project managers reported to the Supervisory Board on the status of the plans for the MSO and FCM projects.
The Supervisory Board approved the proposal for Aurubis AG to supply parts of the city of Hamburg with district heating (Hamburg District Heating project). The permit is subject to the conditions that the expected public funding is received and that a corresponding supply line is built. The head of the Legal Affairs Department communi-cated detailed updates to the Supervisory Board regarding the Market Abuse Regulation and its implementation.
The Supervisory Board meeting of September 28, 2016 took place at the Pirdop site in Bulgaria. Significant investments have been made at this site in recent years, and the Supervi-sory Board took the opportunity to have intensive discus-sions about the site during their visit. An extensive tour of the site enabled the Supervisory Board to witness the plant’s successful status firsthand.
The MSO and FCM projects were key topics at the Super-visory Board meeting once again. The Supervisory Board approved the Group’s investment and financial planning during this meeting. Furthermore, they discussed the budget for the next fiscal year and established the target EBT for Executive Board compensation.
CommitteesThe Supervisory Board set up a total of five committees, which effectively support the work done in the meetings, to fulfill its duties in fiscal year 2015/16. The committees pre-pared the Supervisory Board’s resolutions and the topics to be considered in the meetings. The Conciliation Committee in accordance with Section 27 (3) Law on Co-determination (MitbestG) did not meet during the reporting year.
General statements on the composition and working procedures of the Supervisory Board and its committees can be found in this year’s declaration on corporate governance as part of Aurubis AG’s Management Report.
All of the members participated in all of the committee meetings.
Personnel Committee workThe Personnel Committee met twice during the reporting period. During these meetings, it dealt with the postpone-ment of Mr. Schachler’s start at the Company, going on to develop the recommendation to appoint Mr. Faust as Executive Board Spokesman for the interim period, a new temporary division of responsibilities and a recommenda-tion for the arrangement of special compensation for the Executive Board.
Audit Committee workThe Audit Committee met four times in the reporting period to review the quarterly reports, the separate financial statements for Aurubis AG and the consolidated financial statements for the past fiscal year, and it discussed them with the Executive Board. The Audit Committee also addressed the monitoring of accounting processes, the effectiveness of the internal control and auditing system, and compliance management in the Group. In all of its meetings, the committee discussed the Group’s earnings trend.
Company Management
Aurubis Annual Report 2015/16
28

The Audit Committee Chairman, Dr. Ernst Wortberg, has special expertise and experience in the application of accounting principles and internal control procedures. He is independent and not a former member of the Company’s Executive Board.
Apart from the appointment of the auditors and the agreement of the fee with the auditors, the committee established the focuses of the annual 2015/16 audit, specifically:
» Reviewing the derivation of the operating result » Reviewing the measurement of the carrying amounts
of Aurubis investments » Reviewing the introduction of Aurubis Bulgaria AD’s
SAP Treasury System
The Audit Committee furthermore monitored the indepen-dence of the auditors, obtained declarations of independence from them as recommended by the German Corporate Governance Code and addressed the additional services performed by the auditors. In this regard, the designated auditors were obligated to inform the chairman of the Audit Committee without delay about any possible grounds for exclusion or lack of impartiality arising during the audit.
The Audit Committee authorized the Executive Board to commission the auditors of the annual financial statements with permissible non-audit services, to a limited extent, starting October 1, 2016.
The auditors’ representatives attended one Audit Commit-tee meeting and reported on the audit of the annual accounts.
Technology Committee workThe Technology Committee met twice during the reporting period. In addition to overseeing various optimization and development projects, the committee was primarily involved with the MSO and FCM projects. The Executive Board and project managers presented the current status of the technical planning for these two projects to the com-mittee. Apart from the technical concepts, the committee also discussed the respective investment plans and the profitability calculations of the individual projects.
Corporate governance and Declaration of ConformityThe regular effectiveness review was performed by the Supervisory Board at its meeting of September 28, 2016. The Supervisory Board confirmed its effectiveness after extensive discussion.
The Executive Board reports on corporate governance at Aurubis AG, also on behalf of the Supervisory Board, in accordance with Section 3.10 of the German Corporate Governance Code in the declaration and report on corpo-rate governance, which are parts of the Management Report.
On November 4, 2016 the Executive Board and Supervisory Board issued the updated Declaration of Conformity to the Corporate Governance Code in accordance with Section 161 German Stock Corporation Act (AktG) and made it perma-nently accessible to the public at www.aurubis.com. Aurubis AG complies with the code recommendations with two exceptions. Additional information can be found in the Declaration of Conformity.
Conflicts of interestThere were no conflicts of interest among Executive Board or Supervisory Board members that should have been disclosed to the Supervisory Board or announced at the Annual General Meeting. There were no significant transac-tions with an Executive Board member or parties related to an Executive Board member.
>www.aurubis.com
Company Management
Aurubis Annual Report 2015/16
2931 Corporate Governance45 Aurubis Shares
22 Executive Board23 Supervisory Board26 Supervisory Board Report

Audit of the separate financial statements of Aurubis AG and the consolidated financial statementsThe Company’s financial statements prepared by the Executive Board in accordance with the German GAAP, the consolidated financial statements prepared in accordance with IFRS (International Financial Reporting Standards) for the fiscal year from October 1, 2015 to September 30, 2016 and the Combined Management Report for the Company and the Group have been audited by Pricewaterhouse-Coopers AG Wirtschaftsprüfungsgesellschaft, Hamburg, in accordance with the resolution passed at the Company’s Annual General Meeting on February 24, 2016 and their subsequent appointment as auditors by the Supervisory Board. The auditor responsible was Mr. Matthias Kirschke, who audited the Group and the Company in this capacity for the fourth year in a row. The auditors issued an unqualified auditors’ report in each case.
The meeting of the Supervisory Board to approve the financial statements was held on December 13, 2016. All members of the Supervisory Board received copies of the financial statements and audit reports, as well as the Execu-tive Board’s recommendation on the appropriation of net earnings and all other documents, in good time before this meeting. These documents were discussed in detail at the Supervisory Board meeting to approve the financial statements. The auditors participated in this meeting, reporting in detail on how the audit had been performed and on their main audit findings, and they were available to provide the Supervisory Board with further information, discuss the documents and make additional comments.
Following a detailed discussion regarding the auditors’ findings and a thorough consideration of the auditors’ report and the recommendation of the Executive Board on the appropriation of net income, and on the basis of its own review of and discussion on the separate financial state-ments of Aurubis AG, the consolidated financial statements and the Combined Management Report for the Company and the Group, the Supervisory Board concurred with the
results of the audit. The Supervisory Board concluded that no objections needed to be raised and, in accordance with the recommendations of the Audit Committee, approved the separate financial statements of Aurubis AG, which went on to be adopted, as well as the consolidated financial statements and the Combined Management Report, at the meeting on the financial statements. The Supervisory Board concurred with the Executive Board’s recommendation on the utilization of the unappropriated earnings.
Changes in the Supervisory Board and Executive BoardDr. Bernd Drouven was dispatched to the Executive Board from November 1, 2014 to October 31, 2015 pursuant to Section 105 (2) German Stock Corporation Act (AktG) and was appointed Executive Board Chairman. His Supervisory Board mandate was put on hold during this period. Dr. Drouven has returned to being an active member of the Supervisory Board since November 1, 2015. The Supervisory Board thanks Dr. Drouven for his willingness to step in and for his strong commitment to Aurubis AG. Mr. Erwin Faust served as Executive Board Spokesman from November 1, 2015 to June 30, 2016 and managed the Group with Dr. Stefan Boel on an interim basis. Mr. Jürgen Schachler became the new Executive Board Chairman of Aurubis AG on July 1, 2016.
Mr. Ralf Winterfeldt succeeded Mr. Hans-Jürgen Grund-mann in the Supervisory Board on October 1, 2015. The Supervisory Board elected Ms. Renate Hold-Yilmaz as the new Deputy Supervisory Board Chairwoman on October 2, 2015.
Hamburg, December 2016
The Supervisory Board
Prof. Dr.-Ing. Heinz Jörg Fuhrmann Chairman
Company Management
Aurubis Annual Report 2015/16
30

Corporate Governance
Report and declaration on corporate governance (part of the Management Report)
The principles of responsible and sustainable corporate governance determine the actions of the management and controlling bodies of Aurubis AG. In this declaration, the Executive Board reports – also on behalf of the Supervisory Board – in accordance with Section 3.10 of the German Corporate Governance Code and in accordance with Section 289a (1) German Commercial Code (HGB) about corporate governance.
Declaration of Conformity and reporting on corporate governanceIn accordance with Section 161 German Stock Corporation Act (AktG), the Executive Board and Supervisory Board of a company listed in Germany are obliged to issue an annual declaration to the effect that the recommendations of the “Government Commission on the German Corporate Gover-nance Code” published by the German Federal Ministry of Justice in the official section of the electronic Federal Gazette (Bundesanzeiger) were, and continue to be, complied with, or to list the recommendations that were not followed or which are not being followed currently, and to explain why.
The Executive Board and the Supervisory Board have dealt on several occasions in fiscal year 2015/16 with the topic of corporate governance, and jointly issued the updated Decla-ration of Conformity in accordance with Section 161 German Stock Corporation Act (AktG) on November 4, 2016. The declaration has been made permanently accessible to the public on the Aurubis AG website in the Investor Relations/Corporate Governance section. All Declarations of Confor-mity from the past five years are also permanently accessible to the public there.
Text of the Declaration of Conformity“The Executive Board and Supervisory Board of Aurubis AG declare that the recommendations of the ‘Government Com-mission on the German Corporate Governance Code’ in the version dated May 5, 2015 have been applied since October 1, 2015 and will be applied with the following exceptions:
» Contracts concluded with new Executive Board mem-bers do not include a severance pay cap amounting to maximum two years’ compensation in the event of premature termination of the contract without good cause, including in the form of (modified) ‘connection clauses’. The first contracts of newly appointed Execu-tive Board members only have a term of three years, and so a severance pay cap for Executive Board members would not make sense. Furthermore, in many related cases a severance pay cap would not be legally enforceable for Executive Board members. If there is neither good cause for revoking the appointment in terms of Section 84 (3) sentence 1 German Stock Cor-poration Act (AktG) nor good cause for terminating the employment contract without notice in terms of Section 626 German Civil Code, the service contract with the respective Executive Board member can only be terminated by mutual consent. In this case, the Executive Board member is not obliged to agree to a severance pay cap in terms of the code recommenda-tion. (Modified) connection clauses that tie termina-tion of the Executive Board employment contract to the revocation of the appointment for good cause, and which provide for a corresponding severance pay cap for this case cannot be unilaterally enforced by the Supervisory Board against the will of the Executive Board member concerned (deviation from code Section 4.2.3 paragraph 4).
» When proposing candidates at the Annual General Meeting, the Supervisory Board has focused and will continue to focus on the professional and personal qualifications of the candidates within the framework of the applicable legal regulations, in particular with respect to the German Gender Equality Act. It is natu-rally very relevant that the Company’s international activities, potential conflicts of interest, the number of independent Supervisory Board members established by the Supervisory Board and diversity are taken into account. In doing so, it is neither necessary to establish a regu latory limit for the length of membership in the
Company Management
Aurubis Annual Report 2015/16
3131 Corporate Governance45 Aurubis Shares
22 Executive Board23 Supervisory Board26 Supervisory Board Report

Supervisory Board nor to specify concrete objectives and publish them in the corporate governance report (deviation from Code Section 5.4.1 paragraphs 2 and 3).
Hamburg, November 4, 2016
For the Executive Board
Jürgen Schachler Dr. Stefan Boel (Chairman) (Member)
For the Supervisory Board:
Prof. Dr.-Ing. Heinz Jörg Fuhrmann (Chairman)”
Working procedures of the Executive Board and Supervisory BoardAurubis AG is a company subject to German law, on which the German Corporate Governance Code is also based. A basic principle of German stock corporation law is the dual management system, enacted in the two bodies of the Executive Board and Supervisory Board, strictly separated in terms of personnel between the Executive Board as the board of management, and the Supervisory Board as the monitoring organ, and each provided with independent responsibilities. The Executive Board and Supervisory Board of Aurubis AG work together closely and in a spirit of trust in the governance and super vision of the Company for the benefit of the Company.
The Executive BoardThe Executive Board runs the Company on its own responsi-bility without instructions from third parties in accordance with the law, the Articles of Association and the Executive Board’s rules of procedure, taking into account the resolu-tions passed at the Annual General Meeting. The Executive Board represents the Company in dealings with third parties.
As the management body, the Executive Board runs the Company’s business on its own responsibility with the aim of achieving long-term added value in the Company’s interests while taking the needs of all stakeholders into account. The principle of overall responsibility applies, i.e. the members of the Executive Board collectively bear responsibility for the management of the entire Company. They work together in a spirit of cooperation and continuously communicate with one another about important measures and occurrences in their areas of responsibility. The overall responsibility of all Execu-tive Board members notwithstanding, the individual mem-bers of the Executive Board oversee the areas of responsibil-ity assigned to them in the Executive Board resolutions on their own responsibility. The principles of the collaboration between Aurubis AG’s Executive Board members are stated in the rules of procedure for the Executive Board issued by the Supervisory Board. These regulate, in particular, the allo-cation of responsibilities between individual Executive Board members, matters reserved for the full Executive Board, the passing of resolutions, i.e. the required majority for resolu-tions, and the rights and obligations of the Chief Executive Officer.
Certain Executive Board decisions of particular importance require the approval of the Supervisory Board. These decisions are stipulated in a catalogue. For example, the Super visory Board makes decisions about investments in other companies if the measure is of great significance for the Group, as well as about substantial capital expenditure measures.
The Executive Board of Aurubis AG consisted of two or three members during the fiscal year. Pursuant to Section 105 (2) German Stock Corporation Act (AktG), Dr. Bernd Drouven was dispatched from the Supervisory Board to the Executive Board of Aurubis AG and was appointed Execu-tive Board Chairman until October 31, 2015. Dr. Drouven also oversaw Business Unit Primary Copper. Mr. Jürgen Schachler has been Executive Board Chairman since July 1, 2016 and oversees Business Unit Primary Copper as well. In the interim period between November 1, 2015 and the start of Mr. Schachler’s term, Aurubis was led by Mr. Erwin Faust, Executive Board Spokesman, and Dr. Stefan Boel. Starting July 1, 2016, Mr. Erwin Faust resumed his full-time role as
Aurubis Annual Report 2015/16
Corporate Governance32

Chief Financial Officer, with Dr. Stefan Boel responsible for Business Unit Copper Products. Mr. Erwin Faust has been on sick leave since November 1, 2016 and is expected to return to the Company in the second quarter of 2017. For this reason, with the Supervisory Board resolution of November 24, 2016, Mr. Faust was released from his duties and obligations as CFO of Aurubis AG by mutual agree-ment. Mr. Jürgen Schachler and Dr. Stefan Boel have assumed Mr. Faust’s responsibilities for the time being.
The Executive Board keeps the Supervisory Board informed promptly and comprehensively, through written and verbal reports, as well as in the scheduled meetings, about the strategy, planning, business development, important busi-ness transactions and the Group’s risk situation, including risk management and compliance, i.e. the measures taken to comply with legal requirements and internal corporate guidelines. The Executive Board undertakes detailed discus-sions regarding any business performance deviations from previously prepared budgets and targets, and provides rea-sons for them.
The Executive Board takes diversity into account when fill-ing management positions in the Company. Due to the Ger-man law on equal participation of women and men in man-agement positions in the private and public sectors from May 2015, certain companies in Germany are obligated for the first time to establish targets for the quota of women in the Supervisory Board, the Executive Board and the next two management levels and to determine the deadline by which the respective quotas should be achieved. The com-panies concerned were required to establish their targets, including the implementation deadlines, by September 30, 2015. The first implementation deadline is not permitted to extend past June 30, 2017. The next time an implementation deadline is set, the period can extend to five years. The law includes one exception, for the quota of women in the Supervisory Boards of exchange-listed companies that are also subject to co-determination, such as Aurubis AG: these boards must include a legal minimum of 30 % women and 30 % men for new members taking up open Supervisory Board mandates starting January 1, 2016.
On August 17, 2015 the Executive Board set targets for the proportion of women in the two management levels below the Executive Board for the first time and established an implementation deadline of June 30, 2017. The target for the relatively short period until June 30, 2017 is 20 % for each level. Currently, the proportion of women is 19 % for the first management level, follwing 20 % in the previous year, and 20 % for the second management level, previously 17.4 %.
The Supervisory BoardThe Supervisory Board advises and monitors the Executive Board in the management of the Company. It appoints and rescinds the contracts of Executive Board members, decides on the compensation system for Executive Board members and specifies their respective total compensation. In the pro-cess, the Supervisory Board takes the relationship between Executive Board compensation and the compensation of the upper management level and the relevant workforce, in addi-tion to the Company’s market position, into account. It also defines the target pension level for Executive Board mem-bers. The Personnel Committee submits corresponding sug-gestions to the Supervisory Board. The Supervisory Board established an age limit for the election of Supervisory Board members. The Supervisory Board did not place a limit on the length of membership in the Supervisory Board.
The Supervisory Board is included in strategy and planning, as well as all aspects of major significance for the Company. The Supervisory Board has defined rights of veto in favor of the Supervisory Board for transactions of fundamental importance, in particular those that would significantly change the Compa-ny’s net assets, financial position and results of operations. In the case of important events, an extraordinary Supervisory Board meeting is convened if deemed necessary. The Chair-man of the Supervisory Board coordinates the work within the Supervisory Board, chairs their meetings and attends to the affairs of the Supervisory Board externally. The Supervisory Board meets without the Executive Board as necessary.
The Supervisory Board has defined rules of procedure for its work. The representatives of the shareholders and the employees generally meet separately to prepare for the meetings.
Company Management
Aurubis Annual Report 2015/16
3322 Executive Board23 Supervisory Board26 Supervisory Board Report
31 Corporate Governance45 Aurubis Shares

Composition of the Supervisory BoardThe Supervisory Board of Aurubis AG formed on the basis of co-determination has twelve members in accordance with the Articles of Association, of which six are elected by the shareholders and six by the employees in accordance with the German Law on Co-determination (MitbestG). The periods of office are identical. In accordance with the rec-ommendations of the German Corporate Governance Code, the shareholders’ representatives were elected individually to the Supervisory Board in the last election at the Annual General Meeting on February 28, 2013. Dr. Drouven’s Super-visory Board mandate was put on hold during the period from November 1, 2014 to October 31, 2015, during which he was dispatched to the Executive Board.
The Supervisory Board has not specified any concrete objectives regarding its composition. When proposing can-didates at the Annual General Meeting, the Supervisory Board will continue, in the future, to orient itself to the statutory provisions while focusing on the professional and personal qualifications of the candidates within the frame-work of the applicable legal regulations, in particular with respect to the German Gender Equality Act. It is naturally very relevant that the Company’s international activities, potential conflicts of interest, length of membership in the Supervisory Board, age limit for Supervisory Board mem-bers, number of independent Supervisory Board members in terms of Section 5.4.2 of the German Corporate Gover-nance Code and diversity are all taken into account.
Dr. Bernd Drouven, a former member of the Aurubis AG Executive Board, is now a member of the Supervisory Board. His appointment as an Executive Board member ended less than two years ago. Dr. Bernd Drouven was elected to the Aurubis AG Supervisory Board pursuant to Section 100 (2) sentence 1 No. 4 German Stock Corporation Act (AktG) at the recommendation of Salzgitter Mannesmann GmbH. In the Supervisory Board’s analysis, the Supervisory Board has a suitable number of independent members who do not have a personal or professional relationship with the Company, its Supervisory Board or Executive Board, a controlling share-holder or someone connected with an associated company,
which could be cause for a significant conflict of interest that is not merely temporary. The Supervisory Board’s term of office amounts to five years; the current term of office ends at the close of the Annual General Meeting during which the resolution regarding the exoneration of the Supervisory Board members is passed for fiscal year 2016/17.
Pursant to Section 96 (2) German Stock Corporation Act (AktG), the Supervisory Board of an exchange-listed stock corporation that is also subject to co-determination, such as Aurubis AG, must include a minimum of 30 % women and a minimum of 30 % men. These minimum quotas apply to new members taking up open Supervisory Board mandates starting January 1, 2016. The quotas are therefore expected to be taken into consideration for the first time in the elec-tion of new Supervisory Board members at the Annual Gen-eral Meeting during which the resolution regarding the exoneration of the Supervisory Board members is passed for fiscal year 2016/17.
Pursuant to the German law on equal participation of women and men in management positions in the private and public sectors from May 2015, on September 11, 2015 the Supervisory Board established a target of 0 % for the quota of women in the Aurubis AG Executive Board and an implementation deadline of June 30, 2017 since at that time no new appointments were expected.
Supervisory Board committeesThe Supervisory Board has formed five long-term commit-tees in order to complement the work of the Supervisory Board and enable its members to prepare work for it: the Personnel Committee, the Audit Committee, the Nomina-tion Committee, the Conciliation Committee and the Tech-nology Committee. Some of the committees’ tasks as well as their composition and work are specified in the rules of procedure of the Supervisory Board.
Personnel CommitteeThe six-member Personnel Committee has equal numbers of representatives for the shareholders and employees. For the duration of Dr. Drouven’s dispatch to the Executive
Aurubis Annual Report 2015/16
Corporate Governance34

Board, his Personnel Committee mandate was put on hold in addition to his Supervisory Board mandate. The Personnel Committee therefore temporarily had only five members until October 31, 2015. It concerns itself with the structure and level of compensation paid to all members of the Executive Board, the preparation of Executive Board contracts and the selection of qualified candidates for Executive Board positions in the preparation of the neces-sary Supervisory Board resolutions. The chairman of the Per-sonnel Committee is the chairman of the Supervisory Board.
Audit CommitteeThe four-member Audit Committee with equal representation has the primary task of monitoring accounting and accounting processes, the effectiveness of the internal control system and the internal auditing system, the annual audit and especially the independence of the auditors, the additional services per-formed by auditors, the appointment of auditors, the focuses of the audit and the agreement of the fee, as well as compli-ance. The Audit Committee Chairman during the reporting year, Dr. Ernst J. Wortberg, is an independent financial expert whose business career has provided him with special expertise and experience in the application of accounting principles and internal control procedures. He is not a former member of the Company’s Executive Board whose appointment ended less than two years ago.
Nomination CommitteeThe Nomination Committee did not meet during the reporting year.
The Nomination Committee only contains representatives for the shareholders in accordance with the German Corpo-rate Governance Code. The Nomination Committee has the duty of proposing suitable candidates for election to the Supervisory Board at the Annual General Meeting.
Conciliation CommitteeThe Conciliation Committee did not meet during the reporting year.
Technology CommitteeThe Supervisory Board formed a Technology Committee on November 1, 2015. The four-member committee has equal numbers of representatives for the shareholders and employees. The Technology Committee’s duty is to strate-gically support and monitor the Executive Board in the implementation of significant capital expenditure projects. Dr. Drouven chairs this committee.
All the committees’ members are given in the list of the Executive and Supervisory Boards in this Annual Report. The mandates of the Supervisory Board members in other legally formed Supervisory Boards and comparable German and foreign controlling bodies are included in the list of the Executive and Supervisory Boards in this Annual Report.
Avoiding conflicts of interestThe mandates of the Supervisory Board and Executive Board members in other legally formed Supervisory Boards and comparable German and foreign controlling bodies are included in the list of the Executive and Supervisory Boards in this Annual Report. No Executive Board member holds more than three Supervisory Board mandates at public limited companies that are not part of the Group, or in supervisory committees of non-Group companies with comparable requirements. Related parties are presented in the Notes to the Consolidated Financial Statements.
In transactions with Executive Board members, the Super-visory Board represents the Company. Significant transac-tions with parties related to an Executive Board member were and are only carried out with the agreement of the Supervisory Board.
In the last fiscal year no conflicts of interest occurred among Executive Board or Supervisory Board members that should have been disclosed to the Supervisory Board Chairman and the other Executive Board members. Nor were there any consulting or other service or work contracts between Supervisory Board members and the Company in the reporting year.
Company Management
Aurubis Annual Report 2015/16
3522 Executive Board23 Supervisory Board26 Supervisory Board Report
31 Corporate Governance45 Aurubis Shares

Retention in the D&O insuranceAurubis AG has taken out D&O insurance (pecuniary loss/third-party indemnity) for the Executive Board and the Supervisory Board with a reasonable retention. Retention of 10 % of the damage or one and a half times the fixed annual compensation has been agreed.
Disclosures on relevant corporate governance practicesFor Aurubis AG, the applicable legal regulations, in particu-lar stock market law, the German Law on Co-determination (MitbestG), capital market law, the Articles of Association, the German Corporate Governance Code and the rules of procedure of the Supervisory Board and the Executive Board, provide the basis for the structure of management and controlling in the Company. Over and above the legal obligations, Aurubis has defined values and has derived a Code of Conduct from these, which regulates the frame-work of behavior and decisions and which provides guid-ance for corporate activities. The values and the Code of Conduct are published on the Company’s website. Each employee is briefed on these group-wide applicable values and the Code of Conduct, as well as the corporate guide-lines stemming from them. Mandatory instruction is given on special topics to (potentially) affected employees (e.g. antitrust law, anticorruption, environmental protection and occupational safety).
Shareholders and Annual General MeetingThe shareholders of Aurubis AG exercise their co- determination and supervisory rights at the Annual General Meeting, which occurs at least once a year. Resolutions are passed at the AGM on all matters defined by law that are binding for all shareholders and the Company. Each share grants the holder one vote in the AGM voting processes.
The participants of the Annual General Meeting elect the members of the Supervisory Board and pass a resolution regarding the exoneration of the members of the Executive Board and Supervisory Board. They decide on the utilization of the unappropriated earnings and on capital measures and give approval to company agreements. Furthermore, they make decisions about the compensation of the Supervisory Board and amendments to the Company’s Articles of
Association. An Annual General Meeting is held once a year, in which the Executive Board and Supervisory Board give an account of the past fiscal year. The German Stock Corpora-tion Act (AktG) stipulates that an extraordinary General Meeting can be convened in special cases.
Each shareholder who has registered in good time and can provide proof of his or her entitlement to participate in the Annual General Meeting and exercise his voting rights is enti-tled to attend the Annual General Meeting. Shareholders who cannot or do not wish to attend the Annual General Meeting in person may authorize a bank, a shareholders’ association, the proxies designated by Aurubis AG, who are bound to fol-low the shareholders’ instructions, or another person of their choice to exercise their voting rights. The shareholders also have the option of submitting their votes online before the Annual General Meeting. Aurubis AG will give further details in the invitation to the Annual General Meeting.
The invitation to the Annual General Meeting and the relevant reports and information for the resolutions are published in accordance with German stock corporation law and made available in English and German on the Aurubis AG website.
Controlling and risk managementIt is also part of good corporate governance that the Com-pany handles risks responsibly. As part of our value- oriented Group management, adequate risk management ensures that risks are identified early on and risk positions are minimized. Risk Management reports regularly to the Executive Board and the Supervisory Board’s Audit Committee. Compliance management was expanded across the Group in the fiscal year so as to comply with the requirements resulting from the relevant legal stipulations and the Code of Conduct. The Chief Compliance Officer reported regularly to the Executive Board and the Supervisory Board’s Audit Committee.
Details of risk management at Aurubis AG are given in the risk report, which includes the mandatory report on the accounting-related internal control and risk management system issued in accordance with Section 289 (5), Section 315 (2) German Commercial Code (HGB).
>www.aurubis.com
Aurubis Annual Report 2015/16
Corporate Governance36

TransparencyAurubis AG regularly informs capital market participants and the interested general public about the Group’s economic situation and new facts. The Annual Report, half-yearly reports and the quarterly interim reports are published within the stipulated periods. Press releases and, if neces-sary, ad hoc announcements provide information on current events and new developments. Information is made available in German and English and is published in printed form or via suitable electronic media. Meetings are arranged on a regular basis with analysts and institutional investors as part of our Investor Relations activities. Apart from an annual analysts’ conference, conference calls are also held for analysts, especially in connection with the publication of quarterly figures. We have also immediately made available to shareholders, on the Company website, any new matters that were disclosed to financial analysts and similar contacts.
The Company’s Articles of Association, the current Declara-tion of Conformity and the Declarations of Conformity from the past five years are likewise available on the website.
Furthermore, immediately after receipt of a relevant notifi-cation pursuant to Section 21 German Securities Trading Act (WpHG), the achieving, exceeding or falling below of 3, 5, 10, 15, 20, 25, 30, 50 or 75 % of the voting rights in the Company is published in an information system that is distributed throughout Europe.
Financial calendarThe scheduled dates of the main recurring events and publi-cations – such as the Annual General Meeting, the Annual Report, interim reports, press conferences on the annual financial statements and analyst conferences – are listed in a financial calendar. The calendar is published sufficiently in advance and made permanently available on the Aurubis AG website.
Directors’ dealingsIn accordance with Section 15a of the previous version of the German Securities Trading Act (WpHG) until July 2, 2016, and in accordance with Art. 19 of the European Market Abuse Regulation effective since July 3, 2016, members of the Executive and Supervisory Boards, certain employees in management positions and people closely associated with them have to disclose acquisitions and sales of Company shares and related financial instruments. This does not apply if the total transactions per person do not reach an amount of € 5,000 per calendar year.
One member of the Supervisory Board carried out share transactions from October 1, 2015 to September 30, 2016:
» Prof. Dr. Fritz Vahrenholt: purchased 1,000 no-par-value shares.
The following members of the Executive Board informed the Company that they had acquired or sold no-par-value shares in the Company in the period from October 1, 2015 to September 30, 2016:
» Mr. Erwin Faust: purchased 5,000 no-par-value shares, » Dr. Stefan Boel: purchased 2,750 no-par value shares, » Mr. Erwin Faust: sold 5,000 no-par-value shares.
The Executive Board and Supervisory Board held less than 1 % of the shares issued by the Company as at September 30, 2016.
Financial reporting and annual auditAurubis AG prepares its consolidated financial statements and the consolidated interim reports in accordance with International Financial Reporting Standards (IFRS) as they should be applied in the European Union. The financial statements of Aurubis AG are issued in compliance with the German Commercial Code (HGB) and the German Stock Corporation Act (AktG). The financial statements of Aurubis AG and the consolidated financial statements are compiled by the Executive Board and examined by the auditors and the Supervisory Board. Aurubis AG released a Combined Management Report for the AG and the Group
Company Management
Aurubis Annual Report 2015/16
3722 Executive Board23 Supervisory Board26 Supervisory Board Report
31 Corporate Governance45 Aurubis Shares

for fiscal year 2015/16. The interim reports and the half-yearly financial reports are discussed by the Audit Commit-tee and the Executive Board before publication.
The Company’s auditor was elected at the Annual General Meeting in compliance with the provisions of the German Stock Corporation Act (AktG). PricewaterhouseCoopers AG Wirtschaftsprüfungsgesellschaft, Hamburg, was appointed auditor of the 2015/16 consolidated financial statements and the 2015/16 German Commercial Code (HGB) financial statements of Aurubis AG. Before submitting the proposal for the election of the auditors, the Supervisory Board obtained the declaration of independence from Pricewater-houseCoopers AG Wirtschaftsprüfungsgesellschaft as speci-fied by the German Corporate Governance Code. The audits were performed in accordance with German auditing regula-tions, taking into account the generally accepted standards for the audit of financial statements promulgated by the German Institute of Public Auditors; in addition, the Interna-tional Standards on Auditing were also observed. The audits also covered risk management and compliance with report-ing obligations on corporate governance in accordance with Section 161 German Stock Corporation Act (AktG).
Furthermore, it was also agreed with the auditors that they would inform the Supervisory Board without delay about any possible grounds for exclusion or lack of impartiality and about the main findings and incidents arising during the audit.
Hamburg, December 2016
The Executive Board
Jürgen Schachler Dr. Stefan Boel (Chairman) (Member)
Compensation report for the Executive Board and the Supervisory Board of Aurubis AG
The following compensation report is part of the Combined Management Report. It outlines the structure and level of Aurubis AG’s Executive Board and Supervisory Board compensation.
Compensation for the Executive BoardThe Supervisory Board defines the total compensation for the individual Executive Board members on the basis of proposals from the Personnel Committee, and decides on and reviews the compensation system for the Executive Board at regular intervals.
The principle of the compensation provisions is to orient the Executive Board’s contracts more strongly to long-term corporate development.
The compensation of individual Executive Board members is defined in their employment contracts and consists of a series of components, comprising fixed compensation, variable compensation, fringe benefits and pension plans.
The various compensation components are as follows: the compensation of Executive Board members is made up of fixed and variable components. The fixed parts consist of fixed compensation, fringe benefits and pension plans. The annual fixed compensation amounts to € 570,000 for the Chief Executive Officer and € 399,000 for the ordinary members of the Executive Board and is paid out monthly in equal installments. In the past fiscal year, Dr. Drouven (Exec-utive Board Chairman until October 31, 2015) received fixed compensation of € 47,500. As Executive Board Chairman from July 1, 2016 to September 30, 2016, Mr. Jürgen Schachler earned fixed compensation of € 142,500. Because Mr. Erwin Faust (Executive Board Spokesman from November 1, 2015 to June 30, 2016) and Dr. Stefan Boel assumed additional responsibilities in the Executive Board on an interim basis during the period mentioned, they received special compen-sation in addition to their fixed compensation of € 399,000
Aurubis Annual Report 2015/16
Corporate Governance38

each. This special compensation amounted to € 120,000 for Mr. Faust and € 105,000 for Dr. Boel.
In addition, the Executive Board members receive fringe benefits in the form of benefits in kind, mainly comprising the value of insurance premiums in accordance with the tax guidelines, and the use of a company car. The individual Executive Board members must pay tax on these fringe benefits as components of their compensation.
The system for variable compensation consists of two com-ponents, which are paid out each year. The first component (Component 1) is dependent on achieving an annual target related to adjusted average consolidated EBT (earnings before taxes of the Group) of three years, in each case related to the current and the two prior fiscal years before the respective fiscal year. The target is EBT derived from ROCE of 15 %. The target bonus of Component 1 amounts to about 60 % of the variable compensation in relation to Component II and can reach a cap of 100 %. If EBT is less than 40 % of the target, Component 1 will not be paid. The maximum amount that can be reached from these compo-nents is € 712,500 for the Chief Executive Officer and € 475,000 for ordinary members of the Executive Board.
Component II stipulates that an annual assessment of the joint (Component II a) and individual (Component II b) performance of the Executive Board will be carried out by the Supervisory Board. Both components are based on a qualitative, criteria-supported assessment of the long-term Company management.
The target bonus of Component II has a cap of 100 %. At least 50 % of the target bonus is always paid out unless the granting of same would be unreasonable in the sense of Section 87 (2) German Stock Corporation Act (AktG). The maximum amount to be reached from Components II a and II b amounts to € 237,500 for the Chief Executive Officer and € 166,250 for each of the ordinary members of the Executive Board.
Mr. Faust has a defined benefit pension plan. The pension benefits are determined as a percentage of the fixed com-pensation. The percentage increases based on the length of
service on the Board. The pension is payable once the Executive Board member reaches the age of 65 or in the event of his disability.
Mr. Schachler and Dr. Boel have a defined contribution pension plan, for which an amount of € 140,000 is paid for Mr. Schachler and € 100,000 is paid for Dr. Boel to an insurance company each year.
The employment contracts of Executive Board members include no change of control clauses. In the event of non- renewal of his Executive Board contract, Mr. Faust will, under certain conditions, receive an early retirement pension. These conditions are fulfilled if the Executive Board member has completed at least five years of service as an Executive Board member at Aurubis AG and is at least 55 years old. Dr. Drouven fulfilled these conditions during his previous Executive Board membership and received a pension. These claims were put on hold during his dispatch from the Supervisory Board to the Executive Board. The assessment basis for the pension increased slightly due to his new Executive Board membership.
Pensions paid to Executive Board members before they reach 65 years of age have the character of an interim payment. Compensation paid to an Executive Board member for activi-ties outside the Aurubis Group after termination of his contract is offset against the pension until he reaches the age of 65.
All members of the Executive Board also have a defined contribution company pension plan. This pension plan is based on a lump-sum single payment. At the end of each fiscal year, € 120,000 for the Chief Executive Officer and € 80,000 for the other three Executive Board members is paid into liability insurances.
Each Executive Board member may use the accumulated capital at the earliest when he has reached 60 years of age, but not before ceasing to be employed by the Company.
The total compensation paid to active members of the Executive Board for activities in fiscal year 2015/16 amounted to € 3,325,289 including pension expenses.
Company Management
Aurubis Annual Report 2015/16
3922 Executive Board23 Supervisory Board26 Supervisory Board Report
31 Corporate Governance45 Aurubis Shares

The following table provides details of the compensation of the individual members:
Benefits granted
in € Fixed compensation Fringe benefits TotalVariable compensation
for one yearVariable compensation
for several years Total Pension expenses 1) Total compensation
Jürgen Schachler Executive Board Chairman starting July 1, 2016
2014/15 0 0 0 0 0 0 0 0
2015/16 2) 142,500 3,465 145,965 118,750 157,106 421,821 260,000 681,821
Min. 142,500 3,465 145,965 59,375 0 205,340 260,000 465,340
Max. 142,500 3,465 145,965 118,750 178,125 442,840 260,000 702,840
Dr. Stefan Boel Executive Board member since April 19, 2008
2014/15 378,000 17,813 395,813 275,625 90,450 761,888 160,000 921,888
2015/16 399,000 18,177 417,177 332,500 4) 418,950 1,168,627 180,000 1,348,627
Min. 399,000 18,177 417,177 166,250 0 583,427 180,000 763,427
Max. 399,000 18,177 417,177 332,500 475,000 1,224,677 180,000 1,404,677
Erwin Faust Executive Board member since October 1, 2008
2014/15 378,000 18,365 396,365 275,625 90,450 762,440 310,852 1,073,292
2015/16 399,000 19,139 418,139 332,500 4) 418,950 1,169,589 321,506 1,491,095
Min. 399,000 19,139 418,139 166,250 0 584,389 321,506 905,895
Max. 399,000 19,139 418,139 332,500 475,000 1,225,639 321,506 1,547,145
Dr. Bernd Drouven Executive Board Chairman from November 1, 2014 to October 31, 2015
2014/15 495,000 4,112 499,112 360,938 124,369 984,419 110,000 1,094,419
2015/16 3) 47,500 1,042 48,542 39,583 52,369 140,494 10,000 150,494
Min. 47,500 1,042 48,542 19,792 0 68,334 10,000 78,334
Max. 47,500 1,042 48,542 39,583 59,375 147,500 10,000 157,500
Total 2014/15 1,251,000 40,290 1,291,290 912,188 305,269 2,508,747 580,852 3,089,599
2015/16 988,000 41,823 1,029,823 823,333 1,047,375 2,900,531 771,506 3,672,037
Min. 988,000 41,823 1,029,823 411,667 0 1,441,490 771,506 2,212,996
Max. 988,000 41,823 1,029,823 823,333 1,187,500 3,040,656 771,506 3,812,1621) Pension expenses in accordance with the German Commercial Code (HGB) amounted to € 230,041 (previous year: € 429,361) for Erwin Faust,
€ 180,000 (previous year: € 160,000) for Dr. Stefan Boel, € 10,000 (previous year: € 232,607) for Dr. Bernd Drouven and € 260,000 for Jürgen Schachler.2) Variable compensation for the period from July 1, 2016 to September 30, 2016.3) Due to Dr. Drouven’s departure, the table shows 1/12 of the compensation previously granted.4) Mr. Erwin Faust (Executive Board Spokesman from November 1, 2015 to June 30, 2016) and Dr. Stefan Boel assumed additional Executive Board
responsibilities on an interim basis during the period mentioned. As a result, they received additional special compensation amounting to € 120,000 for Mr. Faust and € 105,000 for Dr. Boel. The variable compensation for several years for fiscal year 2015/16 is calculated according to the ratio of actual EBT to the target EBT of the Aurubis Group and the average of fiscal years 2013/14, 2014/15 and 2015/16. The average actual EBT amounts to € 231 million, a 66 % target achievement.
¤ T 002
Aurubis Annual Report 2015/16
Corporate Governance40

The following table provides details of the compensation of the individual members:
Benefits granted
in € Fixed compensation Fringe benefits TotalVariable compensation
for one yearVariable compensation
for several years Total Pension expenses 1) Total compensation
Jürgen Schachler Executive Board Chairman starting July 1, 2016
2014/15 0 0 0 0 0 0 0 0
2015/16 2) 142,500 3,465 145,965 118,750 157,106 421,821 260,000 681,821
Min. 142,500 3,465 145,965 59,375 0 205,340 260,000 465,340
Max. 142,500 3,465 145,965 118,750 178,125 442,840 260,000 702,840
Dr. Stefan Boel Executive Board member since April 19, 2008
2014/15 378,000 17,813 395,813 275,625 90,450 761,888 160,000 921,888
2015/16 399,000 18,177 417,177 332,500 4) 418,950 1,168,627 180,000 1,348,627
Min. 399,000 18,177 417,177 166,250 0 583,427 180,000 763,427
Max. 399,000 18,177 417,177 332,500 475,000 1,224,677 180,000 1,404,677
Erwin Faust Executive Board member since October 1, 2008
2014/15 378,000 18,365 396,365 275,625 90,450 762,440 310,852 1,073,292
2015/16 399,000 19,139 418,139 332,500 4) 418,950 1,169,589 321,506 1,491,095
Min. 399,000 19,139 418,139 166,250 0 584,389 321,506 905,895
Max. 399,000 19,139 418,139 332,500 475,000 1,225,639 321,506 1,547,145
Dr. Bernd Drouven Executive Board Chairman from November 1, 2014 to October 31, 2015
2014/15 495,000 4,112 499,112 360,938 124,369 984,419 110,000 1,094,419
2015/16 3) 47,500 1,042 48,542 39,583 52,369 140,494 10,000 150,494
Min. 47,500 1,042 48,542 19,792 0 68,334 10,000 78,334
Max. 47,500 1,042 48,542 39,583 59,375 147,500 10,000 157,500
Total 2014/15 1,251,000 40,290 1,291,290 912,188 305,269 2,508,747 580,852 3,089,599
2015/16 988,000 41,823 1,029,823 823,333 1,047,375 2,900,531 771,506 3,672,037
Min. 988,000 41,823 1,029,823 411,667 0 1,441,490 771,506 2,212,996
Max. 988,000 41,823 1,029,823 823,333 1,187,500 3,040,656 771,506 3,812,1621) Pension expenses in accordance with the German Commercial Code (HGB) amounted to € 230,041 (previous year: € 429,361) for Erwin Faust,
€ 180,000 (previous year: € 160,000) for Dr. Stefan Boel, € 10,000 (previous year: € 232,607) for Dr. Bernd Drouven and € 260,000 for Jürgen Schachler.2) Variable compensation for the period from July 1, 2016 to September 30, 2016.3) Due to Dr. Drouven’s departure, the table shows 1/12 of the compensation previously granted.4) Mr. Erwin Faust (Executive Board Spokesman from November 1, 2015 to June 30, 2016) and Dr. Stefan Boel assumed additional Executive Board
responsibilities on an interim basis during the period mentioned. As a result, they received additional special compensation amounting to € 120,000 for Mr. Faust and € 105,000 for Dr. Boel. The variable compensation for several years for fiscal year 2015/16 is calculated according to the ratio of actual EBT to the target EBT of the Aurubis Group and the average of fiscal years 2013/14, 2014/15 and 2015/16. The average actual EBT amounts to € 231 million, a 66 % target achievement.
¤ T 002
Company Management
Aurubis Annual Report 2015/16
4122 Executive Board23 Supervisory Board26 Supervisory Board Report
31 Corporate Governance45 Aurubis Shares

Inflow
in € Fixed compensation Fringe benefits TotalVariable compensation
for one yearVariable compensation
for several years Total Pension expenses 1) Total compensation
Jürgen Schachler Executive Board Chairman starting July 1, 2016
2014/15 0 0 0 0 0 0 0 0
2015/16 2) 142,500 3,465 145,965 118,750 117,563 382,278 260,000 642,278
Dr. Stefan Boel Executive Board member since April 19, 2008
2014/15 378,000 17,813 395,813 295,313 230,400 921,526 160,000 1,081,526
2015/16 399,000 18,177 417,177 290,9384) 313,500 1,021,615 180,000 1,201,615
Erwin Faust Executive Board member since October 1, 2008
2014/15 378,000 18,365 396,365 295,313 230,400 922,078 310,852 1,232,930
2015/16 399,000 19,139 418,139 290,9384) 313,500 1,022,577 321,506 1,344,083
Dr. Bernd Drouven Executive Board Chairman from November 1, 2014 to October 31, 2015
2014/15 495,000 4,112 499,112 412,500 316,800 1,228,412 110,000 1,338,412
2015/16 3) 47,500 1,042 48,542 39,583 39,188 127,313 10,000 137,313
Total 2014/15 1,251,000 40,290 1,291,290 1,003,126 777,600 3,072,016 580,852 3,652,868
2015/16 988,000 41,823 1,029,823 740,209 783,751 2,553,783 771,506 3,325,2891) Pension expenses in accordance with the German Commercial Code (HGB) amounted to € 230,041 (previous year: € 429,361) for Erwin Faust,
€ 180,000 (previous year: € 160,000) for Dr. Stefan Boel, € 10,000 (previous year: € 232,607) for Dr. Bernd Drouven and € 260,000 for Jürgen Schachler.2) Variable compensation for the period from July 1, 2016 to September 30, 2016.3) Due to Dr. Drouven’s departure, the table shows 1/12 of the compensation previously granted.4) Mr. Erwin Faust (Executive Board Spokesman from November 1, 2015 to June 30, 2016) and Dr. Stefan Boel assumed additional Executive Board
responsibilitieson an interim basis during the period mentioned. As a result, they received additional special compensation amounting to € 120,000 for Mr. Faust and € 105,000 for Dr. Boel. The variable compensation for several years for fiscal year 2015/16 is calculated according to the ratio of actual EBT to the target EBT of the Aurubis Group and the average of fiscal years 2013/14, 2014/15 and 2015/16. The average actual EBT amounts to € 231 million, a 66 % target achievement.
Dr. Schneider resigned from the Executive Board on June 30, 2015. The termination agreement foresaw a lump-sum compensation, which included the fixed compensation until April 30, 2016, as well as the variable compensation for fiscal year 2014/15 and the proportional variable compensa-tion for fiscal year 2015/16. The payout was in January 2016. The contributions to the additional defined contribution company pension plan were paid until April 30, 2016.
The Company has set up pension provisions on the basis of IFRS for the Executive Board members. Allocations to the pension provisions for active members of the Executive Board in the year under review amounted to € 771,506. This amount comprises the service cost and contributions to an external pension fund.
¤ T 003
Former members of the Executive Board and their surviving dependents received a total of € 2,210,800, while € 24,608,243 has been provided for their pension entitle-ment.
Compensation for the Supervisory BoardThe compensation paid to the Supervisory Board was estab-lished at the Annual General Meeting. It went into effect on October 1, 2015 and is covered by Section 12 of Aurubis AG’s Articles of Association. It is based on the different work-loads in the Supervisory Board and its committees.
In addition to the reimbursement of expenses incurred while carrying out his/her office, each member of the Supervisory Board receives a fixed fee of € 75,000 per fiscal year. The Chairman of the Supervisory Board receives three times this amount and his deputy twice this amount.
Aurubis Annual Report 2015/16
Corporate Governance42

Inflow
in € Fixed compensation Fringe benefits TotalVariable compensation
for one yearVariable compensation
for several years Total Pension expenses 1) Total compensation
Jürgen Schachler Executive Board Chairman starting July 1, 2016
2014/15 0 0 0 0 0 0 0 0
2015/16 2) 142,500 3,465 145,965 118,750 117,563 382,278 260,000 642,278
Dr. Stefan Boel Executive Board member since April 19, 2008
2014/15 378,000 17,813 395,813 295,313 230,400 921,526 160,000 1,081,526
2015/16 399,000 18,177 417,177 290,9384) 313,500 1,021,615 180,000 1,201,615
Erwin Faust Executive Board member since October 1, 2008
2014/15 378,000 18,365 396,365 295,313 230,400 922,078 310,852 1,232,930
2015/16 399,000 19,139 418,139 290,9384) 313,500 1,022,577 321,506 1,344,083
Dr. Bernd Drouven Executive Board Chairman from November 1, 2014 to October 31, 2015
2014/15 495,000 4,112 499,112 412,500 316,800 1,228,412 110,000 1,338,412
2015/16 3) 47,500 1,042 48,542 39,583 39,188 127,313 10,000 137,313
Total 2014/15 1,251,000 40,290 1,291,290 1,003,126 777,600 3,072,016 580,852 3,652,868
2015/16 988,000 41,823 1,029,823 740,209 783,751 2,553,783 771,506 3,325,2891) Pension expenses in accordance with the German Commercial Code (HGB) amounted to € 230,041 (previous year: € 429,361) for Erwin Faust,
€ 180,000 (previous year: € 160,000) for Dr. Stefan Boel, € 10,000 (previous year: € 232,607) for Dr. Bernd Drouven and € 260,000 for Jürgen Schachler.2) Variable compensation for the period from July 1, 2016 to September 30, 2016.3) Due to Dr. Drouven’s departure, the table shows 1/12 of the compensation previously granted.4) Mr. Erwin Faust (Executive Board Spokesman from November 1, 2015 to June 30, 2016) and Dr. Stefan Boel assumed additional Executive Board
responsibilitieson an interim basis during the period mentioned. As a result, they received additional special compensation amounting to € 120,000 for Mr. Faust and € 105,000 for Dr. Boel. The variable compensation for several years for fiscal year 2015/16 is calculated according to the ratio of actual EBT to the target EBT of the Aurubis Group and the average of fiscal years 2013/14, 2014/15 and 2015/16. The average actual EBT amounts to € 231 million, a 66 % target achievement.
Dr. Schneider resigned from the Executive Board on June 30, 2015. The termination agreement foresaw a lump-sum compensation, which included the fixed compensation until April 30, 2016, as well as the variable compensation for fiscal year 2014/15 and the proportional variable compensa-tion for fiscal year 2015/16. The payout was in January 2016. The contributions to the additional defined contribution company pension plan were paid until April 30, 2016.
The Company has set up pension provisions on the basis of IFRS for the Executive Board members. Allocations to the pension provisions for active members of the Executive Board in the year under review amounted to € 771,506. This amount comprises the service cost and contributions to an external pension fund.
¤ T 003
Supervisory Board members who belong to the Personnel Committee or the Audit Committee of the Supervisory Board receive additional fixed compensation of € 15,000 per fiscal year and committee. Supervisory Board members who belong to the other Supervisory Board committees receive additional fixed compensation of € 7,500 per fiscal year and committee. Supervisory Board members who serve as a Supervisory Board committee chairman receive double this amount per fiscal year and committee chairmanship.
The fixed compensation for committee work is limited to € 25,000 per fiscal year for each Supervisory Board member pursuant to Section 12 (2) Articles of Association. The limit for each committee chairman amounts to € 50,000 per fiscal year.
Supervisory Board members who do not serve a complete fiscal year on the Supervisory Board or one of its commit-tees receive compensation corresponding to the duration of their office.
Furthermore, Supervisory Board members receive an atten-dance fee of € 1,000 for each meeting of the Supervisory Board and of its committees attended.
The following table provides details of the compensation of the individual members of the Supervisory Board for fiscal year 2015/16:
Company Management
Aurubis Annual Report 2015/16
4322 Executive Board23 Supervisory Board26 Supervisory Board Report
31 Corporate Governance45 Aurubis Shares

in € Name
Fixed compensation
Variable compensation
Compensation for committee
membershipAttendance
fees Total
Prof. Dr.-Ing. Heinz Jörg Fuhrmann
2014/15 80,000 60,000 20,000 5,000 165,000
2015/16 225,000 0 50,000 10,000 285,000
Renate Hold-Yilmaz 2014/15 40,000 30,000 10,000 5,000 85,000
2015/16 149,795 0 25,000 14,000 188,795
Burkhard Becker 2014/15 40,000 30,000 10,000 4,000 84,000
2015/16 75,000 0 22,500 10,000 107,500
Dr. Bernd Drouven 2014/15 3,397 2,548 425 0 6,370
2015/16 68,648 0 20,595 8,000 97,243
Dr. Joachim Faubel 2014/15 40,000 30,000 0 2,500 72,500
2015/16 75,000 0 0 5,000 80,000
Jan Koltze 2014/15 40,000 30,000 5,000 4,000 79,000
2015/16 75,000 0 15,000 10,000 100,000
Dr. Sandra Reich 2014/15 40,000 30,000 5,000 1,000 76,000
2015/16 75,000 0 7,500 6,000 88,500
Dr. Thomas Schultek 2014/15 40,000 30,000 5,000 5,000 80,000
2015/16 75,000 0 21,865 10,000 106,865
Rolf Schwertz 2014/15 40,000 30,000 0 2,500 72,500
2015/16 75,000 0 0 6,000 81,000
Prof. Dr. Fritz Vahrenholt 2014/15 40,000 30,000 10,000 5,000 85,000
2015/16 75,000 0 22,500 7,000 104,500
Ralf Winterfeldt 2014/15 0 0 0 0 0
2015/16 75,000 0 22,439 8,000 105,439
Dr.-Ing. Ernst J. Wortberg 2014/15 40,000 30,000 15,000 4,000 89,000
2015/16 75,000 0 37,500 10,000 122,500
Total 2014/15 443,397 332,548 80,425 38,000 894,370
2015/16 1,118,443 0 244,899 104,000 1,467,342
On this basis, the Supervisory Board members received a total of € 1,467,342.
Hamburg, December 13, 2016
The Executive Board
Jürgen Schachler Dr. Stefan Boel (Chairman) (Member)
¤ T 004
The Supervisory Board
Prof. Dr.-Ing. Heinz Jörg Fuhrmann (Chairman)
Aurubis Annual Report 2015/16
Corporate Governance44

Aurubis Shares on the Capital Market
High volatility on stock marketsDevelopments on the stock markets were strongly impacted by the policies of the world’s leading central banks during fiscal year 2015/16. Hopes for both additional monetary eas-ing measures from the European Central Bank and a post-ponement of the US interest rate reversal drove the DAX to 11,382 points in November 2015. At the turn of 2015/16, uncertainties related to the US interest rate reversal, the weak commodity markets with a massive oil price decline and renewed concerns about the Chinese economy strained stock markets. The DAX reached the fiscal-year low of 8,753 points on February 11, 2016. The upward trend on the mar-kets that took effect in mid-February was dampened again by the Brexit decision of the British people on June 23, 2016. The DAX fell below the 10,000-point mark. Supported by more robust economic data from the eurozone and the US, as well as the US Federal Reserve’s postponement of the interest rate increase, however, the markets recovered in the following months and the DAX closed at 10,511 points on September 30, 2016. The development of the MDAX, in which Aurubis is listed, was aligned with the DAX.
Aurubis shares strained by profit-taking and volatile market developments after very good startAurubis shares had a very good start to fiscal year 2015/16. Supported by our good results in 2015, the stock markets’ upswing and the resulting positive analyst assessments, it reached a new all-time high of € 61.68 on October 23, 2015. After the record results of fiscal year 2014/15 were published on December 11, 2015, the share price nevertheless fell by 19 % compared to the previous day, to € 46.79. The prospect of much lower results in fiscal year 2015/16, primarily due to our large-scale shutdown scheduled in Pirdop and the weakening scrap and sulfuric acid markets, led to profit-taking in a ner-vous market environment. The general negative market trend in the commodity sector and the profit warning on January 27, 2016 placed additional pressure on the Aurubis share price, causing it to hit the fiscal-year low of € 37.54 on January 29, 2016. With the upward tendency on the capital markets start-ing in mid-February, and our business development fulfilling the expectations of capital market actors, the shares gained ground again as the year went on and recovered to € 50.99 on September 23, 2016. The shares ended the fiscal year at € 49.88 on September 30, 2016. The price decrease compared to the record-breaking year 2014/15 was therefore 12 %. During
Aurubis share performance compared with the DAX and MDAX, from October 1, 2015 to September 30, 2016¤ G 01
60
80
100
120
140
October November December January February March April May June July August September
indexed to 100 %
Aurubis share (Xetra) MDAX DAX
See Glossary, page 197.
Company Management
Aurubis Annual Report 2015/16
4522 Executive Board23 Supervisory Board26 Supervisory Board Report
31 Corporate Governance45 Aurubis Shares

the same period, the MDAX rose by 12 % and the DAX increased by 9 %. Market capitalization was € 2,242 million as at fiscal year-end (previous year: € 2,558 million).
Aurubis shares remain an attractive investment. Sharehold-ers who invested a converted amount of € 1,000 at the time of Aurubis’ initial public offering in 1998 and reinvested the dividends they received (without a tax deduction) into Aurubis shares had a portfolio value of € 6,693 at the end of September 2016. This is a 570 % increase in value or a total annual return of 10.99 %. The MDAX recorded a 356 % increase in value during the same period.
Trading volume of Aurubis shares exceeds previous yearThe share price volatility was reflected in the trading volume: the daily average Xetra trading volume increased by 6 % to 204,776 shares (previous year: 193,641 shares).
Proportion of institutional investors increases slightlyAurubis maintained its stable and well-diversified share-holder structure in fiscal year 2015/16. Salzgitter AG contin-ues to hold 25 % of the share capital. An analysis of the shareholder structure carried out in October 2016 showed that the proportion of institutional investors increased to 46 % (previous year: 40 %). This category grew in North America and Germany in particular. Most institutional investors are located outside Germany. The proportion of shares held by retail shareholders decreased to 29 % (previous year: 35 %).
See Glossary, page 198.
Key figures of Aurubis shares
2015/16 2) 2014/15 2) 2013/14 2) 2012/13 2) 2011/12 2)
Closing price as at fiscal year-end 1) in € 49.88 56.90 39.16 44.80 45.35
Year high (close) 1) in € 61.68 59.68 49.49 57.24 46.60
Year low (close) 1) in € 37.54 36.43 36.19 38.68 35.44
Market capitalization as at fiscal year-end 1) in € million 2,242 2,558 1,761 2,014 2,039
Number of shares as at fiscal year-end
in thousand units 44,956.7 44,956.7 44,956.7 44,956.7 44,956.7
Dividend or recommended dividend in € 1.25 1.35 1.00 1.10 1.35
Payout ratio in % 46 53 51 46 54
Dividend yield in % 2.5 2.4 2.6 2.5 3.0
Operating earnings per share in € 3.64 5.68 2.17 2.06 4.58
Operating price/earnings ratio as at fiscal year-end 13.70 10.02 18.05 21.75 9.901) Xetra disclosures.2) Values “operationally” adjusted by valuation results from the use of the average cost method in accordance with IAS 2, by copper price-related valuation
effects on inventories and by effects from the purchase price allocation, mainly property, plant and equipment, from fiscal year 2010/11 onwards.
¤ T 005
Aurubis Annual Report 2015/16
Aurubis Shares46

Executive Board and Supervisory Board suggest dividend of € 1.25The objective of our dividend policy is to allow our share-holders to participate in the Company’s success adequately and continuously. The Executive Board and Supervisory Board intend to recommend a dividend of € 1.25 at the Annual General Meeting on March 2, 2017. This corresponds to a payout ratio of 46 % of Aurubis AG’s earnings (previous year: 53 %). The return on the share based on the closing price as at September 30, 2016 amounts to 2.5 % (previous year: 2.4 %).
Intensive dialogue with institutional and retail investorsThe volatile market environment, the varying developments on our sub-markets and the Company’s resulting earnings trend led to a high demand for information among capital market participants in fiscal year 2015/16. We therefore con-tinued to expand our intensive communication with institu-tional and retail investors and other interested individuals about developments in our business promptly, continuously and purposefully using different channels.
For example, we expanded the features of the online Annual Report on our website and made it even more user-friendly.
Shareholder structure
15.4 Germany 8.6 Rest of Europe 5.7 UK/Ireland15.8 North America 0.5 Others
46 (40)Institutionalinvestors
29 (35)Retailinvestors
25 (25)Salzgitter AG
in % (prior-year figures in parentheses)
Dialogue with institutional investors was once again a signifi-cant pillar of our capital market communication. At a number of capital market conferences and roadshows at the main financial centers in Europe and North America, we presented the Aurubis Group’s business situation and potential to insti-tutional investors and financial analysts. When the quarterly reports were published, the Executive Board explained the results and future outlook for the fiscal year in conference calls and in a live event. Moreover, investors visited our sites in Hamburg and Lünen to learn about our operating processes, plants and products.
In September 2016 we invited analysts and institutional investors to the “Aurubis Capital Market Day” in Hamburg. With technical presentations and a plant tour, we provided participants with firsthand, comprehensive insights into our operating business.
Aurubis AG is observed by a number of international financial analysts. A total of 21 financial institutions regularly published recommendations and analyses about Aurubis’ shares during fiscal year 2015/16. Berenberg and Credit Suisse, two renowned international banks, began covering Aurubis for the first time. The ratings were as follows at the end of the fiscal year:
Overview of analyst recommendationsNumber of analysts as at September 30, 2016
9Hold/neutral
0Sell/ underperform
12Buy/outperform
¤ G 02
¤ G 03
Company Management
Aurubis Annual Report 2015/16
4722 Executive Board23 Supervisory Board26 Supervisory Board Report
31 Corporate Governance45 Aurubis Shares

We had the opportunity to speak with our retail sharehold-ers during two dialogue events in Hamburg and Lünen. This provided them with the opportunity to get to know the sites and to receive information about the Group’s current development and economic environment in discussions with the Executive Board and other employees. We also held additional presentations for retail shareholders at events organized by private shareholder associations. The high level of interest in our shares was also evident at our well-attended Annual General Meeting on February 24, 2016, in which 1,500 shareholders participated.
We used ad hoc announcements to keep the capital markets informed about notable developments. These included an announcement on October 2, 2015 about the appointment of Mr. Jürgen Schachler as the new Executive Board Chairman of the Aurubis Group, a profit warning on January 27, 2016 and a positive profit alert on April 25, 2016.
Current information on the development of the Company is available on our website. We provide financial reports, analyst presentations and additional publications in the download center.
Information on Aurubis shares
Security identification number: 676650
International Securities Identification Number (ISIN):
DE 000 67 66 504
Stock market segment: MDAX
Stock exchanges:
Regulated market: Frankfurt am Main and Hamburg; unofficial market: Berlin, Düsseldorf, Hanover, Munich, Stuttgart, Tradegate
Market segment: Prime Standard
Issue price: € 12.78
Average daily trading volume: 204,776 shares in Xetra trading
Deutsche Börse code: NDA
Reuters code: NAFG
Bloomberg code: NDA_GR
>www.aurubis.com
¤ T 006
Aurubis Annual Report 2015/16
Aurubis Shares48

Analyst coverage 2015/16
Baader Bank Christian Obst
Bankhaus Lampe Marc Gabriel
Bank of America/Merrill Lynch Cedar Ekblom
Berenberg Fawzi Hanano
Commerzbank Ingo-Martin Schachel
Credit Suisse James Gurry
Deutsche Bank Katja Filzek
DZ Bank Dirk Schlamp
Exane BNP Paribas Daniel Lurch
Goldman Sachs Eugene King
Haspa Ingo Schmidt
Hauck & Aufhäuser Henning Breiter
Independent Research GmbH Sven Diermeier
Kepler Cheuvreux Rochus Brauneiser
LBBW Jens Münstermann
Macquarie Research Alon Olsha
Morgan Stanley Dan Shaw
NordLB Holger Fechner
Quirin Bank AG Klaus Soer
Steubing AG Michael Broeker
M.M. Warburg Eggert Kuls
¤ T 007
Company Management
Aurubis Annual Report 2015/16
4922 Executive Board23 Supervisory Board26 Supervisory Board Report
31 Corporate Governance45 Aurubis Shares

50

COMBINED MANAGEMENT REPORT
52 Foundations of the Group52 Business model of the Group54 Corporate control56 Research, development and innovation57 Human resources60 Sustainability, environmental protection, energy and
climate, occupational health66 Economic Report
66 General economic conditions67 Conditions specific to the industry69 Economic development in the Aurubis Group 78 Business performance in the Business Units85 Executive Board assessment of the
Aurubis Group during fiscal year 2015/1686 Results of operations, financial position and net assets of Aurubis AG
90 Subsequent Events90 Risk and Opportunity Report
90 Integrated risk and opportunity management90 Risk Management System91 Independent monitoring91 Explanation of relevant risks95 Internal control system relating to the consolidated
accounting process/accounting process96 Opportunity management system96 Explanation of relevant opportunities98 Assessment of the Group’s risk and opportunity situation
99 Forecast Report99 Overall economic development100 Development on the markets relevant to our business102 Business and earnings expectations for the Aurubis Group104 General statement on the future development of the Aurubis Group
106 Legal Disclosures106 Declaration on corporate governance pursuant to
Section 289a German Commercial Code (HGB) 106 Takeover-related disclosures and explanations
Aurubis Annual Report 2015/16
51

Foundations of the Group
Business model of the Group
Business activitiesAurubis AG is an integrated copper group whose main activities are copper concentrate processing, metal recycling and fabrication of a variety of copper products. Precious metals and specialty products complete our product range.
The company’s headquarters, which is also home to key production facilities, is located in Hamburg, Germany. The Group’s sites are primarily located in Western Europe, with larger production centers in Germany, Belgium and Bulgaria. Outside Europe, Aurubis also has a production site in the USA and a global sales and service network.
About 6,450 employees work for Aurubis worldwide.
Business model The Aurubis Group’s business model links the production and processing of copper. The necessary raw materials are purchased, as the company doesn’t have its own mines or stakes in mines. Aurubis primarily processes copper concentrates that are mined from ores and sourced on the global market. The processing of purchased intermediates, copper scrap and other metal-bearing recycling materials plays an important role as well.
The product portfolio mainly comprises standard and specialty products made of copper and copper alloys. These include copper cathodes, the product format traded on the international metal exchanges. They are the starting product for fabricating additional copper products, but they can also be sold directly. Aurubis processes copper into continuous cast copper wire rod, shapes, rolled products, strip, specialty wire and profiles.
Other elements found in copper raw materials are processed into additional products, in particular precious metals, sulfuric acid and iron silicate.
Aurubis’ direct customers include companies in the copper semis industry, the electrical and electronics sector, the chemical industry and suppliers in renewable energies, construction and the automotive business.
Group structureThe Aurubis Group’s organizational structure is oriented towards its underlying business model. The Group’s organizational structure is made up of two operating Business Units (BUs): BU Primary Copper and BU Copper Products. The segment reporting pursuant to IFRS 8 is also based on this structure.
BU Primary Copper is made up of the production facilities for processing copper concentrates and producing copper cathodes at the Hamburg and Pirdop sites. Furthermore, the precious metals division in Hamburg, which is centralized for the entire Group, is part of this BU.
BU Copper Products produces and markets continuous cast wire rod, continuous cast shapes, rolled products and specialty products. From an organizational perspective, the product business is divided into the following Business Lines (BLs): Rod & Shapes, Flat Rolled Products, Bars & Profiles and Marketing Cathodes. Recycling is also part of this BU within the organization.
The main sites are Hamburg, Lünen, Stolberg, Emmerich (Germany), Olen (Belgium), Zutphen (Netherlands), Pori (Finland), Avellino (Italy) and Buffalo (USA). Processing centers in the United Kingdom, Slovakia and Italy, as well
BU Copper ProductsBU Primary Copper
Raw materials
» Cable and wire industry » Construction » Machinery and
plant engineering » Transport » Chemistry » Other applications
Processors and end users
Cathodes
Sulfuric acid
Precious metals
By-metals
Iron silicate
Cathodes
Wire rod
Shapes
Flat rolled products
Specialty profiles
Recycling
Business model: integrating copper production and processing¤ G 04
» Copper concentrates » Blister copper
» Copper scrap » E-scrap
» Other materials for recycling
See Glossary, page 198.
See Glossary, page 196.
See Glossary, page 197.
See Glossary, page 196.
Combined Management Report
Aurubis Annual Report 2015/16
52

Business model of the Group
Business activitiesAurubis AG is an integrated copper group whose main activities are copper concentrate processing, metal recycling and fabrication of a variety of copper products. Precious metals and specialty products complete our product range.
The company’s headquarters, which is also home to key production facilities, is located in Hamburg, Germany. The Group’s sites are primarily located in Western Europe, with larger production centers in Germany, Belgium and Bulgaria. Outside Europe, Aurubis also has a production site in the USA and a global sales and service network.
About 6,450 employees work for Aurubis worldwide.
Business model The Aurubis Group’s business model links the production and processing of copper. The necessary raw materials are purchased, as the company doesn’t have its own mines or stakes in mines. Aurubis primarily processes copper concentrates that are mined from ores and sourced on the global market. The processing of purchased intermediates, copper scrap and other metal-bearing recycling materials plays an important role as well.
The product portfolio mainly comprises standard and specialty products made of copper and copper alloys. These include copper cathodes, the product format traded on the international metal exchanges. They are the starting product for fabricating additional copper products, but they can also be sold directly. Aurubis processes copper into continuous cast copper wire rod, shapes, rolled products, strip, specialty wire and profiles.
BU Copper ProductsBU Primary Copper
Raw materials
» Cable and wire industry » Construction » Machinery and
plant engineering » Transport » Chemistry » Other applications
Processors and end users
Cathodes
Sulfuric acid
Precious metals
By-metals
Iron silicate
Cathodes
Wire rod
Shapes
Flat rolled products
Specialty profiles
Recycling
Business model: integrating copper production and processing¤ G 04
» Copper concentrates » Blister copper
» Copper scrap » E-scrap
» Other materials for recycling
See Glossary, page 198.
See Glossary, page 196.
as a global sales and distribution network, complete the product business.
Group-wide functions support the operating Business Units. The Supply Chain Management division, which is responsible for raw material management, as well as the sale of sulfuric acid and other specialty products across the Group, should be emphasized in particular.
A list of investments pursuant to Section 313 (2) German Commercial Code (HGB) as at September 30, 2016 is provided in the notes to the financial statements.
Significant parameters relevant to the business The significant parameters specific to the business are the treatment and refining charges for raw materials, the copper price, cathode premiums and product surcharges for copper products, as well as sales revenues for sulfuric acid. Moreover, efficient metal gains in our facilities also lead to an earnings effect.
The copper price is set first and foremost on the London Metal Exchange (LME), which facilitates physical transactions, hedging and investment business. The price represents a benchmark beyond exchange trading, and is the basis for establishing prices in the raw material and product business.
See Glossary, page 197.
See Glossary, page 198.
>www.lme.com
See Glossary, page 198.
Combined Management Report
Aurubis Annual Report 2015/16
52 Foundations of the Group 66 Economic Report 90 Subsequent Events
90 Risk and Opportunity Report 99 Forecast Report106 Legal Disclosures
53

Treatment and refining charges (TC/RCs) are negotiated with suppliers when purchasing copper-bearing raw materials. The TC/RC trend depends on the supply and demand structure on the global markets. TC/RCs are essentially surcharges on the purchase price of metals, charged for turning these raw materials into the commodity exchange product – copper cathodes – as well as other metals.
The metal exchange and market quotation for copper serves as the price basis for our copper product sales. The Aurubis cathode premium and product surcharges, which are charged for converting cathodes into copper products, are also part of the sales price.
Pricing along the value chain(schematic illustration)
Procurementprice for
concentratesand recyclingraw materials
Treatmentand refining
charges
LMEcopperprice
Cathodepremium
and productsurcharge
Sales pricefor copper
product
External factors that also influence business development include economic performance in key countries and activities on the international financial markets; the political, legal and societal conditions; changes in the exchange rate and interest rate level; and the situation on our relevant markets.
Corporate control
Control systemThe main objective of the management control system is to increase the Aurubis Group’s corporate value by generating a positive overall contribution to the enterprise beyond the costs of capital.
Corporate control parametersIn order to measure financial success for the medium and long term within the scope of value-oriented corporate control, Aurubis uses the following central control parameters:
» Operating consolidated earnings (operating EBT = earnings before taxes)
» Operating return on capital employed (operating ROCE) in the Group
These parameters are regularly presented to the entire Executive Board and are utilized for internal control purposes. The Executive Board’s variable compensation is also oriented to these parameters.
The Aurubis Group reports in accordance with International Financial Reporting Standards (IFRS). When the average cost method is applied in accordance with IAS 2, metal price fluctuations systematically lead to considerable discontinuities in the presentation of the Aurubis Group’s results of operations, financial position and net assets.
¤ G 05
See Glossary, page 199.
Combined Management Report
Aurubis Annual Report 2015/16
54

In our view, these measurement effects lead to an economically inaccurate presentation in the Management Report. Furthermore, a purchase price allocation resulted in one-time effects that would also lead to a distortion in the Aurubis Group’s presentation of the results of operations, financial position and net assets.
In order to present the Aurubis Group’s operating success more independently of these measurement effects on internal control systems, internal Group reporting and control are carried out on the basis of the operating result.
The operating result is derived from the IFRS results of operations by:
» Adjustment for measurement effects deriving from the use of the average cost method in accordance with IAS 2,
» Adjustment for copper price-related measurement effects on inventories and
» Adjustment by impacts from purchase price allocations, primarily on property, plant and equipment, from fiscal year 2010/11 onwards.
Operating return on capital employed (ROCE)
in € million 9/30/2016 9/30/2015
Fixed assets 1,343 1,327
Inventories 1,494 1,374
Trade accounts receivable 242 307
Other receivables and assets 211 212
– Trade accounts payable (798) (761)
– Provisions and other liabilities (379) (480)
Capital employed as at the balance sheet date 2,114 1,979
Earnings before taxes (EBT) 213 343
Financial result 16 27
Earnings before interest and taxes (EBIT) 229 370
Return on capital employed (operating ROCE) 10.9 % 18.7 %
Operating ROCE shows the ratio of operating earnings before interest and taxes (EBIT) to operating capital employed as at the balance sheet date, and indicates the return on capital employed.
Corresponding to the calculation of the operating result, operating capital employed is derived by adjusting the balance sheet items in accordance with IFRS by the effects previously mentioned.
A reconciliation of the balance sheet and income statement from IFRS to operating figures is provided in the Economic Report of the Management Report.
¤ T 008
Combined Management Report
Aurubis Annual Report 2015/16
52 Foundations of the Group 66 Economic Report 90 Subsequent Events
90 Risk and Opportunity Report 99 Forecast Report106 Legal Disclosures
55
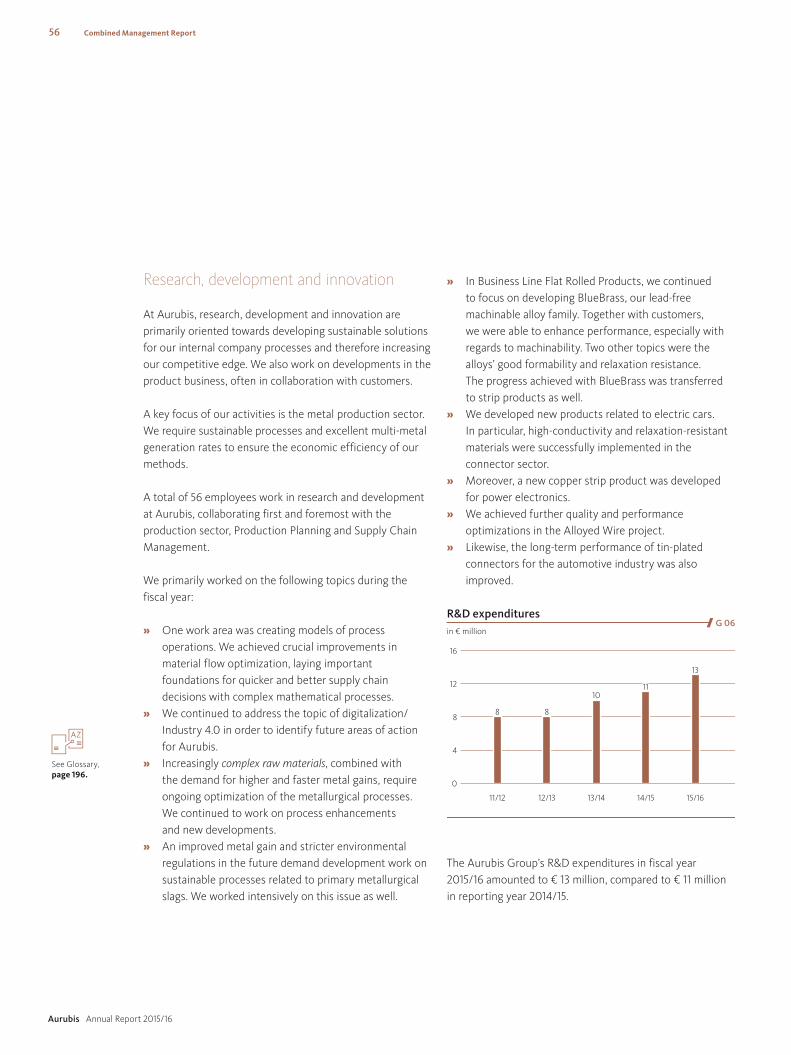
Research, development and innovation
At Aurubis, research, development and innovation are primarily oriented towards developing sustainable solutions for our internal company processes and therefore increasing our competitive edge. We also work on developments in the product business, often in collaboration with customers.
A key focus of our activities is the metal production sector. We require sustainable processes and excellent multi-metal generation rates to ensure the economic efficiency of our methods.
A total of 56 employees work in research and development at Aurubis, collaborating first and foremost with the production sector, Production Planning and Supply Chain Management.
We primarily worked on the following topics during the fiscal year:
» One work area was creating models of process operations. We achieved crucial improvements in material flow optimization, laying important foundations for quicker and better supply chain decisions with complex mathematical processes.
» We continued to address the topic of digitalization/Industry 4.0 in order to identify future areas of action for Aurubis.
» Increasingly complex raw materials, combined with the demand for higher and faster metal gains, require ongoing optimization of the metallurgical processes. We continued to work on process enhancements and new developments.
» An improved metal gain and stricter environmental regulations in the future demand development work on sustainable processes related to primary metallurgical slags. We worked intensively on this issue as well.
» In Business Line Flat Rolled Products, we continued to focus on developing BlueBrass, our lead-free machinable alloy family. Together with customers, we were able to enhance performance, especially with regards to machinability. Two other topics were the alloys’ good formability and relaxation resistance. The progress achieved with BlueBrass was transferred to strip products as well.
» We developed new products related to electric cars. In particular, high-conductivity and relaxation-resistant materials were successfully implemented in the connector sector.
» Moreover, a new copper strip product was developed for power electronics.
» We achieved further quality and performance optimizations in the Alloyed Wire project.
» Likewise, the long-term performance of tin-plated connectors for the automotive industry was also improved.
R&D expendituresin € million
11/12 15/1614/1513/1412/13
0
4
8
12
16
13
8 8
1011
The Aurubis Group’s R&D expenditures in fiscal year 2015/16 amounted to € 13 million, compared to € 11 million in reporting year 2014/15.
See Glossary, page 196.
¤ G 06
Combined Management Report
Aurubis Annual Report 2015/16
56

Human resources
Personnel strategyAurubis’ business success is founded to a significant degree upon the company’s capable, productive and committed employees, meaning the personnel strategy is of central importance. It is continuously developed on the basis of the business strategy and corporate values, together with the operating entities. In the process, internal areas of improvement are taken into account, as well as changes and trends on the employment markets and in society.
In fiscal year 2015/16, our strategic HR work has focussed on various areas, including the targeted development of our employees’ skills through modern training and continuing education, and through up-to-date personnel development formats. The development of management skills in light of changing roles and responsibilities was especially significant. Furthermore, the identification of talent was another key issue within the scope of reliable personnel and successor planning. We revised the performance management system across the Group and developed new formats for targeted feedback and performance evaluations, which are now being implemented.
We are improving communication among our specialists and managers through cross-site and cross-functional projects and initiatives. In this way, we promote collaboration in the Group, create synergies and establish a culture of learning from one another for the purpose of continuous improvement.
Personnel structureA total of 6,454 employees worked in the Aurubis Group worldwide as at September 30, 2016. Of this number, 56 % were employed at German sites and 44 % worked in other countries.
Aurubis Group personnel are mainly dispersed among the following countries: Germany (3,621), Bulgaria (841), USA (655), Belgium (570), Netherlands (314), Finland (237) and Italy (130).
Aurubis Group employeesNumber as at September 30
11/12 15/1614/1513/1412/13
0
2,000
4,000
6,000
8,000
1) Excluding Schwermetall Halbzeugwerk GmbH & Co. KG.
6,321 1)6,372 6,563 6,359 1) 6,454 1)
Aurubis Group personnel structureNumber as at September 30, 2016
4,044Blue collar
298Apprentices
2,112White collar
¤ G 07
¤ G 08
Combined Management Report
Aurubis Annual Report 2015/16
52 Foundations of the Group 66 Economic Report 90 Subsequent Events
90 Risk and Opportunity Report 99 Forecast Report106 Legal Disclosures
57

Diversity and promotion of female employeesStaff diversity is an important factor for the Aurubis Group’s sustainable economic success. This refers not only to diversity from a cultural perspective, but also from the perspective of national background, professional expertise, age group, as well as a gender-balanced workforce.
Aurubis employs people from many different countries. This diversity gives Aurubis access to an extensive talent pool and the benefit of the different perspectives and greater strength in problem-solving and innovation that come with cultural diversity.
A commitment to equal opportunities among male and female employees is not only enshrined in Aurubis’ Code of Conduct (Verhaltenskodex) but has been further reinforced by the signing of the Gender Equality Charter as part of the social partnership with employee representatives.
With the German law regarding equal participation of men and women in management positions in the private sector and in public service, a target of 20 % female managers was set for each of the first two management levels under the Executive Board. We missed this by a small margin at the first management level, in which six of 32 managers were female, for a proportion of 19 %. We achieved the target at the second management level, which currently comprises nine female employees out of 45 in total, equal to 20 %.
The proportion of female applicants for technical jobs is still low. Aurubis therefore continues to pursue the goal of raising awareness of technical occupations among women and recruiting them for these roles. We promote this by participating in initiatives such as mint:pink, for example.
The proportion of female employees in the Group is 12.1 %, slightly higher than the prior-year level of 11.9 %.
Employee compensation and profit-sharingAurubis has a consistent compensation system for its management. This compensation system is based on an analytical job evaluation, clearly established income brackets and a target bonus model with defined levels of performance measurement and weighting. These factors allow managers to assess what performance is required on the Group, function and individual levels, and how they should be evaluated.
Employees participate in the Aurubis Group’s success. Performance and success-oriented compensation is a fundamental element of the remuneration system at Aurubis AG. Motivated, high-performing employees make a decisive contribution to the company’s achievements and value. The performance of an individual is always assessed in connection with the performance of the team, the department or the production sector. Individual performance and collective team performance serve as parameters in this case.
In 2016, we once again gave employees at the German sites the opportunity to acquire a limited number of Aurubis AG shares at favorable conditions. Overall, 1,338 employees participated, purchasing a total of 26,240 shares.
Personnel recruitmentDemographic change continues to be a challenge for Aurubis. We respond to this by recruiting skilled personnel. We have implemented a targeted expansion of our marketing in universities in relation to technical and commercial professions. Our collaboration with partner universities has remained intensive. Moreover, we annually provide about 50 student internships in Hamburg, while scholarships and supervised thesis papers complete our offering to young potential employees. The new Aurubis Campus department has also played a role, expanding our collaboration with universities.
>www.aurubis.com
>http://www.ccre.org/docs/charte_egalite_en.pdf
>www.mintpink.de
Combined Management Report
Aurubis Annual Report 2015/16
58

Education and trainingAttracting specialists and managers who are appropriately skilled to meet the company’s needs is of central importance for Aurubis.
We once again took part in various fairs and events this year, for example the Talent Campus in cooperation with Hamburg-Harburg Technical University. The objective is to raise interest and recruit young people for technical vocations in the so-called MINT subjects (mathematics, informatics, natural sciences and technology).
The “Your Future Starts Here” career information day took place in Hamburg for the fifth time on June 18, with the purpose of attracting apprentices. Three apprentices were recruited directly and 60 additional invitations to interviews and long tests were distributed. Our sites in Stolberg and Lünen took part in the Apprenticeship Night once again.
At a reception on September 6, 2016, Hamburg Mayor Olaf Scholz and Aurubis AG Executive Board Chairman Jürgen Schachler welcomed 78 young people who began apprenticeships at Aurubis in Hamburg, Lünen and Fehrbellin in 2016. The Aurubis Group offers apprenticeships in 19 different vocations to young people. The integration and training of registered refugees is important to us. In the AV 10-Plus internship model, 12 school-age participants were introduced to various vocations and were supported in the attainment of a school certificate three days a week at Aurubis.
As of September 30, 2016, we employed 180 apprentices in Hamburg, making up a total of 8 % of the workforce. The proportion of apprentices with foreign citizenship was roughly 12 %.
To reinforce collaboration within Aurubis AG, there was an apprentice exchange across sites this year.
Staff and organizational developmentThe targeted personal development of our employees has high priority. The training offerings in our leadership and qualification program were developed and adjusted to the Group’s needs. Options for managers and foremen were expanded in particular. Furthermore, employees took part in a number of technical/specialist training measures as well.
In addition to individual, personal development, we also focus on professionally supporting change processes in different company divisions.
Thanks from the Executive BoardWe would like to thank our employees for their work and dedication in fiscal year 2015/16. Only with the commitment and motivation of our employees was it possible to develop the Group successfully. Our thanks also go to the employee representatives, with whom we worked closely and constructively.
>www.nachwuchs campus.de
Combined Management Report
Aurubis Annual Report 2015/16
52 Foundations of the Group 66 Economic Report 90 Subsequent Events
90 Risk and Opportunity Report 99 Forecast Report106 Legal Disclosures
59

Sustainability, environmental protection, energy and climate, occupational health
Sustainability as part of the company strategySustainable conduct and economic activities are central components of Aurubis’ company strategy and man-agement. This involves having a conscientious attitude towards the environment and limited natural resources. It also includes responsible interactions with employees, suppliers, customers, neighbors, and the plant areas and communities where Aurubis is active.
Responsible business practices are also the foundation of our operating business. Together with growth, this forms the foundation for sustainable economic success and a secure future for the company.
Internal regulations and management systems, the PRIMA company values and statutory provisions create the basis of our sustainable activities. PRIMA represents the Group’s corporate values: Performance, Responsibility, Integrity, Mutability and Appreciation.
Aurubis respects human rights and advocates for their protection. Compliance with the internationally recognized core labor standards of the International Labour Organization (ILO) are of fundamental significance for us. Aurubis has participated in the United Nations Global Compact since December 2014, thereby committing to implement the principles of the Global Compact. Aurubis is also listed in the Global Challenges Index, a sustainability index.
Sustainability as part of the corporate cultureWe integrate sustainability into our corporate culture throughout the Group and across business processes. We have initiated a variety of measures to minimize the possible impact of our business activities on the environment, but also on employees and society, as much as possible. Sustainability is also a fixed component of vocational training in the Group.
Aurubis developed a comprehensive Sustainability Strategy in fiscal year 2012/13, which establishes the main areas of activity for the coming years. Based on this strategy, we have developed targets in the categories of economy, environment and people, as well as action plans and measures for individual areas. Many of these have already been implemented. For example, various copper-based materials and innovations were developed, the emissions targets for water and air were met and the proportion of complex recycling materials processed was expanded further. Additionally, we increased occupational safety measures again, dealt more intensively with responsibility in the supply chain and reinforced dialogue with our interest groups around Europe, for instance regarding the topic of the circular economy.
The increasing number of questions and requirements from our stakeholders validates our efforts. For instance, customers are increasingly placing a stronger emphasis on environmentally friendly products and climate protection, but also on modern production processes and a secure and responsible raw material supply. This is also demonstrated by the fact that it’s not just investors, but also customers who value Aurubis’ participation in the investor initiative for climate protection, the Carbon Disclosure Project (CDP). After the CDP named Aurubis Best Newcomer Germany in 2015, the company was given an “A-” rating in the 2016 CDP Climate Performance Leadership Index. At the same time, the CDP classified Aurubis as one of the top seven companies in the MDAX.
See Glossary, page 196.
>www.cdp.net
See Glossary, page 198.
Combined Management Report
Aurubis Annual Report 2015/16
60

Recycling expectations from suppliers, policymakers and interest groups have also increased. In this area, resource efficiency, environmentally friendly recycling management and multi-metal recycling solutions play a role. The Aurubis Sustainability Day, which has taken place annually since 2014, once again provided a dialogue platform for representatives of government, business and society in November 2015. We addressed the topics of the circular economy and the prevention of illegal waste transports.
Organizational structureSustainability is a Group responsibility at Aurubis and is part of Corporate Communications & External Affairs. Sustainability Management carries out the daily work in this area together with representatives from all of the Group’s departments.
Comprehensive sustainability reportingThe fifth Aurubis Group Sustainability Report was published in April 2016. It provides an extensive and detailed sustainability balance of the two previous fiscal years, 2013/14 and 2014/15, and is supplemented with online reporting.
The report’s alignment with the internationally recognized reporting standard Global Reporting Initiative (GRI) makes the company’s reporting on sustainability and the Sustainability Strategy more transparent and easier to compare. In addition to the relevant key parameters, the Sustainability Report outlines successes, targets, the degree of target achievement and challenges.
The current Sustainability Report follows the reporting requirements of GRI G4, and simultaneously serves as the Communication on Progress for the UN Global Compact (UNGC). In the course of producing the report, the company’s main sustainability issues were addressed in a targeted manner. A materiality analysis that was conducted after surveying internal and external stakeholders in fall 2015 confirmed the action areas and targets included in the Aurubis Sustainability Strategy.
Aurubis is therefore also well positioned to fulfill the EU Directive on Non-Financial Information Disclosure (“CSR Directive”), which will be transposed into German law by December 6, 2016 and will then impact fiscal years that start after December 31, 2016. The Sustainability Report and Annual Report are already produced with close cooperation between the relevant departments.
Environmental protection in the GroupRaw material processing and production in the Aurubis Group are carried out using state-of-the-art plant technologies that reflect very high environmental protection standards and conserve natural resources. New investments are aligned with these principles. The environmental protection issues include constantly improving air quality, energy efficiency and water pollution control, as well as conserving natural resources for future generations. These topics are established Group standards, but there are also concrete targets for individual sites (see the Environmental Report and the Aurubis AG Environmental Statement).
Capital expenditure for environmental protection in Aurubis copper production in € million
0
20
40
60
80
100
23.1
38.4
19.627.5 29.6 27.4
51.6
81.5
34.4
15.2
‘06 ‘15‘07 ‘08 ‘09 ‘10 ‘11 ‘12 ‘13 ‘14
At € 15.2 million, capital expenditure for environmental protection in calendar year 2015 was lower than the previous year (€ 34.4 million). This is due to the fact that capital expenditure is often related to larger facility standstills, which weren’t carried out in calendar year 2015.
>www.aurubis.com
See Glossary, page 197.
See Glossary, page 197.
¤ G 09
Combined Management Report
Aurubis Annual Report 2015/16
52 Foundations of the Group 66 Economic Report 90 Subsequent Events
90 Risk and Opportunity Report 99 Forecast Report106 Legal Disclosures
61

Environmental management systems (in accordance with ISO 14001 in particular; supplemented by the participation of Aurubis AG in the Eco-Management and Audit Scheme, EMAS) support the implementation of the targets. Standards are continuously recorded, deviations are evaluated and corrective measures are initiated and monitored for effectiveness. Moreover, we have implemented and certified energy management systems in accordance with ISO 50001 at several sites. The annual external audit offers us the opportunity to have our environmental protection and energy efficiency measures validated by an independent third party in order to identify and utilize potential for improvement.
Environmentally sound copper production from primary raw materials, such as copper concentrates, and multi-metal recycling underpin the establishment of a responsible and demand-oriented copper supply in Europe. Copper is a crucial raw material that is also used for renewable energies in the expansion of electricity grids. Demand is rising, but resources are limited. Metal recycling is therefore not an end in itself but an important source of raw materials. Aurubis has globally recognized expertise in this area and the suitable technologies to recycle copper scrap and complex materials for recycling, such as electrical and electronic scrap. The objective is to return not just copper, but the by-metals to the economic cycle as well.
The group-wide environmental protection standards have been achieved in all areas; the expected emission reductions were significantly exceeded.
For example, specific dust emissions for primary and secondary copper production have fallen by 96 %, while SO2 emissions in primary copper production have been reduced by 85 % (reference year: 2000). When compared internationally, the Group is therefore a forerunner in reducing specific sulfur dioxide emissions.
We have also made significant improvements in water pollution control. We have reduced metal emissions to water in copper production processes from 7.2 to 1.0 g per ton of copper output since 2000, or by 87 %.
Compared to the previous year alone, emissions to water were reduced once again by more than a fifth. Our goal now is to maintain this low level into the future as well.
The following measures were implemented in fiscal year 2015/16 and are examples of actions that contributed significantly to improvements in environmental protection:
» The emission reductions established in voluntary agreements with the city of Hamburg were achieved, and the success of the implemented course of action was validated with measurements.
» A new off-gas treatment plant was commissioned at the Bulgarian site in Pirdop. It has been in normal operation since March 2016 and contributes to reducing sulfur dioxide and fugitive emissions further.
» At Aurubis Stolberg, the consumption of purified water was significantly decreased through optimizations in the processes. It was more than 40 % lower in 2015 compared to the previous year. Once implemented measures have fully taken effect, further reductions can be expected.
Aurubis continued its open dialogue with authorities and citizens across the Group again in 2015/16, in addition to various environmental projects: for example, we are participating in the three-year testing and development phase of the European Commission’s Product Environmental Footprint (PEF) together with the overarching European metal industry association Eurometaux and the European Copper Institute (ECI). The goal of this collaboration is to develop and test the methods for determining the environmental footprint. On this basis, the European Commission is striving to create a single market for “environmentally friendly products” and “environmentally friendly organizations”.
In Hamburg, we have been a member of the Environmental Partnership since 2003, and a member of the Partnership for Air Quality and Low-emission Mobility, which is coordinated by the city of Hamburg. The goal of the latter partnership is to reduce nitrogen dioxide emissions, which are caused by transport in particular. For this purpose, we
See Glossary, page 197.
See Glossary, page 198.
>http://ec.europa.eu/environment/eussd/smgp/policy_footprint.htm
>www.eci.org
Combined Management Report
Aurubis Annual Report 2015/16
62

also participated in the German model project Mobil.Pro.Fit® in collaboration with the environmental organization B.A.U.M. e. V. The goal of the project is to develop a sustainable and climate-friendly mobility concept.
We continue to raise employees’ awareness of all issues connected to environmental protection. A high level of individual environmental awareness is ultimately a key condition for successful environmental protection in the entire company.
Striving for energy and resource efficiency and environ-mental protection can nevertheless lead to conflicting goals. For instance, while processing complex recycling materials is very resource-efficient, it usually requires high energy consumption. To reduce our environmental impact to a minimum, we continuously work on further developing our environmental and climate protection measures.
Our Environmental Report contains more information on environmental protection in the Aurubis Group. It is available on the company website in the Responsibility section.
Energy supply, energy efficiency and climate change issues are of fundamental importanceCopper production entails very energy-intensive processes, meaning that developments in the energy sector were once again of great relevance to Aurubis in 2015/16. The German energy turnaround, the implementation of the EU Energy Efficiency Directive and the third European emissions trading period took center stage yet again.
Companies that emit carbon dioxide must have the appropriate permissions to do so. The competitiveness of European industry is impaired by additional local CO2 costs. To balance these effects, so-called carbon leakage sectors were established, including the copper industry. This status currently softens the effect of the general reduction of allocated CO2 certificates to a great extent.
>www.mobilprofit.de
>www.aurubis.com
Corporate Environmental Protection topics¤ G 10
Climate protection » Continued reduction in CO2 emissions » Example: Constructing turbines to use waste heat
in Hamburg and Lünen
Air » Reducing SO2 emissions by over 80 % in primary
copper production since 2000 (86 % reduction achieved in 2014)
» Reducing dust emissions in copper production by over 90 % since 2000 (96 % reduction achieved in 2014)
Water » Reducing metal emissions to water in copper
production by about 70 % since 2000 (83 % reduction achieved in 2014)
» Example: Operating new water treatment plants in Pirdop and Lünen
Soil » Reducing soil contamination » Example: Paving large parts of the plant premises
in Lünen and collecting rainwater
Noise » Reducing noise emissions » Example: Erecting a noise barrier in Olen
Waste » Increasing recycling rates » Examples: Stronger marketing of fayalite in Pirdop » Optimizing the separation plant at E.R.N.
Climateprotection
Waste
Noise
Air
Soil
Water
Combined Management Report
Aurubis Annual Report 2015/16
52 Foundations of the Group 66 Economic Report 90 Subsequent Events
90 Risk and Opportunity Report 99 Forecast Report106 Legal Disclosures
63

Aurubis has participated in the survey distributed by the Carbon Disclosure Project investor initiative since 2015. We were placed in the initiative’s leadership category in 2016. This distinction includes those copper products that contribute to increasing efficiency in applications, as well as effective production processes, energy management and investment in energy and CO2 efficiency optimizations. As an energy-intensive company, the efficient use of energy isn’t just an environmental responsibility for Aurubis, but also an economic one. All of the Group sites thus utilize energy as sparingly as possible.
In 2007 the EU member states agreed to reduce primary energy consumption by 20 % by 2020. The EU Energy Efficiency Directive (EED) went into effect on December 4, 2012. It outlines activities to strengthen energy efficiency that must be implemented by the member states. This includes the execution of mandatory energy audits. Currently, all of the main German sites in the Aurubis Group have developed an energy management system, carry out energy audits and are certified in accordance with DIN EN ISO 50001. We therefore fulfill the basic conditions to continue being subject to a lower German Renewable Energies Act (EEG) reallocation charge and lower energy/electricity taxes.
To enable the plants to communicate with each other about their experiences, we regularly carry out energy management and energy efficiency workshops, take part in the energy efficiency network of the German association WirtschaftsVereinigung Metalle and the Hamburg Industrial Association, and are also active within the networks at other Aurubis sites.
The city of Hamburg is striving to reduce its CO2 emissions by 40 % in 2020 compared to 1990 and by 80 % in 2050. The city is also seeking to make its district heating supply more climate-compatible in the medium term, and has hopes of using industrial waste heat to achieve this. At the Aurubis plant in Hamburg, a CO2-free waste heat potential
of about 60 MW and roughly 500 GWh p. a. were identified for district heating delivery in the sulfuric acid facility. The HafenCity East building development area is located close to the plant and is well-suited for taking one-third of our waste heat for its heat supply. Currently, we are negotiating with the relevant heat provider regarding heat delivery, and are also in discussions with additional interested parties and funding providers regarding ways to utilize all the extracted heat in a sensible way, achieving potential CO2 savings of around 140,000 t p. a. and reducing discharge into the Elbe River.
Exceedingly volatile electricity from renewable energy already makes up about 30 % of gross electricity production in the German electricity mix and suppresses conventional electricity since it is preferentially fed in. The result is that expensive gas power plants are rarely key to pricing these days, with the focus instead on mainly brown and hard coal power plants. Electricity exchange prices in the countries bordering Germany are also affected. The Aurubis Group bases its electricity supply in Germany on a virtual “power plant slice” based on hard coal. We therefore don’t benefit from the price reduction effects of renewable energies, but from falling coal prices worldwide and the low CO2 price level. The coal price fluctuated in the course of the fiscal year but remained at the same level overall.
The level of fees, especially those of the northern transmission grid operators and thus indirectly the distribution system operators, has increased significantly in the last several years. In light of scheduled grid expansions and increasing bottleneck measures (renewable energy load reductions, decreases in power plant capacities, international load balancing), a considerable increase should still be anticipated. Because of its consistent electricity consumption profile, Aurubis pays an individual grid charge, which is why general increases in charges don’t impact us fully.
>www.cdp.net
Combined Management Report
Aurubis Annual Report 2015/16
64

In order to protect international sectors like the copper industry from competitive disadvantages, the EU has already authorized limited compensation for electricity price increases stemming from CO2 emissions trading. Some EU member states, such as Germany, have passed corresponding funding guidelines. However, the compensation approved in Germany is only 50 % effective due to EU regulations in the copper industry.
After the wholesale prices for natural gas decreased by nearly half in the previous fiscal year, the downward trend continued in the past fiscal year as well. The reason for falling prices was first and foremost the good supply situation in Europe as well as the effects of lower oil prices. Due to the start of LNG (liquefied natural gas) imports from the US in 2016, we also expect a good natural gas supply in Europe in the future, despite decreasing production in the region. Experts thus expect natural gas prices to stay at the current level for the next few years.
By comparing key figures between different sites, significant savings potential has been calculated and developed for the water supply and water treatment. In addition to technical optimizations, an improved approach to water consumption has also led to lower water and water treatment costs without additional investments.
Health protection in the GroupThe responsibility of Corporate Occupational Safety & Health is to provide technical, organizational and personal conditions that prevent all work-related accidents and illnesses.
Among Aurubis employees, the accident frequency in fiscal year 2015/16, LTIFR (1-n) (Lost Time Injury Frequency Rate = number of work-related accidents with at least one lost shift per one million hours worked), decreased by 27 % compared to the previous year. The LTIFR (1-n) fell to 4.6, from 6.3 in the previous fiscal year, while the absolute number of accidents declined from 64 to 45.
With great sadness, we had to report a fatal accident involving an employee from an external company in fiscal year 2015/16.
We have been setting short-term and medium-term occupational safety targets since 2010 and are working towards Vision Zero, a completely accident-free work environment. In the medium term, an LTIFR (1-n) of ≤ 3.0 should be achieved by 2022 at the latest. In light of the favorable development in recorded accidents, we intend to adjust this objective and reach Vision Zero even faster.
Accident frequencyLTIFR = Lost Time Injury Frequency Rate
0
5
10
15
11/12
LTIFR (1-n)
12/13 13/14 14/15 15/16
LTIFR (4-n)
LTIFR (1-n) – accidents with lost time of at least one whole shiftLTIFR (4-n) – accidents with lost time of more than three whole shifts
11.7
7.2
9.1
6.77.8
6.5 6.35.3
4.6 4.4
See Glossary, page 198.
¤ G 11
Combined Management Report
Aurubis Annual Report 2015/16
52 Foundations of the Group 66 Economic Report 90 Subsequent Events
90 Risk and Opportunity Report 99 Forecast Report106 Legal Disclosures
65

Economic Report
General economic conditions
The International Monetary Fund (IMF) corrected its fall forecast for economic growth in 2016 downward from its April estimate and now expects an increase of 3.1 %, following a 3.2 % increase in 2015. While the global economy lost momentum, this was relatively marginal in light of the uncertainties and differences in individual countries and regions.
World trade also suffered in 2016. The World Trade Organization (WTO) recently forecast a 1.7 % increase in global trade volume, following a much more optimistic estimate of 2.8 % in April 2016.
The mood on the global financial markets improved with regards to the assessment of emerging markets, with a good overall view of Asia apart from China, and robust growth in India. However, political tensions and consequent uncertainties have increased in the industrialized economies. The IMF predicts economic growth of 1.6 % in these economies in 2016, following 2.1 % in 2015.
Expected GDP growth in 2016in %
0
2
4
6
8
World USA Euro-zone
Germany IndiaJapan China
Source: International Monetary Fund, Oct. 2016
3.1
7.6
1.6 1.7 1.7
0.5
6.6
In the US, the expected increase in the gross domestic product (GDP) in 2016 was corrected from 2.2 % in the July forecast to 1.6 % now. The strong US dollar is perceived as a strain for exports, which has led to a lack of investment; uncertainty also arose in the course of the presidential campaign and as a result of the Federal Reserve’s interest rate policy.
For the eurozone, the IMF anticipates 1.7 % growth in 2016 after 2 % in the previous year. The driving force behind the recovery, private consumption, lost momentum in the second quarter. In addition, the British people voted to leave the European Union in a referendum on June 23. The economy in the eurozone nevertheless remained on a growth course – in the second quarter of 2016, GDP increased by 0.3 % according to the Eurostat statistical office.
In China, whose economic development is exceptionally important for the global economy and the copper market, growth in the first three quarters established itself roughly in the middle of the 6.5 to 7 % range that had been planned for 2016. An official growth rate of 6.7 % was achieved in all three quarters. The IMF expects 6.6 % for the entire year 2016.
¤ G 12
Combined Management Report
Aurubis Annual Report 2015/16
66

Conditions specific to the industry
Aurubis’ business largely takes place on the international copper market and its sub-markets. These vary considerably in some cases.
Copper concentrates are offered on the global market by mining companies and traders. Here, Aurubis is a buyer competing with other primary copper smelters, most significantly from China and Japan.
Aurubis primarily procures copper and metal-bearing raw materials for recycling on the European market. Metal trading companies are the main actors on the supplier side, though some recycling materials also reach us directly from product manufacturers. On the demand side, we mainly compete with other copper and metal smelters, as well as metal processors that also utilize materials for recycling.
The market for copper cathodes is global. Copper cathodes serve as the basis for trade on the international metal exchanges. While Aurubis is one of the largest producers with an annual output of 1.1 million t, it doesn’t hold a significant position relative to the overall market of about 24 million t.
The markets for copper products are also distinctly fragmented, with a number of companies that mainly belong to the cable and wire industries, as well as the semi-finished product sector.
Sulfuric acid, which is produced in the course of our processes, is a particularly important by-product. Customers and competitors in this area are very diverse. The customers include companies in the chemical, fertilizer and mining industries.
Aurubis’ individual markets were subject to various developments during fiscal year 2015/16:
The international copper concentrate market was once again characterized by good availability. This was due first and foremost to the start-up of new projects and expansions at mines, especially in Peru and Mexico, where copper ore mining, and therefore copper concentrate production, increased. The production climate, which was largely without disruptions overall, was also decisive. There were only larger reductions in the Democratic Republic of Congo and Zambia, and export restrictions on concentrates in Indonesia caused some uncertainty. In contrast, there were no larger strikes or extreme weather impacts for the most part. Mining companies reacted to lower copper prices with cost reductions and therefore only saw a need to adjust production due to prices in isolated cases. On the demand side, refined copper output from Chinese smelters increased, but this didn’t lead to a tightening of the market for the raw material, copper concentrate.
On the European market for raw materials for recycling, the fiscal year started with reduced availability of copper scrap. Lower copper prices negatively impacted metal traders’ willingness to sell. An unsatisfactory business trend for other metal scraps also caused collection and processing activities to decline. The situation changed starting in summer 2016, however. The supply improved somewhat as metal traders’ activity increased, a development that initially continued until the end of September 2016. In contrast to copper scrap, the supply of complex raw materials for recycling, such as electrical and electronic scrap, didn’t show any larger fluctuations during the fiscal year.
Combined Management Report
Aurubis Annual Report 2015/16
90 Risk and Opportunity Report 99 Forecast Report106 Legal Disclosures
67 52 Foundations of the Group 66 Economic Report 90 Subsequent Events

On the international market for copper cathodes, a good supply of concentrates supported good production results. According to the International Copper Study Group (ICSG), capacity utilization during the first seven months of 2016 was 83 %, almost the level of the previous year. Global output of refined copper rose by 2.8 % in this period compared to the same period of the previous year. China, the USA and Mexico played a significant part in this increase. Outages in central Africa were more than compensated for. Global demand for refined copper increased by about 4 % in the first seven months of 2016. China was the driving force once again, demonstrating a level of economic development in line with the state forecast. Investments in expanding the electricity grid rose by 33 % in the first eight months of 2016, while car sales increased by 13 % in the first nine months. Both sectors are crucial for the use of copper products.
Exchange inventories of copper cathodes increased by roughly 31,000 t to 543,000 t during the fiscal year, and copper inventories in Chinese bonded warehouses were up by 150,000 t to 520,000 t.
According to the ICSG, there was a production deficit of 264,000 t on the global market for refined copper in the first seven months of 2016. After taking seasonal effects and changes to the bonded warehouse inventories in China into account, the deficit was 139,000 t.
On the international market for continuous cast wire rod, which utilizes about 74 % of global cathode output worldwide, there were notable differences country by country, though the aggregated regional view showed a more uniform picture. Demand rose by 2.6 % in both Asia and Europe, and by 2.0 % in North America in the first three quarters of 2016.
The market environment for sulfuric acid was weak during parts of the fiscal year. This was partly due to the demand side, which indicated lower demand in South American copper production and in European fertilizer production. On the other hand, a surplus partially triggered by the expansion of sulfur burner capacities strained the market in some cases. Furthermore, there was high sulfuric acid output in the smelter sector despite maintenance shutdowns.
The copper price on the London Metal Exchange was under pressure in fiscal year 2015/16. After starting at US$ 5,178/t, the price hit the fiscal-year low of US$ 4,311/t on January 15. As the year went on, copper was usually quoted between US$ 4,500/t and US$ 4,900/t and ended the fiscal year at US$ 4,832/t. The average for the fiscal year was US$ 4,767/t (previous year: US$ 5,933/t).
Copper price and metal exchange copper inventoriesup to September 30, 2016
in thousand t US$/t
09/15 11/15 01/16 03/16 05/16 07/16 09/16
LME copper priceMetal exchange copper inventories
0
500
1,000
1,500
4,000
5,000
6,000
3,000
See Glossary, page 196.
¤ G 13
Combined Management Report
Aurubis Annual Report 2015/16
68

Economic development in the Aurubis Group
Results of operations of the Aurubis GroupResults of operations (operating)In order to portray the Aurubis Group’s operating success independently of measurement influences – deriving from the use of the average cost method for inventory measurement purposes in accordance with IAS 2, from copper price-related measurement effects on inventories and from the impact of purchase price allocations, primarily on property, plant and equipment, from fiscal year 2010/11
onwards – for internal management purposes, the presentation of the results of operations, net assets and financial position in accordance with IFRS is supplemented by the results of operations and net assets explained on the basis of operating values.
The following table shows how the operating result for fiscal year 2015/16 and for the comparative prior-year period are determined.
Reconciliation of the consolidated income statement
in € million2015/16
IFRS2015/16
adjustment 1)2015/16
operating2014/15
operating
Revenues 9,475 0 9,475 10,995
Changes in inventories of finished goods and work in process 97 23 120 76
Own work capitalized 9 0 9 6
Other operating income 58 0 58 60
Cost of materials (8,635) 23 (8,612) (9,964)
Gross profit 1,004 46 1,050 1,173
Personnel expenses (449) 0 (449) (431)
Depreciation and amortization of intangible assets and property, plant and equipment (135) 6 (129) (130)
Other operating expenses (243) 0 (243) (242)
Operational result (EBIT) 177 52 229 370
Result from investments measured using the equity method 6 2 8 4
Interest income 3 0 3 4
Interest expense (27) 0 (27) (31)
Other financial expenses 0 0 0 (4)
Earnings before taxes (EBT) 159 54 213 343
Income taxes (35) (13) (48) (86)
Consolidated net income 124 41 165 257 1) Adjustment for measurement effects deriving from the use of the average cost method in accordance with IAS 2, from copper price-related
measurement effects on inventories and for impacts from purchase price allocations, primarily on property, plant and equipment, from fiscal year 2010/11 onwards.
¤ T 009
Combined Management Report
Aurubis Annual Report 2015/16
90 Risk and Opportunity Report 99 Forecast Report106 Legal Disclosures
69 52 Foundations of the Group 66 Economic Report 90 Subsequent Events

The Aurubis Group (Aurubis) generated operating consolidated earnings before taxes (EBT) of € 213 million in fiscal year 2015/16 (previous year: € 343 million). Business performance was influenced by an overall difficult situation on the copper scrap and sulfuric acid markets. The refining charges for copper scrap and revenues for sulfuric acid were at a much lower level compared to the previous year. On the copper concentrate markets, good availability and an improved input mix led to higher treatment and refining charges. Overall, copper product sales were slightly higher than the previous year with lower cathode premiums. Only strip product sales volumes were at the prior-year level. Business performance continued to be influenced by the lower metal yield with reduced metal prices compared to the previous year. Additionally, the scheduled shutdown at our site in Pirdop, Bulgaria in the spring also had a negative impact. As in the previous year, Aurubis was able to benefit from the EUR/USD development in this year.
IFRS earnings before taxes, which amounted to € 159 million, were adjusted for inventory measurement effects of € 48 million (previous year: € 167 million), as well as for impacts of € 6 million (previous year: € 6 million) deriving from a purchase price allocation from 2010/11 onwards, resulting in operating earnings before taxes of € 213 million (previous year: € 343 million).
The Group’s revenues decreased by € 1,520 million to € 9,475 million during the reporting period (previous year: € 10,995 million). This development was primarily due to the lower average copper price compared to the previous year.
Breakdown of revenues
in % 2015/16 2014/15
Germany 35 32
European Union 38 38
Rest of Europe 3 2
Other countries 24 28
Total 100 100
The change in inventories amounted to € 120 million (previous year: € 76 million), mainly because of an increase in copper and precious metal inventories.
In a manner corresponding to the development for revenues, the cost of materials decreased by € 1,352 million, from € 9,964 million in the previous year to € 8,612 million.
After taking the change in inventories, own work capitalized and other operating income into account, the residual gross profit was € 1,050 million (previous year: € 1,173 million).
Personnel expenses rose from € 431 million in the previous year to € 449 million in the current reporting period. The increase was due in particular to higher collective wage agreement rates, a slightly higher number of employees and higher personnel costs, expressed in euros, at the Buffalo, USA site.
Depreciation and amortization of fixed assets amounted to € 129 million and was therefore similar to the prior-year level (€ 130 million).
¤ T 010
Combined Management Report
Aurubis Annual Report 2015/16
70

Development of revenues by product groupsin € million
14/15 15/16 14/15 15/16 14/15 15/16 14/15 15/16 14/15 15/16 14/15 15/16
0
4,000
CathodesWire rod Precious metals Shapes Pre-rolled strip,strip and profiles
Chemicals and other
1,000
2,000
3,000
720 653
1,272 1,121
390 316
3,945
3,319
2,392 2,3762,276
1,690
Certain prior-year figures have been adjusted.
At a level of € 243 million, other operating expenses were also similar to those of the previous year (€ 242 million).
The operational result before interest and taxes (EBIT) therefore amounted to € 229 million (previous year: € 370 million).
The net interest expense was € 24 million compared to € 27 million in the previous year. The decrease was primarily due to lower interest rates.
After taking the financial result into account, operating earnings before taxes (EBT) were € 213 million (previous year: € 343 million). The following significant factors were decisive for the reported fiscal year’s development compared to the previous fiscal year:
» The scheduled shutdown in Pirdop, Bulgaria with a lower resultant throughput
» Higher treatment and refining charges for copper concentrates with an improved input mix
¤ G 14
» Considerably reduced refining charges for copper scrap accompanied by a lower copper scrap supply
» Significantly weaker sales prices for sulfuric acid due to a surplus on the global markets
» A lower metal gain accompanied by decreased metal prices
» A lower cathode premium » Stable sales volumes for continuous cast
wire rod and shapes » The strong US dollar
Operating earnings before taxes were significantly below those of the previous year, and thus corresponded to the expectation provided in the Forecast Report at the start of the fiscal year.
Operating consolidated net income of € 165 million remained after tax (previous year: € 257 million). Operating earnings per share amounted to € 3.64 (previous year: € 5.68).
Combined Management Report
Aurubis Annual Report 2015/16
90 Risk and Opportunity Report 99 Forecast Report106 Legal Disclosures
71 52 Foundations of the Group 66 Economic Report 90 Subsequent Events

Results of operations (IFRS)The Aurubis Group generated consolidated net income of € 124 million in fiscal year 2015/16 (previous year: € 134 million).
Consolidated income statement
in € million2015/16
IFRS2014/15
IFRS
Revenues 9,475 10,995
Changes in inventories/own work capitalized 106 21
Other operating income 58 60
Cost of materials (8,635) (10,067)
Gross profit 1,004 1,009
Personnel expenses (449) (431)
Depreciation and amortization of intangible assets and property, plant and equipment (135) (136)
Other operating expenses (243) (242)
Operational result (EBIT) 177 200
Financial result (18) (30)
Earnings before taxes (EBT) 159 170
Income taxes (35) (36)
Consolidated net income 124 134
Group revenues decreased by € 1,520 million to € 9,475 million during the reporting period (previous year: € 10,995 million). This development is primarily due to the lower average copper price compared to the previous year.
The change in inventories increased by € 82 million compared to the previous year, to € 97 million (previous year: € 15 million), mainly because of an increase in copper and precious metal inventories.
In a manner corresponding to the development for revenues, the cost of materials decreased by € 1,432 million, from € 10,067 million in the previous year to € 8,635 million.
After taking the change in inventories, own work capitalized and other operating income into account, the residual gross profit was € 1,004 million (previous year: € 1,009 million).
In addition to the effects on earnings described in the explanation of the operating results of operations, the change in gross profit was also due to the metal price trend. The use of the average cost method leads to metal price valuations that are close to market prices. Metal price volatility therefore has a direct effect on the change in inventories/cost of materials and thus on the IFRS gross profit. This is independent of the operating performance and is not relevant to the cash flow.
Personnel expenses rose from € 431 million in the previous year to € 449 million in the current reporting period. The increase was due in particular to higher collective wage agreement rates, a slightly higher number of employees and higher personnel costs, as expressed in euros, at the Buffalo, USA site.
At a level of € 135 million, depreciation and amortization of fixed assets was similar to the previous year (€ 136 million).
At a level of € 243 million, other operating expenses were also similar to those of the previous year (€ 242 million).
Earnings before interest and taxes (EBIT) were therefore € 177 million (previous year: € 200 million).
The net interest expense was € 24 million compared to € 27 million in the previous year. The decrease was primarily due to lower interest rates.
After taking the financial result into account, earnings before taxes amounted to € 159 million (previous year: € 170 million). A consolidated net income of € 124 million remained after tax (previous year: € 134 million). Earnings per share amounted to € 2.71 (previous year: € 2.95).
¤ T 011
Combined Management Report
Aurubis Annual Report 2015/16
72

Net assets of the Aurubis GroupNet assets (operating)The following table shows the derivation of the operating balance sheet as at September 30, 2016 and September 30, 2015.
Reconciliation of the consolidated balance sheet
in € million9/30/2016
IFRS9/30/2016
adjustment 1)9/30/2016
operating9/30/2015 operating
ASSETS
Fixed assets 1,450 (46) 1,404 1,387
Deferred tax assets 10 48 58 29
Non-current receivables and other assets 26 0 26 15
Inventories 1,700 (206) 1,494 1,374
Current receivables and other assets 369 0 369 495
Cash and cash equivalents 472 0 472 453
Assets “held-for-sale” 0 0 0 6
Total assets 4,027 (204) 3,823 3,759
EQUITY AND LIABILITIES
Equity 1,991 (162) 1,829 1,765
Deferred tax liabilities 151 (42) 109 102
Non-current provisions 386 0 386 281
Non-current liabilities 357 0 357 509
Current provisions 32 0 32 35
Current liabilities 1,110 0 1,110 1,067
Total equity and liabilities 4,027 (204) 3,823 3,7591) Adjustment for measurement effects deriving from the use of the average cost method in accordance with IAS 2, from copper price-related
measurement effects on inventories and for impacts from purchase price allocations, primarily on property, plant and equipment, from fiscal year 2010/11 onwards. Certain prior-year figures have been adjusted.
¤ T 012
Combined Management Report
Aurubis Annual Report 2015/16
90 Risk and Opportunity Report 99 Forecast Report106 Legal Disclosures
73 52 Foundations of the Group 66 Economic Report 90 Subsequent Events

Total assets increased from € 3,759 million as at September 30, 2015 to € 3,823 million as at September 30, 2016, primarily due to higher inventories.
The Group’s equity increased by € 64 million, from € 1,765 million as at the end of the last fiscal year to € 1,829 million as at September 30, 2016, mainly due to the operating consolidated net result of € 165 million. The dividend payment of € 62 million and effects from the remeasurement of pension obligations recognized in equity had an opposite impact. Overall, the operating equity ratio (the ratio of equity to total assets) was 47.8 % compared to 46.9 % as at the end of the previous fiscal year.
The increase in non-current provisions resulted from an increase in pension liabilities due to the effects deriving from remeasurement mentioned above.
Borrowings decreased slightly from € 506 million as at September 30, 2015 to € 495 million as at September 30, 2016. The following table shows the development of borrowings as at September 30, 2016 and September 30, 2015:
Development of borrowings
in € million 9/30/2016 9/30/2015
Non-current bank borrowings 321 464
Non-current liabilities under finance leases 16 17
Non-current borrowings 337 481
Current bank borrowings 156 23
Current liabilities under finance leases 2 2
Current borrowings 158 25
Borrowings 495 506
Return on capital (operating)ROCE refers to the return on capital employed.
Operating ROCE (taking operating EBIT for the last 12 months into account) decreased from 18.7 % in the previous year to 10.9 % in the reporting year due to the lower operating result.
Aurubis achieved a significantly lower ROCE due to the considerably lower operating result in the fiscal year reported. This figure was, however, within the expected range as outlined in the Forecast Report at the start of the fiscal year.
Operating return on capital employed (ROCE)
in € million 9/30/2016 9/30/2015
Fixed assets 1,343 1,327
Inventories 1,494 1,374
Trade accounts receivable 242 307
Other receivables and assets 211 212
– Trade accounts payable (798) (761)
– Provisions and other liabilities (379) (480)
Capital employed as at the balance sheet date 2,114 1,979
Earnings before taxes (EBT) 213 343
Financial result 16 27
Earnings before interest and taxes (EBIT) 229 370
Return on capital employed (operating ROCE) 10.9 % 18.7 %
¤ T 013
¤ T 014
Combined Management Report
Aurubis Annual Report 2015/16
74

Net assets (IFRS) Total assets decreased slightly from € 4,044 million as at the end of the previous fiscal year to € 4,027 million as at September 30, 2016.
Balance sheet structure of the Aurubis Group
in % 9/30/2016 9/30/2015
Fixed assets 36 36
Inventories 42 40
Receivables, etc. 10 13
Cash and cash equivalents 12 11
100 100
Equity 49 49
Provisions 14 12
Liabilities 37 39
100 100
The Group’s equity increased slightly by € 22 million, from € 1,969 million as at the end of the last fiscal year to € 1,991 million as at September 30, 2016, mainly due to the consolidated net result of € 124 million. The dividend payment of € 62 million and effects from the remeasurement of pension obligations recognized in equity had an opposite impact. Overall, the equity ratio (the ratio of equity to total assets) was 49.4 % compared to 48.7 % as at the end of the previous fiscal year.
Borrowings decreased slightly from € 506 million as at September 30, 2015 to € 495 million as at September 30, 2016. The following table shows the development of borrowings as at September 30, 2016 and September 30, 2015:
Development of borrowings
in € million 9/30/2016 9/30/2015
Non-current bank borrowings 321 464
Non-current liabilities under finance leases 16 17
Non-current borrowings 337 481
Current bank borrowings 156 23
Current liabilities under finance leases 2 2
Current borrowings 158 25
Borrowings 495 506
Return on capital (IFRS)The operating result is used for control purposes within the Group. The operating ROCE is explained in the section “Return on capital (operating)”.
¤ T 015
¤ T 016
Combined Management Report
Aurubis Annual Report 2015/16
90 Risk and Opportunity Report 99 Forecast Report106 Legal Disclosures
75 52 Foundations of the Group 66 Economic Report 90 Subsequent Events

Financial position of the Aurubis GroupThe Group’s liquidity sourcing is secured through a combination of the Group’s cash flow, short-term and long-term borrowings, as well as lines of credit available from our banks. Fluctuations in cash flow developments can be compensated at any time by existing credit resources and available lines of credit.
The development of the Aurubis Group’s liquidity position is monitored regularly on a timely basis. The control and monitoring functions are carried out on the basis of defined key financial ratios.
The main key financial ratio for controlling debt is debt coverage, which calculates the ratio of net borrowings (borrowings less cash and cash equivalents) to earnings before interest, taxes, depreciation and amortization (EBITDA) and shows the number of periods required to redeem the existing borrowings from the Group’s income –assuming an unchanged earnings situation.
The interest coverage ratio expresses how the net interest expense is covered by earnings before interest, taxes, depreciation and amortization (EBITDA).
Our long-term objective is to achieve a well-balanced debt structure. In this context, we consider debt coverage < 3 and interest coverage > 5 to be well balanced.
Since we use the operating result for control purposes in the Group, the Group’s key operating financial ratios are presented as follows:
Operating Group financial ratios
9/30/2016 9/30/2015
Debt coverage = net borrowings/EBITDA 0.1 0.1
Interest coverage = EBITDA/net interest 14.6 18.3
Additional control measures related to liquidity risks are outlined in the Risk and Opportunity Report in the Combined Management Report.
Analysis of liquidity and fundingThe cash flow statement shows the cash flows within the Group and highlights how funds are generated and used.
The net cash flow as at September 30, 2016 was € 236 million, compared to € 365 million in the previous year. The decrease in net cash flow was due to the lower result as well as higher inventories of intermediates.
Investments in fixed assets (including financial fixed assets) totaled € 143 million in the reporting period (previous year: € 112 million). The largest individual investment was made in connection with the shutdown in Pirdop, Bulgaria.
After deducting investments in fixed assets from the net cash flow, the free cash flow amounted to € 93 million (previous year: € 253 million). The cash outflow from investing activities totaled € 128 million (previous year: € 104 million).
The cash outflow from financing activities amounted to € 89 million, compared to a cash inflow of € 4 million in the previous year.
Cash and cash equivalents of € 472 million were available to the Group as at September 30, 2016 (previous year: € 453 million). Cash and cash equivalents are utilized for operating business activities, investing activities and the redemption of borrowings.
See Glossary, page 199.
¤ T 017
Combined Management Report
Aurubis Annual Report 2015/16
76

Source and application of fundsin € million
Cash and cash equivalents9/30/2015
Cash inflow from operating activities
(net cash flow)
Cash outflow from investing activities
Cash outflow from financing activities
Cash and cash equivalents9/30/2016
453
+236 (128)
(89)
472
Net borrowings amounted to € 23 million as at September 30, 2016 (previous year: € 53 million). The following table shows the development as at September 30, 2016 and September 30, 2015:
Net borrowings in the Group
in € million 9/30/2016 9/30/2015
Borrowings 495 506
– Cash and cash equivalents (472) (453)
Net borrowings 23 53
In addition to cash and cash equivalents, the Aurubis Group has unutilized credit line facilities and thus has adequate liquidity reserves. Parallel to this, within the context of factoring agreements, the Group makes use of the sale of receivables without recourse as an off-balance-sheet financial instrument.
¤ G 15
¤ T 018
Combined Management Report
Aurubis Annual Report 2015/16
90 Risk and Opportunity Report 99 Forecast Report106 Legal Disclosures
77 52 Foundations of the Group 66 Economic Report 90 Subsequent Events

Business performance in the Business Units
Business Unit Primary Copper
Key figures
in € million2015/16
operating2014/15
operating
Revenues 5,325 5,914
EBIT 154 271
EBT 143 256
Capital expenditure 104 70
Depreciation and amortization (83) (86)
Operating ROCE 16.4 % 33.2 %
Avg. number of employees 2,750 2,730
Certain prior-year figures have been adjusted.
Business performance and earnings trendBusiness Unit (BU) Primary Copper produces pure copper cathodes from copper concentrates and recycling materials and processes intermediates from other smelters. The BU also produces and markets precious metals, sulfuric acid and iron silicate.
The main production sites are Hamburg (Germany) and Pirdop (Bulgaria), which both have smelting facilities and copper tankhouses.
The main factor driving earnings in BU Primary Copper is treatment and refining charges (TC/RCs) that are negotiated as surcharges on the purchase price of the metals for converting raw materials into the exchange product – copper cathodes – and other metals. Additional earnings components include revenues from precious metal and sulfuric acid sales, the cathode premium and the metal gain.
Operating earnings in BU Primary Copper in fiscal year 2015/16 were significantly below the previous year’s earnings. One reason was the extensive scheduled
maintenance and repair shutdown at our smelter site in Pirdop, Bulgaria in Q2 of calendar year 2016.
Furthermore, market-related factors, such as reduced revenues for sulfuric acid, low refining charges for copper scrap and lower premiums for copper cathodes, strained the BU’s result. A lower metal gain with lowe r metal prices also had an impact.
In total, BU Primary Copper generated operating earnings before taxes (EBT) of € 143 million. Compared to the previous year, this was a € 113 million decline. At € 5,325 million, the BU’s revenues were € 589 million below the previous year, primarily due to lower copper prices.
Treatment and refining charges at a high levelThe international copper concentrate market was characterized by good supply overall during the past fiscal year. This was largely due to high output from mines with no notable production losses.
Treatment and refining charges (TC/RCs) for long-term business in 2016 were somewhat lower than the previous year but still high. In the course of the year, TC/RCs in the spot market even exceeded the level for long-term contracts. New projects in Latin America and a low number of production disruptions contributed to this development. Demand pressure for concentrates of a purer quality decreased considerably. The availability of more complex concentrates remained good.
We were able to secure a good concentrate supply for our smelting operations in Hamburg and Pirdop and continued to be in a position to enter into additional long-term supply contracts.
The copper scrap market was impacted by declining and simultaneously volatile metal prices, as well as lower refining charges. The supply was secured despite difficult market conditions.
¤ T 019
See Glossary, page 197.
See Glossary, page 198.
Combined Management Report
Aurubis Annual Report 2015/16
78

Difficult sulfuric acid businessFiscal year 2015/16 started with weak global demand on the sulfuric acid market in an environment influenced by seasonal factors. The market surplus, especially in South and Central America, weighed on the price trend as well. In addition, the sales options for sulfuric acid from smelters’ production processes weakened due to the expansion of sulfur burner capacities. The negative price trend on the spot market continued until the end of the fiscal year.
Throughput and output volumes down on previous year due to shutdown A good supply of copper concentrates and recycling materials ensured that our production facilities were utilized during the entire fiscal year. BU Primary Copper processed a total of 2.2 million t of copper concentrate (previous year: 2.3 million t). The copper scrap input in the BU was 91,000 t (previous year: 102,000 t).
Concentrate throughputin million t
11/12 15/1614/1513/1412/13
0
0.5
1.0
1.5
2.0
2.52.2 2.2 2.2
2.12.3
Corresponding to the concentrate throughput, the sulfuric acid output was 2.1 million t, slightly below the previous year (2.2 million t).
The Hamburg site processed more than 1.1 million t of copper concentrate, thus reaching the prior-year level. The throughput of 1.0 million t at the Pirdop site was below the previous year (1.2 million t). This was due to the scheduled shutdown that was carried out in Q2 of calendar year 2016.
At 584,000 t, the cathode output in BU Primary Copper missed the prior-year level of 615,000 t. This was also due primarily to the shutdown in Pirdop.
The tankhouse in Hamburg produced 370,000 t of cathodes during the fiscal year (previous year: 383,000 t), due in part to lower copper anode deliveries from Pirdop and slightly lower copper contents in the processed concentrate. The tankhouse in Pirdop produced a lower output volume of 214,000 t due to the shutdown (previous year: 232,000 t).
The development in precious metal production varied: silver output was 961 t, above the prior-year level of 958 t, while gold output decreased from 45 t to 42 t. This was due to the lower throughput of copper concentrates and lower gold content in the raw materials.
Silver outputin t
11/12 15/1614/1513/1412/13
0
400
800
1,200
1,600
958
1,222
1,038 1,000 961
¤ G 16
See Glossary, page 197.
¤ G 17
Combined Management Report
Aurubis Annual Report 2015/16
90 Risk and Opportunity Report 99 Forecast Report106 Legal Disclosures
79 52 Foundations of the Group 66 Economic Report 90 Subsequent Events

Gold outputin t
11/12 15/1614/1513/1412/13
4245
3943
0
10
20
30
40
50
37
Capital expenditureCapital expenditure in BU Primary Copper amounted to € 104 million in the past fiscal year.
The focus of the capital expenditure was the scheduled production shutdown in Bulgaria.
Additional investments were made in the BU to improve environmental protection and infrastructure at the sites.
Capital expenditure in BU Primary Copper in € million
11/12 15/1614/1513/1412/13
0
25
50
75
100104
82 1)86
104
70
1) Adjusted due to change in Group structure.
Business Unit Copper ProductsKey figures
in € million2015/16
operating2014/15
operating
Revenues 7,531 8,586
EBIT 106 138
EBT 101 130
Capital expenditure 40 41
Depreciation and amortization (44) (44)
Operating ROCE 9.7 % 12.4 %
Avg. number of employees 3,335 3,330
Certain prior-year figures have been adjusted.
Business performance and earnings trendBusiness Unit (BU) Copper Products produces and markets high-quality copper products, such as continuous cast wire rod, shapes, pre-rolled and finished strip, and specialty profiles, primarily from internally produced copper cathodes. We also use the copper recycling process to fabricate rolled products. Recycling and the Lünen and Olen sites belong to BU Copper Products as well.
The AURUBIS ROD brand of continuous cast copper wire rod is the strongest copper product in the portfolio by volume. It exhibits high electrical conductivity, very good workability and an excellent surface, making it a preferred feedstock for the cable and wire industry, as well as special semi-finished products. Aurubis is a world leader in this market segment and produces AURUBIS ROD with state-of-the-art plant technology at four sites: Hamburg (Germany), Olen (Belgium), Avellino (Italy) and Emmerich (Germany).
¤ G 18
¤ G 19
¤ T 020
Combined Management Report
Aurubis Annual Report 2015/16
80

The AURUBIS SHAPES brand includes various continuous cast copper shapes that serve as preliminary products for semi-finished product fabricators and tube rolling mills. Large piece weights, unique dimensions and special copper grades are our specialty. A significant part of our AURUBIS SHAPES output is directly delivered to our subsidiary Schwermetall Halbzeugwerk GmbH (50 % Aurubis holding), which produces pre-rolled strip for a number of semis fabricators worldwide.
Finished strip is produced in Stolberg (Germany), Pori (Finland) and Buffalo (USA). We fabricate shaped wire for the electrical industry in Stolberg. Moreover, Aurubis Belgium in Olen produces copper bars and profiles.
At the recycling plant in Lünen, we produce high-quality copper cathodes from a variety of raw materials for recycling, including electrical and electronic scrap, as well as other complex materials. The Olen site also performs recycling activities and has a tankhouse for the production of copper cathodes.
In addition to the cathode premium, another significant earnings component within BU Copper Products is the so-called product surcharge for processing copper cathodes into copper products. In the recycling business, earnings are primarily generated through refining charges (surcharges on the purchase price of the metals) and the metal gain.
Overall, BU Copper Products generated operating earnings before taxes (EBT) of € 101 million in fiscal year 2015/16 (previous year: € 130 million).
The following developments contributed to BU Copper Products’ result, which was lower than that of the previous year:
The cathode premium for 2016 was lowered from US$ 110/t in the previous year to US$ 92/t.
Sales of wire rod reflected a stable trend until the third quarter of the fiscal year and weakened in the fourth quarter. The shapes sector was slightly above the prior year. Product surcharges were at a good level in both areas. The sales volume in Business Line Flat Rolled Products was also at the prior-year level.
Recycling in Lünen and Olen was influenced by a short supply of copper scrap, with low refining charges accordingly. The lack of volumes was more than compensated for by blister copper, though refining charges in this area were also low.
Product marketsHigh demand for copper products was recorded during the first half of fiscal year 2015/16. Southern European markets continued to recover, and the German market environment was stable. As the year went on, however, the impact of the lower crude oil price and the related economic crisis in the Middle East became evident.
Demand for copper wire rod remained very strong, supported by all key sectors. We recorded positive sales of shapes, though the rolled products business was initially subdued.
See Glossary, page 196.
Combined Management Report
Aurubis Annual Report 2015/16
90 Risk and Opportunity Report 99 Forecast Report106 Legal Disclosures
81 52 Foundations of the Group 66 Economic Report 90 Subsequent Events

Demand for flat rolled products developed differently in individual markets. While the automotive and electronics industries grew in particular, demand in the radiator segment declined due to a lack of investment momentum.
Recycling marketsThe conditions on the copper scrap market were difficult during the fiscal year. Due to low prices for steel and aluminum scrap, collection activities declined overall. This was also true for copper, which is collected together with aluminum and steel scrap.
The decrease in the copper price, the growing uncertainty about the further metal price trend and lower availability at the upstream stages of the recycling chain led to limited willingness to sell among traders. The attainable refining charges came under pressure and stagnated at a low level.
Despite the difficult market situation, the production facilities were sufficiently supplied.
In the case of complex recycling materials, which have lower amounts of copper and contain additional non-ferrous and precious metals, stronger demand was observed from the competition, especially in Asia. This raw material category includes industrial residues and electrical and electronic scrap, for example. There were no significant fluctuations in availability.
Copper scrap input in the Groupin thousand t
11/12 15/1614/1513/1412/13
253
0
100
200
300
400
294331
299334
ProductionStable output of AURUBIS RODThe Group’s four AURUBIS ROD plants produced 758,000 t in fiscal year 2015/16 (previous year: 764,000 t).
Continuous cast wire rod outputin thousand t
11/12 15/1614/1513/1412/13
0
200
400
600
800 758
646608
764742
¤ G 20
¤ G 21
Combined Management Report
Aurubis Annual Report 2015/16
82

AURUBIS SHAPES output slightly higherAll in all, AURUBIS SHAPES had an output of 172,000 t during the fiscal year, a 1 % increase compared to the previous year (170,000 t). We further reinforced our focus on specialty alloys.
Continuous cast shape outputin thousand t
11/12 15/1614/1513/1412/13
0
50
100
150
200
250
170 172164149
183
Flat rolled products stableAt 208,000 t, the output of flat rolled products was at the prior-year level during fiscal year 2015/16 (previous year: 207,000 t). All of the sites continue to work on implementing programs to improve efficiency and to enhance productivity and quality.
Bars and profiles output develops positively The output of bars and profiles rose by 9 % to 12,400 t (previous year: 11,400 t). Improvements in operating performance and a reinforcement of the market position contributed to this development.
Cathode output unable to reach prior-year level Cathode output in BU Copper Products was behind expectations in fiscal year 2015/16. Output was 177,000 t (previous year: 187,000 t) at the Lünen plant and 322,000 t (previous year: 336,000 t) in Olen. The decrease was caused by a lower output of copper anodes (Pirdop shutdown) and the insufficient availability of copper scrap on the market.
Cathode output in the Groupin thousand t, BU Primary Copper and BU Copper Products
11/12 15/1614/1513/1412/13
0
200
400
800
600
1,000
1,2001,084
1,1381,147 1,148 1,126
¤ G 22
¤ G 23
Combined Management Report
Aurubis Annual Report 2015/16
90 Risk and Opportunity Report 99 Forecast Report106 Legal Disclosures
83 52 Foundations of the Group 66 Economic Report 90 Subsequent Events

Cathode output in the Group by sitesin thousand t, fiscal year 2015/16
0
100
200
300
400 370
214
322
177
Hamburg PirdopLünen Olen
Recycling impacted by short supply of copper scrapThe availability of material on the copper scrap market was limited in fiscal year 2015/16. This negatively affected the input volume in our recycling facilities, so the copper scrap input was only 162,000 t (previous year: 192,000 t). The use of blister copper more than compensated for the lack of volumes.
The input of complex recycling materials in the Kayser Recycling System (KRS) reached 254,000 t in fiscal year 2015/16 and was therefore also below the prior-year amount of 269,000 t. This was due to a shift in the input mix towards more profitable materials.
Capital expenditureCapital expenditure in BU Copper Products was € 40 million in fiscal year 2015/16.
Capital expenditure in the BU was focused on improvements in the areas of efficiency, energy, environmental protection, product quality and infrastructure.
Capital expenditure in BU Copper Productsin € million
47 1)
11/12 15/1614/1513/1412/13
0
15
30
45
60
36
27
41 40
1) Adjusted due to change in Group structure.
¤ G 24
See Glossary, page 197.
¤ G 25
Combined Management Report
Aurubis Annual Report 2015/16
84

Executive Board assessment of the Aurubis Group during fiscal year 2015/16
The Aurubis Group generated a result in fiscal year 2015/16 that was significantly below the record result of the previous year. This confirmed what we had already anticipated in the outlook included in our last Annual Report. Operating consolidated earnings before taxes (EBT) reached € 213 million (previous year: € 343 million). This was caused by unfavorable developments in the relevant sub-markets, especially the markets for sulfuric acid and copper scrap. The scheduled shutdown in Bulgaria and lower cathode premiums reduced the result further. With lower metal prices overall, the very good metal gain of the previous year couldn’t be repeated. In the meantime, the group-wide optimization and efficiency enhancement program that was initiated in the previous year continued.
Both Business Units achieved a positive result, but with considerable downturns in each case. In the process, the unfavorable trends in individual markets impacted the Business Units to different degrees. The internal operating ROCE target of 15 % for the entire Group was not achieved, reaching 10.9 %.
Business development in BU Primary Copper was characterized by good ongoing conditions on the concentrate markets, which enabled not only a good supply, but also high treatment and refining charges. The extensive scheduled maintenance and repair shutdown at our smelter site in Pirdop, Bulgaria weighed on earnings. Concentrate throughputs were slightly down on the previous year due to the shutdown. Furthermore, market-related factors, such as reduced revenues for sulfuric acid, lower refining charges for copper scrap, decreased premiums for copper cathodes and a reduced metal gain overall with lower metal prices, strained the BU’s result.
Development in BU Copper Products varied. The recycling business was strained by declining refining charges for copper scrap, lower cathode premiums and reduced metal prices. Rod and shapes business was high, and sales remained stable compared to the prior year. The restructuring of Business Line Flat Rolled Products continued. The results increased slightly with a sales volume at prior-year level.
Despite the lower business result, the net cash flow was at a good level at € 236 million, though it was significantly below the € 365 million of the previous year.
The Aurubis Group’s balance sheet structure is very robust. The equity ratio (operating) is 47.8 % (previous year: 46.9 %). Net borrowings were reduced further to € 23 million (previous year: € 53 million).
Combined Management Report
Aurubis Annual Report 2015/16
90 Risk and Opportunity Report 99 Forecast Report106 Legal Disclosures
85 52 Foundations of the Group 66 Economic Report 90 Subsequent Events

Results of operations, financial position and net assets of Aurubis AG
General information In order to supplement our Aurubis Group reporting, we explain the development of Aurubis AG in the following section. Aurubis AG is the parent company of the Aurubis Group and is based in Hamburg with production sites in Hamburg and Lünen. Apart from managing the Aurubis Group, the business activities of Aurubis AG also particularly include primary copper production and recycling, as well as copper product and precious metal production. The separate financial statements of Aurubis AG have been prepared in accordance with the requirements of the German Commercial Code (Handelsgesetzbuch, HGB) and the German Stock Corporation Act (Aktiengesetz, AktG). The primary differences from the Group financial statements prepared in accordance with IFRS principles are in the accounting treatment of fixed assets, the measurement of inventories, the measurement of financial instruments and the accounting treatment of pension provisions.
The Aurubis Group is managed across all companies at Group level through Business Units (BUs), using operating EBT and operating ROCE as the financial performance indicators. These indicators are also used for Aurubis AG’s operating activities, which are a significant component of the Group. To this extent, the development and forecast of the financial performance indicators at BU and Group levels at the same time represent the development and forecast for Aurubis AG as an individual company.
The analysis of the development for the financial performance indicators outlined above during the fiscal year and the related forecast for the following year are provided in the Economic Report and the Forecast Report for the entire Group. Statements regarding the risk situation and opportunities can be found in the Group’s Risk and Opportunity Report.
Results of operations
Development of the annual result and significant income statement items (HGB)
in € million 2015/16 2014/15
Revenues 6,709 7,528
Changes in inventories/ own work capitalized 53 52
Other operating income 71 59
Cost of materials (6,302) (7,064)
Gross profit 531 575
Personnel expenses (220) (257)
Depreciation and amortization of intangible assets and property, plant and equipment (48) (45)
Write-downs of current assets 0 (60)
Other operating expenses (131) (117)
Operational result (EBIT) 132 96
Financial result 34 111
Result of normal business activities (EBT) 166 207
Taxes (32) (62)
Net income for the year 134 145
Compared to the previous year, Aurubis AG’s business performance was positively influenced by higher treatment and refining charges, while concentrate throughput was at the prior-year level. In contrast, lower refining charges on the copper scrap markets and reduced sulfuric acid revenues compared to the previous year had a negative impact on the result. A lower metal gain compared to the previous year, accompanied by lower metal prices, influenced the result negatively.
¤ T 021
Combined Management Report
Aurubis Annual Report 2015/16
86

Development of Aurubis AG revenues by product groupsin € million
14/15 15/16 14/15 15/16 14/15 15/16 14/15 15/16 14/15 15/16
0
1,000
2,000
3,000
Wire rodCathodes Shapes Preciousmetals
Sulfuric acidand other
352 247
2,908
2,535
780653
2,400 2,398
1,088876
Revenues decreased by € 819 million to € 6,709 million during the reporting period (previous year: € 7,528 million). The reason for the decrease was primarily lower sales revenues deriving from copper products.
With a cost of materials ratio (cost of materials/ (revenues + changes in inventories)) at the prior-year level, and taking into account the change in inventories, own work capitalized and other operating income, the gross profit decreased by a total of € 44 million to € 531 million during the reporting year (previous year: € 575 million).
Personnel expenses decreased by € 37 million to € 220 million (previous year: € 257 million). While wages and salaries rose, due primarily to increases in collective wage agreement rates and higher profit participation bonuses based on the results, pension expenses were lower compared to the previous year. In the previous year, the dissolution of a support fund and the associated assumption of pension benefit obligations for Aurubis AG employees burdened the result.
Depreciation and amortization of fixed assets increased by € 3 million to € 48 million (previous year: € 45 million). In particular, the increase is the result of infrastructure projects that were completed in the previous year.
Taking other operating expenses into account, the operational result (EBIT) therefore amounted to € 132 million (previous year: € 96 million).
The financial result for the reporting year was € 34 million (previous year: € 111 million). This figure included dividends from subsidiaries in the amount of € 35 million (previous year: € 83 million), as well as a write-up of an investment carrying amount in the amount of € 15 million. Furthermore, write-ups of € 5 million were recorded as at the balance sheet date in respect of securities classified as fixed assets. The financial result also includes net interest expenses of € 22 million.
After taking a tax expense of € 32 million (previous year: € 62 million) into account, the reported annual net income amounted to € 134 million (previous year: € 145 million). At a level of 19 %, the effective tax rate was below that of the previous year (29 %) due to a change in the earnings structure.
¤ G 26
Combined Management Report
Aurubis Annual Report 2015/16
90 Risk and Opportunity Report 99 Forecast Report106 Legal Disclosures
87 52 Foundations of the Group 66 Economic Report 90 Subsequent Events

Net assetsAt a level of € 1,954 million, fixed assets were slightly up on the prior year (€ 1,940 million). The increase in inventories to € 805 million (previous year: € 739 million) primarily resulted from higher inventories of intermediates.
Overall, total assets rose by € 92 million to € 3,553 million. Therefore, fixed assets accounted for 55 % (previous year: 56 %) of total assets, inventories accounted for 23 % (previous year: 21 %) and receivables and other assets remained unchanged at 10 %.
Equity increased by € 74 million to € 1,364 million (previous year: € 1,290 million). The equity ratio remained at the prior-year level of 38 %.
Provisions decreased in total by € 40 million to € 249 million, mainly due to lower tax provisions.
Liabilities to banks decreased slightly by € 8 million to € 479 million. Trade accounts payable decreased by € 50 million to € 479 million as at the balance sheet date.
Borrowings from affiliated companies increased from € 730 million to € 845 million within the context of normal financial transactions. Sundry liabilities increased slightly from € 15 million to € 17 million.
Balance sheet structure of Aurubis AG
in % 9/30/2016 9/30/2015
Fixed assets 55 56
Inventories 23 21
Receivables, etc. 10 10
Cash and cash equivalents 12 13
100 100
Equity 38 37
Provisions 7 8
Liabilities 55 55
100 100
Aurubis uses assets under the terms of leasing agreements that are not recognized as assets in the balance sheet. Financial commitments deriving from leases amounted to € 7 million. Apart from this, financial commitments under long-term storage and handling agreements amounted to € 132 million.
¤ T 022
Combined Management Report
Aurubis Annual Report 2015/16
88

Financial position Liabilities to banks amounted to € 479 million as at the balance sheet date (previous year: € 487 million). Their terms to maturity are as follows:
in € million 2015/16 2014/15
Less than 1 year 156 22
1 to 5 years 207 344
More than 5 years 116 121
Total 479 487
After including receivables and payables to subsidiaries deriving from refinancing, amounting to € 615 million (previous year: € 568 million), and deducting cash and cash equivalents of € 433 million (previous year: € 426 million), net borrowings amounted to € 661 million as at September 30, 2016 (previous year: € 629 million).
Analysis of liquidity and fundingThere was a positive net cash flow of € 71 million in fiscal year 2015/16, which resulted from the positive result for the period. A cash outflow, particularly deriving from an increase in the inventories of intermediates, had an opposite effect.
The cash outflow for investments in fixed assets was € 43 million (previous year: € 54 million). Investments in property, plant and equipment of € 49 million (previous year: € 51 million) related to various infrastructure and improvement measures.
The cash outflow of € 22 million (previous year: cash inflow of € 103 million) from financing activities was related both to the payout of the dividends for fiscal year 2014/15 as well as the take-up of loans from subsidiaries in conjunction with the existing cash pooling arrangements, which had an opposite effect.
Cash and cash equivalents at the end of the reporting period amounted to € 433 million (previous year: € 426 million). In addition to cash and cash equivalents, Aurubis AG had unutilized credit line facilities and thus had adequate liquidity reserves. Furthermore, within the context of factoring agreements, Aurubis AG sold receivables without recourse as a financing instrument.
Capital expenditureAt the Hamburg and Lünen sites, € 51 million (previous year: € 54 million) was invested in infrastructure, energy efficiency and environmental protection.
¤ T 023
Combined Management Report
Aurubis Annual Report 2015/16
90 Risk and Opportunity Report 99 Forecast Report106 Legal Disclosures
89 52 Foundations of the Group 66 Economic Report 90 Subsequent Events

Subsequent Events
No significant events have occurred since the balance sheet date.
Risk and Opportunity Report
Integrated risk and opportunity management
Risks and opportunities are key elements of our business activities and are essential to the company’s success. As part of our operating business activities and our strategic management, we weigh opportunities and risks against one another and ensure that they remain balanced. We try to identify and evaluate opportunities as early as possible.
Aurubis AG’s risk situation depends significantly on the Aurubis Group’s risk situation. Statements from the company’s management on the overall assessment of the risk situation also summarize Aurubis AG’s risk situation.
Risk Management System
Our objective in risk management is to manage and monitor the risks associated with our business with the help of a Risk Management System (RMS) suited to our activities. The early identification and monitoring of risk development is of major importance. Furthermore, we strive to limit negative effects on earnings caused by risks with appropriate and economically sound countermeasures.
Risk management is an integral component of the centralized and decentralized planning, management and monitoring processes and covers all of the Aurubis Group’s main sites, business sectors and central functions. The planning and management system, risk reporting, an open communication culture and risk reviews at the sites create risk awareness and make our risk situation transparent.
Risk management officers have been appointed for all sites, business sectors and central functions, and they form a network within the Group. The Group headquarters in Hamburg manages the network. Corporate Risk Management reports directly to the Chief Financial Officer. The RMS is documented in a corporate policy.
Standard risk reporting takes place bottom-up each quarter using a uniform, group-wide reporting format. Within this format any identified risks, and any risks beyond a defined threshold, are explained and evaluated on the basis of their probability of occurrence and their business significance, and measures to manage them are outlined. The risks registered with Group headquarters are qualitatively aggregated into significant risk clusters by Corporate Risk Management and reported to the entire Executive Board. The report also establishes the basis for the report to the Audit Committee, as well as external risk reporting.
Combined Management Report
Aurubis Annual Report 2015/16
90

Potential effect on earnings
in € million > 1 > 5 > 20 > 50
Likelihood
high medium medium high high
medium low medium medium high
low low low medium medium
unlikely low low low medium
In the report to the Executive Board and the Audit Committee, the qualitatively aggregated risk clusters are assessed with due regard to risk management measures (net perspective) based on their probability of occurrence and the potential effect on earnings pursuant to the spreads included in the table and are classified as low, medium or high.
Independent monitoring
The RMS is subject to routine monitoring and review. The Internal Audit Department monitors risk management and compliance with the internal control system using systematic audits. As a process-independent authority, they contribute to the integrity and improvement of business procedures and the effectiveness of the installed systems and controls.
In addition, the auditors review our early risk detection system to ensure that it adheres to legal requirements. They report the audit results to the Executive Board and the Audit Committee.
Furthermore, the Audit Committee deals intensively with risk management issues. The risk management officer regularly communicates current developments to the committee and the Executive Board.
Explanation of relevant risks
The risks associated with our business are described in the following sections according to our risk clusters. Furthermore, the main measures and instruments we use to counter these risks are also outlined. We have separately indicated risks and risk-relevant issues that we currently classify as medium to high potential occurrence.
Supply and productionThe ability to keep the production facilities supplied with raw materials, and the availability of these facilities, are of central importance for the Aurubis Group. We mitigate the related risks using the following measures:
To ensure the supply of copper concentrates for Business Unit Primary Copper, we have concluded long-term agreements with a number of concentrate suppliers from various countries. In this way, we are able to reduce the risk of production interruptions caused by possible delivery failures significantly. The risk of volatile treatment and refining charges on the spot markets is also limited by the long-term nature of the agreements.
The recycling facilities were sufficiently supplied overall during the fiscal year due to our extensive international supplier network, despite weak availability of copper scrap in some cases. From today’s standpoint, we expect the facilities to continue being supplied and utilized at the same level. Nevertheless, there are ongoing refining charge volatilities due to the general metal price trend, metal traders’ collecting activity and inventory management, the European economic situation and competition for the secondary raw materials relevant for Aurubis.
¤ T 024
Combined Management Report
Aurubis Annual Report 2015/16
91 52 Foundations of the Group 66 Economic Report 90 Subsequent Events
90 Risk and Opportunity Report 99 Forecast Report106 Legal Disclosures

The material supply in the copper product fabrication facilities is mainly covered with the copper cathodes produced within the Group. In addition to higher added value, this allows for quality control for copper products during the entire process. We were able to meet most of the demand for copper cathodes for BU Copper Products internally during the fiscal year, therefore ensuring delivery reliability and the quality of our products. We also procured a sufficient volume of copper-bearing raw materials for the production plants of Business Line Flat Rolled Products. We expect a situation comparable to that of the past fiscal year in this area as well.
Plant availability was satisfactory overall, considering that it was reduced at times due to scheduled and unscheduled maintenance measures.
As a matter of principle, we undertake organizational measures (including alarm plans and employee drills) to handle potential incidents such as flooding or fire. We also address the risk of malfunctions by carrying out regular maintenance work and keeping critical replacement parts on hand.
From the current perspective, and taking the measures described above into consideration, we classify the risk of an insufficient supply as “medium” and the risk of significantly limited availability of our production facilities as “low”.
We deal with logistics risks by implementing a thorough, multi-step acceptance process for service providers, by avoiding single sourcing and by preventively developing back-up solutions. We have an international network of skilled service providers at our disposal and, for instance, can avoid weather-related risks in the transport chain by minimizing contingency risks through contractual arrangements regarding appropriate alternatives.
SalesIn addition to supply and production risks, the Aurubis Group also faces sales risks, which we classify as “medium”.
The delivery volumes of copper wire rod and shapes products increased slightly in fiscal year 2015/16 compared to the previous year. All relevant customer industries developed positively, and as the market leader in Europe, Aurubis benefited from this trend. We assume that the development will be stable in the next year. Because of the continued overcapacities on the market, the pressure on conditions in our long-term contracts is unlikely to subside.
For sulfuric acid sales, the fiscal year started at a weak level owing to seasonal factors. Due to a surplus from South America, the prices on the spot market were under pressure during the entire fiscal year.
Cathodes produced by Aurubis which were not processed internally were sold on the international copper cathode market.
Combined Management Report
Aurubis Annual Report 2015/16
92

EnergyEnergy prices tended to decrease in the course of the fiscal year. We are safeguarded against unplanned cost fluctuations from unpredictable and volatile prices on the electricity exchange owing to our electricity contract which has been in effect since 2010. This safeguard corresponds to most of our electricity demand and covers the main German sites. We also address fundamental supply security, as well as the potential and limitations of more flexible energy sourcing that arise due to the increasing, volatile feed-in of renewable energies.
Burdens resulting from changes in potential cost drivers such as the German Renewable Energies Act (EEG), the emissions trade, grid charges and the eco-tax are generally difficult to quantify reliably because of the still-uncertain legal situation and changing political conditions. We expect the tax burden to remain at the current level in the medium term due to the 2016 amendment to the EEG. According to current information, there will be no significant additional charges from the state aid investigation regarding the network charge exemption in past periods.
The fundamental retention of the special carbon leakage status for certain sectors starting in 2021 with regards to the allocation of emission trading allowances and CO2 electricity price compensation is currently being discussed by policymakers. From today’s perspective, it is difficult to predict the result. We expect costs to increase in the medium term overall, which could lead to significant strains. The topic of energy and the associated risks, currently classified as “medium”, will remain important for Aurubis as an energy- intensive company in the future as well.
Finance and financingMetal price and exchange rate fluctuations represent a potential risk in the buying and selling of metals. This risk is substantially reduced through foreign exchange and metal price hedging. Metal backlogs are hedged daily using financial instruments such as spot and forward contracts. The same effect occurs by using spot and forward exchange contracts to hedge foreign currencies. Foreign exchange risks from exchange rate fluctuations are also minimized on a daily basis in this way. We have only selected strong, credit-worthy firms as partners for hedging transactions to minimize the credit risk.
We hedge expected receipts from foreign currencies, especially the US dollar, with options and forward exchange transactions in some cases. We will continue this in the future as well, and expect that we can reduce the risks from metal price and exchange rate fluctuations to a reasonable level with these measures.
Credit risks from trade accounts receivable are largely hedged by commercial credit insurances. Internal risks were only permitted to a very limited extent and after review. The development of the outstanding receivables is monitored closely. During the reporting period there were no significant bad debts. We do not foresee any threatening trends in the future.
The liquidity supply is very important for the Aurubis Group and was secured during the past fiscal year. Credit lines at the banks were also sufficient. From the current perspective, we expect a corresponding trend for the new fiscal year as well. We currently classify risks that could result from the resurgence of the sovereign debt crisis in the eurozone as “medium”.
Combined Management Report
Aurubis Annual Report 2015/16
93 52 Foundations of the Group 66 Economic Report 90 Subsequent Events
90 Risk and Opportunity Report 99 Forecast Report106 Legal Disclosures

Environmental protection and other aspectsThere is always a risk that environmental or regulatory provisions could become more stringent, leading to added costs or limitations in product fabrication and marketing. For example, there is a risk that increasingly strict environmental legislation will restrict the marketing of iron silicate. We have started the MSO project (Metallurgical Slag Optimization) in the Hamburg primary smelter to counter this development. One target is to reduce the unwanted elements in the iron silicate with an additional preparation stage. We also want to achieve greater flexibility on the sales market by expanding our granulation capacities.
In addition, environmental risks resulting from the possible failure to comply with limit values and violations of requirements can have legal consequences. We ensure the environmentally sound operation of our production facilities to counter this, among other things. We are an international leader in environmental protection, which is confirmed by annual certifications in accordance with ISO 14001 and EMAS, for example. We consider ourselves to be well positioned for the future in this regard. Nevertheless, operational incidents that could have an adverse impact on the environment cannot be completely ruled out. Overall, we classify the environmental risks as “medium”.
In a plant with complex processes, employees’ specialist knowledge is an important factor to ensure performance quality. Different measures are intertwined with each other so that Aurubis can continue to count on employees’ expertise. We build connections to skilled young people through our collaboration and contact with universities, and we foster development among professionals and managers through qualification processes.
Occupational safety and health protection take high priority for us. We focus on individual responsibility, detailed hazard assessments, training, and short-term and medium-term goals with the objective of Vision Zero, i. e. no accidents.
We counter legal, tax and compliance risks with organizational procedures and clear management structures. We are closely following political discussions about tax issues, for example the financial transaction and capital tax, and their possible effects. In the course of the antitrust proceedings that had been pending against us in Bulgaria, the authorities ruled in favor of Aurubis. However, a customer contacted the responsible court and objected to this decision. The Aurubis Group continues to consider the allegations unfounded.
Furthermore, Aurubis is subject to IT risks that can impact the supply, production and sales areas, for example, and these were considered accordingly in the risk assessment. From the current perspective, these risks are nevertheless insignificant due to the risk reduction measures in place that are described below:
We limit the risks of decreased IT system availability through continuous monitoring, technical precautions and implementing necessary adjustments. The redundant design of our IT infrastructure, as well as data recovery and continuity plans, counter the risks of possible incidents or disasters. In order to prevent the risks of unauthorized access to company data, we restrict the issuing of access rights, carry out security reviews and use modern security technologies.
Furthermore, selected risks are largely covered by insurance policies. We rely on the expertise of an external insurance broker for this purpose.
See Glossary, page 196.
Combined Management Report
Aurubis Annual Report 2015/16
94

Internal control system relating to the consolidated accounting process/accounting process
(Report pursuant to Section 289 (5) and Section 315 (2) No. 5 German Commercial Code (HGB))
The objective of the internal control system (ICS) for the accounting process is to ensure that financial statements are prepared in compliance with regulations. Aurubis has an internal control and risk management system in which structures and processes related to the accounting process are defined and implemented in the organization. This ensures that the Group accounting procedures are reliable and performed correctly, that business transactions are thoroughly reported in a timely manner as prescribed by law and in the Articles of Association, and that legal norms and internal guidelines on accounting are observed. Amendments to laws and accounting standards are continuously analyzed for their relevance to the consolidated financial statements, and resultant changes are incorporated into the Group’s internal processes and systems.
Principles of the internal control system related to accounting policiesAs the parent company, Aurubis AG prepares the Aurubis Group’s consolidated financial statements. The financial reporting of the consolidated Group companies that are included in the consolidated financial statements takes place prior to this process. These Group companies prepare their financial statements locally and transfer them via a group-wide, defined and consistent data model to the Corporate Accounting Department. The Group companies are responsible for compliance with the valid group-wide guidelines and procedures, as well as for the correct and timely implementation of accounting-relevant processes and systems.
The internal control system includes the following main principles:
» Ensuring standardized accounting procedures in the preparation of the separate financial statements of Aurubis AG, with systematically implemented controls supported by manual accounting controls and other authorization and approval procedures (separation of functions, access regulations and limitations, the use of the dual control principle, guidelines on payment transactions)
» Ensuring consistent Group accounting procedures in accordance with IFRS by applying accounting regulations and work instructions uniformly, centrally auditing reporting packages, analyzing deviations from the budget and providing reports as part of the quarterly finance meetings
» Inclusion of external accounting and internal reporting by all Group companies in a consolidation and reporting system
» Overall consolidation of the consolidated financial statements by the Corporate Accounting Department, which centrally performs consolidation measures, coordination and monitoring of the timely and procedural input
» Giving Group companies support in accounting procedures by having a central contact person in Corporate Accounting
» Clarification of special technical questions and complex issues related to specific cases with an external consultant
Combined Management Report
Aurubis Annual Report 2015/16
95 52 Foundations of the Group 66 Economic Report 90 Subsequent Events
90 Risk and Opportunity Report 99 Forecast Report106 Legal Disclosures

Internal Audit as process-independent risk observationThe Internal Audit Department examines the reliability of the accounting practices, among other things. In particular, existing internal accounting policies and the adherence to them in practice are assessed. Internal Audit additionally provides information about risks that arise from identifiable deviations and advises on adjustment measures.
Opportunity management system
In addition to risk management, opportunity management is an important element of the Aurubis Group’s centralized and decentralized planning, management and control processes. The objective is to identify early on any internal and external potential that could positively impact our economic success. This potential is assessed and weighed against the risks associated with it. The next step is to define initiatives and measures to help utilize this potential. The process of identifying and assessing opportunities is part of our annual integrated strategy and planning process.
Making the best use of opportunities is a daily management responsibility – both at the segment level and the Group level. The basis for recognizing opportunities is continuous observation and analysis of our markets on the supply and demand side, of the competitive environment and of global trends.
Explanation of relevant opportunities
Rising global demand for copper and copper productsCopper is one of the most important metallic raw materials. Demand for copper is aligned with world economic growth, especially in the electrical, electronics, construction and automotive industries. Global trends such as increasing energy scarcity, rising urbanization, electric cars and the growth of the world’s middle class will continue to drive copper demand upwards. If the economy and the demand for our copper products develop more favorably than currently expected in the markets relevant to us, this could have a positive influence on the Aurubis Group’s earnings.
Positive trend in treatment and refining charges and market prices for our productsThe Aurubis Group’s earnings situation will be largely determined by the treatment and refining charges for copper concentrates, copper scrap and recycling materials, and by the market prices for our products, such as sulfuric acid. If treatment and refining charges and market prices for our products develop more favorably than currently forecast, this could positively impact the Aurubis Group’s earnings.
Combined Management Report
Aurubis Annual Report 2015/16
96

Increasing significance of sustainability and resource efficiencyAurubis is a leading global copper recycler. In light of the rising importance of resource efficiency and sustainability, we expect demand for recycling solutions to continue growing. This is also supported and promoted by national and international law. Thanks to our recycling activities and proximity to our copper product customers, we consider ourselves to be in a position to offer expanded solutions for closed recycling systems. If national and international recycling regulations become stricter, and if demand for recycling solutions in our markets increases more strongly than expected, this could positively affect the Aurubis Group’s procurement situation and therefore its earnings.
Development of expertise in processing complex raw materialsPrimary and secondary raw materials are becoming more complex, insofar as their contents of copper are decreasing and their concentrations of by-elements and impurities are increasing. One of Aurubis’ strengths is in processing complex materials, e. g. electronic scrap. Aurubis is continuously developing this expertise to devise effective and resource-efficient processing methods for the raw materials of the future in the FCM (Future Complex Metallurgy) project. If even more progress is achieved in developing our skills than currently forecast, this could positively influence the Aurubis Group’s earnings.
Continuous improvement of processes and cost position and achievement of synergiesOur markets are globally competitive. Operating excellence is therefore exceedingly important. We continuously work on optimizing our processes and improving our cost position. Furthermore, we are always identifying and implementing the synergy potential arising from our position along the copper value chain. If we exceed the targets relating to initiated improvement measures, this could have a positive impact on the Aurubis Group’s earnings.
Capacity expansion linked with internationalizationWe see growth potential in the expansion of our processing capacities in regions that have favorable conditions and are in proximity to our procurement and sales markets. We will continue investing in our existing sites, but will also strive to further expand our production network. If we are in a position to expand our capacities even more and/or with lower capital expenditure than expected, this could positively affect the Aurubis Group’s earnings.
See Glossary, page 196.
Combined Management Report
Aurubis Annual Report 2015/16
97 52 Foundations of the Group 66 Economic Report 90 Subsequent Events
90 Risk and Opportunity Report 99 Forecast Report106 Legal Disclosures

Developing solutions for customers and suppliersWe work closely with our suppliers and customers at all levels of our value chain. This includes developing individual customer products, providing extra services, processing specific raw materials and offering additional closed recycling solutions. If demand from our customers and suppliers for our solutions is stronger than forecast, this could have a positive effect on the Aurubis Group’s earnings.
Innovations from future research and development activitiesIn the scope of our research and development activities, we work on innovations that create a competitive advantage for us in the future. For example, we’re working on making our processing methods more resource-efficient, and on expanding our expertise in complex material processing.
For example, we have initiated a project in the Hamburg primary smelter (MSO, Metallurgical Slag Optimization), the goal of which is to reduce the unwanted elements in iron silicate with an additional processing step. Furthermore, we want to achieve broader flexibility on the sales market by expanding our iron silicate granulation capacities.
Our activities in the product sector focus on developing production technologies to reduce throughput times, and on the technical implementation of recycling solutions for our customers, for instance. If there is more progress in our research and development activities than currently expected, this could positively impact the Aurubis Group’s earnings.
Assessment of the Group’s risk and opportunity situation
No substantial risks arose in the reporting year. There were no particular structural changes in the Group’s risks. According to our current assessment, there are no risks that endanger the company’s continued existence.
Both the Audit Committee and the auditors ascertained that the Executive Board and Supervisory Board have taken the measures prescribed by Section 91 (2) German Stock Corporation Act (AktG) in an appropriate manner and that the legally required risk management and monitoring system fulfills all the requirements.
For a complete overview of company activities, the opportunities for the Group must be considered in addition to the risks. The existing opportunities for the Aurubis Group are comparable to those of the previous year. We are confident that we will be able to make use of the opportunities presented by our business portfolio, our expertise and our ability to innovate. At the same time, these factors put us in a position to successfully counter existing risks. Furthermore, we are convinced that we have the appropriate processes, measures and instruments in place to identify important opportunities and to manage relevant risks.
Combined Management Report
Aurubis Annual Report 2015/16
98

Forecast Report
The statements made in the Forecast Report are based on our assessment of overall economic conditions, and the trend on both the global copper market and Aurubis’ raw material and product markets, which are based on analyses by economic research institutes, organizations and industry associations as well as internal market analyses. The forecasts for future business performance provided here are aligned with the BU targets as well as the opportunities and risks posed by expected market conditions and competitive situations in the forecast period of October 1, 2016 to September 30, 2017. The opportunities and risks affecting the Aurubis Group are explained in detail in the Risk and Opportunity Report. Our forecasts are regularly adjusted. The following statements are based on our knowledge in December 2016.
From the current perspective, the following uncertainties could influence the Aurubis Group’s markets: in particular, the result of the presidential election in the USA, the subsequent developments and the Federal Reserve’s pending interest rate decision could have an impact. In Europe, the Brexit decision, i.e. the British people’s vote to leave the EU, and the accompanying events and consequences, as well as the constitutional referendum in Italy in December 2016, could affect the markets. There will be key elections in several countries in 2017, including Germany and France, that have the potential to bring about changes. Political crises are still an influential factor in the MENA region (Middle East and North Africa).
Overall economic development
The global economy was in a moderate recovery phase in fall 2016. According to an IMF estimate, the economy could gain traction in 2017 and grow somewhat faster, with plus 3.4 % compared to 2016. Nevertheless, the IMF pointed out that this forecast is based on a number of assumptions and that there are still risks.
The assumed progress in emerging markets and developing countries contributes positively to this assessment. A return to more normalized conditions in individual countries is necessary, though. Rising commodity prices benefit development in countries that export raw materials. First and foremost, however, the decisive condition is that China’s economic transformation proceeds without any significant growth slumps, with a growth rate that considerably exceeds that of other emerging markets.
For the industrialized countries, on the other hand, the outlook is subdued overall, though the upswing should continue in general and individual countries should see an improved trend. The industrialized countries’ growth in productivity is rather low, and investment activity is too weak in some cases. The tendency towards protectionism holds risks in particular. Weak global trade is a cause for concern in those economies with strong exports. There is also uncertainty regarding the very expansive monetary policy that supports global growth.
In the regional markets that are important for the world copper market, the following tendencies are evident for 2017:
The IMF assumes that the USA will achieve economic growth of 2.2 % (previous year: 1.6 %) in 2017. Nevertheless, insecurity has increased following the election, which could lead to changes in the country’s political direction. A growth rate of 6.2 % (previous year: 6.6 %) is expected for China, assuming that the transformation towards more consumption-oriented growth and to an economy more strongly supported by services continues in an orderly fashion. In the eurozone, the IMF anticipates economic growth of 1.5 % (previous year: 1.7 %), which takes into account uncertainties about the economic consequences of the Brexit vote. Despite lower growth of 1.4 % (previous year: 1.7 %), Germany is still viewed as a pillar of stability in the region overall.
Combined Management Report
Aurubis Annual Report 2015/16
99 52 Foundations of the Group 66 Economic Report 90 Subsequent Events
90 Risk and Opportunity Report 99 Forecast Report106 Legal Disclosures

Development on the markets relevant to our business
General copper marketMany see potential for moderate price recovery in the copper market in 2017. Already in the first several weeks of the new fiscal year, the copper price on the London Metal Exchange recovered to up to US$ 5,600/t (settlement) in mid-November.
The key factor for the fundamental situation on the copper market overall in 2017 will be whether this year’s disproportionately good production trend can continue in the coming year. The International Copper Study Group (ICSG) anticipates a roughly 2 % increase in the global output of refined copper. A handful of analysts view the production side as likely to be less stable than in 2016, quoting possible strikes, technical disruptions or maintenance shutdowns that could have unfavorable impacts. On the other hand, the market supply of the raw material, copper concentrate, should ensure good production capacity utilization once again. Furthermore, there will be new or expanded smelter capacities in China that will contribute to refined copper production. This could compensate for possible breakdowns.
China remained the leader on the demand side of the copper market: the country accounts for about 45 % of the global refined copper demand. The International Copper Association thinks an increase of up to 15 % in Chinese copper demand is possible in the current five-year plan, in light of ambitious economic growth plans. For 2017, analysts expect an increase of 4 to 5 %. The country’s energy sector, which is looking to renewable energies, will be a key industry once again. Momentum is also coming from the real estate sector and from rising demand for electric cars. The country’s demand was underestimated in 2016. On the whole, the global demand increase in 2017 is estimated at about 1 to 3 %.
The visible copper inventories at the metal exchanges weren’t classified as excessively high at the start of the new fiscal year, particularly since in October 2016 higher volumes from the previously-supplied Asian LME warehouses were being deducted again. At the same time, copper volumes in Chinese bonded warehouses decreased.
Larger production surpluses of refined copper aren’t expected in 2017. The ICSG estimates a production surplus of about 160,000 t, which is barely significant in light of the market volume of nearly 24 million t. This also applies to similar estimates by other market research institutes. The International Wrought Copper Council (IWCC) and other groups largely anticipate balanced production and demand on the international copper market in 2017.
On this basis, the 2017 copper price should be safeguarded at the lower end for the most part, with limited upward potential. It was already apparent in 2016 that prices dipping below US$ 4,600/t consistently stimulated buying interest. However, price volatility will remain a feature of the market.
Markets for copper concentrates and sulfuric acidCopper concentrates make up a large part of the supply of raw materials for copper production at Aurubis. There is a global market for copper concentrates in which mining companies, traders and primary smelters are active. The primary smelters are largely those that don’t have their own mines or mine stakes. Copper concentrates are generally sourced through long-term supply contracts. The treatment and refining charges agreed in these contracts are oriented to annual benchmarks for purer qualities, but deviate from these benchmarks depending on complexity. The first larger delivery contract between a mine and a concentrate smelter for 2017 can be taken as a benchmark in this case.
Combined Management Report
Aurubis Annual Report 2015/16
100

The supply on the international copper concentrate markets is likely to continue to be good during the new fiscal year. The commissioning of expansion capacities and new mine projects will positively impact the availability of volumes once again. Production difficulties at mines or unpredictable events such as strikes, technical disruptions, energy bottlenecks and extreme weather could negatively influence supply, however.
Treatment and refining charges for spot shipments of copper concentrates were high at the start of the new fiscal year. The current contract negotiations for 2017 haven’t been concluded yet.
In the case of sulfuric acid, which we produce as a by-product in the course of concentrate processing, an accurate price forecast for the year isn’t possible. The market trend is volatile and depends on the supply situation and demand from the fertilizer industry and the mining industry. Good capacity utilization of sulfur burners and of the metal industry’s concentrate smelters influences the production side. Price changes at short notice, including those due to seasonal effects, are therefore not unusual.
Markets for copper products and recyclingIn the coming months, the situation on the copper product markets will likely depend strongly on how the overall economy in Europe develops and how the individual sector economies perform. The following developments are evident:
The German Electrical and Electronics Manufacturers’ Association (ZVEI) anticipates 4 % growth for the global electrical and electronics market in 2017. The industrialized countries contribute to this with plus 2 %, though the main momentum comes from the emerging markets, where 5 % growth is anticipated. In the key market of Europe, which accounts for 19 % of the global market, the ZVEI anticipates sector growth of 3 %.
Demand for cars in Europe rose by 8 % in the first nine months of 2016, according to the European Automobile Manufacturers’ Association. The five largest individual regional markets showed solid growth. At the moment, it seems that this won’t change fundamentally in 2017.
The upswing in the German construction industry continues. As the main German construction association reports, the duration of the orders on hand was most recently at an average of 3.6 months, with demand for construction services described as consistent. The order plus for the first seven months of 2016 was at a nominal level of 16.9 %. In this area as well, the encouraging trend can currently be expected to continue.
Based on these forecasts, we expect stable economic development in 2017 in the three main sectors in which copper is used. However, political and economic risks continue and could change the market situation in each case.
The US economy, the development of which is crucial for our plant there, could continue to recover in 2017 according to the IMF. This could support the US copper business.
Wire rod business is generally somewhat weaker in the first quarter of a new fiscal year due to seasonal factors. We expect this for the new fiscal year 2016/17 as well. Furthermore, projects in the Middle East have been delayed due to the low crude oil price. This affected the business of local cable producers, which slightly weakened demand in the region. Nevertheless, we expect stable conditions to return starting January 2017. For the entire fiscal year, we also anticipate largely stable demand in the cable and wire industry, as well as the automotive sector.
Combined Management Report
Aurubis Annual Report 2015/16
101 52 Foundations of the Group 66 Economic Report 90 Subsequent Events
90 Risk and Opportunity Report 99 Forecast Report106 Legal Disclosures

With regards to market development for copper shapes, we expect the demand trend to continue towards high-quality specialty products. The increasing market consolidation for standard products will likely continue. We assume a stable development in demand across this entire sector as well.
On the European market for flat rolled products, we anticipate slightly improved demand with growth opportunities in individual sectors. We don’t expect the market environment to change much in North America.
In Business Line Bars & Profiles, the focus is on new product developments to improve our market presence. The objective is to expand the product portfolio with higher-quality specialty products.
In the area of recycling, which is part of BU Copper Products from an organizational perspective, a forecast is difficult because key sub-markets are influenced by spot transactions. Changes in this area can take effect very quickly.
For copper scrap, the market situation improved after the end of fiscal year 2015/16 due to the increase in copper prices. Because of our market penetration, we expect to be able to supply our facilities even when the availability of volumes is limited.
The availability of complex recycling materials, including electrical and electronic scrap, is fundamentally subject to other conditions and to changes that don’t take effect so quickly. The satisfactory situation for complex recycling materials has not changed significantly up to this point.
Business and earnings expectations for the Aurubis Group
As indicated by the remarks about the overall economic trend and development on the markets relevant to our business, the Aurubis Group’s fiscal year 2016/17 will be accompanied by uncertainties that will impact our business activities.
We expect different developments in the two Business Units:
In BU Primary Copper, a maintenance shutdown that is legally mandated every three years was carried out in October/November 2016, which will strain the result of Q1 2016/17. We expect high plant availability for the rest of the fiscal year.
At the same time, we anticipate continued good availability of copper concentrates on the global market. Due to the commencement of new projects and expansions, the supply is expected to be satisfactory in 2017 as well. Supported by our broad position on the market and our supplier diversification, we are confident that we will be able to secure a good supply once again. We assess the expected treatment and refining charges as relatively high in light of the current market situation.
The likely development of the copper scrap supply can’t be gauged. Business in this area is conducted with short timelines, and is therefore dependent on influences that are difficult to forecast. The higher copper prices that are expected in some cases could nevertheless help improve the supply. Our broad market position absorbs supply risks in this case as well.
Combined Management Report
Aurubis Annual Report 2015/16
102

Sulfuric acid sales are also dependent on short-term developments. The terms of the contracts used are therefore also short. In addition, sales possibilities are very different from region to region, with varying conditions accordingly. Aurubis supplies the global sulfuric acid market, with a focus on Europe and South America. The relationship between local sales and exports fluctuates depending on market circumstances.
The sub-markets in BU Copper Products are mixed.
Sales of free cathode volumes on the market are oriented to the processing plans of our cathode production sector in the Group.
Adequate statements about the development of the copper product business in the new fiscal year are only possible to a limited extent since the negotiation season for 2017 sales contracts hasn’t ended yet. One factor that is already clear is the cathode premium Aurubis has established for European customers for the coming calendar year. This premium is related to annual contracts for cathodes and copper products and was reduced from US$ 92/t to US$ 86/t. This takes expected customer demand for annual contracts into account.
In light of the positive economic situation in the relevant sectors and the fact that it is not expected to undergo any larger slumps in 2017, we expect to be able to conclude the negotiation season for copper products with satisfactory contracts. Good customer relationships in our key markets support this. We will also continue expanding our business with new customers.
In copper scrap recycling, the same assumptions that were outlined in the statements on BU Primary Copper should be assumed in BU Copper Products as well. All in all, it can be said that a reliable overall assessment of the future copper scrap supply in 2017 isn’t possible. Likewise, it is not possible to make a long-term statement about the possibilities of
using blister copper as a substitute. Due to our presence on the recycling and blister copper markets and our good relationships with suppliers, we are nevertheless confident that we will be able to secure the supply of copper scrap/blister copper in the Group. With the closing-the-loop approach, which we developed more intensively in the previous fiscal year, we want to utilize product customers as suppliers of production scrap. We will continue to pursue this approach in 2017.
Overall, there could be quarterly differences as in previous years. This is due to seasonal factors, but may also be caused by disruptions in equipment or operating processes. The business performance of the first quarter of a fiscal year in particular is shaped by special features related to the period, including reduced customer orders or changes in raw material deliveries. It is not possible to predict the individual influences of European and German energy and environmental policy, which is important for us.
At the end of fiscal year 2015/16, different initiatives were kicked off within the Group to strengthen Aurubis further. Aurubis is currently the market leader in many areas – these positions should at least be maintained, and even expanded in the long term. Three key initiatives were started for this purpose:a) An opinion survey distributed to more than 1,000
employees b) A diagnostic process based on financial and operating
KPIs (key performance indicators), central processes, organizational structures and existing IT systems
c) Projects for in-depth continuous improvement.
We will present the initial results at our Annual General Meeting on March 2, 2017 and as the first half of 2017 goes on.
The future development and forecast for Aurubis AG coincides with the general statement on the Aurubis Group.
Combined Management Report
Aurubis Annual Report 2015/16
103 52 Foundations of the Group 66 Economic Report 90 Subsequent Events
90 Risk and Opportunity Report 99 Forecast Report106 Legal Disclosures

Expected financial situation
Net cash flow in the past fiscal year was € 236 million. Burdens from cash outflows from investing activities reached € 128 million during the fiscal year (previous year: € 104 million). Overall, net borrowings decreased slightly to € 23 million, following € 53 million in the previous year. Gross borrowings declined slightly in the past fiscal year, from € 506 million in the previous year to € 495 million in the reporting year, as a result of scheduled repayments. Available cash increased slightly from € 453 million to € 472 million. The company has additional liquidity due to available lines of credit amounting to € 350 million from a syndicated loan agreement running until 2021. Aurubis therefore has sufficient liquidity that is not at risk from today’s perspective. We don’t expect any significant negative impacts on the financial position from the operating business in the coming fiscal year. We intend to use existing liquidity to settle the scheduled payments of € 142 million due in fiscal year 2016/17.
General statement on the future development of the Aurubis Group
In fiscal year 2015/16, the Aurubis Group generated a result that was below the outstanding prior-year result. This was due to unfavorable developments in the relevant sub-markets, especially the markets for sulfuric acid and copper scrap. The scheduled shutdown in Bulgaria and a lower cathode premium reduced the result as well. This confirmed what we had already anticipated in the outlook included in our last Annual Report. For 2017, the market trend for copper scrap and sulfuric acid is difficult to forecast overall.
We expect positive contributions from the Results Improvement Program, which we transitioned to a Continuous Improvement Program at the start of the new fiscal year. It will lead to additional optimizations at all of the sites.
In BU Primary Copper, a maintenance shutdown that is legally mandated every three years was carried out in October/November 2016, which will strain the result of Q1 2016/17. We expect high plant availability for the rest of the fiscal year.
We expect both operating EBT and operating ROCE to be significantly higher for fiscal year 2016/17 in BU Primary Copper.
In BU Copper Products, we anticipate slightly higher operating EBT and operating ROCE at the prior-year level.
Overall, we expect significantly higher operating EBT and slightly higher operating ROCE for the Group in fiscal year 2016/17 compared to the reporting year.
Qualified comparative forecast according to Aurubis’ definition
Change in
operating EBTROCE delta as
a percentage
At prior-year level ± 2 % ± 1
Slight ± 3 to 10 % ± 1 to 5
Significant > ±10 % > ±5
¤ T 025
Combined Management Report
Aurubis Annual Report 2015/16
104

Forward-looking statements This document contains forward-looking statements about our current forecasts of future events. Words such as “anticipate”, “assume”, “believe”, “predict”, “expect”, “intend”, “can/could”, “plan”, “project”, “should” and similar terms indicate such forward-looking statements. These statements are subject to a number of risks and uncertainties. Some examples include unfavorable developments in the global economic situation, especially political developments in the USA, Europe and China, a tightening of the raw material supply and a decline in demand in the main copper sales markets. Further risks include a deterioration of our refinancing options on the credit and finance markets, unavoidable events beyond our control such as natural disasters, acts of terror, political unrest and industrial accidents, and their effects on our sales, purchasing, production or financing activities, changes in exchange rates, a drop in acceptance for our products resulting in impacts on the establishment of prices and the utilization of processing and production capacities, price increases for energy and raw materials, production interruptions due to material bottlenecks, employee strikes or supplier bankruptcies, successful implementation of measures to reduce costs and enhance efficiency, the business outlook for our significant holdings, the successful implementation of strategic cooperation and joint ventures, amendments to laws, ordinances and official regulations, as well as the outcomes of legal proceedings and other risks and uncertainties, some of which are described in the Risk and Opportunity Report in this Annual Report. If one of these uncertainties or difficulties occurs, or if the assumptions underlying the forward-looking statements prove to be wrong, the actual results could deviate considerably from the results mentioned or implicitly expressed in these statements. We do not intend, nor do we assume the obligation, to update forward-looking statements continuously, as these statements are based solely on the circumstances on the day of publication.
Combined Management Report
Aurubis Annual Report 2015/16
105 52 Foundations of the Group 66 Economic Report 90 Subsequent Events
90 Risk and Opportunity Report 99 Forecast Report106 Legal Disclosures

Legal Disclosures
Declaration on corporate governance pursuant to Section 289a German Commercial Code (HGB)
The declaration on corporate governance and the compensation report are part of the Combined Management Report. Both are printed at the beginning of this Annual Report and are available on the Company’s website.
Takeover-related disclosures and explanations
Explanatory report by the Executive Board of Aurubis AG, Hamburg, in accordance with Section 176 (1) sentence 1 German Stock Corporation Act (AktG) regarding disclosures of takeover provisions pursuant to Section 289 (4) and Section 315 (4) German Commercial Code (HGB) as at the balance sheet date of September 30, 2016The following disclosures as at September 30, 2016 are presented in accordance with Section 289 (4) and Section 315 (4) German Commercial Code (HGB).
Composition of the subscribed capitalThe subscribed capital (share capital) of Aurubis AG amounted to € 115,089,210.88 as at the balance sheet date and was divided into 44,956,723 no-par-value bearer shares, each with a notional value of € 2.56 of the subscribed capital.
Each share grants the same rights and a single vote at the Annual General Meeting. There are no different classes of shares.
Shareholdings exceeding 10 % of the voting rightsOne indirect shareholding in Aurubis AG exceeds 10 % of the voting rights:
Salzgitter AG, Salzgitter, notified the Company in accordance with Section 21 (1) German Securities Trading Act (WpHG) on August 29, 2011 that its voting interest in Aurubis AG had exceeded the threshold of 25 % of the voting rights on August 29, 2011 and amounted to 25.002 % of the voting rights (representing 11,240,000 votes). Of this total, 25.002 % of the voting rights (representing 11,240,000 votes) are attributed to Salzgitter AG via Salzgitter Mannesmann GmbH, Salzgitter.
Accordingly, one direct investment in the capital of Aurubis AG exceeds 25 % of the voting rights: according to the notification from Salzgitter AG, Salzgitter, dated August 29, 2011, Salzgitter Mannesmann GmbH, Salzgitter, has held 25.002 % of the voting rights (representing 11,240,000 votes) since August 29, 2011.
Appointment and removal of Executive Board members and amendments to the Articles of AssociationThe appointment and removal of members of the Executive Board of Aurubis AG are covered by Sections 84 and 85 German Stock Corporation Act (AktG) and Section 31 Law on Co-determination (MitbestG) in conjunction with Section 6 (1) of the Articles of Association. Amendments to the Articles of Association are subject to the approval of the Annual General Meeting. The resolution at the Annual General Meeting is passed by a majority that must comprise at least three quarters of the subscribed capital represented in the vote; Sections 179 et seq. German Stock Corporation Act (AktG) apply. In accordance with Section 11 (9) of the Articles of Association, the Supervisory Board is authorized to resolve amendments to the Articles of Association that only relate to their wording. Furthermore, the Supervisory Board is empowered to adjust Section 4 of the Articles of Association
>www.aurubis.com
Combined Management Report
Aurubis Annual Report 2015/16
106

after the complete or partial execution of the subscribed capital increase in accordance with the respective claim to the authorized capital and after the authorization expires. It is also empowered to adjust the wording of Section 4 (1) and (3) of the Articles of Association in accordance with the respective issuing of new no-par-value bearer shares to the holders or creditors of convertible bonds and/or bonds with warrants, profit participation rights or participating bonds (or combinations of these instruments), which are issued by the Company or companies in which it has an indirect or direct majority interest for a cash contribution as a result of the authorization resolved at the Annual General Meeting on March 1, 2012 under item 8 of the agenda, and grant a conversion or option right to new no-par-value bearer shares in the Company or establish a conversion obligation. The same applies if the authorization to issue bonds with warrants or convertible bonds is not used after the authorization period expires or if the conditional capital is not used after the deadlines for exercising option or conversion rights or for fulfilling conversion or option obligations have expired.
Power of the Executive Board to issue sharesIn accordance with Section 4 (2) of the Articles of Association, the Executive Board is empowered, with the approval of the Supervisory Board, to increase the Company’s subscribed capital in the period until February 23, 2021 by issuing up to 22,478,361 new no-par-value shares in exchange for a cash contribution and/or a contribution in kind, as a one-off or in several installments, by up to € 57,544,604.16. The shareholders shall always be granted a subscription right. The new shares can also be acquired by one or more credit institutions with the obligation of offering them to shareholders for subscription. The Executive Board is, however, authorized, subject to the approval of the Supervisory Board, to exclude shareholder subscription rights once or on several occasions,
a) inasmuch as it is necessary to exclude subscription rights for possible fractional amounts,
b) up to an arithmetical nominal value totaling € 23,017,840.64 if the new shares are issued for a contribution in kind,
c) in the case of capital increases against cash contributions up to an arithmetical nominal value totaling € 11,508,920.32 or, if this amount is lower, by a total of 10 % of the subscribed capital (the “maximum amount”) existing when this power was exercised for the first time (in each case offsetting any utilization of other authorizations to exclude the subscription right pursuant to or in corresponding application of Section 186 (3) sentence 4 German Stock Corporation Act (AktG)), if the issuing price of the new shares is not significantly lower than the price of Company shares in the same category on the stock exchange at the time when the price is finally fixed. The subscribed capital allotted to any shares that are issued or must be issued in order to fulfill convertible bonds and/or bonds with warrants, that are issued after February 24, 2016 in the corresponding application of Section 186 (3) sentence 4 German Stock Corporation Act (AktG) excluding the subscription rights, or that are sold after February 24, 2016 in the corresponding application of Section 186 (3) sentence 4 German Stock Corporation Act (AktG), must be included in this maximum amount. An inclusion that has been carried out is canceled if powers to issue convertible bonds and/or bonds with warrants in accordance with Section 221 (4) sentence 2 and Section 186 (3) sentence 4 German Stock Corporation Act (AktG), or to sell own shares in accordance with Section 71 (1) No. 8 and Section 186 (3) sentence 4 German Stock Corporation Act (AktG), are granted again at the Annual General Meeting after exercising such powers that have led to inclusion.
Combined Management Report
Aurubis Annual Report 2015/16
107 52 Foundations of the Group 66 Economic Report 90 Subsequent Events
90 Risk and Opportunity Report 99 Forecast Report106 Legal Disclosures

d) up to an arithmetical nominal value totaling € 23,017,840.64 insofar as it is necessary to grant holders or creditors of bonds with warrants or convertible bonds issued by the Company to which the shares relate a subscription right for new shares to the same extent as they would be entitled after exercising their option or conversion rights.
In the resolution dated February 9, 2016 the Executive Board of Aurubis AG declared in the scope of a voluntary commitment that it would only make use of the authorizations to exclude shareholders’ subscription rights if the issued shares did not exceed 20 % of the share capital, neither at the time the authorization went into effect nor at the time it was exercised. Any owned shares that are sold under the exclusion of subscription rights, and shares that are to be issued to service bonds with a conversion and/or option right or a conversion obligation, if the bonds have been issued excluding the shareholders’ subscription rights, must be offset against the 20 % limit previously mentioned up to the issuance of new shares without subscription rights. If and to the extent that the shareholders at the Annual General Meeting reissue this authorization to exclude subscription rights after an authorization to exclude subscription rights has been exercised, leading to offsetting against the 20 % limit previously mentioned, the offsetting that has been carried out is no longer included.
This voluntary commitment was made accessible on Aurubis AG’s website for the duration of the authorization.
Power of the Executive Board to repurchase sharesWith a resolution of the Annual General Meeting on February 28, 2013, the Company was empowered until February 27, 2018 to repurchase its own shares (treasury shares) up to a total of 10 % of the current subscribed capital. Together with other own shares held by the Company or attributable to it in accordance with Sections 71a et seq. German Stock Corporation Act (AktG), the
shares acquired by the Company based on this authorization shall at no time exceed 10 % of the Company’s current subscribed capital. The acquisition of shares for the purpose of trading with own shares is excluded. The Executive Board is empowered to use Company shares that are purchased using this power for all legally permitted purposes, and in particular also for the following purposes:
a) Own shares that have been acquired can also be sold by means other than a sale via the stock exchange, or by means of an offer to all of the shareholders, if the shares are sold in return for a cash payment at a price that is not materially lower than the stock market price of the Company’s shares of the same category at the time of the sale; the subscription rights of the shareholders are excluded. This power shall, however, only apply on the condition that the shares sold excluding the subscription right may not, in accordance with Section 186 (3) sentence 4 German Stock Corporation Act (AktG), exceed 10 % of the subscribed capital, either at the time this becomes effective or at the time this power is exercised (the “upper limit”), in each case taking into account the possible use of other authorizations to exclude the subscription right in accordance with, or in the corresponding application of, Section 186 (3) sentence 4 German Stock Corporation Act (AktG). An inclusion that has been carried out is canceled if powers to issue new shares from authorized capital in accordance with Section 186 (3) sentence 4 German Stock Corporation Act (AktG), or to issue convertible bonds and/or bonds with warrants in commensurate application of Section 186 (3) sentence 4 German Stock Corporation Act (AktG), are granted again at the Annual General Meeting after exercising such powers that have led to inclusion.
b) Own shares that have been acquired can also be sold by means other than a sale via the stock exchange, or by means of an offer to all of the shareholders, if this is carried out in return for a contribution in kind by a third party, especially in conjunction with the acquisition of business
Combined Management Report
Aurubis Annual Report 2015/16
108

entities, parts of business entities or participating interests in business entities by the Company itself or by a business entity dependent on it or majority-owned by it, and in conjunction with business combinations or to fulfill conversion rights or obligations relating to conversion or option rights issued by the Company or Group entities of the Company; the subscription rights of shareholders are in each case excluded.
c) Own shares acquired can be withdrawn entirely or in part without a further resolution of the Annual General Meeting. They can also be withdrawn applying simplified proceedings without a reduction in capital by adjusting the proportionate notional share of the remaining no- par-value shares in the subscribed capital of the Company.
The complete text of the resolution dated February 28, 2013 can be referenced under agenda item 7 in the invitation to the Annual General Meeting 2013 published in the German Federal Gazette on January 15, 2013.
Power of the Executive Board to issue convertible bonds and shares from conditional capitalIn accordance with Section 4 (3) of the Company’s Articles of Association, the subscribed capital is conditionally increased by up to € 52,313,277.44 through the issuing of up to 20,434,874 new bearer shares without a nominal amount (no-par-value shares), each with notional interest in the subscribed capital of € 2.56 (conditional capital). The conditional increase in capital will be used to grant no-par-value bearer shares to the holders or creditors of convertible bonds and/or bonds with warrants, profit participation rights and/or participating bonds (or combinations of these instruments), which are issued by the Company or companies in which it has an indirect or direct majority interest, for a cash contribution as a result of the authorization passed at the Annual General Meeting on March 3, 2012 under item 8 of the agenda, and grant a conversion or option right to new no-par-value bearer shares in the Company or establish a
conversion obligation. The conditional increase in capital will only be carried out to the extent that option or conversion rights are used, or those holders or creditors that are required to convert fulfill their obligation to convert, and to the extent that the Company’s own shares or new shares from the utilization of authorized capital are not used for this purpose. The holders of new no-par-value bearer shares are entitled to participate in the profits from the beginning of the fiscal year in which they come into existence, through the exercise of option or conversion rights, or the fulfillment of conversion obligations. The Executive Board is authorized to define the further details of how the conditional capital increase shall be performed.
The complete text of the resolution dated March 1, 2012 can be referenced under agenda item 8 in the invitation to the Annual General Meeting 2012 published in the German Federal Gazette on January 19, 2012. The intention is to renew this authorization at the next Annual General Meeting.
Significant conditional agreements concluded by the CompanyIn the event that a single person or a group of persons acting together should acquire more than 50 % of the shares or the voting rights in Aurubis AG, every syndicate lender from the agreement with a banking syndicate (“the Syndicated Loan”) on a credit line totaling € 350 million, which primarily serves to finance the working capital of the Group, shall be entitled to cancel its participation in the Syndicated Loan and to demand immediate repayment of the amounts owed to it.
Within the scope of various bonds totaling € 436 million, every lender has an extraordinary right of cancellation if control over the borrower changes.
Combined Management Report
Aurubis Annual Report 2015/16
109 52 Foundations of the Group 66 Economic Report 90 Subsequent Events
90 Risk and Opportunity Report 99 Forecast Report106 Legal Disclosures
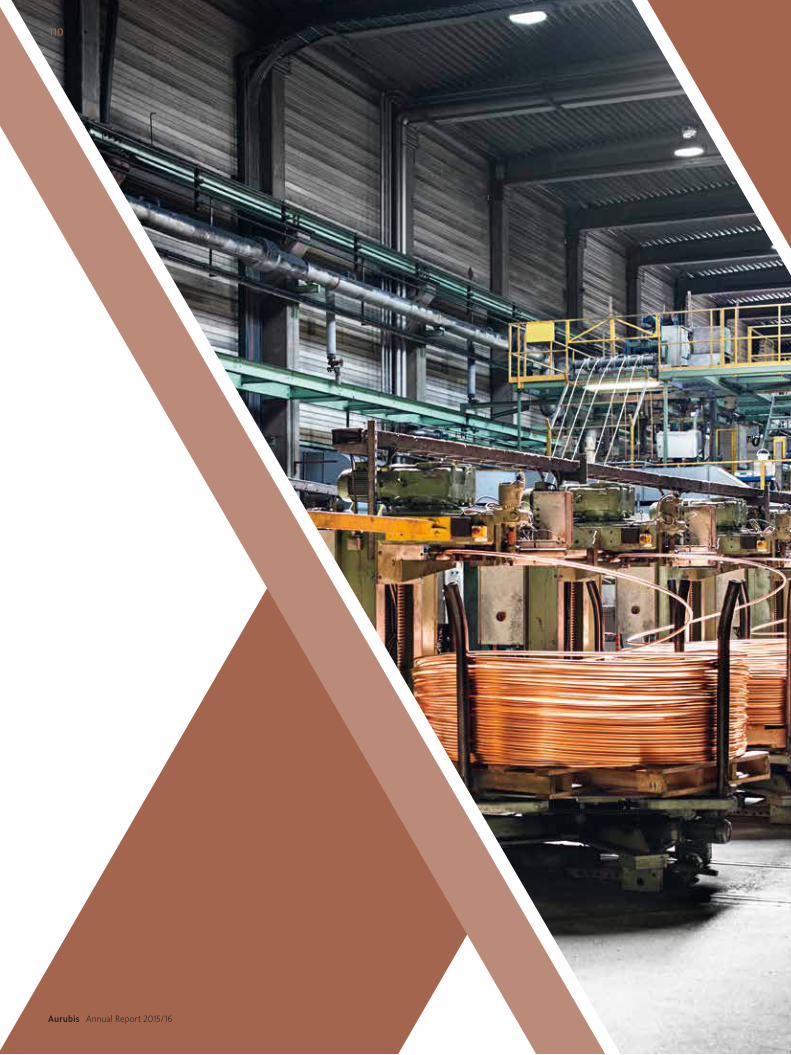
Aurubis Annual Report 2015/16
110

CONSOLIDATED FINANCIAL STATEMENTS
112 Consolidated Income Statement113 Consolidated Statement of Comprehensive Income114 Consolidated Statement of Financial Position116 Consolidated Cash Flow Statement117 Consolidated Statement of Changes in Equity118 Notes to the Consolidated Financial Statements
118 General disclosures118 Significant accounting principles 127 Changes in accounting and measurement methods
due to new standards and interpretations130 Notes to the income statement137 Notes to the statement of financial position179 Notes to the cash flow statement180 Segment reporting185 Other disclosures190 Investments
192 Responsibility Statement193 Auditors’ Report
Fina
ncia
l Sta
tem
ents
111
Aurubis Annual Report 2015/16

Consolidated Income Statementfor the period from October 1 to September 30 (IFRS)
in € thousand Note12 months
2015/1612 months
2014/15
Revenues 1 9,474,706 10,995,202
Changes in inventories of finished goods and work in process 2 97,546 15,281
Own work capitalized 3 8,752 6,383
Other operating income 4 57,801 59,749
Cost of materials 5 (8,635,277) (10,067,396)
Gross profit 1,003,528 1,009,219
Personnel expenses 6 (448,584) (431,295)
Depreciation and amortization of intangible assets and property, plant and equipment 7 (134,803) (136,406)
Other operating expenses 8 (243,322) (242,237)
Operational result (EBIT) 176,819 199,281
Result from investments measured using the equity method 9 6,351 1,403
Interest income 10 2,868 3,591
Interest expense 10 (27,373) (30,940)
Other financial income 11 257 225
Other financial expenses 11 (107) (4,116)
Earnings before taxes (EBT) 158,815 169,444
Income taxes 12 (35,296) (35,876)
Consolidated net income 123,519 133,568
Consolidated net income attributable to Aurubis AG shareholders 121,852 132,435
Consolidated net income attributable to non-controlling interests 13 1,667 1,133
Basic earnings per share (in €) 14 2.71 2.95
Diluted earnings per share (in €) 14 2.71 2.95
¤ T 026
112 Consolidated Income Statement
Aurubis Annual Report 2015/16

Consolidated Statement of Comprehensive Incomefor the period from October 1 to September 30 (IFRS)
in € thousand12 months
2015/1612 months
2014/15
Consolidated net income 123,519 133,568
Items that will be reclassified to profit or loss in the future
Measurement at market of cash flow hedges 28,050 (12,189)
Measurement at market of financial investments 5,092 (1,585)
Changes deriving from translation of foreign currencies (1,127) 3,778
Income taxes (6,786) 1,761
Items that will not be reclassified to profit or loss
Remeasurement of the net liability deriving from defined benefit obligations (95,103) 17,449
Income taxes 30,692 (5,553)
Other comprehensive income/(loss) (39,182) 3,661
Consolidated total comprehensive income 84,337 137,229
Consolidated total comprehensive income attributable to Aurubis AG shareholders 83,258 135,981
Consolidated total comprehensive income attributable to non-controlling interests 1,079 1,248
Explanations relating to the Statement of Comprehensive Income are provided in Note 24 to the Consolidated Financial Statements.
¤ T 027
Consolidated Financial Statements 113
Aurubis Annual Report 2015/16
192 Responsibility Statement193 Auditors’ Report
112 Consolidated Income Statement1 13 Consolidated Statement of
Comprehensive Income114 Consolidated Statement of
Financial Position
116 Consolidated Cash Flow Statement117 Consolidated Statement of
Changes in Equity118 Notes to the Consolidated
Financial Statements

Consolidated Statement of Financial Position(IFRS)
Assets
in € thousand Note 9/30/2016 9/30/2015
Intangible assets 15 84,740 83,898
Property, plant and equipment 16 1,288,155 1,287,082
Investment property 17 8,515 0
Financial fixed assets 18 23,414 26,572
Investments measured using the equity method 19 45,012 42,877
Deferred tax assets 25 10,418 8,080
Non-current financial assets 22 23,080 14,227
Other non-current non-financial assets 22 2,468 1,176
Non-current assets 1,485,802 1,463,912
Inventories 20 1,700,205 1,626,440
Trade accounts receivable 21 242,106 306,905
Other current financial assets 22 75,503 138,898
Other current non-financial assets 22 51,487 49,504
Cash and cash equivalents 23 471,874 452,971
Assets “held-for-sale” 17 0 5,955
Current assets 2,541,175 2,580,673
Total assets 4,026,977 4,044,585
¤ T 028
114 Consolidated Statement of Financial Position
Aurubis Annual Report 2015/16

Equity and liabilities
in € thousand Note 9/30/2016 9/30/2015
Subscribed capital 24 115,089 115,089
Additional paid-in capital 24 343,032 343,032
Generated Group earnings 24 1,520,781 1,523,444
Accumulated other comprehensive income components 24 9,465 (15,764)
Equity attributable to shareholders of Aurubis AG 1,988,367 1,965,801
Non-controlling interests 24 2,769 2,778
Equity 1,991,136 1,968,579
Pension provisions and similar obligations 26 322,000 221,772
Other non-current provisions 27 64,038 59,751
Deferred tax liabilities 25 150,847 182,986
Non-current borrowings 28 337,112 480,678
Other non-current financial liabilities 28 18,788 27,616
Non-current non-financial liabilities 28 1,201 1,179
Non-current liabilities 893,986 973,982
Current provisions 27 32,310 34,749
Trade accounts payable 28 797,710 761,409
Income tax liabilities 28 4,522 53,926
Current borrowings 28 158,131 25,421
Other current financial liabilities 28 109,756 187,024
Other current non-financial liabilities 28 39,426 39,495
Current liabilities 1,141,855 1,102,024
Total liabilities 4,026,977 4,044,585
¤ T 029
Consolidated Financial Statements 115
Aurubis Annual Report 2015/16
192 Responsibility Statement193 Auditors’ Report
112 Consolidated Income Statement1 13 Consolidated Statement of
Comprehensive Income114 Consolidated Statement of
Financial Position
116 Consolidated Cash Flow Statement117 Consolidated Statement of
Changes in Equity118 Notes to the Consolidated
Financial Statements

Consolidated Cash Flow Statementfor the period from October 1 to September 30 (IFRS)
in € thousand Note12 months
2015/1612 months
2014/15
Earnings before taxes 158,815 169,444
Depreciation and amortization of fixed assets 7 134,803 136,406
Change in allowances on receivables and other assets 1,994 391
Change in non-current provisions 2,180 (2,486)
Net losses on disposal of fixed assets 909 2,714
Measurement of derivatives (39,672) 16,149
Other non-cash items 17 (2,530) 0
Financial result 15,440 30,048
Income taxes received/paid (98,641) (46,355)
Change in receivables and other assets 88,790 59,000
Change in inventories (including measurement effects) (68,009) 92,633
Change in current provisions (2,364) 2,360
Change in liabilities (excluding financial liabilities) 44,547 (95,397)
Cash inflow from operating activities (net cash flow) 236,262 364,907
Payments for investments in fixed assets (143,143) (111,747)
Proceeds from the disposal of fixed assets 8,530 346
Interest received 2,868 3,567
Dividends received 11, 19 3,865 4,174
Cash outflow from investing activities (127,880) (103,660)
Proceeds deriving from the take-up of financial liabilities 42,029 486,935
Payments for the redemption of bonds and financial liabilities (54,891) (413,648)
Interest paid (14,806) (23,262)
Dividends paid 24 (61,780) (46,496)
Cash outflow (cash inflow in the prior year) from financing activities (89,448) 3,529
Net change in cash and cash equivalents 18,934 264,776
Changes resulting from movements in exchange rates (31) 913
Cash and cash equivalents at beginning of period 452,971 187,282
Cash and cash equivalents at end of period 471,874 452,971
Explanations relating to the Consolidated Cash Flow Statement are provided on p. 179 of the Notes to the Consolidated Financial Statements.
¤ T 030
116 Consolidated Cash Flow Statement
Aurubis Annual Report 2015/16

Consolidated Statement of Changes in Equity
Accumulated other comprehensive income components 1)
in € thousandSubscribed
capital
Additional paid-in capital
Generated Group equity
Measure-ment at
market of cash flow
hedges
Measure-ment at
market of financial
assets
Currency translation differences
Income taxes
Equity attribut-
able to Aurubis AG
share-holders
Non- controlling
interestsTotal
equity
Balance as at 9/30/2014 115,089 343,032 1,424,185 (21,805) 1,585 7,910 4,781 1,874,777 3,069 1,877,846
Dividend payment 0 0 (44,957) 0 0 0 0 (44,957) (1,539) (46,496)
Consolidated total comprehensive income/(loss) 0 0 144,216 (12,189) (1,585) 3,778 1,761 135,981 1,248 137,229
of which consolidated net income 0 0 132,435 0 0 0 0 132,435 1,133 133,568
of which other compre-hensive income/(loss) 0 0 11,781 (12,189) (1,585) 3,778 1,761 3,546 115 3,661
Balance as at 9/30/2015 115,089 343,032 1,523,444 (33,994) 0 11,688 6,542 1,965,801 2,778 1,968,579
Balance as at 9/30/2015 115,089 343,032 1,523,444 (33,994) 0 11,688 6,542 1,965,801 2,778 1,968,579
Dividend payment 0 0 (60,692) 0 0 0 0 (60,692) (1,088) (61,780)
Consolidated total comprehensive income/(loss) 0 0 58,029 28,050 5,092 (1,127) (6,786) 83,258 1,079 84,337
of which consolidated net income 0 0 121,852 0 0 0 0 121,852 1,667 123,519
of which other compre-hensive income/(loss) 0 0 (63,823) 28,050 5,092 (1,127) (6,786) (38,594) (588) (39,182)
Balance as at 9/30/2016 115,089 343,032 1,520,781 (5,944) 5,092 10,561 (244) 1,988,367 2,769 1,991,1361) The items included here will be reclassified to profit or loss in the future. The explanations relating to equity are provided in Note 24 to the Consolidated Financial Statements
¤ T 031
112 Consolidated Income Statement1 13 Consolidated Statement of
Comprehensive Income114 Consolidated Statement of
Financial Position
Consolidated Financial Statements 117
Aurubis Annual Report 2015/16
192 Responsibility Statement193 Auditors’ Report
116 Consolidated Cash Flow Statement117 Consolidated Statement of
Changes in Equity118 Notes to the Consolidated
Financial Statements

Notes to the Consolidated Financial Statements
General disclosures
Aurubis AG is a quoted corporate entity with a registered office in Germany.
As required by Regulation (EC) No. 1606/2002 of the European Parliament and the Council dated July 19, 2002 on the application of international accounting standards and Section 315a (1) of the German Commercial Code (HGB), the accompanying consolidated financial statements as at September 30, 2016 have been prepared in accordance with the International Financial Reporting Standards (IFRS) approved and published by the International Accounting Standards Board (IASB), as adopted by the European Union. The interpretations of the International Financial Reporting Interpretations Committee (IFRIC) have been taken into account.
The Supervisory Board released the consolidated financial statements for publication after they were approved on December 13, 2016.
The consolidated financial statements have been prepared in euros. If nothing to the contrary is indicated, all amounts are shown in thousands of currency units.
Current and non-current assets and liabilities are presented as separate categories in the statement of financial position. In this context, current assets and current liabilities are expected to be realized within 12 months of the balance sheet date or are held primarily for trading purposes.
During the reporting year, smaller adjustments were made in the presentation/classification of items in the statement of financial position. This mainly concerned the recognition of income tax receivables as “Other current non-financial assets”. The separate disclosure of income tax receivables has been discontinued as the related amounts are immaterial. In a similar manner, a more detailed analysis of financial fixed assets is no longer provided as these primarily comprise fixed asset securities. Furthermore, non-current
financial liabilities are now disclosed as two separate reporting lines, “Non-current borrowings” and “Other non-current financial liabilities”. This is consistent with the presentation of current liabilities. In addition, this also allows the total amount of borrowings to be directly determined from the statement of financial position.
As a general rule, assets and liabilities have been measured at amortized acquisition or construction cost. Derivative financial instruments, investment property and “available-for-sale” financial assets are measured at fair value.
The preparation of consolidated financial statements in accordance with IFRS furthermore requires the Executive Board and authorized employees to make estimates and assumptions in significant areas that have an impact on the measurement and reported amount of the assets and liabilities in the statement of financial position, and on related income and expenses.
Sectors which particularly require the application of estimates and assumptions are presented under “Main estimates and assumptions” on page 129.
This report may include slight deviations in the totals due to rounding.
Significant accounting principles
Scope of consolidationAs in the previous fiscal year, in addition to the parent company, Aurubis AG, Hamburg, 22 further companies in which Aurubis AG, Hamburg, holds the majority of the voting rights either directly or indirectly, and thus has control, were included in the consolidated financial statements as at the balance sheet date by way of full consolidation. The consolidated balance sheet date corresponds to the balance sheet date of Aurubis AG, Hamburg, and all consolidated subsidiaries, with the exception of three consolidated companies, whose balance sheet date is December 31. Interim financial
118 Notes to the Consolidated Financial Statements
Aurubis Annual Report 2015/16

statements were prepared by these companies as at the consolidated balance sheet date for consolidation purposes.
Accordingly, the financial statements of all significant subsidiaries which Aurubis AG controls are included in these consolidated financial statements.
Schwermetall Halbzeugwerk GmbH & Co. KG, Stolberg, a producer of pre-rolled strip, has been accounted for using the equity method in accordance with IFRS 11.24 in conjunction with IAS 28. A 50 % investment is held in this entity, which is managed jointly with another partner (joint venture).
Consolidation principlesThe separate financial statements of all companies included in consolidation are prepared in accordance with the uniform accounting policies that are applied within the Aurubis Group. The financial statements of the main companies included in the consolidated financial statements have been audited by independent auditors.
Capital consolidation is performed as at the acquisition date using the acquisition method, whereby the acquisition cost of the acquired interest is offset against the fair values of acquired assets and liabilities of the subsidiary at that time. Any unallocated difference on the asset side is recognized as goodwill and tested at least annually for impairment. In accordance with IAS 36, goodwill is not amortized on a scheduled basis. Negative goodwill is recognized immediately in profit or loss following a reassessment of the fair values.
Receivables, liabilities and contingent liabilities, and revenues, other income and expenses between group companies are eliminated. Profits resulting from transactions between group companies are eliminated, if material.
In addition to eight German companies, 15 foreign companies are included in the consolidated financial statements. In accordance with the functional currency concept, the financial statements of subsidiaries prepared in foreign currencies were translated into euros, as the euro is Aurubis AG’s reporting currency. Transactions in foreign currencies are converted into the functional currency at the exchange rate at the time of the transaction or, in the case of subsequent measurement, at the time of such measurement. Foreign currency transactions are primarily designated in US dollars. The average US dollar exchange rate during fiscal year 2015/16 was 1.11091 US$/€. The exchange rate as at September 30, 2016 was 1.1161 US$/€. Gains and losses resulting from the fulfillment of such transactions as well as from the conversion of monetary assets and liabilities designated in a foreign currency as at the balance sheet date are recorded in profit and loss in the cost of materials unless they have to be accounted for in equity as qualified cash flow hedges or net investments in foreign business operations. In fiscal year 2015/16, foreign currency conversion differences totaling € 1.9 million (net) were recognized as an expense. In accordance with IAS 21, assets and liabilities in the balance sheets of subsidiaries reporting in a foreign currency are translated at the mid-market rates on the balance sheet date and the income statement is translated at the average rates for the fiscal year. Any resultant translation differences are recognized directly in equity until the possible disposal of the subsidiary.
Joint ventures are accounted for in accordance with IFRS 11 using the equity method. Profits deriving from upstream/downstream transactions with Group companies are eliminated proportionally.
Recognition of revenues Revenues are mainly generated from the sale of metals and copper products. The revenues are recognized when control and the significant risks and rewards of ownership of the goods are transferred to the customer if the amount of revenues can be reliably determined and the economic benefit deriving from the transaction is probable. Bonuses granted in the fiscal year are deducted from revenues.
112 Consolidated Income Statement1 13 Consolidated Statement of
Comprehensive Income114 Consolidated Statement of
Financial Position
116 Consolidated Cash Flow Statement117 Consolidated Statement of
Changes in Equity118 Notes to the Consolidated
Financial Statements
Consolidated Financial Statements 119
Aurubis Annual Report 2015/16
192 Responsibility Statement193 Auditors’ Report

Financial instrumentsA financial instrument is a contract that simultaneously gives rise to a financial asset of one entity and a financial liability or equity instrument of another entity.
In this connection, financial assets particularly comprise cash and cash equivalents, equity instruments held in other entities (e.g. investments or share portfolios), trade accounts receivable, other loans and receivables granted, and primary and derivative financial instruments that are held for trading. Financial liabilities generally establish a contractual obligation to deliver cash or other financial assets. These include in particular bonds and other securitized liabilities, liabilities to banks, trade accounts payable, finance lease liabilities and derivative financial instruments. Within the Group, regular way purchases and sales of primary financial instruments are generally recorded as of the settlement date, i.e. at the date of delivery and transfer of title. Derivative financial instruments are recognized as of the trade date. Financial assets and financial liabilities are generally reported gross (i.e. without being netted).
Financial assets are recognized if Aurubis has a contractual right to receive cash and cash equivalents or other financial assets from another company. Financial assets are always recognized initially at fair value. Thereby, in the case of financial assets that will not be measured subsequently at fair value through profit or loss, the transaction costs directly attributable to the purchase have to be taken into account. The fair values recognized in the statement of financial position represent the market prices of the financial assets to the extent that these can be determined directly by reference to an active market. Otherwise, they are measured using normal market procedures (valuation models), applying the market parameters specific to the instrument. Non- interest-bearing financial assets with a term exceeding one year are discounted. For financial assets with a residual term of less than one year, it is assumed that the fair value corresponds to the nominal value. Financial assets designated in foreign currency are measured on initial recognition with the valid rate applicable at the date of the transaction and as at the balance sheet date with the mid-market rate as at the balance sheet date. Financial assets are derecognized if the contractual rights to
payments from the financial assets no longer exist or all opportunities and risks are essentially transferred. Any financial assets sold without recourse were derecognized.
The non-current receivables reported as “Other financial fixed assets” are assigned to the category “loans and receivables” and, if significant, are measured at amortized cost, applying the effective interest method.
On account of their short terms to maturity, trade accounts receivable are measured at nominal value, less allowances for doubtful debts. The allowances take adequate account of credit default risks, which are determined on the basis of past experience and individual assessments of the risks. Actual defaults result in derecognition of the receivables affected.
Impairment losses relating to trade accounts receivable are recorded in an allowance account. The decision as to whether a credit default risk is recorded using an allowance account or through direct reduction of the receivables depends on how reliable the assessment of the risk situation is.
Financial assets held for trading are measured at fair value. These include derivative financial instruments that are not included in an effective hedging relationship in accordance with IAS 39 and therefore have to be classified as “held for trading”.
In addition, delivery contracts are concluded in the Aurubis Group for non-ferrous metals to cover the expected requirement for raw materials and also for the sale of finished products. In the process, physical delivery contracts may be terminated by making compensation payments due to changes in demand. Price-fixed metal delivery contracts are therefore also recognized as derivative financial instruments. Since these are not included in an effective hedging relationship in accordance with IAS 39, they are similarly classified as “held for trading”.
Gains or losses resulting from the subsequent measurement of “held for trading” financial assets are recognized in profit or loss.
120 Notes to the Consolidated Financial Statements
Aurubis Annual Report 2015/16

Other financial assets are allocated to the category “loans and receivables” and, to the extent that they are non-current, are measured at amortized cost, applying the effective interest method.
Cash and cash equivalents have a remaining term on initial recognition of up to three months and are measured at nominal value.
Within the Aurubis Group, the “available-for-sale” category represents the residual amount of primary financial assets that fall under IAS 39 and are not assigned to another category. They include the interests in affiliated companies that are reported under financial fixed assets, other investments and securities classified as fixed assets. They are generally measured at fair value, which is derived from the stock market price, provided a price quoted in an active market is available. Subsequent gains and losses resulting from measurement at fair value are recognized in equity as a component of other comprehensive income. This does not apply if these are permanent or significant impairment losses and also if these are foreign-currency-related changes in the value of debt instruments, which are recognized in profit or loss. The accumulated gains or losses deriving from measurement at fair value that are recorded as a component of other comprehensive income are only recognized in profit or loss upon disposal of the financial assets. If the fair value of non-quoted equity instruments cannot be reliably determined, the interests are measured at acquisition cost (net of impairment losses, if appropriate).
No financial instruments were reclassified into other measurement categories either in fiscal year 2015/16 or in fiscal year 2014/15.
Within the Aurubis Group, an impairment loss is recognized if the carrying amount of a financial asset is higher than the present value of the future cash flows. The test of whether impairment exists is carried out at every balance sheet date. Indications such as considerable financial problems on the part of the debtor are taken into account in order to determine objectively whether evidence of impairment exists.
In order to resolve the question of impairment, the existing credit relationships that are assigned to the category “loans and receivables” need to be analyzed and then measured subsequently at amortized cost. At every balance sheet date, an investigation is required in order to assess whether there are objective indications of impairment that should be recognized in the financial statements. The amount of the loss is calculated as the difference between the carrying amount of the asset and the present value of the expected future cash flows, discounted with the original effective interest rate of the financial instrument (recoverable amount). In this connection, for the sake of simplicity, cash flows from short-term receivables are not discounted. The carrying amount of the asset is reduced to the recoverable amount by means of a direct write-down or by using an allowance account and the reduction is recognized in profit or loss.
For equity instruments of the “available-for-sale” category, an impairment loss is recognized if there are considerable adverse changes in the issuer’s environment or the fair value is significantly lower than the original cost for a long period. The loss is determined as the difference between the current fair value and the carrying amount of the financial instrument. While reversals of impairment losses on debt instruments are to be recognized in profit or loss, in the case of equity instruments they may only be recognized in equity.
Financial liabilities are recognized if there is a contractual obligation to transfer cash and cash equivalents or other financial assets to another company. Financial liabilities are always initially recognized at fair value. The directly attributable transaction costs are also deducted for all financial liabilities that are not subsequently measured at fair value and are amortized over the term of the liability applying the effective interest method. Financial liabilities denominated in foreign currency are measured on initial recognition with the valid rate applicable at the date of the transaction and as at the balance sheet date with the mid-market rate.
112 Consolidated Income Statement1 13 Consolidated Statement of
Comprehensive Income114 Consolidated Statement of
Financial Position
116 Consolidated Cash Flow Statement117 Consolidated Statement of
Changes in Equity118 Notes to the Consolidated
Financial Statements
Consolidated Financial Statements 121
Aurubis Annual Report 2015/16
192 Responsibility Statement193 Auditors’ Report

Primary financial liabilities, which include borrowings, trade accounts payable and other primary financial liabilities, are generally measured at amortized cost. If the interest effect is not insignificant, non-interest-bearing liabilities, or liabilities bearing low interest rates, with a residual term exceeding one year, are discounted. In the case of liabilities with a residual term of less than a year, it is assumed that the fair value corresponds to the settlement amount.
Liabilities under finance leases are recognized on inception of the lease at the lower of the present value of the leasing payments and the fair value of the leased asset. In subsequent periods, the redemption portions included in the leasing payments reduce the corresponding liabilities.
Derivative financial instruments that are not included in effective hedging relationships must be classified as “held-for-trading” and therefore recognized at fair value through profit and loss. Negative amounts result in the recognition of a financial liability.
The Aurubis Group uses derivative financial instruments to hedge interest rate and foreign currency risks and to hedge commodity price risks.
Derivative financial instruments are measured at fair value. This represents the market value and can be both positive and negative. If the market value is not available, the fair value is calculated utilizing present value and option price models. As far as possible, relevant market prices and interest rates observed at the balance sheet date, which are derived from recognized sources, are used as the opening parameters for these models.
Changes in the fair values of derivative financial instruments are recognized either through profit or loss in the income statement or in equity as a component of other comprehensive income. The decisive factor hereby is whether or not the derivative financial instrument is
included in an effective hedging relationship. If no cash flow hedge accounting relationship exists, the changes in fair values are to be recognized immediately in profit or loss. If, on the other hand, an effective hedging relationship exists, such changes will be recognized in equity as a component of other comprehensive income.
In order to avoid fluctuations in the income statement due to the different measurement of hedged items and hedging instruments, IAS 39 includes special regulations relating to hedge accounting. The aim of these hedge accounting regulations is to record gains and losses on hedging instruments and hedged items so that they compensate one another as far as possible.
In addition to documentation, as a prerequisite for the application of the regulations of hedge accounting, IAS 39 requires proof of an effective hedging relationship. Hedge effectiveness means that changes in fair value (for fair value hedges) or changes in cash flow (for cash flow hedges) of the hedged items are compensated by changes in the opposite direction in the fair value or by changes in the cash flows of the hedging instruments, in each case relating to the hedged risk.
The purpose of derivatives that are used as hedging instruments in conjunction with a cash flow hedge is to hedge future cash flows. A risk with regard to the amount of future cash flows exists in particular for loans at floating interest rates and planned transactions that are highly likely to occur. Derivative financial instruments used in conjunction with cash flow hedge accounting are recognized at fair value. The gain or loss on measurement is split between an effective and an ineffective portion. The effective portion is the portion of the gain or loss on measurement that represents an effective hedge of the cash flow risk. This is recognized directly in equity under a special heading (cash flow hedge reserve), after taking deferred taxes into account. The ineffective portion deriving from measurement is recognized on the other hand in profit or loss in the income statement.
122 Notes to the Consolidated Financial Statements
Aurubis Annual Report 2015/16

The general accounting rules applicable to the transactions underlying the hedged cash flows remain unchanged. Following the termination of the hedging relationship, the amounts recorded in the reserve are always transferred to the income statement when gains or losses in connection with the hedged item are recognized in profit or loss or when the underlying transaction is not actually expected to occur anymore.
The Aurubis Group furthermore enters into hedging relationships that do not satisfy the strict requirements of IAS 39 and cannot therefore be accounted for in accordance with the hedge accounting regulations. Nevertheless, from an economic point of view, these hedging relationships comply with the principles of risk management. Moreover, hedge accounting is also not applied in the case of the monetary assets and liabilities recognized in connection with foreign currency hedging, because the foreign currency translation gains and losses on the hedged items that need to be realized in profit or loss in accordance with IAS 21 are accompanied by gains and losses on the derivative hedging instruments and more or less compensate one another in the income statement.
Financial assets and financial liabilities that fall under the scope of IAS 39 could under certain circumstances be allocated irrevocably to the subcategory “fair value option” upon initial recognition. The Aurubis Group has not made use of the fair value option either for financial assets or for financial liabilities.
The fair value of financial instruments is determined pursuant to the regulations of IFRS 13 covering measurement at fair value. The fair value of financial instruments quoted in active markets is calculated based on the price quotation insofar as these are prices used in routine and current transactions. Where no prices quoted in active markets are available, the Aurubis Group uses measurement procedures to determine the fair value of financial instruments. Consequently, the input parameters applied in measurement procedures are based where
possible on observable data derived from the prices of relevant financial instruments traded in active markets. The use of these measurement procedures requires estimates and assumptions on the part of the Aurubis Group, the scope of which depends on the price transparency of the financial instrument and its market, and the complexity of the instrument. Management regularly analyzes the methods and influencing factors used to determine the fair value to ensure that they are appropriate. Additional information about the main estimates and assumptions used to determine the fair value can be found in the section “Additional disclosures on financial instruments”.
Intangible assetsIf intangible assets are acquired, they are recognized at acquisition cost. Internally generated intangible assets that provide future economic benefits are recognized at their cost of generation if the criteria for their recognition as an asset are fulfilled. They are amortized on a scheduled straight-line basis over their expected useful lives of generally three years. With the exception of goodwill, the consolidated financial statements do not include any intangible assets with indefinite useful lives.
Property, plant and equipmentItems of property, plant and equipment used in the business operations for more than one year are measured at acquisition or construction cost less scheduled depreciation. Such assets also include spare parts and maintenance equipment used for more than one period. Technical minimum stocks are recognized as components of the respective technical equipment and machinery. These stocks are quantities of materials that contain metals and are necessary to establish and ensure a production facility’s functionality for its intended use. Minimum stocks are not subject to scheduled depreciation, as they do not deteriorate or age.
112 Consolidated Income Statement1 13 Consolidated Statement of
Comprehensive Income114 Consolidated Statement of
Financial Position
116 Consolidated Cash Flow Statement117 Consolidated Statement of
Changes in Equity118 Notes to the Consolidated
Financial Statements
Consolidated Financial Statements 123
Aurubis Annual Report 2015/16
192 Responsibility Statement193 Auditors’ Report

Construction costs include all costs that can be directly atttributed to the asset. Borrowing costs that can be directly allocated to the purchase, construction or production of a qualifying asset are capitalized. Borrowing costs of € 138 thousand (previous year: € 125 thousand) were capitalized in the fiscal year reported, applying a respective financing cost rate of 2.7 % (previous year: 2.7 %). Scheduled depreciation is charged using the straight-line method. In this context, depreciation periods used correspond to the expected economic useful lives of the assets, as applicable within the Group. The following main useful lives are applied:
Buildings 25 to 40 years
Site installations 10 to 25 years
Technical equipment and machinery 5 to 20 years
Technical minimum stock unlimited useful life
Factory and office equipment 3 to 20 years
General overhauls or maintenance measures resulting in the replacement of components are recognized as an asset if it is probable that future economic benefits will flow to the Group and the costs can be measured reliably.
LeasingLeased items of property, plant and equipment that satisfy the criteria of IAS 17 for a finance lease are recognized as fixed assets. This is the case if all significant risks and rewards of economic ownership lie with the respective group company. Such items of property, plant and equipment are recognized at fair value or, if lower, at the present value of the minimum lease payments, and are depreciated using the straight-line method over the lease term or, if it is expected that ownership will be obtained at the end of the lease term, over the economic useful life of the respective assets. The future lease installment payment obligations are recognized as a liability at their present value or current market value. The lease installment is divided into an interest component and a repayment component, to ensure that the lease liability bears interest at a constant rate. The non-current part of the net leasing obligation is
recorded under non-current financial liabilities and the current part is recorded under current financial liabilities. The interest component of the leasing rate is recognized in the income statement, leading to a constant interest charge over the term of the leasing agreement.
Investment propertyInvestment property is property that is held for the purpose of earning rental income and/or increasing value, and not for producing or delivering goods, performing services or carrying out administrative tasks; or it is held to be sold by the company in the course of its usual business activities.
Aurubis’ investment property represents a property site consisting of land and buildimgs belonging to Aurubis Switzerland, SA. The real estate is accounted for at its fair value.
Impairment of non-financial assetsIntangible assets that have an indefinite useful life, such as goodwill, are not amortized on a scheduled basis, but are subjected to an annual impairment test. Furthermore, an assessment is made at every balance sheet date to determine whether there are any indications that the asset could be impaired. In the same way, items of property, plant and equipment are tested for impairment if there are any indications of such impairment.
Since the metals contained in the minimum stock can be recovered and the utilization potential of the minimum stock is not subject to wear and tear as it is not used in the production process, an unlimited useful life is assumed. The minimum stocks are therefore not amortized on a scheduled basis but are instead tested for impairment in conjunction with the respective production facilities if there are any indications of such impairment.
Assets that are amortized on a scheduled basis are tested for impairment if events or changes in circumstances indicate that the carrying amount might not be recoverable. Impairment losses are recorded in the amount by which the carrying amount exceeds the recoverable amount. The recoverable amount is the higher of the fair value of the asset less costs to sell and its value in use. For impairment
¤ T 032
124 Notes to the Consolidated Financial Statements
Aurubis Annual Report 2015/16

tests, assets are combined at the lowest level for which cash flows can be separately identified (so-called cash-generating units). With the exception of goodwill, non-monetary assets on which impairment losses were recognized in the past are reviewed as at each balance sheet date to ascertain whether the impairment losses possibly need to be reversed.
InventoriesInventories are measured at acquisition or production cost. Production cost includes all direct costs as well as a systematically allocated share of the production-related overheads.
The acquisition costs of copper concentrates and raw materials for recycling are determined by deducting the treatment and refining charges negotiated with the supplier from the purchase value of the metal. Treatment and refining charges are fees that are charged for processing ore concentrates and raw materials for recycling into copper and precious metals.
In the smelters, work in process is measured by initially measuring the metal content. The equivalent cost of the processing that is still required for production of the fine metal is deducted from this figure. In this manner, the costs incurred during the production process are successively recognized as a component of the total production cost. This procedure applies to the production of copper and precious metals.
In the case of copper products, both the metal components and the costs incurred for further processing the copper into special formats – such as continuous cast rod, shapes and rolled products – are taken into consideration for the measurement of finished goods by applying a calculated surcharge.
Inventories are measured using the average cost method in accordance with IAS 2. This is recognized as at the reporting date at the lower of cost and net realizable value. Net realizable value is determined on the basis of quoted commodity exchange or market prices as at the balance sheet date.
Assets held for saleA non-current asset is classified as held for sale if the corresponding carrying amount is mainly realizable through a sales transaction and a sale is highly likely. Assets held for sale are measured at the lower of the carrying amount and fair value less costs to sell. If the criteria for classifying an asset as held for sale no longer apply, it is returned to fixed assets at the lower value of its amortized cost and the recoverable amount.
In the previous year, the statement of financial position included non-current assets held for sale amounting to € 5,955 thousand.
Other non-financial assetsOther non-financial assets are recognized at amortized cost. Write-downs are made to the extent that the non-financial assets are at risk.
Income taxesThe tax expense of a period is made up of current and deferred taxes. Taxes are recognized in the income statement unless they are related to items that were recognized as a component of other comprehensive income. In this case, the taxes are also recognized as a component of other comprehensive income.
The Aurubis Group companies are subject to taxation in many countries around the world. The actual tax expense is calculated by applying the tax regulations of the individual countries that are applicable as at the balance sheet date.
Deferred taxes result from temporary differences between the tax- related carrying amounts of assets and liabilities and those taken into account in the IFRS financial statements as well as from tax loss carryforwards. They are calculated using the balance sheet-oriented liability method by applying the tax rates expected in the individual countries at the time of realization. These rates are generally based on legislation that has been enacted, or substantially enacted, as of the balance sheet date and which are expected to be applicable at the time of realization of the deferred tax receivable or the settlement of the deferred tax liability.
112 Consolidated Income Statement1 13 Consolidated Statement of
Comprehensive Income114 Consolidated Statement of
Financial Position
116 Consolidated Cash Flow Statement117 Consolidated Statement of
Changes in Equity118 Notes to the Consolidated
Financial Statements
Consolidated Financial Statements 125
Aurubis Annual Report 2015/16
192 Responsibility Statement193 Auditors’ Report

Deferred tax assets deriving from temporary differences, tax loss carryforwards and tax credits are recognized by the respective company entities to the extent that deferred tax liabilities exist. If deferred tax assets exceed deferred tax liabilities, they are recognized to the extent that it is probable that sufficient taxable income will be available in the future to ensure the utilization of these tax assets. The recoverability of the recognized deferred taxes is reviewed on an individual basis each year.
Deferred tax liabilities that arise due to temporary differences in connection with investments in subsidiaries and associated companies are recognized unless the point in time for the reversal of the temporary differences can be determined by the Group and it is likely that the temporary differences will not reverse in the foreseeable future due to this determining influence.
Changes in deferred taxes in the balance sheet generally lead to deferred tax expense or income. If circumstances that entail a change in deferred taxes are recognized directly in equity or in other comprehensive income, the change in deferred taxes is also taken into account directly in equity or in other comprehensive income.
Deferred tax assets and deferred tax liabilities are offset if they relate to income taxes levied by the same taxation authority and they can be set off against each other.
ProvisionsProvisions for pension and similar obligations are determined in accordance with the projected unit credit method prescribed by IAS 19, based on actuarial reports. In this connection, the demographic assumptions applied, as well as expected salary and pension trends and the discount rate to be used, are determined on the basis of current estimates as of the balance sheet date. Accordingly, actuarial gains and losses can result from deviations between the actual parameters as at the balance sheet date and the assumptions used for the calculation. These actuarial results – as well as revenues from plan assets that are not included in net interest – are recognized immediately and completely as they arise and are disclosed as generated Group earnings in equity. Past service cost is recognized immediately as an expense.
To determine the net obligation deriving from defined benefit plans, the fair value of the plan assets is deducted from the present value of the pension obligations.
Other provisions are set up for all other uncertain obligations and risks of the Aurubis Group provided that a related obligation to third parties results from a past event, the settlement of which is expected to result in an outflow of cash resources, and the amount of which can be reliably estimated. If the effect of the time value of money is material, non-current provisions are recognized at their present value.
Other non-financial liabilitiesOther non-financial liabilities are recognized at amortized cost.
126 Notes to the Consolidated Financial Statements
Aurubis Annual Report 2015/16

Changes in accounting and measurement methods due to new standards and interpretations
The following standards which affected the Group were applied for the first time in fiscal year 2015/16.
Standards and interpretations applied for the first time
Standards/interpretations
Compulsory application in the EU
Adoption by EU Commission Impact
IAS 19
Amendments: Defined Benefit Plans: Employee Contributions
2/1/2015
12/17/2014
no impacts
Various Improvements to IFRS (2010–12) 2/1/2015 12/17/2014 no impacts
Various Improvements to IFRS (2011–13) 1/1/2015 12/18/2014 no impacts
¤ T 033
112 Consolidated Income Statement1 13 Consolidated Statement of
Comprehensive Income114 Consolidated Statement of
Financial Position
116 Consolidated Cash Flow Statement117 Consolidated Statement of
Changes in Equity118 Notes to the Consolidated
Financial Statements
Consolidated Financial Statements 127
Aurubis Annual Report 2015/16
192 Responsibility Statement193 Auditors’ Report

The following standards are to be applied to all fiscal years beginning after October 1, 2015. They were not adopted early in the consolidated financial statements.
Standards and interpretations not adopted early
Standards/interpretations
Compulsory application in the EU
Adoption by EU Commission Impact
IFRS 9
Financial Instruments – Classification and Measurement
1/1/2018
11/25/2016
Includes rules for classifying and measuring financial instruments depending on the business model as well as the cash flows of the financial instrument. Establishes the account-ing requirements relating to impairments of financial assets, in that not only incurred losses (the previous so-called incurred loss model) but also expected losses (the so-called expected loss model) are to be recorded. Defines hedge accounting requirements. The effects of IFRS 9 are currently being subjected to an impact analysis by the management. We do not expect any significant effects based on the status of the current investigations.
IFRS 15 Revenue from Contracts with Customers
1/1/2018 9/22/2016 Description of when and in what amount revenues should be recorded as well as an explanation of required disclosures in the notes to the financial statements. Determination of revenues based on a five-stage model that must be applied to all con-tracts with customers. The impacts of IFRS 15 are currently being subjected to an impact analysis by the management. As Aurubis mainly generates revenues from the sale of metals and copper products, we don’t expect any significant effects on the basis of our current understanding.
Various Improvements to IFRS (2012 – 2014) 1/1/2016 12/15/2015 no impacts
IAS 16 IAS 38
Amendments: Clarification of Acceptable Methods of Depreciation and Amortization
1/1/2016 12/2/2015 no impacts
IFRS 10 IAS 28
Amendments: Sales or contributions of assets between an investor and its associate/joint venture
open open being investigated by Management
IAS 1 Amendments: Disclosure Initiative 1/1/2016 12/18/2015 Clarifications on the materiality of the presentation and disclosure of information in IFRS financial statements. Standards on the presentation of subtotals, the structure of the notes to the financial statements and disclosures relating to accounting methods.
IFRS 16 Leases 1/1/2019 open This standard regulates the accounting treatment of leases. IFRS 16 replaces the previously applicable IAS 17 as well as three leasing-related interpretations. The application of IFRS 16 is compulsory for all companies using IFRS and is generally valid for all leases. As Aurubis is only required to apply IFRS 16 in fiscal year 2019/20, it is not currently possible to provide information about possible future impacts.
¤ T 034
128 Notes to the Consolidated Financial Statements
Aurubis Annual Report 2015/16

Main estimates and assumptionsAccounting and measurement in the consolidated financial statements are influenced by a large number of estimates and assumptions, which are based on past experience as well as additional factors, including expectations about future events. All estimates and assessments are subject to continuous review and re-evaluation. The use of estimates and assumptions is especially necessary in the following areas:
Impairment of goodwillGoodwill is tested for impairment at least annually in line with the accounting policies. In this context, the recoverable amount is calculated on the basis of the value in use (Note 15). The calculation of the value in use in particular requires estimates of the future cash flow on the basis of calculations made for planning purposes. The impairment test of the Aurubis Hamburg Copper Products cash-generating unit (CGU) resulted in no impairment of goodwill either in the current or past fiscal year. A 10 % reduction in the predicted cash flow or an increase of 0.5 percentage points in the WACC after taxes – from 5.7 % to 6.2 % – would also not result in the requirement to recognize any impairment losses.
Fair values in conjunction with business combinationsAcquired assets, liabilities and contingent liabilities are recognized with their fair values when accounting for business combinations. Discounted cash flow (DCF)-based procedures, whose results depend on assumed future cash flows and other assumptions, are often used in this context. The measurement of contingent liabilities depends significantly on the assumptions with respect to the future resource outflows and the probability of their occurrence.
Fair values of derivatives and other financial instrumentsThe fair values of financial instruments for which there are no quoted prices in an active market are determined on the basis of financial calculation procedures and are influenced by assumptions specific to the instrument. Estimates have a particularly significant influence when the fair value needs to be determined for financial instruments for which at least one significant parameter is not based on observable market data (Level 3 of the fair value hierarchy).
The selection and application of suitable parameters and assumptions require an assessment by management. Extrapolation and interpolation procedures have to be applied in particular when data are derived from uncommon market transactions.
Detailed information can be found in the section entitled “Additional disclosures on financial instruments” on page 170.
Accounting for inventoriesVarious estimates have to be made in connection with the accounting treatment of inventories. For example, individual estimation procedures are applied when quantifying inventories as well as in the determination of the metal yield content.
Pension provisions and other provisionsThe employees’ company pension scheme in the Aurubis Group includes both defined benefit and defined contribution commitments.
Obligations deriving from defined benefit pension plans are measured in accordance with actuarial procedures. These procedures are based on several actuarial assumptions, such as, for example, the assumed interest rate, expected remuneration and pension developments, employee fluctuations and life expectancy. For the purposes of determining the assumed interest rate, high-quality corporate bonds with commensurate terms and currencies are used as a source of reference. Deviations of the actual development from the assumptions at the beginning of the reporting period lead to remeasurement of the net liability.
When recognizing other provisions, assumptions are made with regard to the probability of the occurrence and the amount and timing of the outflow of resources, which by their nature are subject to uncertainty.
Other significant estimates relate to the determination of the useful lives of intangible assets and property, plant and equipment, the collectability of receivables and the measurement of inventory risks within inventories.
112 Consolidated Income Statement1 13 Consolidated Statement of
Comprehensive Income114 Consolidated Statement of
Financial Position
116 Consolidated Cash Flow Statement117 Consolidated Statement of
Changes in Equity118 Notes to the Consolidated
Financial Statements
Consolidated Financial Statements 129
Aurubis Annual Report 2015/16
192 Responsibility Statement193 Auditors’ Report

Notes to the income statement
1. Revenues
By product groups in € thousand 2015/16 2014/15
Continuous cast wire rod 3,318,489 3,944,808
Precious metals 2,375,531 2,391,651
Copper cathodes 1,689,657 2,275,680
Strip, profiles and shapes 1,121,388 1,272,393
Continuous cast products 653,388 720,309
Chemicals and other products 316,253 390,361
9,474,706 10,995,202
Certain prior-year figures have been adjusted.
A further breakdown of Aurubis Group revenues by Group segments is provided in the context of segment reporting.
2. Changes in inventories of finished goods and work in process
in € thousand 2015/16 2014/15
Finished goods (86,800) 76,178
Work in process 184,346 (60,897)
97,546 15,281
The changes in inventories in the year reported were mainly due to higher inventory volumes in the intermediate product sector.
3. Own work capitalizedOwn work capitalized of € 8,752 thousand (previous year: € 6,383 thousand) primarily includes production costs and purchased materials.
4. Other operating income
in € thousand 2015/16 2014/15
Cost reimbursements 22,910 23,446
Income from commissions and refunded freight payments 7,391 9,890
Damage claims and indemnities 9,134 2,325
Income from the reversal of provisions 502 2,621
Other income 17,864 21,467
57,801 59,749
5. Cost of materials
in € thousand 2015/16 2014/15
Raw materials, supplies and merchandise 8,352,990 9,764,655
Cost of purchased services 282,287 302,741
8,635,277 10,067,396
The cost of materials ratio, represented by the ratio of the cost of materials to revenues and changes in inventories, was 90.2 % (previous year: 91.4 %).
6. Personnel expenses and human resources
in € thousand 2015/16 2014/15
Wages and salaries 349,592 334,184
Social security, pension and other benefit expenses 98,992 97,111
448,584 431,295
¤ T 035
¤ T 036
¤ T 037
¤ T 038
¤ T 039
130 Notes to the Consolidated Financial Statements
Aurubis Annual Report 2015/16

The pension expenses primarily comprise allocations to the provisions for pensions.
The average number of employees in the Group during the year was as follows:
2015/16 2014/15
Blue collar 4,017 4,013
White collar 2,083 2,052
Trainees and apprentices 255 252
6,355 6,317
7. Depreciation and amortizationDepreciation and amortization for the Group on intangible assets and property, plant and equipment totaled € 134,803 thousand (previous year: € 136,406 thousand). This comprises depreciation of € 133,051 thousand (previous year: € 134,897 thousand) on property, plant and equipment and amortization of € 1,752 thousand (previous year: € 1,509 thousand) on intangible assets.
No impairment losses were recognized on intangible assets during the current or previous fiscal year.
Property, plant and equipment of € 2,648 thousand was written down in value in the previous year in connection with an event-triggered impairment test.
A breakdown of depreciation and amortization on intangible assets and property, plant and equipment is provided in the details of changes in the Group’s fixed assets (see Notes 15 and 16).
8. Other operating expenses
in € thousand 2015/16 2014/15
Selling expenses 100,476 104,930
Administrative expenses 83,544 77,019
Other taxes 2,703 3,008
Sundry operating expenses 56,599 57,280
243,322 242,237
The selling expenses mainly comprise freight costs.
9. Result from investments measured using the equity method The result from investments measured using the equity method in the amount of € 6,351 thousand (previous year: € 1,403 thousand) comprises the 50 % holding in Schwermetall Halbzeugwerk GmbH & Co. KG, Stolberg.
10. Interest
in € thousand 2015/16 2014/15
Interest income 2,868 3,591
Interest expense (27,373) (30,940)
(24,505) (27,349)
The interest income mainly derives from interest-bearing customer receivables.
The interest expense primarily results from Aurubis AG’s borrowings. Amongst other items, the interest expense includes the net interest from defined benefit plans amounting to € 5,470 thousand (previous year: € 5,621 thousand).
¤ T 040
¤ T 041
¤ T 042
112 Consolidated Income Statement1 13 Consolidated Statement of
Comprehensive Income114 Consolidated Statement of
Financial Position
116 Consolidated Cash Flow Statement117 Consolidated Statement of
Changes in Equity118 Notes to the Consolidated
Financial Statements
Consolidated Financial Statements 131
Aurubis Annual Report 2015/16
192 Responsibility Statement193 Auditors’ Report

11. Other financial result
in € thousand 2015/16 2014/15
Other financial income 257 225
Other financial expense (107) (4,116)
150 (3,891)
Other financial items during the fiscal year mainly derive from income from securities. Other financial items during the previous fiscal year mainly derived from impairment losses recognized against securities classified as fixed assets (see Note 18).
12. Income taxesIncome taxes comprise income taxes paid or owed and deferred taxes. Income tax expense including deferred taxes is made up as follows:
in € thousand 2015/16 2014/15
Current taxes 44,802 85,923
Deferred taxes (9,506) (50,047)
35,296 35,876
The tax expense includes a current tax credit of € 1,665 thousand relating to prior years (previous year: a current tax expense of € 616 thousand) as well as a deferred tax credit of € –626 thousand (deriving from corrections to the tax-based figures) relating to prior years (previous year: a deferred tax expense of € 647 thousand).
The recognition of corporate income tax credits and increases pursuant to Section 37 of the German Corporate Income Tax Act (KStG) resulted in net income of € 49 thousand in the year reported (previous year: € 72 thousand).
The deferred tax credit in the amount of € 9,506 thousand results from the change in temporary balance sheet differences as well as from tax loss carryforwards. The difference between the tax credit in the year reported and the tax credit in the previous year was influenced by inventory measurement differences.
Applicable German tax legislation for fiscal year 2015/16 foresees a statutory corporate income tax rate of 15 % (previous year: 15 %), plus a solidarity surcharge of 5.5 % (previous year: 5.5 %). The trade tax rate applicable for Aurubis AG amounts to 16.59 % (previous year: 16.59 %) of the respective taxable income. Trade tax rates of between 11.09 % and 17.33 % are applicable for the other German group companies (previous year: between 11.09 % and 17.33 %). The foreign companies are subject to their respective national income tax rates, which vary between 10 % and 35.98 % (previous year: 10 % and 35.98 %).
The Group taxes include tax effects from foreign subsidiaries to a significant degree. As a consequence, the tax rate of the German parent company (32.41 %; previous year: 32.41 %) is not applied, but a group-wide mixed tax rate of 23.07 % (previous year: 19.49 %) instead. The change in the average group tax rate results from significant changes in the distribution of the companies’ contributions to total earnings as compared to the prior year. As in the prior year, the main contributions to earnings come from Aurubis AG and Aurubis Bulgaria AD in roughly equal shares.
The disclosed income tax expense of € 35,296 thousand in fiscal year 2015/16 (previous year: € 35,876 thousand) was € 1,349 thousand higher (previous year: € 2,851 thousand lower) than the expected income tax expense of € 36,645 thousand (previous year: € 33,025 thousand). The difference between the expected and the disclosed income tax expense is due to the reasons outlined in the following reconciliation:
¤ T 043
¤ T 044
132 Notes to the Consolidated Financial Statements
Aurubis Annual Report 2015/16

Reconciliation
in € thousand 2015/16 2014/15
Earnings before taxes 158,815 169,444
Theoretical tax charge at 23.07 % (previous year: 19.49 %) 36,645 33,025
Changes in the theoretical tax charge due to:
– changes in tax rate 97 11
– non-recognition and correction of deferred taxes 2,804 2,944
– taxes for previous years (2,291) 1,263
– non-deductible expenses 2,751 5,352
– non-taxable income (240) (317)
– notional interest deduction (Belgium) (3,963) (6,274)
– outside basis differences (296) (76)
– effects deriving from consolidation of items using the equity method (233) (59)
– other 22 7
Income taxes 35,296 35,876
The effects totaling € 2,969 thousand deriving from the non-recognition of loss carryforwards mainly result from Aurubis Netherlands BV and Aurubis Switzerland SA. The remaining amount includes corrections from loss carryforwards not recognized in the previous year as well as adjustments to tax loss carryforwards and declining loss carryforwards in the current year.
The “notional interest deduction” is a special feature to be observed under Belgian tax law, which results in a lower assessment basis for the current taxes of Aurubis Belgium in the reporting period of € 11,660 thousand (previous year: € 18,459 thousand).
¤ T 045
112 Consolidated Income Statement1 13 Consolidated Statement of
Comprehensive Income114 Consolidated Statement of
Financial Position
116 Consolidated Cash Flow Statement117 Consolidated Statement of
Changes in Equity118 Notes to the Consolidated
Financial Statements
Consolidated Financial Statements 133
Aurubis Annual Report 2015/16
192 Responsibility Statement193 Auditors’ Report

The recognized deferred tax assets and deferred tax liabilities result from the following recognition and measurement differences in individual items in the statement of financial position, from tax loss carryforwards and from outside basis differences (OBD):
9/30/2016 9/30/2015
in € thousandDeferred tax
assetsDeferred tax
liabilitiesDeferred tax
assetsDeferred tax
l iabilities
Intangible assets 3,372 210 3,717 204
Property, plant and equipment 631 111,013 1,062 114,875
Financial fixed assets 2 345 2 0
Financial fixed assets accounted for using the equity method 149 2,471 31 2,429
Inventories 14,022 160,131 27,596 178,156
Receivables and other assets 2,261 22,079 779 42,422
Pension provisions 86,815 2,780 55,698 4,152
Other provisions 9,171 489 8,288 400
Liabilities 29,919 1,244 71,030 14,014
Tax loss carryforwards 14,646 0 14,494 0
Outside basis differences 0 655 0 951
Offsetting (150,570) (150,570) (174,617) (174,617)
Per consolidated statement of financial position 10,418 150,847 8,080 182,986
Altogether, € 16,283 thousand of the deferred tax assets (previous year: € 28,374 thousand) and € 182,210 thousand of the deferred tax liabilities (previous year: € 220,578 thousand) will be realized within the next 12 months. Deferred tax assets of € 144,705 thousand (previous year: € 154,323 thousand) and deferred tax liabilities of € 119,207 thousand (previous year: € 137,025 thousand) will be realized after more than 12 months. These figures represent the amounts prior to offsetting.
¤ T 046
134 Notes to the Consolidated Financial Statements
Aurubis Annual Report 2015/16

The following table shows the deferred and current taxes that directly decreased or increased the other comprehensive income (OCI) and accordingly equity:
9/30/2016 9/30/2015
in € thousand Balance Change Balance Change
Deferred taxes
Derivatives 1,651 (5,924) 7,575 1,683
Pension provisions 38,765 30,563 8,202 (5,556)
Total 40,416 24,639 15,777 (3,873)
Current taxes (1,895) (862) (1,033) 78
Currency differences (593) 293 (886) (254)
Furthermore, there were changes affecting net income, amounting to € 39 thousand (previous year: € 693 thousand) in the individual deferred tax positions of the foreign subsidiaries due to exchange rates.
Deferred tax assets are only recognized to the extent to which the respective benefits will probably be realized. Based on the forecast profit expectations of the subsidiaries, it is probable that the tax loss carryforwards will be utilized in conformity with IAS 12.34.
¤ T 047
Total tax loss carryforwards amounted to € 165,931 thousand (previous year: € 156,839 thousand). Deferred tax assets were recognized in respect of income tax losses of € 58,309 thousand (previous year: € 56,836 thousand), although some of the companies involved have a history of losses. In such cases, corresponding deferred tax liabilities existed, or these companies had positive future earnings forecasts.
No deferred tax assets were recognized in respect of trade tax loss carryforwards of € 107,621 thousand (previous year: € 100,003 thousand), as the possibility of utilizing them is believed to be unlikely from a current perspective. Of the tax loss carryforwards deemed not to be utilizable, an amount of € 31,806 thousand (previous year: € 33,363 thousand) can be carried forward indefinitely, an amount of € 22,771 thousand (previous year: € 26,395 thousand) can be utilized within the next seven years and an amount of € 53,044 thousand (previous year: € 40,246 thousand) can be utilized within the next nine years.
112 Consolidated Income Statement1 13 Consolidated Statement of
Comprehensive Income114 Consolidated Statement of
Financial Position
116 Consolidated Cash Flow Statement117 Consolidated Statement of
Changes in Equity118 Notes to the Consolidated
Financial Statements
Consolidated Financial Statements 135
Aurubis Annual Report 2015/16
192 Responsibility Statement193 Auditors’ Report

Deferred tax liabilities of € 655 thousand (previous year: € 951 thousand) were set up in respect of the differences between the proportional equity of subsidiaries recognized in the con solidated statement of financial position and the investment carrying amounts for these subsidiaries shown in the tax-based records of the respective parent company (so-called outside basis differences) as at the balance sheet date. No deferred tax liabilities were set up for outside basis differences deriving from undistributed earnings of subsidiaries, amounting to € 11,745 thousand (previous year: € 14,144 thousand), since the reversal of these differences is unlikely in the foreseeable future.
13. Income attributable to non-controlling interestsOf the reported consolidated net income for 2015/16 of € 123,519 thousand (previous year: € 133,568 thousand), a share of income of € 1,667 thousand (previous year: € 1,133 thousand) is attributable to shareholders other than the shareholders of Aurubis AG, Hamburg. This relates to the non-controlling interests in Deutsche Giessdraht GmbH, Emmerich, and Aurubis Bulgaria AD, Pirdop.
14. Earnings per shareBasic earnings per share are calculated by dividing the consolidated net earnings excluding the non-controlling interests by the weighted average number of shares outstanding during the fiscal year.
2015/16 2014/15
Consolidated net income attributable to Aurubis AG shareholders (in € thousand) 121,852 132,435
Weighted average number of shares (in thousand units) 44,957 44,957
Basic earnings per share in € 2.71 2.95
Diluted earnings per share in € 2.71 2.95
Diluted earnings per share are determined by augmenting the weighted average of the shares outstanding during the fiscal year to include the maximum number of shares that could have been issued if all conversion rights on convertible bonds had been exercised. Where applicable, the consolidated net income is increased at the same time by the interest expense incurred on convertible bonds less the corresponding taxes.
Since conversion rights on convertible bonds existed neither in the reporting year nor in the prior year, the diluted earnings per share for the Aurubis Group correspond to the basic earnings per share.
¤ T 048
136 Notes to the Consolidated Financial Statements
Aurubis Annual Report 2015/16

Notes to the statement of financial position
15. Intangible assetsThe development of the costs of acquisition or generation and the accumulated amortization and impairment-related write-downs of the intangible assets are as follows:
Costs of acquisition or generation
in € thousand 10/1/2015 Additions Disposals Transfers 9/30/2016
Intangible assets
Franchises, industrial property rights and licenses 103,849 1,068 (134) 1,019 105,802
Goodwill 43,170 0 0 0 43,170
Payments on account for intangible assets 1,086 1,526 1 (1,019) 1,594
148,105 2,594 (133) 0 150,566
Amortization and impairment losses
in € thousand 10/1/2015
Amorti zation and impairment
losses for the fiscal year Disposals Transfers 9/30/2016
Intangible assets
Franchises, industrial property rights and licenses (39,685) (1,752) 133 0 (41,304)
Goodwill (24,522) 0 0 0 (24,522)
Payments on account for intangible assets 0 0 0 0 0
(64,207) (1,752) 133 0 (65,826)
Carrying amount
in € thousand 9/30/2016 9/30/2015
Intangible assets
Franchises, industrial property rights and licenses 64,498 64,164
Goodwill 18,648 18,648
Payments on account for intangible assets 1,594 1,086
84,740 83,898
¤ T 049
¤ T 050
¤ T 051
112 Consolidated Income Statement1 13 Consolidated Statement of
Comprehensive Income114 Consolidated Statement of
Financial Position
116 Consolidated Cash Flow Statement117 Consolidated Statement of
Changes in Equity118 Notes to the Consolidated
Financial Statements
Consolidated Financial Statements 137
Aurubis Annual Report 2015/16
192 Responsibility Statement193 Auditors’ Report

Costs of acquisition or generation
in € thousand 10/1/2014 Additions Disposals Transfers 9/30/2015
Intangible assets
Franchises, industrial property rights and licenses 102,418 1,274 (645) 802 103,849
Goodwill 43,170 0 0 0 43,170
Payments on account for intangible assets 976 912 0 (802) 1,086
146,564 2,186 (645) 0 148,105
Amortization and impairment losses
in € thousand 10/1/2014
Amorti zation and impairment
losses for the fiscal year Disposals Transfers 9/30/2015
Intangible assets
Franchises, industrial property rights and licenses (38,714) (1,508) 537 0 (39,685)
Goodwill (24,522) 0 0 0 (24,522)
Payments on account for intangible assets 0 0 0 0 0
(63,236) (1,508) 537 0 (64,207)
Carrying amount
in € thousand 9/30/2015 9/30/2014
Intangible assets
Franchises, industrial property rights and licenses 64,164 63,704
Goodwill 18,648 18,648
Payments on account for intangible assets 1,086 976
83,898 83,328
¤ T 052
¤ T 053
¤ T 054
138 Notes to the Consolidated Financial Statements
Aurubis Annual Report 2015/16

Intangible assets comprise licenses acquired for a consideration, primarily in connection with a contribution made to the investment costs for a power plant, as well as goodwill on consolidation arising in the Aurubis Group. As in the prior year, most of the goodwill (€ 17,439 thousand) was attributable to the Aurubis Hamburg Copper Products cash-generating unit (CGU).
Aurubis carries out an impairment test on goodwill at least annually. For the impairment test on goodwill, the goodwill acquired in conjunction with a business combination is allocated to the CGU that is expected to benefit from the synergies of the business combination. If the carrying amount of the CGU to which the goodwill was allocated exceeds its recoverable amount, a commensurate impairment loss is recognized on the allocated goodwill.
As in the prior year, there was no requirement to recognize an impairment loss for the Aurubis Hamburg Copper Products CGU.
The recoverable amount is the higher of the fair value less costs to sell and the value in use. Aurubis determines the recoverable amount on the basis of the value in use. The value in use is determined by means of discounting future cash flows after taxes with a risk-adjusted discount rate (WACC) after taxes (discounted cash flow method).
The cash flow estimates cover a planning horizon of four years before transferring to perpetuity. The cash flows were established within the scope of a qualified planning process including use of internal company values based on past experience and extensive market knowledge, and they take into consideration management’s assessment and estimates regarding the future development of the regional market.
In addition to the weighted capital costs, the significant assumptions used to calculate the value in use were the forecast earnings trend and the sustainable growth rate of the terminal value at a level of 1 %.The growth rate was derived from future expectations and did not exceed the long-term average growth rates of the respective markets.
The WACC used for discounting purposes amounted to 5.7 % after taxes or 8.1 % before taxes as at September 30, 2016 (previous year: 6.5 % after taxes or 9.3 % before taxes).
As in the prior year, there was no requirement to recognize impairment losses on intangible assets with a limited useful life.
As in the prior year, no capitalized development costs were recognized in the Group as at September 30, 2016. Research costs were recognized in profit or loss for the respective periods (see Note 31).
112 Consolidated Income Statement1 13 Consolidated Statement of
Comprehensive Income114 Consolidated Statement of
Financial Position
116 Consolidated Cash Flow Statement117 Consolidated Statement of
Changes in Equity118 Notes to the Consolidated
Financial Statements
Consolidated Financial Statements 139
Aurubis Annual Report 2015/16
192 Responsibility Statement193 Auditors’ Report

16. Property, plant and equipmentThe acquisition or construction costs and the accumulated depreciation and impairment losses on property, plant and equipment are as follows:
Acquisition or construction cost
in € thousand 10/1/2015Exchange rate
differences Additions Disposals Transfers 9/30/2016
Property, plant and equipment
Land and buildings 625,463 (180) 14,277 (6,896) 17,844 650,508
Technical equipment and machinery 2,006,512 (265) 21,413 (72,391) 102,471 2,057,740
Other equipment, factory and office equipment 88,396 (47) 6,445 (4,591) 677 90,880
Leased assets 34,671 (1) 773 (765) 0 34,678
Payments on account for assets under construction 89,207 6 98,396 (24) (120,992) 66,593
2,844,249 (487) 141,304 (84,667) 0 2,900,399
Depreciation and impairment losses
in € thousand 10/1/2015Exchange rate
differences
Reversals of impairment
losses for the fiscal year
Depreciation and impairment
losses for the fiscal year Disposals Transfers 9/30/2016
Property, plant and equipment
Land and buildings (343,898) 172 0 (18,391) 6,548 (1,605) (357,174)
Technical equipment and machinery (1,135,109) 359 0 (104,915) 65,714 (448) (1,174,399)
Other equipment, factory and office equipment (61,836) 42 0 (7,835) 4,365 2,052 (63,212)
Leased assets (15,892) 0 0 (1,910) 764 1 (17,037)
Payments on account for assets under construction (432) 10 0 0 0 0 (422)
(1,557,167) 583 0 (133,051) 77,391 0 (1,612,244)
¤ T 055
¤ T 056
140 Notes to the Consolidated Financial Statements
Aurubis Annual Report 2015/16

Carrying amount
in € thousand 9/30/2016 9/30/2015
Property, plant and equipment
Land and buildings 293,334 281,565
Technical equipment and machinery 883,341 871,403
Other equipment, factory and office equipment 27,668 26,560
Leased assets 17,641 18,779
Payments on account for assets under construction 66,171 88,775
1,288,155 1,287,082
Technical equipment and machinery includes disposals of minimum stocks in the amount of € 6,072 thousand (net).
¤ T 057
112 Consolidated Income Statement1 13 Consolidated Statement of
Comprehensive Income114 Consolidated Statement of
Financial Position
116 Consolidated Cash Flow Statement117 Consolidated Statement of
Changes in Equity118 Notes to the Consolidated
Financial Statements
Consolidated Financial Statements 141
Aurubis Annual Report 2015/16
192 Responsibility Statement193 Auditors’ Report

Acquisition or construction cost
in € thousand 10/1/2014Exchange rate
differences Additions Disposals Transfers 9/30/2015
Property, plant and equipment
Land and buildings 620,855 1,855 7,886 (2,060) (3,073) 625,463
Technical equipment and machinery 1,950,927 4,997 37,658 (30,285) 43,215 2,006,512
Other equipment, factory and office equipment 84,277 532 6,460 (3,865) 992 88,396
Leased assets 34,783 0 0 (112) 0 34,671
Payments on account for assets under construction 70,671 229 70,935 (68) (52,560) 89,207
2,761,513 7,613 122,939 (36,390) (11,426) 2,844,249
Depreciation and impairment losses
in € thousand 10/1/2014Exchange rate
differences
Reversals of impairment
losses for the fiscal year
Depreciation and impairment
losses for the fiscal year Disposals Transfers 9/30/2015
Property, plant and equipment
Land and buildings (329,793) (114) 0 (21,201) 1,705 5,505 (343,898)
Technical equipment and machinery (1,052,254) (1,478) 0 (104,211) 22,834 0 (1,135,109)
Other equipment, factory and office equipment (57,633) (276) 0 (7,553) 3,626 0 (61,836)
Leased assets (14,071) 0 0 (1,932) 111 0 (15,892)
Payments on account for assets under construction (446) 14 0 0 0 0 (432)
(1,454,197) (1,854) 0 (134,897) 28,276 5,505 (1,557,167)
¤ T 058
¤ T 059
142 Notes to the Consolidated Financial Statements
Aurubis Annual Report 2015/16

Carrying amount
in € thousand 9/30/2015 9/30/2014
Property, plant and equipment
Land and buildings 281,565 291,062
Technical equipment and machinery 871,403 898,673
Other equipment, factory and office equipment 26,560 26,644
Leased assets 18,779 20,712
Payments on account for assets under construction 88,775 70,225
1,287,082 1,307,316
Depreciation and impairment losses in fiscal year 2015/16 do not include any impairment losses. In the previous year, impairment losses of € 2,648 thousand resulted from an impairment test at Aurubis Switzerland, SA, in relation to a property with buildings.
Rented or leased items of property, plant and equipment totaled € 17,641 thousand (previous year: € 18,779 thousand). The carrying amount of the leased facilities included carrying amounts of € 5,788 thousand (previous year: € 6,308 thousand) for ships used for transporting copper concentrates and sulfuric acid and carrying amounts of € 4,540 thousand (previous year: € 4,983 thousand) for the warehouse used for storing copper concentrates in Brunsbüttel. Some of the lease payments are adjusted annually based on the indexed price trend for industrial products. The lease agreements are mainly based on fixed rental arrangements. Collateral has not been provided for them.
No property, plant and equipment was pledged as security for loans within the Group as at September 30, 2016 and September 30, 2015. Purchase commitments for property, plant and equipment amounted to € 41,126 thousand as at September 30, 2016 (previous year: € 39,807 thousand).
Minimum stocks are recognized in technical equipment and machinery as components of the respective technical equipment and machinery. Minimum stocks are quantities of materials that are necessary to establish and ensure a production facility’s continuing functionality for its intended use. A total of € 291,381 thousand was attributable to the technical minimum stock as at September 30, 2016 (previous year: € 297,453 thousand).
17. Investment propertyAurubis’ investment property represents a property site with buildings belonging to Aurubis Switzerland, SA. The property was reclassified from the statement of financial position item Assets “held-for-sale” since it is located in a high-technology park and a sale within 12 months is considered unlikely.
The property is measured at its fair value. The fair value was determined by an external, independent and qualified real estate assessor applying RICS Valuation Professional Standards and amounted to € 8,515 thousand as at September 30, 2016 (previous year: € 5,955 thousand in Assets “held-for-sale”). The property was measured on the basis of the investment method, in which the potential market value is derived from capitalized net income (using comparable transactions). Due to the limited availability of market
¤ T 060
112 Consolidated Income Statement1 13 Consolidated Statement of
Comprehensive Income114 Consolidated Statement of
Financial Position
116 Consolidated Cash Flow Statement117 Consolidated Statement of
Changes in Equity118 Notes to the Consolidated
Financial Statements
Consolidated Financial Statements 143
Aurubis Annual Report 2015/16
192 Responsibility Statement193 Auditors’ Report

data and/or data and measurement parameters that aren’t directly observable on the market (such as market rents and rates of return), the fair value measurement of the investment property was classified as Level 3 in the measurement hierarchy according to IFRS 13.
The change in fair value led to a gain of € 2,530 thousand. This is included in the income statement in other operating income.
The following table shows the development in the carrying amount of investment property:
in € thousand 9/30/2016 9/30/2015
Status at 10/1 0 0
Transfers from assets “held-for-sale” 5,956 0
Gain from the change in fair value 2,530 0
Exchange rate changes 29 0
Status at 9/30 8,515 0
In the segment reporting, this real estate is disclosed in the Copper Products segment.
18. Financial fixed assets
in € thousand 9/30/2016 9/30/2015
Interests in affiliated companies 1,418 1,418
Investments 637 744
Other financial fixed assets 21,359 24,410
23,414 26,572
The interests in affiliated companies and investments included in the financial fixed assets in the amount of € 2,055 thousand (previous year: € 2,162 thousand) were classified as “available-for-sale”. In the fiscal year reported, all interests in affiliated companies were measured at amortized cost since it would only be possible to ascertain the market value reliably within the context of concrete sales negotiations. These interests are not quoted and there is no active market. There is no current intention to sell the interests.
An overview of the investments included in the financial assets of Aurubis AG, Hamburg, is presented at the end of this report.
Other financial fixed assets primarily include fixed asset securities, which mainly comprise investments in Salzgitter AG, Salzgitter.
19 . Investments accounted for using the equity methodSchwermetall Halbzeugwerk GmbH & Co. KG, Stolberg, is a joint venture in which Aurubis holds a 50 % interest. It is operated as a joint venture with a partner and is assigned to BU Copper Products. The business objective of the company is the fabrication and marketing of pre-rolled strip made of copper and copper alloys. Pursuant to IFRS 11.24, in conjunction with IAS 28, Schwermetall Halbzeugwerk GmbH & Co. KG is accounted for using the equity method.
The next two tables summarize the financial information of Schwermetall Halbzeugwerk GmbH & Co. KG in accordance with IFRS. Furthermore, the reconciliation of the summarized financial information to the investment carrying amount can be derived from the table. The financial information provided in the table represents the total figures for the Company (i.e. 100 %).
¤ T 061
¤ T 062
144 Notes to the Consolidated Financial Statements
Aurubis Annual Report 2015/16

Summarized statement of financial position
in € thousand 2015/16 2014/15
Current assets 106,106 113,693
of which: cash and cash equivalents 502 61
Non-current assets 48,736 49,963
Current liabilities 37,096 47,153
of which: current financial liabilities (with the exception of trade accounts payable and other liabilities and provisions) 16,257 30,789
Non-current liabilities 28,739 31,647
of which: non-current financial liabilities (with the exception of trade accounts payable and other liabilities and provisions) 19,838 24,510
Net assets 89,007 84,856
Proportional net assets (50 %) 44,504 42,428
Elimination of unrealized intra-Group profits 149 166
Effects deriving from the supplementary tax balance sheet 359 283
Carrying amount of the investment as at September 30, accounted for using the equity method 45,012 42,877
Summarized statement of comprehensive income
in € thousand 2015/16 2014/15
Revenues 315,635 304,466
Scheduled depreciation and amortization 5,360 5,176
Interest income 487 490
Interest expense 2,016 2,533
Income tax expense 2,957 284
Net income from continuing operations 12,841 2,650
Other comprehensive income/(loss) (1,490) (40)
Total comprehensive income 11,351 2,610
Proportional share of total comprehensive income (50 %) 5,676 1,305
Dividends received 3,600 3,950
¤ T 063
¤ T 064
112 Consolidated Income Statement1 13 Consolidated Statement of
Comprehensive Income114 Consolidated Statement of
Financial Position
116 Consolidated Cash Flow Statement117 Consolidated Statement of
Changes in Equity118 Notes to the Consolidated
Financial Statements
Consolidated Financial Statements 145
Aurubis Annual Report 2015/16
192 Responsibility Statement193 Auditors’ Report

Reconciliation of the combined financial information
in € thousand 2015/16 2014/15
Net assets as at 10/1 84,856 90,146
Profit/loss of the period 12,841 2,650
Other comprehensive income/(loss) (1,490) (40)
Distribution (7,200) (7,900)
Net assets on 9/30 89,007 84,856
Share of associated company (50 %) 44,504 42,428
Elimination of unrealized intra-Group profits 149 166
Effects deriving from the supplementary tax balance sheet 359 283
Carrying amount 45,012 42,877
20. Inventories
in € thousand 9/30/2016 9/30/2015
Raw materials and supplies 654,644 684,296
Work in process 634,927 444,390
Finished goods, merchandise 409,151 491,474
Payments on account of inventories 1,483 6,280
1,700,205 1,626,440
As at the balance sheet date, write-downs of € 13,605 thousand were recorded against inventories (previous year: € 116,101 thousand).
¤ T 065
¤ T 066
146 Notes to the Consolidated Financial Statements
Aurubis Annual Report 2015/16

21. Trade accounts receivableThe trade accounts receivable as at September 30, 2016 and as at September 30, 2015 were due within one year.
The age structure of the trade accounts receivable was as follows:
in € thousandCarrying
amount
thereof: neither impaired nor overdue as at
the balance sheet date
thereof: not impaired as at the balance sheet date and due in the following time bands
less than 30 days
between 30 and 180 days
more than 180 days
as at 9/30/2016
Trade accounts receivable 242,106 215,133 17,368 6,741 2,864
as at 9/30/2015
Trade accounts receivable 306,905 276,430 19,167 8,153 3,155
Movements on the allowances for trade accounts receivable that were not covered by commercial credit insurance were as follows:
in € thousand 9/30/2016 9/30/2015
Specific allowancesBalance as at 10/1 3,505 3,267
Change in allowances during the period (559) 238
Additions 98 265
Reversal (652) (26)
Transfers 0 0
Exchange rate impacts (5) (1)
Balance as at 9/30 2,946 3,505
¤ T 067
¤ T 068
All expenses and income deriving from allowances and write-offs of trade accounts receivable were shown respectively under other operating expenses or other operating income.
As regards the balances of trade accounts receivable that are neither impaired nor overdue, there was no indication as at the balance sheet date that the debtors will not fulfill their payment obligations.
Default risks on trade accounts receivable are largely covered by commercial credit insurance.
112 Consolidated Income Statement1 13 Consolidated Statement of
Comprehensive Income114 Consolidated Statement of
Financial Position
116 Consolidated Cash Flow Statement117 Consolidated Statement of
Changes in Equity118 Notes to the Consolidated
Financial Statements
Consolidated Financial Statements 147
Aurubis Annual Report 2015/16
192 Responsibility Statement193 Auditors’ Report

22. Receivables and other assetsOther receivables and other assets comprise both other financial and other non-financial assets.
Non-current receivables and other assets were made up as follows as at the balance sheet date:
in € thousand 9/30/2016 9/30/2015
Non-current (with a residual term of more than 1 year)
Derivative financial instruments of the “held-for-trading” category 1,539 1,335
Derivative financial instruments held as hedging instruments in the context of hedge accounting 1,516 45
Sundry other non-current financial assets 20,025 12,847
Non-current financial assets 23,080 14,227
Other non-current non-financial assets 2,468 1,176
Other non-current non-financial assets 2,468 1,176
Derivative financial instruments of the “held-for-trading” category with a term of more than one year were reported as non- current due to their economic hedging relationship.
Current receivables and other assets were made up as follows as at the balance sheet date:
in € thousand 9/30/2016 9/30/2015
Current (with a residual term of less than 1 year)
Derivative financial instruments of the “held-for-trading” category 28,817 60,294
Derivative financial instruments held as hedging instruments in the context of hedge accounting 972 468
Receivables from related parties 14,484 11,966
Sundry other current financial assets 31,230 66,170
Other current financial assets 75,503 138,898
Income tax receivables 6,918 3,303
Sundry other current non-financial assets 44,569 46,201
Other current non-financial assets 51,487 49,504
¤ T 069
¤ T 070
148 Notes to the Consolidated Financial Statements
Aurubis Annual Report 2015/16

The sundry other current non-financial assets mainly comprise VAT receivables of Aurubis Bulgaria AD, Pirdop.
The disclosed receivables from related parties primarily comprise receivables from Schwermetall Halbzeugwerk GmbH & Co. KG, Stolberg, which is accounted for using the equity method, and receivables from non-consolidated companies.
The sundry other current financial assets included a continuing involvement arising from del credere risks for factoring transactions and late payment and currency risks deriving from current trade accounts receivable in the amount of € 13,881 thousand (previous year: € 10,673 thousand). The level of continuing involvement corresponded to the maximum risk of loss, mainly based on the assumption that all receivables open on the balance sheet date that were sold remain outstanding for the entire period for which Aurubis can be held responsible for the late payment risk.
A liability of € 15,322 thousand (previous year: € 12,025 thousand) was reported in connection with the continuing involvement. All trade accounts receivable sold to factoring companies have a term of less than one year, so that the fair value of the continuing involvement and the associated liability each corresponded to the carrying amount.
All of the receivables covered by two factoring contracts for which the main opportunities and risks were transferred to the purchaser of the receivables were completely derecognized. For one of the contracts, the maximum loss Aurubis has to bear from credit risks is limited to a purchase price reduction. This is retained by the buyer at the time of sale of the receivables and is ultimately repaid in the amount of the unused portion. The purchase price reduction for the sold and derecognized receivables (nominal volume: € 12,908 thousand) amounted to € 1,358 thousand as at September 30, 2016 (previous year: € 1,116 thousand) and is included in sundry other financial assets. A total of € 382 thousand (previous year: € 345 thousand) was recorded as an expense deriving from the sale of the receivables. For the other contract, for which the main opportunities and risks were transferred to the purchaser of the receivables, a continuing involvement of € 485 thousand and an associated liability of € 581 thousand were fully derecognized.
In total, outstanding receivables in the amount of € 266 million (previous year: € 270 million) had been sold to factoring companies as at the balance sheet date.
In the previous year, the sundry other current financial assets particularly comprised security deposits from brokers, amounting to € 45.4 million, for the handling of forward metal commodity and forward exchange transactions on behalf of Aurubis AG, Hamburg.
With the exception of interest derivatives, there was no interest rate fluctuation risk deriving from any receivable or other asset. Further information on the interest derivatives is provided in Note 30 Financial instruments.
The allowances on other financial assets are reported in the following table:
in € thousand 9/30/2016 9/30/2015
Specific allowances Balance as at 10/1 850 724
Changes in allowances during the period 302 126
Additions 1,198 0
Reversal (900) 0
Exchange rate impacts 4 126
Balance as at 9/30 1,152 850
In the fiscal year reported, income of € 900 thousand (previous year: € 0 thousand) was recorded deriving from the reversal of write-downs on other financial assets.
As regards other financial assets that are neither impaired nor overdue, there was no indication as of the balance sheet date that the debtors will not fulfill their payment obligations.
¤ T 071
112 Consolidated Income Statement1 13 Consolidated Statement of
Comprehensive Income114 Consolidated Statement of
Financial Position
116 Consolidated Cash Flow Statement117 Consolidated Statement of
Changes in Equity118 Notes to the Consolidated
Financial Statements
Consolidated Financial Statements 149
Aurubis Annual Report 2015/16
192 Responsibility Statement193 Auditors’ Report

23. Cash and cash equivalentsCash and cash equivalents consist of current account balances with banks, as well as commercial paper with a term of up to one month, cash in hand and checks. Cash at banks mainly comprises euro balances.
24. EquityThe share capital amounted to € 115,089,210.88 and is divided into 44,956,723 no-par-value bearer shares, each with a notional interest of € 2.56. The share capital is fully paid in.
The Executive Board is empowered, subject to the approval of the Supervisory Board, to increase the share capital by February 23, 2021 by up to € 57,544,604.16 once or in several installments.
The share capital has been conditionally increased by up to € 52,313,277.44 by issuing up to 20,434,874 new no-par-value bearer shares with a proportionate notional amount per share of € 2.56 of the share capital (conditional capital increase). It will be used to grant shares to the holders or creditors of bonds with warrants and/or convertible bonds and participation rights and/or participating bonds that can be issued by February 28, 2017.
Generated group equity comprises consolidated net income, the revenue reserves of all group companies, the accumulated unappropriated earnings of the subsidiaries since their initial consolidation and the accumulated amounts resulting from consolidation adjustments recognized in profit or loss. In addition, the effects deriving from the remeasurement of the net liability resulting from the defined benefit pensions plans (after taxes), which are recorded directly in equity, are also included.
The legal reserve of € 6,391 thousand, which was not available for distribution, was also included in this amount. The change in generated group equity from € 1,523,444 thousand as at September 30, 2015 to € 1,520,781 thousand as at September 30, 2016 included the dividend payment of € 60,692 thousand, negative effects of € 63,823 thousand (after taxes) recognized in equity deriving from the remeasurement of the net liability resulting from the defined benefit pensions plans and the consolidated net income for fiscal year 2015/16 of € 121,852 thousand.
Changes in accumulated other comprehensive income amounting in total to € 25,229 thousand (previous year: € –8,235 thousand) mainly comprised gains and losses of € 28,050 thousand (previous year: € –12,189 thousand) deriving from the measurement of derivative financial instruments at market prices in conjunction with cash flow hedges.
An amount of € –33,561 thousand (previous year: € –43,576 thousand) was transferred during the period from other comprehensive income to the consolidated income statement in conjunction with cash flow hedge accounting, which is primarily reflected in the cost of materials.
The non-controlling interests amounting to € 2,769 thousand (previous year: € 2,778 thousand) comprised the interests of non-group shareholders in the equity of two companies that are fully consolidated by Aurubis AG. As at September 30, 2016, the companies concerned were Deutsche Giessdraht GmbH, Emmerich, and Aurubis Bulgaria AD, Pirdop. The change in non-controlling interests includes proportional amounts of the dividend payment amounting to € 1,088 thousand, effects of € –588 thousand from the remeasurement of the net liability resulting from the defined benefit pensions plans (after taxes), which are recorded directly in equity, and € 1,667 thousand of the consolidated net income for fiscal year 2015/16.
Changes in equity are presented in detail in the consolidated statement of changes in equity.
150 Notes to the Consolidated Financial Statements
Aurubis Annual Report 2015/16

Proposed appropriation of earningsThe separate financial statements of Aurubis AG, Hamburg, have been prepared in accordance with German GAAP (HGB – German Commercial Code).
in €
Net income for the year of Aurubis AG 134,232,732
Unappropriated earnings brought forward from the prior year 54,879,288
Allocations to other revenue reserves 67,100,000
Unappropriated earnings 122,012,020
A proposal will be made to the Annual General Meeting that Aurubis AG, Hamburg’s unappropriated earnings of € 122,012,020 are used to pay a dividend of € 1.25 per no-par-value share (= € 56,195,903.75) and that € 65,816,116.25 be carried forward.
A dividend of € 1.35 per share was paid in fiscal year 2015/16, totaling € 60,691,576.05.
Additional information on capital managementThe main purpose of management control is to increase the corporate value of the Aurubis Group, in that a positive contribution to the enterprise as a whole is generated beyond the capital costs. The Group’s liquidity sourcing is secured through a combination of the Group’s cash flow, borrowings, as well as lines of credit available from our banks. Existing credit facilities and lines of credit can compensate for fluctuations in the cash flow development at any time. The objective is to keep the Group’s debt structure in equilibrium in the long term. Control and monitoring are carried out on the basis of defined key ratios. Net debt and liquidity are controlled in the medium and short term by means of regular cash flow forecasts.
One of the main key ratios used to determine and compare profitability is ROCE (return on capital employed), which reflects the efficiency with which the capital is utilized in the operating business or for investments. ROCE is defined as the ratio of EBIT (earnings
before interest and taxes) to capital employed as at the balance sheet date. Capital employed comprises equity and interest-bearing liabilities, less cash and cash equivalents.
The Aurubis Group’s operating ROCE decreased from 18.7 % in the past fiscal year to 10.9 % in the current fiscal year due to the lower operating result.
All external requirements under financial covenants were fulfilled in the fiscal year reported.
25. Deferred tax liabilitiesThe breakdown of the deferred tax liabilities is presented in Note 12 Income taxes.
26. Pension provisions and similar obligationsWithin the Aurubis Group, retirement benefits for employees are provided on the basis of both defined benefit plans and defined contribution plans.
The majority of defined benefit plan obligations in the Aurubis Group relate to Germany and the US. On the one hand, these represent individual contractual direct obligations. On the other hand, the Group provides benefits in the form of defined benefit obligations within collective plans. Both funded and unfunded plans exist.
In Germany, the Group provides eligible employees with pension benefits as well as disability and surviving dependent benefits. These are provided to a great extent through pension and support funds whose assets may solely be utilized to satisfy the Aurubis Group’s pension obligations.
Generally, the amount of the pension benefit per qualified year of service is determined as a percentage of a pensionable salary. In Germany, pensions are reviewed every three years and adjusted, where necessary, in a manner corresponding to the price index development.
In Germany, the company pension plan for new employees was converted to the form of defined contribution plans that are processed by an external pension fund and an insurance company.
¤ T 072
112 Consolidated Income Statement1 13 Consolidated Statement of
Comprehensive Income114 Consolidated Statement of
Financial Position
116 Consolidated Cash Flow Statement117 Consolidated Statement of
Changes in Equity118 Notes to the Consolidated
Financial Statements
Consolidated Financial Statements 151
Aurubis Annual Report 2015/16
192 Responsibility Statement193 Auditors’ Report

Furthermore, a subsidiary in the US grants employees pension, health care and life insurance benefits for the period after retirement under specific conditions related to age and duration of employment with the company. These pension benefits are based on collective agreements that only apply to unionized employees. These represent lifelong pension benefits whose level depends on the duration of employment. The amount of the benefits does not depend on the salary. Health care benefits are provided after the employee leaves the company until an established minimum age. While the pension plans are mainly financed through the specific assets of a separate pension fund, there is no separate fund for the health care and life insurance benefits provided in the US.
Within the Group, actuarial reports were obtained for all pension obligations. The reports take uniform group-wide accounting policies into consideration, while nevertheless reflecting special country-specific circumstances.
In addition to the mortality tables published by Prof. Dr. Klaus Heubeck (“Richttafeln 2005G”), the following market discount rates, salary and pension trends were used as a basis to calculate the pension obligations in Germany:
in % 9/30/2016 9/30/2015
Discount rate 1.10 2.40
Expected salary trend 2.75 3.00
Expected pensions trend 1.60 1.80
A discount rate of 3.37 % (previous year: 4.06 %) was taken as a basis for the measurement of the pension provision of Aurubis Buffalo, Inc., Buffalo. Income and pension trends are not relevant for the calculation of the pension obligations of the US subsidiary.
The net pension provision recognized in the consolidated statement of financial position for defined benefit plans as at September 30, 2016 and September 30, 2015 is as follows:
in € thousand 9/30/2016 9/30/2015
Present value of pension obligations 638,439 542,981
of which funded 496,440 417,974
– Fair value of plan assets 316,439 321,209
Net carrying amount on September 30 322,000 221,772
of which: disclosed as assets 0 0
of which: disclosed as liabilities 322,000 221,772
¤ T 073
¤ T 074
152 Notes to the Consolidated Financial Statements
Aurubis Annual Report 2015/16

The net liability for benefit obligations, taking into account separate reconciliations for the present value of the defined benefit obligation as well as the plan assets, is derived as follows:
Development of the present value of the pension obligations
in € thousand 9/30/2016 9/30/2015
Present value of unfunded benefit obligations 125,007 123,744
Present value of funded benefit obligations 417,974 431,929
Present value of the pension obligations as at 10/1 542,981 555,673
Effects deriving from the transfer of obligations 4,982 0
Current service cost 11,186 11,595
Loss from settlements 82 130
Interest cost on the pension obligations 13,954 14,474
Remeasurements 103,066 (251)
Actuarial gains/losses from demographic assumptions (360) 3,609
Actuarial gains/losses from financial assumptions 106,797 (979)
Actuarial gains/losses from adjustments based on experience (3,371) (2,881)
Benefits paid (21,051) (22,176)
Payments for settlements (16,910) (25,422)
Exchange rate difference 149 8,958
= Present value of the pension obligations as at 9/30 638,439 542,981
The present value of the defined benefit pension obligation included € 58,930 thousand (previous year: € 66,539 thousand) in obligations for a US subsidiary, € 16,874 thousand (previous year: € 16,881 thousand) of which related to health care and life insurance benefits.
¤ T 075
112 Consolidated Income Statement1 13 Consolidated Statement of
Comprehensive Income114 Consolidated Statement of
Financial Position
116 Consolidated Cash Flow Statement117 Consolidated Statement of
Changes in Equity118 Notes to the Consolidated
Financial Statements
Consolidated Financial Statements 153
Aurubis Annual Report 2015/16
192 Responsibility Statement193 Auditors’ Report

The loss from settlements resulted from the transfer of obligations from the defined benefit pension plans of the US subsidiary to an external insurance company.
Development of the plan assets
in € thousand 2015/16 2014/15
Fair value of the plan assets as at 10/1 321,209 325,034
Effects deriving from the transfer of assets 4,460 0
Interest income 8,484 8,853
Remeasurement effects 7,873 16,472
Benefits paid (14,298) (16,477)
Payments for settlements (16,910) (25,422)
Contributions made by employer 5,376 5,782
Exchange rate difference 245 6,967
Fair value of the plan assets as at 9/30 316,439 321,209
Development of the net liability
in € thousand 2015/16 2014/15
Net liability as of 10/1 221,772 230,639
Loss deriving from the transfer of obligations 522 0
Current service cost 11,186 11,595
Loss from settlements 82 130
Net interest result 5,470 5,621
Remeasurement effects 95,193 (16,723)
Benefits paid (6,753) (5,699)
Employer contributions to the plan (5,376) (5,782)
Exchange rate difference (96) 1,991
Net liability as at 9/30 322,000 221,772
¤ T 076
¤ T 077
154 Notes to the Consolidated Financial Statements
Aurubis Annual Report 2015/16

The remeasurement effects are directly recorded in other comprehensive income and are disclosed under generated group equity. The net interest result is disclosed under interest expense. In contrast, the other components of the pension expenses (current and past service cost and the loss deriving from settlements) are recorded in personnel expenses.
In Germany, the defined benefit plans are primarily administered through processes in operation within the pension fund and the benefit fund. In this context, the pension fund is overseen by the German Federal Financial Supervisory Authority (BaFin).
Regulations related to the pension fund’s capital investment portfolio are established by the “Ordinance on the Investment of Restricted Assets of Insurance Undertakings (Investment Ordinance)”. The Investment Ordinance regulates the permitted quantitative distribution and mix of capital investments for the pension fund. A large portion of the pension fund’s assets are invested in a segmented special fund. The contributions are calculated in accordance with the current technical business plan.
The risk capital investments (equity instruments and debt instruments with a rating lower than investment grade) may account for a maximum of 35 % of the carrying amount of the coverage assets. The real estate rate is 25 % of the coverage assets’ carrying amount. Derivatives are primarily used for hedging purposes. The risk of longevity is taken into account by the actuary, after performing a review, by adjusting the biometric parameters where necessary.
The benefit fund is also oriented to the Investment Ordinance with respect to permitted capital investments. The contributions are within the range of the tax-related possibilities.
In the US, the defined benefit plan is financed by outsourced fund assets. The investment strategy in the US aims at a distribution of the plan assets comprising 60 % shares and 40 % fixed rate securities. In order to avoid an uncontrollable risk concentration, investment in other asset classes (e.g. commodities, real estate, venture capital) is not permitted.
The plan assets in the Group are made up as follows:
in € thousand 9/30/2016 9/30/2015
Cash and cash equivalents 16,464 10,030
Equity instruments 50,532 56,623
Debt instruments 114,488 126,792
Real estate 127,247 119,160
Reinsurance 3,279 2,875
Other current net assets 4,429 5,729
Total plan assets 316,439 321,209
The plan assets include neither internal financial instruments nor real estate used internally. The equity and debt instruments held via security funds are allocated to their corresponding investment classes in the overview.
Market prices are generally available for the equity instruments as a result of their respective quotations on an active market. The fair value of € 50,532 thousand (previous year: € 56,623 thousand) included € 20,272 thousand (previous year: € 27,054 thousand) for plan assets for a US subsidiary.
¤ T 078
112 Consolidated Income Statement1 13 Consolidated Statement of
Comprehensive Income114 Consolidated Statement of
Financial Position
116 Consolidated Cash Flow Statement117 Consolidated Statement of
Changes in Equity118 Notes to the Consolidated
Financial Statements
Consolidated Financial Statements 155
Aurubis Annual Report 2015/16
192 Responsibility Statement193 Auditors’ Report

The debt instruments are also regularly traded on an active market. The fair value of € 114,488 thousand (previous year: € 126,792 thousand) includes € 13,436 thousand (previous year: € 18,210 thousand) for plan assets of a US subsidiary.
Real estate is held directly and is located exclusively in Germany. There is no active market from which market prices can be derived.
The Company is subject to various risks in connection with the defined benefit plans. The Company is subject to the general actuarial risks in particular, such as the risk of longevity, the risk of interest rate changes and, to a small extent, a risk of inflation.
Sensitivity analysisThe following sensitivity analysis shows the effect of changes in the parameters on the present value of the defined benefit obligations. Each change in a significant actuarial assumption was analyzed separately, i.e. if one parameter varied, the other parameters remained constant. Possible correlation effects between the individual assumptions were not taken into consideration:
Effect on obligation
9/30/2016 9/30/2015
in € thousand
Change in para-
meter Increase Decrease Increase Decrease
Actuarial interest rate
± 50 basis
points (52,939) 59,590 (40,804) 45,396
Expected salary development
± 50 basis
points 11,882 (12,325) 9,057 (9,513)
Expected pension development
± 50 basis
points 36,471 (34,278) 27,133 (25,783)
Life expectancy
± 1 year 29,212 (30,242) 22,021 (23,125)
The following duration terms are expected for undiscounted pension payments in the future:
in € thousand 9/30/2016 9/30/2015
Less than 1 year 21,323 21,532
Between 1 and 5 years 90,550 93,859
More than 5 years 706,955 752,505
Total 818,828 867,896
The weighted average duration of obligations from defined benefit plans as at September 30, 2016 was 17.7 years (previous year: 16.2 years).
The expense for defined contribution pension plans amounted to € 23,637 thousand in the year reported (previous year: € 22,670 thousand). These include both voluntary commitments and the employer’s contribution made by the Group to statutory pension schemes.
¤ T 079
¤ T 080
156 Notes to the Consolidated Financial Statements
Aurubis Annual Report 2015/16

27. Other provisions
Non-current Current Total
in € thousand 9/30/2016 9/30/2015 9/30/2016 9/30/2015 9/30/2016 9/30/2015
Personnel provisions 46,486 42,231 22,755 22,965 69,241 65,196
Expected losses on onerous contracts 0 0 3,452 3,201 3,452 3,201
Environmental provisions 15,885 15,864 2,225 2,856 18,110 18,719
Sundry provisions 1,667 1,657 3,878 5,727 5,545 7,384
64,038 59,752 32,310 34,748 96,348 94,500
The individual classes of provisions developed as follows during the fiscal year reported:
in € thousandBalance per 10/1/2015 Used Released Allocated Interest effect
Exchange rate difference
Balance per 9/30/2016
Personnel provisions 65,196 (18,386) (98) 22,047 517 (35) 69,241
Expected losses on onerous contracts 3,201 (2,950) 0 3,201 0 0 3,452
Environmental provisions 18,719 (1,349) 0 268 470 2 18,110
Sundry provisions 7,384 (4,513) (404) 3,107 0 (29) 5,545
94,500 (27,198) (502) 28,623 987 (62) 96,348
The personnel provisions consisted mainly of obligations to employees relating to anniversary bonuses, temporary assistance benefits and those deriving from early retirement agreements. Provisions for environmental risks primarily related to clean-up measures at the Lünen site as well as in Buffalo, USA, and Zutphen, Netherlands. The provisions had terms of up to 24 years. The probable costs were determined taking into account past experience in comparable cases, existing appraisals and the clean-up methods that will probably be used on the basis of present knowledge.
¤ T 081
¤ T 082
112 Consolidated Income Statement1 13 Consolidated Statement of
Comprehensive Income114 Consolidated Statement of
Financial Position
116 Consolidated Cash Flow Statement117 Consolidated Statement of
Changes in Equity118 Notes to the Consolidated
Financial Statements
Consolidated Financial Statements 157
Aurubis Annual Report 2015/16
192 Responsibility Statement193 Auditors’ Report

28. LiabilitiesFinancial liabilities as at the balance sheet date were as follows:
in € thousand 9/30/2016 9/30/2015
Non-current (with a residual terms of more than 1 year)
Bank borrowings 321,225 463,681
Liabilities under finance leases 15,887 16,997
Derivative financial instruments of the “held-for-trading” category 17,122 21,626
Liabilities to related parties 0 950
Derivative financial instruments held as hedging instruments in the context of hedge accounting 1,666 5,040
Non-current financial liabilities 355,900 508,294
Current (with a residual terms of less than 1 year)
Trade accounts payable 797,710 761,409
Bank borrowings 156,209 23,506
Derivative financial instruments of the “held-for-trading” category 18,110 87,209
Liabilities to related parties 2,157 4,663
Liabilities under finance leases 1,922 1,915
Derivative financial instruments held as hedging instruments in the context of hedge accounting 5,796 25,850
Sundry other current financial liabilities 83,693 69,302
Current financial liabilities 1,065,597 973,854
¤ T 083
158 Notes to the Consolidated Financial Statements
Aurubis Annual Report 2015/16
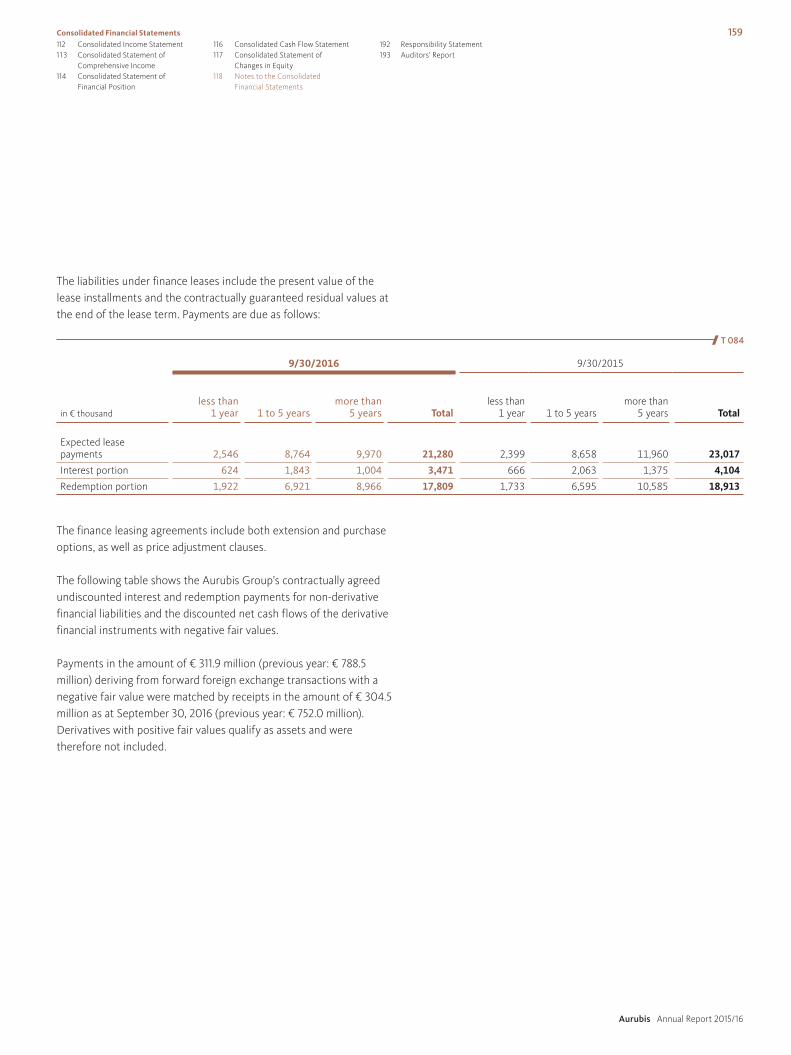
The liabilities under finance leases include the present value of the lease installments and the contractually guaranteed residual values at the end of the lease term. Payments are due as follows:
9/30/2016 9/30/2015
in € thousandless than
1 year 1 to 5 yearsmore than
5 years Totalless than
1 year 1 to 5 yearsmore than
5 years Total
Expected lease payments 2,546 8,764 9,970 21,280 2,399 8,658 11,960 23,017
Interest portion 624 1,843 1,004 3,471 666 2,063 1,375 4,104
Redemption portion 1,922 6,921 8,966 17,809 1,733 6,595 10,585 18,913
The finance leasing agreements include both extension and purchase options, as well as price adjustment clauses.
The following table shows the Aurubis Group’s contractually agreed undiscounted interest and redemption payments for non-derivative financial liabilities and the discounted net cash flows of the derivative financial instruments with negative fair values.
Payments in the amount of € 311.9 million (previous year: € 788.5 million) deriving from forward foreign exchange transactions with a negative fair value were matched by receipts in the amount of € 304.5 million as at September 30, 2016 (previous year: € 752.0 million). Derivatives with positive fair values qualify as assets and were therefore not included.
¤ T 084
112 Consolidated Income Statement1 13 Consolidated Statement of
Comprehensive Income114 Consolidated Statement of
Financial Position
116 Consolidated Cash Flow Statement117 Consolidated Statement of
Changes in Equity118 Notes to the Consolidated
Financial Statements
Consolidated Financial Statements 159
Aurubis Annual Report 2015/16
192 Responsibility Statement193 Auditors’ Report

Payments
in € thousand
Carrying amount as at
9/30/2016 up to 1 yearfrom 1 to
5 yearsmore than
5 years
Bank borrowings 477,434 156,209 205,725 115,500
Liabilities under finance leases 17,809 1,923 3,677 12,209
Trade accounts payable 797,710 797,710 0 0
Liabilities to related parties 2,157 2,157 0 0
Derivatives of the “held-for-trading” category 35,232 18,110 17,122 0
Derivatives designated as hedging instruments for hedge accounting purposes 7,461 5,795 1,666 0
Sundry other financial liabilities 83,694 83,694 0 0
Total 1,421,497 1,065,598 228,190 127,709
Payments
in € thousand
Carrying amount as at
9/30/2015 up to 1 yearfrom 1 to
5 yearsmore than
5 years
Bank borrowings 487,187 29,193 370,278 125,124
Liabilities under finance leases 18,913 1,915 4,760 12,210
Trade accounts payable 761,409 761,409 0 0
Liabilities to related parties 5,613 4,663 950 0
Derivatives of the “held-for-trading” category 108,835 87,209 21,626 0
Derivatives designated as hedging instruments for hedge accounting purposes 30,889 25,850 5,039 0
Sundry other financial liabilities 69,302 69,302 0 0
Total 1,482,148 979,541 402,653 137,334
This presentation above does not show any plan figures but only the financial instruments that were held as at September 30, 2016 or September 30, 2015 respectively and for which contractual agreements on the payments existed. Foreign currency amounts are translated at the closing rate.
¤ T 085
¤ T 086
Aurubis had no bank borrowings secured by mortgages and fixed assets. Financial assets have not been pledged as collateral for bank borrowings.
160 Notes to the Consolidated Financial Statements
Aurubis Annual Report 2015/16

Non-financial liabilities as at the balance sheet date were as follows:
in € thousand 9/30/2016 9/30/2015
Non-current (with a residual term of more than 1 year)
Non-current non-financial liabilities 1,201 1,179
Non-current non-financial liabilities 1,201 1,179
Current (with a residual term of less than 1 year)
Other tax liabilities 13,223 11,223
Social security obligations 13,704 15,764
Income tax liabilities 4,522 53,926
Advance payments received on orders 5,220 3,385
Other current non-financial liabilities 7,279 9,123
Current non-financial liabilities 43,948 93,421
Other tax liabilities mainly comprise VAT liabilities.
Please refer to the consolidated cash flow statement for information about the change in liabilities from income taxes.
29. Other financial commitments
in € thousand 9/30/2016 9/30/2015
Capital expenditure commitments 41,126 39,807
Obligations under long-term contracts 164,598 179,430
Warranty obligations 1,709 1,997
Contingent liabilities under discounted bills 1,016 1,289
208,449 222,523
Certain prior-year figures have been adjusted.
¤ T 087
¤ T 088
112 Consolidated Income Statement1 13 Consolidated Statement of
Comprehensive Income114 Consolidated Statement of
Financial Position
116 Consolidated Cash Flow Statement117 Consolidated Statement of
Changes in Equity118 Notes to the Consolidated
Financial Statements
Consolidated Financial Statements 161
Aurubis Annual Report 2015/16
192 Responsibility Statement193 Auditors’ Report

The capital expenditure commitments mainly related to property, plant and equipment.
Obligations under long-term contracts are mainly related to the provision of transport and handling services by various service providers.
In addition, an agreement has been concluded with an energy utility for the cost-based procurement of one billion kilowatt hours of electricity per annum over a term of 30 years commencing in 2010.
The payments are based on price and performance components, as well as a contribution to the investment costs of a power plant. Furthermore, the Group has long-term oxygen supply contracts in place for various sites.
Financial commitments under leasesAs at September 30, 2016, lease commitments under operating leases amounted to € 30,497 thousand (previous year: € 27,096 thousand). These are due as follows:
in € thousand less than 1 year 1 to 5 yearsmore than
5 years Total
9/30/2016
Commitments under operating leases 8,174 13,170 9,153 30,497
9/30/2015
Commitments under operating leases 8,321 11,501 7,274 27,096
Lease payments in fiscal year 2015/16 recognized as expense amounted to € 7,658 thousand (previous year: € 7,785 thousand).
30. Financial instrumentsThe Aurubis Group is exposed to market risks, liquidity risks and default risks as a result of the use of financial instruments.
Market risksMarket risks arise as a result of a possible change in risk factors that lead to a decrease in the market value of the transactions affected by these risk factors. The following groups of general risk factors are relevant for the Aurubis Group: currency exchange rate risks, interest rate risks and other price-related risks.
¤ T 089
Currency exchange rate risksAs a result of its business operations, the Aurubis Group is exposed to currency exchange rate fluctuations. Changes in exchange rates can lead to losses in the value of financial instruments. Foreign currency forward and option contracts are concluded to limit currency risks. These mainly relate to the US dollar. For this purpose, the daily foreign currency positions from underlying transactions are offset against each other each day and any remaining open positions are squared by means of foreign exchange derivatives. Aurubis works exclusively with business partners with good credit standing on all foreign exchange transactions.
Furthermore, foreign currency forward and option contracts were concluded in the past fiscal year to hedge future receipts. Provided the criteria for cash flow hedges were fulfilled, the results of these hedge transactions were recognized in the accompanying financial statements initially in other comprehensive income in the amount of the effective part of the hedge transaction.
162 Notes to the Consolidated Financial Statements
Aurubis Annual Report 2015/16

These results are recognized in profit or loss as soon as the underlying hedged transaction is recognized in profit or loss. Fundamental shifts in currency relationships, in particular between the euro and the US dollar, can, however, only be hedged for a limited time.
Information on the management of exchange rate risks is provided in the Risk Report in the Management Report.
The foreign currency risk constitutes a cash flow risk and represents the risk position for the following period. This corresponds to the net amount of the nominal volume of the non-derivative and derivative financial instruments held, which are exposed to exchange rate risks. In addition, planned revenue transactions of the following periods are included to the extent that these are taken into account for currency risk management purposes to show the risk position for the following period.
Foreign currency risk
EUR/USD
in € thousand 9/30/2016 9/30/2015
Risk position deriving from recognized transactions (592,946) (674,465)
Budgeted revenues 768,540 631,827
Forward foreign exchange contracts 290,495 327,652
Put option transactions (172,028) (117,826)
Net exposure 294,061 167,188
IFRS 7 requires a sensitivity analysis to be performed for each type of risk to indicate the market risks. The use of sensitivity analyses deter-mines the potential impacts on profit or loss and on equity as at the balance sheet date of a change in the respective risk variable for each type of risk. The impacts for the periods are determined by relating the hypothetical changes in the risk variables to the amount reported as at the balance sheet date. In doing so, it is assumed that the amount reported as at the balance sheet date is representative for the entire year.
¤ T 090
In order to determine the exchange rate risk, a sensitivity analysis was performed for the foreign currencies that pose a significant risk for the business, in this instance, the US dollar. For the purpose of the sensitivity analysis for the currencies, it was assumed that the exchange rate of the euro compared with the US dollar would change by +/–10 %, respectively.
If the euro had been 10 % stronger or weaker against the US dollar on September 30, 2016 or September 30, 2015 as compared to the rate prevailing on the balance sheet date, then – from a foreign currency risk perspective – equity and net income for the year would have changed to the extent shown in the following table. All relevant recognized foreign currency items have been included in the calculation, as well as the budgeted revenues of the following period that were considered in the foreign currency risk exposure assessment.
Currency sensitivity
EUR/USD
in € thousand 9/30/2016 9/30/2015
Closing rate 1.1161 1.1203
Devaluated rate (EUR against USD) 1.0045 1.0083
Effect on net income 83,845 68,859
thereof budgeted revenues 85,393 70,203
thereof non-derivative transactions 9,478 34,647
thereof derivative transactions (11,026) (35,991)
Effect on equity (32,931) (35,601)
Appreciated rate (EUR against USD) 1.2277 1.2323
Effect on net income (64,491) (54,676)
thereof budgeted revenues (69,867) (57,439)
thereof non-derivative transactions (3,645) (26,683)
thereof derivative transactions 9,021 29,446
Effect on equity 21,125 26,740
¤ T 091
112 Consolidated Income Statement1 13 Consolidated Statement of
Comprehensive Income114 Consolidated Statement of
Financial Position
116 Consolidated Cash Flow Statement117 Consolidated Statement of
Changes in Equity118 Notes to the Consolidated
Financial Statements
Consolidated Financial Statements 163
Aurubis Annual Report 2015/16
192 Responsibility Statement193 Auditors’ Report

Interest rate fluctuation risks Interest rate fluctuation risks arise due to potential changes in market interest rates and can result in a change in the fair value of fixed-interest financial instruments and interest payment fluctuations for variable interest rate financial instruments. Any interest rate risks that arise are hedged by interest rate swaps. Interest rate fluctuation risks are of significant importance in the financial sector. Provided the criteria for cash flow hedges are fulfilled for the hedging of variable interest payments, the results of these hedge transactions are initially recognized in other comprehensive income in the amount of the effective portion of the hedge transaction. They are recognized in profit or loss as soon as the underlying hedged transaction is recognized in profit or loss in the respective fiscal year.
Details of how interest rate fluctuation risks are managed are provided in the Risk Report in the Management Report.
The table below shows the net exposure for variable interest- bearing risk positions.
In accordance with IFRS 7, interest rate fluctuation risks are presented in a sensitivity analysis, which reflects the effects of a change in market interest rates on interest income, interest expense and equity.
In the event of an increase (decrease) in all relevant interest rates by 100 basis points (50 basis points), equity and earnings for the year as at September 30, 2016 and September 30, 2015 would change as shown by the following table. The same items have been included in the calculation as were considered for the determination of the net exposure presented above. Furthermore, all interest-bearing financial instruments that will expire in the following period were included. In each such case, their substitution applying a sensitivity-adjusted interest rate was assumed from the date of maturity onwards.
Variable interest risk positions
Total amount up to 1 year 1 to 5 years more than 5 years
in € thousand 9/30/2016 9/30/2015 9/30/2016 9/30/2015 9/30/2016 9/30/2015 9/30/2016 9/30/2015
Loans/time deposits 438,092 427,342 438,092 427,342 0 0 0 0
Other risk items (303,088) (319,106) (232,088) (248,106) (58,000) (58,000) (13,000) (13,000)
of which hedged against the interest rate risk 71,000 71,000 0 0 58,000 58,000 13,000 13,000
Net exposure 206,004 179,236 206,004 179,236 0 0 0 0
¤ T 092
164 Notes to the Consolidated Financial Statements
Aurubis Annual Report 2015/16

Interest rate sensitivities
9/30/2016 9/30/2015
in € thousand +100 BP –50 BP +100 BP –50 BP
Effect on earnings 2,024 (1,672) 1,792 (899)
Effect on equity 1,846 (954) 2,412 (1,255)
Other price risksAs a result of its business operations, the Aurubis Group is exposed to commodity price risks. Among other measures, non-ferrous metals futures contracts are entered into in order to mitigate these risks. The contracts are mainly focused on the hedging of the copper price. For this purpose, incoming and outgoing metal quantities from underlying transactions are offset against each other each day and remaining open positions are squared by means of metal exchange transactions. We work exclusively with business partners with good credit standing on all metal hedge transactions.
If price-fixed metal delivery agreements for non-ferrous metals are accounted for as derivative financial instruments to cover the expected raw material requirement or the expected sale of finished products, market value changes are recognized in profit or loss. Gains and losses from the contrary development of the fair value of the hedged items and the hedge transactions are therefore recognized directly in profit or loss.
Details of metal price risk management processes are provided in the Risk Report in the Management Report.
¤ T 093
The Aurubis Group has secured its electricity consumption by concluding a long-term agreement with an energy utility. Aurubis is exposed to an electricity price risk from the measurement of part of this agreement.
The nominal volumes of the derivative financial instruments covering copper, silver, gold, as well as electricity, coal and CO₂, which result from the gross total of the nominal amounts of the individual purchasing and sales contracts, are as follows.
Nominal volumes of the derivatives
in € thousand 9/30/2016 9/30/2015
Copper 1,015,407 1,794,749
Silver 97,680 104,825
Gold 398,173 398,103
Electricity, coal, CO₂ 94,598 96,385
1,605,858 2,394,062
In accordance with IFRS 7, commodity price risks are shown in the form of a sensitivity analysis, which reflects the effects of a change in the commodity prices on the net income for the period.
¤ T 094
112 Consolidated Income Statement1 13 Consolidated Statement of
Comprehensive Income114 Consolidated Statement of
Financial Position
116 Consolidated Cash Flow Statement117 Consolidated Statement of
Changes in Equity118 Notes to the Consolidated
Financial Statements
Consolidated Financial Statements 165
Aurubis Annual Report 2015/16
192 Responsibility Statement193 Auditors’ Report

In the event of a 10 % increase (decrease) in all relevant commodity prices, equity and earnings for the year would be changed as at September 30, 2016 and September 30, 2015 as shown in the following table. The calculation includes all derivatives for copper, silver, gold, as well as electricity, coal and CO₂ as at the balance sheet date.
Commodity price sensitivity
Copper Silver Gold Electricity, coal, CO₂
in € thousand 9/30/2016 9/30/2015 9/30/2016 9/30/2015 9/30/2016 9/30/2015 9/30/2016 9/30/2015
Price increase
Effect on earnings 26,637 43,782 5,310 8.735 27,630 26,760 4,118 3,656
Price decrease
Effect on earnings (26,637) (43,782) (5,310) (8,735) (27,630) (26,760) (4,118) (3,656)
The effects on earnings shown in the commodity price sensitivity table for metals are partially or completely compensated through the measurement of the purchase or sales contracts that are not yet fixed, since these positions are provisionally measured at the respective price on the reporting date.
¤ T 095
166 Notes to the Consolidated Financial Statements
Aurubis Annual Report 2015/16

Derivative financial instrumentsThe Aurubis Group uses derivative financial instruments to hedge exchange rate, interest rate and other price risks. Provided the criteria for the application of hedge accounting are fulfilled, these are reflected by cash flow hedges.
Financial derivatives
Assets Liabilities
9/30/2016 9/30/2015 9/30/2016 9/30/2015
in € thousandCarrying amount
Nominal volume
Carrying amount
Nominal volume
Carrying amount
Nominal volume
Carrying amount
Nominal volume
Interest rate swaps
without a hedging relationship 0 0 0 0 0 0 0 0
as cash flow hedges 0 0 45 13,000 1,457 71,000 93 58,000
Foreign exchange forward contracts
without a hedging relationship 2,646 458,959 25,209 604,582 1,675 225,412 5,988 470,248
as cash flow hedges 2,257 214,263 126 26,851 5,719 80,462 30,483 287,300
Forward foreign exchange options
without a hedging relationship 0 0 0 0 0 0 0 0
as cash flow hedges 231 71,385 342 30,380 286 98,377 313 84,587
Metal futures contracts
without a hedging relationship 25,841 774,802 36,420 1,043,090 16,692 777,100 81,061 1,303,316
as cash flow hedges 0 0 0 0 0 0 0 0
Other transactions
without a hedging relationship 1,869 6,171 0 0 16,865 88,427 21,787 96,385
as cash flow hedges 0 0 0 0 0 0 0 0
The nominal volume of the derivative financial instruments is the sum of the nominal amounts of the individual purchase and sales contracts. By contrast, the fair value is based on the measurement of all contracts at the prices applicable on the measurement date. It indicates the potential impact on income of the prompt settlement of all derivatives as at the balance sheet date, without considering the hedged transactions.
¤ T 096
112 Consolidated Income Statement1 13 Consolidated Statement of
Comprehensive Income114 Consolidated Statement of
Financial Position
116 Consolidated Cash Flow Statement117 Consolidated Statement of
Changes in Equity118 Notes to the Consolidated
Financial Statements
Consolidated Financial Statements 167
Aurubis Annual Report 2015/16
192 Responsibility Statement193 Auditors’ Report

The impact on earnings of changes in the fair value of financial derivatives that relate to a cash flow hedge is recognized in equity through other comprehensive income in the amount of the effective portion.
The effective portion of the changes in the value of derivative financial instruments, which was recognized in equity through other comprehensive income in the period reported, amounted to € –5,510 thousand (previous year: € –55,675 thousand). The amount that was transferred during the period from equity into the income statement in the context of cash flow hedge accounting was € –33,561 thousand
(previous year: € –43,576 thousand) and is mainly included in the income statement item “Cost of materials”.
The ineffective portion of the fair value change is by contrast recognized directly in profit or loss.
As was the case in the previous year, no ineffective portions of the change in fair value of the hedge instruments were identified that had to be recognized during the fiscal year reported.
The following two tables show when the cash flows from cash flow hedges will occur and when they will influence the income statement:
Cash flow hedges as at September 30, 2016
Occurrence and impact on income statement in € thousand
Carrying amount
Nominal volume
less than 1 year
1 to 5 years
more than 5 years
Interest rate swaps
Assets 0 0 0 0 0
Liabilities 1,457 71,000 0 58,000 13,000
Forward foreign exchange contracts
Assets 2,257 214,263 129,234 85,029 0
Liabilities 5,719 80,462 80,462 0 0
Foreign currency options
Assets 232 71,385 28,528 42,857 0
Liabilities 286 98,377 56,442 41,935 0
¤ T 097
168 Notes to the Consolidated Financial Statements
Aurubis Annual Report 2015/16

Cash flow hedges as at September 30, 2015
Occurrence and impact on income statement in € thousand
Carrying
amountNominal
volumeless than
1 year 1 to 5 yearsmore than
5 years
Interest rate swaps
Assets 45 13,000 0 0 13,000
Liabilities 93 58,000 0 58,000 0
Forward foreign exchange contracts
Assets 126 26,851 26,851 0 0
Liabilities 30,483 287,300 207,768 79,532 0
Foreign currency options
Assets 342 30,380 30,380 0 0
Liabilities 313 84,587 42,410 42,177 0
Liquidity risksLiquidity risks represent the risk that the business cannot meet its own obligations. The contractually agreed undiscounted interest and redemption payments of the financial liabilities are shown in Note 28.
The adequate sourcing of the Group with cash and cash equivalents is ensured not only by the Group’s cash flow but also by the existing short-term and long-term credit lines with our banks. Fluctuations in cash flow can therefore be cushioned. An autonomous executive committee monitors the development of Aurubis’ liquidity position on a timely and regular basis and reports to the Executive Board. Further management measures taken regarding liquidity risks are described in the Risk Report in the Management Report.
Default risksDefault risks exist for all classes of financial instruments, in particular for trade accounts receivable. The concentration of the credit risk is limited due to the wide-ranging and heterogeneous customer base. The largest individual customer account receivable balances are regularly controlled.
The credit risk arising from derivative financial instruments is limited since the corresponding contracts are only concluded with contractual parties and banks that have a good credit standing.
The customers were classified by their credit rating within the context of the credit risk management process and each customer was given a specific credit limit.
The carrying amounts of the financial assets in the statement of financial position, less any write-downs, represent the maximum potential default risk without taking into account the value of any securities received or other risk-mitigating agreements.
Furthermore, to minimize default risks, we monitor the receivables from our business associates on a regular basis. Apart from instruments that are customary within the market, such as letters of credit and guarantees, we also make particular use of commercial credit insurance to safeguard against potential bad debts. If receivables are sold under factoring agreements, this is done without recourse.
¤ T 098
112 Consolidated Income Statement1 13 Consolidated Statement of
Comprehensive Income114 Consolidated Statement of
Financial Position
116 Consolidated Cash Flow Statement117 Consolidated Statement of
Changes in Equity118 Notes to the Consolidated
Financial Statements
Consolidated Financial Statements 169
Aurubis Annual Report 2015/16
192 Responsibility Statement193 Auditors’ Report

Additional disclosures for financial instruments
2015/16 2014/15
Measurement in the statement of financial position under IAS 39
Measurement in the statement of financial position under IAS 39
Carrying amounts, measurement and fair values analyzed by measurement categoriesin € thousand
Measurement category under IAS 39
Carrying amount
9/30/2016Amortized
cost
Fair value recognized in
equity
Fair value recognized in profit or loss
Measurement in the statement
of financial position under
IAS 17Fair value
9/30/2016Carrying amount
9/30/2015 Amortized cost
Fair value recognized in
equity
Fair value recognized in profit or loss
Measurement in the statement of financial position
under IAS 17Fair value
9/30/2015
Assets
Interests in affiliated companies AfS 1,418 1,418 0 0 0 n/a 1,418 1,418 0 0 0 n/a
Investments AfS 637 637 0 0 0 n/a 744 744 0 0 0 n/a
Fixed asset securities AfS 21,311 0 21,311 0 0 21,311 24,318 0 24,318 0 0 24,318
Other financial fixed assets
Other loans LaR 48 48 0 0 0 48 92 92 0 0 0 92
Trade accounts receivable LaR 242,106 242,106 0 0 0 242,106 306,905 306,905 0 0 0 306,905
Other receivables and financial assets
Receivables from related parties LaR 14,575 14,575 0 0 0 14,575 12,057 12,057 0 0 0 12,057
Other financial assets LaR 51,147 51,147 0 0 0 51,147 78,926 78,926 0 0 0 78,926
Derivative financial assets
Derivatives without a hedging relationship FAHfT 30,356 0 0 30,356 0 30,356 61,629 0 0 61,629 0 61,629
Derivatives with a hedging relationship (hedge accounting) n/a 2,488 0 2,488 0 0 2,488 513 0 513 0 0 513
Cash and cash equivalents LaR 471,874 471,874 0 0 0 471,874 452,971 452,971 0 0 0 452,971
Equity and liabilities
Bank borrowings FLAC 477,434 477,434 0 0 0 493,376 487,187 487,187 0 0 0 501,927
Liabilities from finance leases n/a 17,809 0 0 0 17,809 17,809 18,912 0 0 0 18,912 18,912
Trade accounts payable FLAC 797,710 797,710 0 0 0 797,710 761,409 761,409 0 0 0 761,409
Payables to related parties FLAC 2.157 2,157 0 0 0 2,157 5,613 5,613 0 0 0 5,613
Other non-derivative financial liabilities FLAC 83,693 83,693 0 0 0 83,693 69,301 69,301 0 0 0 69,301
Derivative financial liabilities
Derivatives without a hedging relationship FLHfT 35,232 0 0 35,232 0 35,232 108,835 0 0 108,835 0 108,835
Derivatives with a hedging relationship (hedge accounting) n/a 7,462 0 7,462 0 0 7,462 30,889 0 30,889 0 0 30,889
thereof aggregated by measurement categories in accordance with IAS 39
Loans and receivables (LaR) 779,750 779,750 0 0 0 779,750 850,951 850,951 0 0 0 850,951
Available-for-sale (AfS) 23,366 2,055 21,311 0 0 21,311 26,480 2,162 24,318 0 0 24,318
Financial assets held for trading (FAHfT) 30,356 0 0 30,356 0 30,356 61,629 0 0 61,629 0 61,629
Financial liabilities at amortized cost (FLAC) 1,360,994 1,360,994 0 0 0 1,376,936 1,323,510 1,323,510 0 0 0 1,338,250
Financial liabilities held for trading (FLHfT) 35,232 0 0 35,232 0 35,232 108,835 0 0 108,835 0 108,835
¤ T 099
170 Notes to the Consolidated Financial Statements
Aurubis Annual Report 2015/16

Additional disclosures for financial instruments
2015/16 2014/15
Measurement in the statement of financial position under IAS 39
Measurement in the statement of financial position under IAS 39
Carrying amounts, measurement and fair values analyzed by measurement categoriesin € thousand
Measurement category under IAS 39
Carrying amount
9/30/2016Amortized
cost
Fair value recognized in
equity
Fair value recognized in profit or loss
Measurement in the statement
of financial position under
IAS 17Fair value
9/30/2016Carrying amount
9/30/2015 Amortized cost
Fair value recognized in
equity
Fair value recognized in profit or loss
Measurement in the statement of financial position
under IAS 17Fair value
9/30/2015
Assets
Interests in affiliated companies AfS 1,418 1,418 0 0 0 n/a 1,418 1,418 0 0 0 n/a
Investments AfS 637 637 0 0 0 n/a 744 744 0 0 0 n/a
Fixed asset securities AfS 21,311 0 21,311 0 0 21,311 24,318 0 24,318 0 0 24,318
Other financial fixed assets
Other loans LaR 48 48 0 0 0 48 92 92 0 0 0 92
Trade accounts receivable LaR 242,106 242,106 0 0 0 242,106 306,905 306,905 0 0 0 306,905
Other receivables and financial assets
Receivables from related parties LaR 14,575 14,575 0 0 0 14,575 12,057 12,057 0 0 0 12,057
Other financial assets LaR 51,147 51,147 0 0 0 51,147 78,926 78,926 0 0 0 78,926
Derivative financial assets
Derivatives without a hedging relationship FAHfT 30,356 0 0 30,356 0 30,356 61,629 0 0 61,629 0 61,629
Derivatives with a hedging relationship (hedge accounting) n/a 2,488 0 2,488 0 0 2,488 513 0 513 0 0 513
Cash and cash equivalents LaR 471,874 471,874 0 0 0 471,874 452,971 452,971 0 0 0 452,971
Equity and liabilities
Bank borrowings FLAC 477,434 477,434 0 0 0 493,376 487,187 487,187 0 0 0 501,927
Liabilities from finance leases n/a 17,809 0 0 0 17,809 17,809 18,912 0 0 0 18,912 18,912
Trade accounts payable FLAC 797,710 797,710 0 0 0 797,710 761,409 761,409 0 0 0 761,409
Payables to related parties FLAC 2.157 2,157 0 0 0 2,157 5,613 5,613 0 0 0 5,613
Other non-derivative financial liabilities FLAC 83,693 83,693 0 0 0 83,693 69,301 69,301 0 0 0 69,301
Derivative financial liabilities
Derivatives without a hedging relationship FLHfT 35,232 0 0 35,232 0 35,232 108,835 0 0 108,835 0 108,835
Derivatives with a hedging relationship (hedge accounting) n/a 7,462 0 7,462 0 0 7,462 30,889 0 30,889 0 0 30,889
thereof aggregated by measurement categories in accordance with IAS 39
Loans and receivables (LaR) 779,750 779,750 0 0 0 779,750 850,951 850,951 0 0 0 850,951
Available-for-sale (AfS) 23,366 2,055 21,311 0 0 21,311 26,480 2,162 24,318 0 0 24,318
Financial assets held for trading (FAHfT) 30,356 0 0 30,356 0 30,356 61,629 0 0 61,629 0 61,629
Financial liabilities at amortized cost (FLAC) 1,360,994 1,360,994 0 0 0 1,376,936 1,323,510 1,323,510 0 0 0 1,338,250
Financial liabilities held for trading (FLHfT) 35,232 0 0 35,232 0 35,232 108,835 0 0 108,835 0 108,835
¤ T 099
112 Consolidated Income Statement1 13 Consolidated Statement of
Comprehensive Income114 Consolidated Statement of
Financial Position
116 Consolidated Cash Flow Statement117 Consolidated Statement of
Changes in Equity118 Notes to the Consolidated
Financial Statements
Consolidated Financial Statements 171
Aurubis Annual Report 2015/16
192 Responsibility Statement193 Auditors’ Report

The market value of financial instruments to be recognized at fair value is as a general rule determined on the basis of quotations on the metal or other relevant exchanges. If no such quotations are available, measurement is carried out applying a process that is customary for the market (measurement methods), based on instrument-specific market parameters and interest rates drawn from recognized sources.
If observable input parameters are not available or only partially available, the fair value is calculated on the basis of appropriate measurement methods. In the Aurubis Group, this applies in particular to the extrapolation of market data for electricity and coal, with due regard to market information about price determination and liquidity considerations. If insufficient market information is available, management’s best estimate for a certain input parameter is used to determine the value. Thus, if observable input parameters are not available or only partially available on the market, the measurement process is significantly influenced by the use of estimates and assumptions.
Due to the predominantly short-term nature of cash and cash equivalents, trade accounts receivable and payable, other receivables of the category “loans and receivables”, payables to related parties and other non-derivative financial liabilities, an assumption is made that the fair values correspond to the carrying amounts.
An assumption has been made for investments in non-corporate entities and non-quoted corporate entities that the carrying amount corresponds to the market value. It would only be possible to reliably determine the market value in conjunction with specific sales negotiations.
Pursuant to IFRS 13, the following tables show the measurement methods used to determine the fair value for Level 1, Level 2 and Level 3 as well as the main non-observable parameters that were used for measurement.
In this connection, the individual levels were defined in accordance with IFRS 13 as follows:
» Level 1: quoted prices (unadjusted) in active markets for identical assets or liabilities
» Level 2: procedures under which all input parameters with a significant effect on the fair value are observable either directly or indirectly in the market
» Level 3: procedures that use input parameters which have a significant influence on the fair value and are not based on observable market data
Financial instruments from Level 1 measured at fair value
Type Measurement method
Securities classified as fixed assets Exchange prices
¤ T 100
172 Notes to the Consolidated Financial Statements
Aurubis Annual Report 2015/16

Financial instruments from Level 2 measured at fair value
Type Measurement method and applied input parameters
Forward foreign exchange contracts
Par method, taking into account actively traded forward rates and the currently valid interest rate for discounting purposes as at the balance sheet date
Foreign currency options Black-Scholes model. Calculation based on the exchange rates as at the balance sheet date, taking into account the expected volatility of the respective exchange rate during the term of the option and customary market interest rates
Interest rate swaps Discounted cash flow method. This adds together the present value of the expected future cash flows and discounts them, utilizing a market-conform interest rate
Metal futures contracts Discounted cash flow method, taking into account actively traded metal forward rates and customary market interest rates for discounting purposes as at the balance sheet date
Other transactions Discounted cash flow method. Discounting of the expected future cash flows over the remaining term of the contracts, based on use of current market interest rates
Financial instruments from Level 2 not measured at fair value
Type Measurement method and applied input parameters
Financial liabilities
Discounted cash flow method. Discounting of expected future cash flows with currently applicable interest rates for financial liabilities with comparable conditions and residual terms
Financial instruments from Level 3 measured at fair value
Type Measurement methodSignificant non-observable measurement parameters
Interdependence between significant non- observable measurement parameters and fair value
Energy supply contract
Discounted cash flow method
Extrapolation of market data for electricity and coal
The fair value would be higher (lower) if: – the price for electricity increased more
(less) than expected– the price for coal increased less (more)
than expected
¤ T 101
¤ T 102
¤ T 103
112 Consolidated Income Statement1 13 Consolidated Statement of
Comprehensive Income114 Consolidated Statement of
Financial Position
116 Consolidated Cash Flow Statement117 Consolidated Statement of
Changes in Equity118 Notes to the Consolidated
Financial Statements
Consolidated Financial Statements 173
Aurubis Annual Report 2015/16
192 Responsibility Statement193 Auditors’ Report

If the parameters used for measurement fall into different levels of the measurement hierarchy, the fair value measurement is fully classified as belonging to the lowest level to which an input parameter is attributed, where this parameter significantly influences the entire fair value.
If there are any reclassifications to other levels in the measurement hierarchy, the Aurubis Group accounts for these as at the beginning of the relevant fiscal year.
The following overview shows the main measurement parameters that provide the basis for those financial instruments that are accounted for at fair value and presented in the notes to the financial statements.
Hierarchical classification of fair values of financial instruments in accordance with IFRS 7 as at September 30, 2016
Aggregated by classes in € thousand
Fair value 9/30/2016 Level 1 Level 2 Level 3
Securities classified as fixed assets 21,311 21,311 0 0
Derivative financial assets
Derivatives without a hedging relationship 30,356 0 30,356 0
Derivatives with a hedging relationship 2,488 0 2,488 0
Assets 54,155 21,311 32,844 0
Bank borrowings 493,376 0 493,376 0
Derivative financial liabilities
Derivatives without a hedging relationship 35,232 0 18,456 16,776
Derivatives with a hedging relationship 7,462 0 7,462 0
Liabilities 536,070 0 519,294 16,776
¤ T 104
174 Notes to the Consolidated Financial Statements
Aurubis Annual Report 2015/16

Hierarchical classification of fair values of financial instruments in accordance with IFRS 7 as at September 30, 2015
Aggregated by classes in € thousand
Fair value 9/30/2015 Level 1 Level 2 Level 3
Securities classified as fixed assets 24,318 24,318 0 0
Derivative financial assets
Derivatives without a hedging relationship 61,629 0 61,629 0
Derivatives with a hedging relationship 513 0 513 0
Assets 86,460 24,318 62,142 0
Bank borrowings 501,927 0 501,927 0
Derivative financial liabilities
Derivatives without a hedging relationship 108,835 0 89,531 19,304
Derivatives with a hedging relationship 30,889 0 30,889 0
Liabilities 641,651 0 622,347 19,304
There were no reclassifications between the individual levels in fiscal year 2015/16 or in the previous year.
¤ T 105
112 Consolidated Income Statement1 13 Consolidated Statement of
Comprehensive Income114 Consolidated Statement of
Financial Position
116 Consolidated Cash Flow Statement117 Consolidated Statement of
Changes in Equity118 Notes to the Consolidated
Financial Statements
Consolidated Financial Statements 175
Aurubis Annual Report 2015/16
192 Responsibility Statement193 Auditors’ Report

The following overview shows a reconciliation of the financial instruments measured at fair value and classified in Level 3:
Reconciliation of financial instruments in Level 3 as at September 30, 2016
Aggregated by classes in € thousand
Status at 10/1/2015
Profits (+)/ losses (–)
recorded in the income statement
Status at 9/30/2016
Profits (+)/losses (–) for
derivatives held at the balance
sheet date
Derivative liabilities without a hedging relationship (19,304) 2,528 (16,776) 2,528
Reconciliation of financial instruments in Level 3 as at September 30, 2015
Aggregated by classes in € thousand
Status at 10/1/2014
Profits (+)/ losses (–)
recorded in the income statement
Status at 9/30/2015
Profits (+)/losses (–) for
derivatives held at the balance
sheet date
Derivative liabilities without a hedging relationship (15,613) (3,691) (19,304) (3,691)
Gains and losses deriving from derivative financial instruments classified as Level 3, which concern part of an energy supply contract, are reflected in the income statement reporting line “Cost of materials”.
¤ T 106
¤ T 107
The value of these financial instruments is partially based on non- observable input parameters, which are largely related to the price of electricity and coal. If the Aurubis Group had taken possible alternative measurement parameters as a basis for measuring the
176 Notes to the Consolidated Financial Statements
Aurubis Annual Report 2015/16

relevant financial instruments on September 30, 2016, the recorded fair value would have been € 7,965 thousand (previous year: € 6,407 thousand) higher in the case of an increase in the electricity price and a decrease in the coal price by 20 % respectively at the end of the term or € 6,337 thousand (previous year: € 4,792 thousand) lower in the case of a decrease in the electricity price and an increase in the coal price by 20 % respectively at the end of the term. In order to calculate the maximum impacts which can arise from the relative uncertainty in the determination of the fair values of financial instruments whose measurement is based on non-observable parameters, the Aurubis Group remeasures such financial instruments by incorporating parameters that are at the outer limits of the range of possible alternatives for non- observable input data. Since it is nevertheless unlikely that a scenario will arise in which all of the non-observable parameters are at the outer limits of the range of possible
alternatives at the same time, the estimated values previously mentioned should exceed the actual uncertainty factors when determining the fair value as at the balance sheet date. Thus, the disclosures shown do not represent a prediction or an indication of any future changes in the fair value.
Offsetting options for derivative financial assets and liabilities The financial instruments that Aurubis enters into are subject to netting agreements with financial institutions that include a mutual right of offset. However, these agreements do not fulfill the criteria for offsetting in the statement of financial position, as the netting right can only be utilized if one of the contracting parties defaults.
The following table shows the financial assets and liabilities in the Aurubis Group that are subject to offsetting options.
Offsetting options for derivative financial assets and liabilities
in € thousand 2015/16 2014/15
Financial assets
Gross amounts of financial assets in the statement of financial position 32,845 62,142
Financial instruments that qualify for offsetting in the statement of financial position 0 0
Net values of financial assets in the statement of financial position 32,845 62,142
Offsettable due to framework agreements (9,994) (28,112)
Total net value of financial assets 22,851 34,030
Financial liabilities
Gross amounts of financial liabilities in the statement of financial position (42,694) (139,724)
Financial instruments that qualify for offsetting in the statement of financial position 0 0
Net values of financial liabilities in the statement of financial position (42,694) (139,724)
Offsettable due to framework agreements 9,994 28,112
Total net value of financial liabilities (32,700) (111,612)
¤ T 108
112 Consolidated Income Statement1 13 Consolidated Statement of
Comprehensive Income114 Consolidated Statement of
Financial Position
116 Consolidated Cash Flow Statement117 Consolidated Statement of
Changes in Equity118 Notes to the Consolidated
Financial Statements
Consolidated Financial Statements 177
Aurubis Annual Report 2015/16
192 Responsibility Statement193 Auditors’ Report

Net earnings by measurement categories
in € thousand 2015/16 2014/15
Loans and receivables (LaR) 16,033 8,566
Available-for-sale (AfS) 183 (3,897)
Financial instruments held for trading (FAHfT and FLHfT) 82,195 (4,641)
Financial liabilities at amortized cost (FLAC) 5,363 3,753
103,774 3,781
The net earnings of the financial instruments held for trading mainly include the gains/losses deriving from metal futures contracts on the exchanges and forward foreign exchange contracts, as well as from price-fixed metal delivery transactions treated as derivatives. Purchase or sales contracts that are not yet fixed, which result in a partial compensation effect since they are measured provisionally at the respective price on the reporting date, are not included. Dividends, but not interest, are included in the calculated earnings. The foreign currency result of the items accounted for at amortized cost, which are included in the net result in fiscal year 2015/16, amounted to € 23,083 thousand (previous year: € 12,155 thousand).
In conjunction with the recognition in equity of the change in value of “available-for-sale” financial assets, net measurement impacts of € 5,092 thousand (previous year: € –1,585 thousand) were recorded in other comprehensive income in fiscal year 2015/16.
31. Research and developmentResearch and development costs of € 12,733 thousand were recognized in profit or loss for the Aurubis Group for fiscal year 2015/16 (previous year: € 10,474 thousand).
¤ T 109
178 Notes to the Consolidated Financial Statements
Aurubis Annual Report 2015/16

Notes to the cash flow statement
The cash flow statement reports the cash flows in the Aurubis Group in fiscal year 2015/16 and in the prior-year comparative period. In accordance with IAS 7, a distinction was made between the cash inflow from operating activities, the cash outflow from investing activities and the cash outflow or inflow from financing activities.
Commencing with earnings before taxes, adjustment was made for all non-cash expenses and income, the financial result (consisting of the result from investments measured using the equity method, interest expense, interest income and other financial expenses and income), income taxes paid out and changes in working capital to arrive at the cash inflow from operating activities (net cash flow).
The net cash flow as at September 30, 2016 amounted to € 236 million, compared to € 365 million in the previous year. The decline in the net cash flow resulted from the lower result and higher inventories of intermediates.
Investments in fixed assets (including financial fixed assets) amounted to € 143 million in the reporting period (previous year: € 112 million). The largest individual investments were made in connection with the shutdown in Pirdop, Bulgaria.
A free cash flow of € 93 million (previous year: € 253 million) resulted after deducting investments in fixed assets from the net cash flow. The cash outflow from investing activities totaled € 128 million (previous year: € 104 million).
The cash outflow from financing activities was € 89 million compared to a cash inflow of € 4 million in the previous fiscal year.
Overall, the Group had cash and cash equivalents of € 472 million available as at September 30, 2016 (€ 453 million as at September 30, 2015). Cash and cash equivalents are utilized in particular for operating business activities, investing activities and repayment of borrowings.
112 Consolidated Income Statement1 13 Consolidated Statement of
Comprehensive Income114 Consolidated Statement of
Financial Position
116 Consolidated Cash Flow Statement117 Consolidated Statement of
Changes in Equity118 Notes to the Consolidated
Financial Statements
Consolidated Financial Statements 179
Aurubis Annual Report 2015/16
192 Responsibility Statement193 Auditors’ Report

Segment reporting
Primary Copper segment Copper Products segment Other Total Reconciliation/consolidation Group total
in € thousand2015/2016
operating2014/2015
operating2015/2016
operating2014/2015
operating2015/2016
operating2014/2015
operating 2015/2016
operating2014/2015
operating2015/2016
IFRS2014/2015
IFRS2015/2016
IFRS2014/2015
IFRS
Revenues
Total revenues 5,325,180 5,914,239 7,531,198 8,585,989 11,670 12,492
Inter-segment revenues 2,788,892 3,240,790 601,851 273,658 2,599 3,071
Revenues with third parties 2,536,288 2,673,448 6,929,347 8,312,332 9,071 9,421 9,474,706 10,995,202 0 0 9,474,706 10,995,202
EBITDA 237,827 357,207 150,658 181,348 (30,672) (39,404) 357,813 499,152 (46,191) (163,465) 311,622 335,687
Depreciation and amortization (83,496) (85,849) (44,403) (43,575) (974) (656) (128,873) (130,079) (5,930) (6,327) (134,803) (136,406)
EBIT 154,331 271,359 106,254 137,774 (31,645) (40,059) 228,940 369,073 (52,121) (169,792) 176,819 199,281
Interest income 4,346 2,736 8,471 13,561 60 19 12,877 16,316 (10,009) (12,725) 2,868 3,591
Interest expense (15,925) (17,870) (21,416) (25,641) (41) (154) (37,382) (43,665) 10,009 12,725 (27,373) (30,940)
Result from investments measured using the equity method 0 0 7,536 4,416 0 0 7,536 4,416 (1,185) (3,013) 6,351 1,403
Other financial income 0 0 5 5 252 220 257 225 0 0 257 225
Other financial expense (100) 0 (7) 0 0 (4,116) (107) (4,116) 0 0 (107) (4,116)
Earnings before taxes 142,652 256,224 100,842 130,115 (31,373) (44,090) 212,121 342,249 (53,306) (172,805) 158,815 169,444
Income taxes (35,296) (35,876)
Consolidated net income 123,519 133,568
Return on capital employed (ROCE) (in %) 16.4 33.2 9.7 12.4
Capital expenditure on intangible assets and property, plant and equipment 103,524 70,203 40,375 41,455 0 0 143,899 111,657 0 0 143,899 111,657
Average number of employees 2,750 2,730 3,335 3,330 270 257 6,355 6,317 0 0 6,355 6,317
Certain prior-year figures have been adjusted.
¤ T 110
180 Notes to the Consolidated Financial Statements
Aurubis Annual Report 2015/16

Segment reporting
Primary Copper segment Copper Products segment Other Total Reconciliation/consolidation Group total
in € thousand2015/2016
operating2014/2015
operating2015/2016
operating2014/2015
operating2015/2016
operating2014/2015
operating 2015/2016
operating2014/2015
operating2015/2016
IFRS2014/2015
IFRS2015/2016
IFRS2014/2015
IFRS
Revenues
Total revenues 5,325,180 5,914,239 7,531,198 8,585,989 11,670 12,492
Inter-segment revenues 2,788,892 3,240,790 601,851 273,658 2,599 3,071
Revenues with third parties 2,536,288 2,673,448 6,929,347 8,312,332 9,071 9,421 9,474,706 10,995,202 0 0 9,474,706 10,995,202
EBITDA 237,827 357,207 150,658 181,348 (30,672) (39,404) 357,813 499,152 (46,191) (163,465) 311,622 335,687
Depreciation and amortization (83,496) (85,849) (44,403) (43,575) (974) (656) (128,873) (130,079) (5,930) (6,327) (134,803) (136,406)
EBIT 154,331 271,359 106,254 137,774 (31,645) (40,059) 228,940 369,073 (52,121) (169,792) 176,819 199,281
Interest income 4,346 2,736 8,471 13,561 60 19 12,877 16,316 (10,009) (12,725) 2,868 3,591
Interest expense (15,925) (17,870) (21,416) (25,641) (41) (154) (37,382) (43,665) 10,009 12,725 (27,373) (30,940)
Result from investments measured using the equity method 0 0 7,536 4,416 0 0 7,536 4,416 (1,185) (3,013) 6,351 1,403
Other financial income 0 0 5 5 252 220 257 225 0 0 257 225
Other financial expense (100) 0 (7) 0 0 (4,116) (107) (4,116) 0 0 (107) (4,116)
Earnings before taxes 142,652 256,224 100,842 130,115 (31,373) (44,090) 212,121 342,249 (53,306) (172,805) 158,815 169,444
Income taxes (35,296) (35,876)
Consolidated net income 123,519 133,568
Return on capital employed (ROCE) (in %) 16.4 33.2 9.7 12.4
Capital expenditure on intangible assets and property, plant and equipment 103,524 70,203 40,375 41,455 0 0 143,899 111,657 0 0 143,899 111,657
Average number of employees 2,750 2,730 3,335 3,330 270 257 6,355 6,317 0 0 6,355 6,317
Certain prior-year figures have been adjusted.
¤ T 110
112 Consolidated Income Statement1 13 Consolidated Statement of
Comprehensive Income114 Consolidated Statement of
Financial Position
116 Consolidated Cash Flow Statement117 Consolidated Statement of
Changes in Equity118 Notes to the Consolidated
Financial Statements
Consolidated Financial Statements 181
Aurubis Annual Report 2015/16
192 Responsibility Statement193 Auditors’ Report

We report on the operating segments in the same way as in the internal reporting to the chief operating decision makers. The chief operating decision makers are defined as the Executive Board of Aurubis AG.
The Aurubis Group is divided into two reportable segments, which differ as regards their production processes or their products and which are managed separately. The “other” column discloses central administrative income and costs that cannot be directly allocated to one of the reportable segments.
The internal reporting is generally based on the accounting policies in accordance with IFRS, which are applied in the consolidated financial statements. For internal management purposes, the IFRS-based results are reconciled to the operating result. The operating result of the Group and of the respective Business Unit is determined by adjusting the IFRS-based results for:
» Measurement impacts deriving from the use of the average cost method in accordance with IAS 2,
» Copper price-related measurement effects on inventories, » Effects deriving from purchase price allocations, primarily on
fixed assets, commencing in fiscal year 2010/11.
The presentation of the segment reporting corresponds to the internal reporting.
The reconciliation to the IFRS-based consolidated financial statements is shown in the reconciliation/consolidation column. In this connection, a total of € 524 thousand (previous year: € 452 thousand) of earnings before taxes derived from consolidation impacts, while € –53,830 thousand (previous year. € –173,257 thousand) derives from reconciliation to the IFRS EBT.
The Group generates most of its revenues with business associates in countries within the European Union. The breakdown of revenues by regions is based on the location of the customers, and is as follows:
in € thousand 2015/16 2014/15
Germany 3,306,555 3,581,806
Other European Union countries 3,576,941 4,128,565
Rest of Europe 316,060 269,375
Asia 1,087,737 1,626,442
America 774,556 935,792
Other 412,857 453,222
Group total 9,474,706 10,995,202
¤ T 111
182 Notes to the Consolidated Financial Statements
Aurubis Annual Report 2015/16

The breakdown of capital expenditure and non-current assets by regions is based on the location of the respective assets:
Capital expenditure Assets
in € thousand 2015/16 2014/15 2015/16 2014/15
Germany 59,052 59,947 812,079 819,417
Bulgaria 57,640 29,476 347,287 332,777
Belgium 12,175 9,878 168,754 174,331
Other European countries 8,456 4,729 77,329 68,029
North America 5,819 7,717 44,386 45,875
Group total 143,143 111,747 1,449,836 1,440,429
The locations in other European countries are mainly business sites within the European Union.
Primary Copper segmentCopper production ranges from the procurement of copper-bearing and precious metal-bearing raw materials to the production of marketable metals. In the Primary Copper segment, copper concentrates are mainly used as the raw material for copper production.
¤ T 112
The products are copper cathodes that can be traded on the metal exchanges, as well as gold and silver products that originate from additionally processed precious metal-bearing raw materials. During the copper production process, a variety of products, derived from the natural by-elements in the raw materials, are produced and sold in this segment, such as sulfuric acid and iron silicate stone. Furthermore, the Primary Copper segment produces high-quality selenium products.
112 Consolidated Income Statement1 13 Consolidated Statement of
Comprehensive Income114 Consolidated Statement of
Financial Position
116 Consolidated Cash Flow Statement117 Consolidated Statement of
Changes in Equity118 Notes to the Consolidated
Financial Statements
Consolidated Financial Statements 183
Aurubis Annual Report 2015/16
192 Responsibility Statement193 Auditors’ Report

Revenues in the Primary Copper segment consist both of revenues generated within the Group (since all of the copper cathodes produced are sold to the Copper Products segment) and of sales of precious metals to external customers. In addition, sulfuric acid and iron silicate stone are sold to external customers.
Copper Products segmentThe Copper Products segment includes copper production from copper-bearing recycling materials and all sectors involved in the production and marketing of wire rod, continuous cast shapes, strip and profiles, as well as specialty products. The copper cathodes produced in this segment and the Primary Copper segment mainly serve as the starting products for these products. Products produced by this segment are sold to customers worldwide.
Segment dataThe revenues of the individual segments consist of inter-segment revenues and of revenues with third parties outside the Group. The total third party revenues of the individual segments correspond to the consolidated revenues of the Group. The prices and conditions for products and services exchanged between Group companies and segments correspond to those with non-related parties.
A breakdown of the revenues by product groups is provided in the information on revenues (Note 1).
Operating EBIT (earnings before interest and taxes) represents operating earnings before taxes, adjusted for the financial result attributable to the segment. Based on this, operating EBITDA (earnings before interest, taxes, depreciation and amortization) is operating EBIT adjusted for depreciation and amortization on intangible assets and property, plant and equipment belonging to the segment.
In total, reversals of impairment losses amounting to € 15,773 thousand were made in respect of assets (previous year: impairment losses of € 14,612 thousand), comprising reversals of impairment losses of € 10,849 thousand relating to the Primary Copper segment (previous year: impairment losses of € 9,346 thousand) and reversals of impairment losses of € 4,924 thousand relating to the Copper Products segment (previous year: impairment losses of € 5,266 thousand). As was the case with the impairment losses in the previous year, the reversals of impairment losses in the Primary Copper segment related exclusively to reversals of impairment losses (previous year: impairment losses) on current assets. In the Copper Products segment, current assets accounted for all reversals of impairment losses; in contrast, in the previous year impairment losses of € 2,648 thousand had been recognized on fixed assets in accordance with IAS 36.
The average number of employees for each segment included all the employees of companies that were fully consolidated in the accompanying financial statements.
184 Notes to the Consolidated Financial Statements
Aurubis Annual Report 2015/16
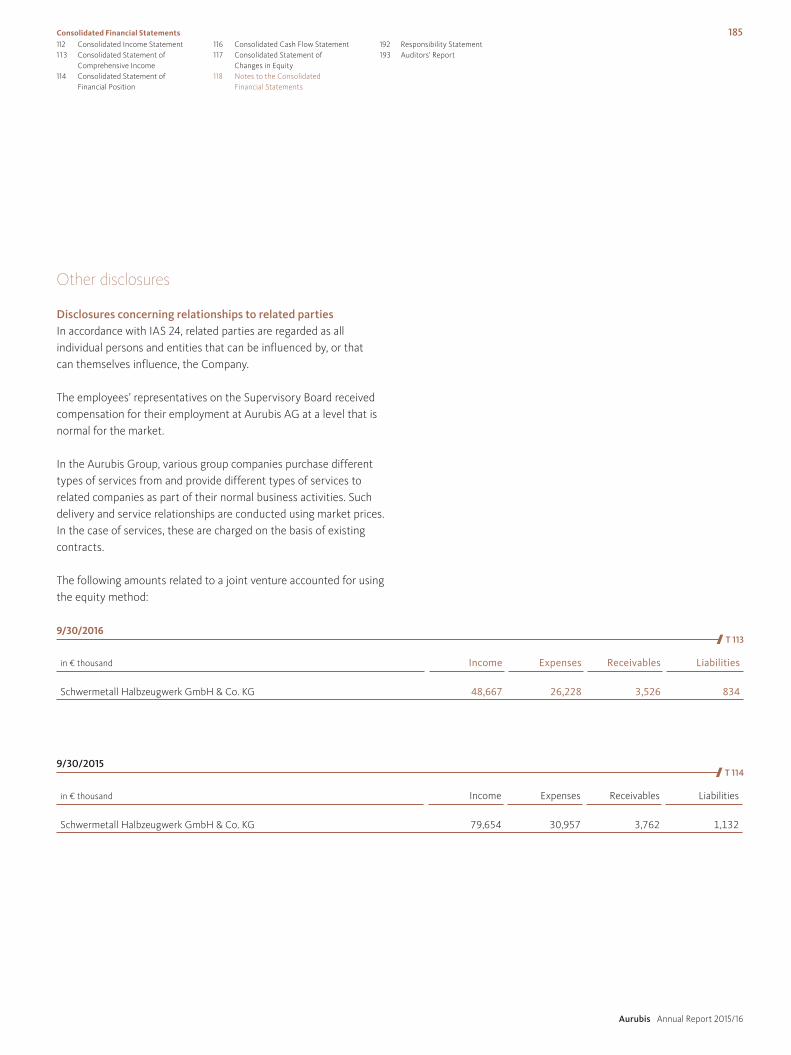
Other disclosures
Disclosures concerning relationships to related partiesIn accordance with IAS 24, related parties are regarded as all individual persons and entities that can be influenced by, or that can themselves influence, the Company.
The employees’ representatives on the Supervisory Board received compensation for their employment at Aurubis AG at a level that is normal for the market.
In the Aurubis Group, various group companies purchase different types of services from and provide different types of services to related companies as part of their normal business activities. Such delivery and service relationships are conducted using market prices. In the case of services, these are charged on the basis of existing contracts.
The following amounts related to a joint venture accounted for using the equity method:
9/30/2016
in € thousand Income Expenses Receivables Liabilities
Schwermetall Halbzeugwerk GmbH & Co. KG 48,667 26,228 3,526 834
9/30/2015
in € thousand Income Expenses Receivables Liabilities
Schwermetall Halbzeugwerk GmbH & Co. KG 79,654 30,957 3,762 1,132
¤ T 113
¤ T 114
112 Consolidated Income Statement1 13 Consolidated Statement of
Comprehensive Income114 Consolidated Statement of
Financial Position
116 Consolidated Cash Flow Statement117 Consolidated Statement of
Changes in Equity118 Notes to the Consolidated
Financial Statements
Consolidated Financial Statements 185
Aurubis Annual Report 2015/16
192 Responsibility Statement193 Auditors’ Report

The following amounts relate to non-consolidated related companies:
9/30/2016
in € thousand Income Expenses Receivables Liabilities
Joint ventures 49 6,824 48 0
Subsidiaries 4,296 1,564 2,587 1,233
9/30/2015
in € thousand Income Expenses Receivables Liabilities
Joint ventures 6 152,977 0 3,240
Subsidiaries 3,333 1,667 1,986 1,195
With the exception of Salzgitter AG, no individual shareholders of Aurubis AG exercise a significant influence on the Aurubis Group.
Salzgitter Group companies accounted for € 1,998 thousand in expenses (previous year: € 3,959 thousand) during the fiscal year. At the balance sheet date, there were related liabilities of € 116 thousand (previous year: € 243 thousand).
¤ T 115
¤ T 116
At the balance sheet date, no letters of comfort (previous year: € 6,000 thousand) had been issued to related parties. The letter of comfort that was in place as at the prior-year balance sheet date to secure bank liabilities of C.M.R. International N.V., Antwerp, a joint venture that is not included in the scope of the consolidation, was revoked.
186 Notes to the Consolidated Financial Statements
Aurubis Annual Report 2015/16

Disclosures concerning the Executive Board and Supervisory BoardTotal compensationThe total compensation of the active Executive Board members for fiscal year 2015/16 amounted to € 3,325,289 and included a fixed component of € 988,000, fringe benefits of € 41,823 and a variable component of € 1,523,960. In addition, expenditures for pension provisions in the amount of € 771,506 were recognized in the income statement. Special compensation of € 225,000 was granted as well.
Former members of the Executive Board and their surviving dependents received a total of € 2,210,800, while € 24,608,243 has been provided for their pension entitlement.
The compensation of the Supervisory Board for fiscal year 2015/16 amounted in total to € 1,467,342.
Details of the individual compensation of the members of the Executive Board and the Supervisory Board are provided in the compensation report.
Share ownershipMembers of the Supervisory Board held 5,905 shares (previous year: 4,031 shares) and members of the Executive Board held 6,150 shares (previous year: 2,400 shares) in Aurubis AG.
Reportable securities transactionsDirectors’ dealingsIn accordance with Section 15a German Securities Trading Act (WpHG, previous version) and Art. 19 Market Abuse Regulation (EU No 596/2014), the members of the Executive Board and the Supervisory Board must disclose the acquisition and sale of shares in the Company. This does not apply if the total transactions per person do not reach an amount of € 5,000 per calendar year.
One member of the Supervisory Board carried out share transactions in the period from October 1, 2015 to September 30, 2016:
» Prof. Dr. Fritz Vahrenholt: purchased 1,000 no-par-value shares.
The following members of the Executive Board informed the Company that they had acquired or sold no-par-value shares in the Company in the period from October 1, 2015 to September 30, 2016:
» Mr. Erwin Faust: purchased 5,000 no-par-value shares. » Dr. Stefan Boel: purchased 2,750 no-par value shares. » Mr. Erwin Faust: sold 5,000 no-par-value shares.
The Executive Board and Supervisory Board hold less than 1 % of the shares issued by the Company.
Declaration of conformity with the German Corporate Governance Code in accordance with Section 161 German Stock Corporation Act (AktG)The declaration required under Section 161 German Stock Corporation Act (AktG) has been issued by the Executive Board and the Supervisory Board and has been made accessible to the shareholders on the Company’s website.
112 Consolidated Income Statement1 13 Consolidated Statement of
Comprehensive Income114 Consolidated Statement of
Financial Position
116 Consolidated Cash Flow Statement117 Consolidated Statement of
Changes in Equity118 Notes to the Consolidated
Financial Statements
Consolidated Financial Statements 187
Aurubis Annual Report 2015/16
192 Responsibility Statement193 Auditors’ Report

ShareholdersStake
in %Relevant
threshold dateDate of
publication
Norges Bank, Oslo, Norway 1) 2.92 4/25/2016 4/29/2016
Norges Bank, Oslo, Norway 1) 3.09 5/2/2016 5/4/2016
Norges Bank (status notification) 1) 3.67 8/19/2016 9/5/20161) The shares are attributable to the state of Norway, represented by its
Ministry of Finance; the transaction was conducted via the Norges Bank.2) Held directly, or indirectly through subsidiaries. 3) The shares are attributable to Salzgitter AG, Salzgitter. The voting rights notifications are available at: www.aurubis.com/en/en/corp/about-aurubis/corporate-governance/ voting-rights-notifications.
Section 25 German Securities Trading Act (WpHG) includes a comparable notification obligation corresponding to Section 21 (1) German Securities Trading Act (WpHG) with respect to financial instruments that grant their owner an unconditional right to unilateral acquisition of shares with voting rights. Moreover, Section 25a German Securities Trading Act (WpHG) introduced an additional notification obligation as of February 1, 2012: this extends to financial and other instruments that enable their owner, either effectively or economically, to acquire shares with associated voting rights. The notifications submitted to the Company in accordance with Sections 25 and 25a German Securities Trading Act can be accessed via the Company’s website or via the online platform of the Deutsche Gesellschaft für Ad-hoc-Publizität.
Notifications pursuant to Section 160 (1) No. 8 German Stock Corporation Act (AktG)As at September 30, 2016, we had received the following voting rights notifications from shareholders with respect to exceeding and falling below the respective notification thresholds of 3 %, 5 % and 25 % in accordance with Section 21 (1) German Securities Trading Act (WpHG):
Shareholder structure
ShareholdersStake
in %Relevant
threshold dateDate of
publication
Dimensional Holdings Inc., Santa Monica, USA 3.01 1/21/2008 2/4/2008
Salzgitter Mannesmann GmbH, Salzgitter 3) 25.002 8/29/2011 8/29/2011
UBS AG, Zurich, Switzerland 4.99 3/4/2013 3/20/2013
Norges Bank, Oslo, Norway 1) 2.99 11/2/2015 11/5/2015
Norges Bank, Oslo, Norway 1) 3.10 11/20/2015 11/26/2015
Norges Bank, Oslo, Norway 1) 2.749 12/10/2015 12/14/2015
JP Morgan Asset Management (UK) Limited 1.96 12/11/2015 12/18/2015
BlackRock, Inc., Wilmington, DE, USA 2) 3.03 1/13/2016 1/21/2016
BlackRock, Inc., Wilmington, DE, USA 2) 2.997 1/22/2016 1/28/2016
BlackRock, Inc., Wilmington, DE, USA 2) 3.0003 1/25/2016 1/29/2016
BlackRock, Inc. (voluntary company notification) 2) 3.08 1/26/2016 2/1/2016
BlackRock, Inc., Wilmington, DE, USA 2) 2.99 1/27/2016 2/2/2016
Norges Bank, Oslo, Norway 1) 3.19 2/15/2016 2/17/2016
Norges Bank, Oslo, Norway 1) 2.998 2/25/2016 2/29/2016
Norges Bank, Oslo, Norway 1) 3.039 3/14/2016 3/17/2016
¤ T 117
188 Notes to the Consolidated Financial Statements
Aurubis Annual Report 2015/16

Disclosures concerning auditors’ feesThe following fees were recorded as expenses for fiscal year 2015/16, or the prior year respectively, for services rendered by the global PricewaterhouseCoopers network:
in € thousand 2015/16 2014/15
Financial statement auditing services 1,017 1,036
Other assurance and valuation services 72 34
Tax advisory services 115 194
Other services 63 51
Total 1,267 1,315
The following fees related to services rendered by PricewaterhouseCoopers AG Wirtschaftsprüfungsgesellschaft:
in € thousand 2015/16 2014/15
Financial statement auditing services 596 568
Other assurance and valuation services 70 34
Tax advisory services 114 192
Other services 9 2
Total 789 796
¤ T 118
¤ T 119
112 Consolidated Income Statement1 13 Consolidated Statement of
Comprehensive Income114 Consolidated Statement of
Financial Position
116 Consolidated Cash Flow Statement117 Consolidated Statement of
Changes in Equity118 Notes to the Consolidated
Financial Statements
Consolidated Financial Statements 189
Aurubis Annual Report 2015/16
192 Responsibility Statement193 Auditors’ Report

Investmentspursuant to Section 313 (2) German Commercial Code (HGB) as at September 30, 2016
Company name and registered office
% of capital held directly
and indirectly Held directly by
1 Aurubis AG
Fully consolidated companies
2 Aurubis Belgium nv/sa, Brussels 100 1
3 Aurubis Holding Sweden AB, Stockholm 100 2
4 Aurubis Sweden AB, Finspång 100 3
5 Aurubis Finland Oy, Pori 100 2
6 Aurubis Holding USA LLC, Buffalo 100 2
7 Aurubis Buffalo Inc., Buffalo 100 6
8 Aurubis Netherlands BV, Zutphen 100 2
9 Aurubis Mortara S.p.A., Mortara 100 2
10 Cumerio Austria GmbH, Vienna 100 1
11 Aurubis Bulgaria AD, Pirdop 99.86 10
12 Aurubis Engineering EAD, Sofia 100 10
13 Aurubis Italia Srl, Avellino 100 1
14 Aurubis Switzerland SA, Yverdon-les-Bains 100 1
15 Aurubis Stolberg GmbH & Co. KG, Stolberg 100 1
16 Aurubis U.K. Ltd., Smethwick 100 15
17 Aurubis Slovakia s.r.o., Dolny Kubin 100 15
18 CABLO Metall-Recycling & Handel GmbH, Fehrbellin 100 1
19 Peute Baustoff GmbH, Hamburg 100 1
20 RETORTE GmbH Selenium Chemicals & Metals, Röthenbach 100 1
21 E.R.N. Elektro-Recycling NORD GmbH, Hamburg 100 1
22 Aurubis Product Sales GmbH, Hamburg 100 1
23 Deutsche Giessdraht GmbH, Emmerich 60 1
Companies accounted for using the equity method
24 Schwermetall Halbzeugwerk GmbH & Co. KG, Stolberg 50 15
¤ T 120
Aurubis Annual Report 2015/16
Consolidated Financial Statements 190

Company name and registered office
% of capital held directly
and indirectly Held directly by
Non-consolidated companies
25 Aurubis Stolberg Verwaltungs-GmbH, Stolberg 100 1
26 Hüttenbau-Gesellschaft Peute mbH, Hamburg 100 1
27 Aurubis Hong Kong Ltd., Hong Kong 100 2
28 Aurubis Metal Products (Shanghai) Co., Ltd, Shanghai 100 27
29 Aurubis Rus LLC, St. Petersburg 100 2
30 Aurubis Canada Metals Inc., Vancouver 100 1
31 BCPC B.V., Zutphen, Netherlands 100 1
32 Retorte do Brasil, Joinville 51 20
33 C.M.R. International N.V., Antwerp 50 1
34 Schwermetall Halbzeugwerk GmbH, Stolberg 50 15
35 JoSeCo GmbH, Kirchheim/Swabia 33 20
36 Aurubis Middle East FZE, Dubai 100 22
37 Aurubis Turkey Kimya Anonim Sirketi, Istanbul 100 11
Hamburg, December 13, 2016
The Executive Board
Jürgen Schachler Dr. Stefan Boel (Chairman) (Member)
Investmentspursuant to Section 313 (2) German Commercial Code (HGB) as at September 30, 2016
Company name and registered office
% of capital held directly
and indirectly Held directly by
1 Aurubis AG
Fully consolidated companies
2 Aurubis Belgium nv/sa, Brussels 100 1
3 Aurubis Holding Sweden AB, Stockholm 100 2
4 Aurubis Sweden AB, Finspång 100 3
5 Aurubis Finland Oy, Pori 100 2
6 Aurubis Holding USA LLC, Buffalo 100 2
7 Aurubis Buffalo Inc., Buffalo 100 6
8 Aurubis Netherlands BV, Zutphen 100 2
9 Aurubis Mortara S.p.A., Mortara 100 2
10 Cumerio Austria GmbH, Vienna 100 1
11 Aurubis Bulgaria AD, Pirdop 99.86 10
12 Aurubis Engineering EAD, Sofia 100 10
13 Aurubis Italia Srl, Avellino 100 1
14 Aurubis Switzerland SA, Yverdon-les-Bains 100 1
15 Aurubis Stolberg GmbH & Co. KG, Stolberg 100 1
16 Aurubis U.K. Ltd., Smethwick 100 15
17 Aurubis Slovakia s.r.o., Dolny Kubin 100 15
18 CABLO Metall-Recycling & Handel GmbH, Fehrbellin 100 1
19 Peute Baustoff GmbH, Hamburg 100 1
20 RETORTE GmbH Selenium Chemicals & Metals, Röthenbach 100 1
21 E.R.N. Elektro-Recycling NORD GmbH, Hamburg 100 1
22 Aurubis Product Sales GmbH, Hamburg 100 1
23 Deutsche Giessdraht GmbH, Emmerich 60 1
Companies accounted for using the equity method
24 Schwermetall Halbzeugwerk GmbH & Co. KG, Stolberg 50 15
¤ T 120
Aurubis Annual Report 2015/16
Consolidated Financial Statements 191112 Consolidated Income Statement1 13 Consolidated Statement of
Comprehensive Income114 Consolidated Statement of
Financial Position
116 Consolidated Cash Flow Statement117 Consolidated Statement of
Changes in Equity118 Notes to the Consolidated
Financial Statements
192 Responsibility Statement193 Auditors’ Report

Responsibility Statement
To the best of our knowledge, and in accordance with the applicable reporting principles, the Consolidated Financial Statements give a true and fair view of the assets, liabilities, financial position and profit or loss of the Group, and the Combined Management Report includes a fair review of the development and performance of the business and the position of the Group, together with a description of the principal opportunities and risks associated with the expected development of the Group.
Hamburg, December 13, 2016
The Executive Board
Jürgen Schachler Dr. Stefan Boel (Chairman) (Member)
Responsibility Statement
Aurubis Annual Report 2015/16
192
Auditors’ Report
We have audited the consolidated financial statements prepared by the Aurubis AG, Hamburg, comprising the statement of financial posi-tion, the statement of comprehensive income, statement of changes in equity, cash flow statement and the notes to the consolidated financial statements, together with the group management report, which is combined with the management report of the Aurubis AG for the business year from 1 October 2015 to 30 September 2016. The preparation of the consolidated financial statements and the combined management report in accordance with the IFRSs, as adopted by the EU, and the additional requirements of German commercial law pursuant to § (Article) 315a Abs. (paragraph) 1 HGB (“Handelsgesetzbuch”: German Commercial Code) and supplemen-tary provisions of the articles of incorporation are the responsibility of the parent Company’s Board of Managing Directors. Our respon-sibility is to express an opinion on the consolidated financial state-ments and the combined management report based on our audit.
We conducted our audit of the consolidated financial statements in accordance with § 317 HGB and German generally accepted standards for the audit of financial statements promulgated by the Institut der Wirtschaftsprüfer (Institute of Public Auditors in Germany) (IDW). Those standards require that we plan and perform the audit such that misstatements materially affecting the presentation of the net assets, financial position and results of operations in the consolidated finan-cial statements in accordance with the applicable financial reporting framework and in the combined management report are detected with reasonable assurance. Knowledge of the business activities and the economic and legal environment of the Group and expectations as to possible misstatements are taken into account in the determina-tion of audit procedures. The effectiveness of the accounting-related internal control system and the evidence supporting the disclosures in the consolidated financial statements and in the combined man-agement report are examined primarily on a test basis within the framework of the audit. The audit includes assessing the annual
financial statements of the companies included in consolidation, the determination of the companies to be included in consolidation, the accounting and consolidation principles used and significant esti-mates made by the Company’s Board of Managing Directors, as well as evaluating the overall presentation of the consolidated financial statements and the combined management report. We believe that our audit provides a reasonable basis for our opinion.
Our audit has not led to any reservations.
In our opinion based on the findings of our audit the consolidated financial statements comply with the IFRSs as adopted by the EU and the additional requirements of German commercial law pursuant to § 315a Abs. 1 HGB and supplementary provisions of the articles of incorporation and give a true and fair view of the net assets, financial position and results of operations of the Group in accordance with these provisions. The combined management report is consistent with the consolidated financial statements and as a whole provides a suitable view of the Group’s position and suitably presents the opportunities and risks of future development.
Hamburg, December 13, 2016
PricewaterhouseCoopersAktiengesellschaftWirtschaftsprüfungsgesellschaft
Matthias Kirschke Alexander FernisWirtschaftsprüfer Wirtschaftsprüfer(German Public Auditor) (German Public Auditor)
Aurubis Annual Report 2015/16
Consolidated Financial Statements 112 Consolidated Income Statement1 13 Consolidated Statement of
Comprehensive Income114 Consolidated Statement of
Financial Position
116 Consolidated Cash Flow Statement117 Consolidated Statement of
Changes in Equity118 Notes to the Consolidated
Financial Statements
192 Responsibility Statement193 Auditors’ Report
193

194

FURTHER INFORMATION
196 Glossary200 List of Graphics200 List of Tables202 3-year Overview203 Financial Calendar204 Imprint
Aurubis Annual Report 2015/16
195

Glossary
Blister copperUnrefined porous copper. During solidification, dissolved gases form small blisters in the copper. Blister copper is also purchased as a raw material
Cathode premiumSurcharge for high-quality cathodes (Grade A) and premium for cathode delivery paid by the customer; reflects scarcity in structurally undersupplied markets
CDPThe Carbon Disclosure Project (CDP) is a non-profit organization with the objective of encouraging companies and towns to publish their environmental data. Once a year, the CDP collects data and information about CO2 emissions, climate risks, and reduction targets and strategies from companies on a voluntary basis with the use of questionnaires
CommodityA term for materials mostly traded on the exchanges, including non-ferrous metals such as copper, tin and lead, as well as precious metals, but also crude oil, grain and coffee
Complex materialsBoth primary and secondary raw materials are becoming more complex, i.e. their copper content is decreasing and their con centrations of by-elements and impurities are increasing
ComplianceCompliance means conforming to certain rules. Apart from laws, directives and other standards, it also refers to corporate guidelines (e.g. codes of conduct)
ContangoThe normal status of commodity futures contracts on the exchange, in which the price for prompt deliveries is below the forward price for future delivery (taking storage costs into account). The opposite of backwardation
Continuous cast shapesProducts manufactured from endless strands produced in a continuous casting process. Continuous cast shapes are processed into sheet, foil, profiles and tubes by rolling and extrusion
Continuous cast wire rodSemi-finished product produced in a continuous process and used for the fabrication of copper wire. Standard diameter: 8 mm. Other dimensions can also be supplied
Copper anodesThe end product of pyrometallurgical copper production. Positive polarized electrodes of a tankhouse cell. Copper content about 99.5 %
Copper cathodes Quality product of the copper tankhouse (copper content 99.99 %) and the first marketable product in copper production which can be sold on the metal exchanges
Aurubis Annual Report 2015/16
Further Information196
Copper concentratesA product resulting from the processing (enriching) of copper ores, the Aurubis Group’s main raw material. Since copper is found almost exclusively in ores, in compound form and in low concentrations (usually below 1 % copper content), the ores are enriched in processing facilities into concentrates (copper content of 25 to 40 %) after extraction from the mine
Copper tankhouseIn the copper tankhouse an electrochemical process, the last refining stage in copper recovery, takes place. Anodes and cathodes are hung in a sulfuric acid solution (electrolyte) and connected to an electric current. Copper and baser elements (e.g. nickel) are dissolved on the anode in the electrolyte. Copper from the solution is deposited on the cathode with a purity of 99.99 %. Precious metals (e.g. silver and gold) and insoluble components settle as “anode slimes” on the bottom of the tankhouse cell
CSR DirectiveCorporate Social Responsibility Directive 2014/95/EU on the disclosure of non-financial and diversity information
DAXThe DAX (an abbreviation of “Deutscher Aktienindex”, or “German Stock Index”) is the main German stock index. It reflects the development of the 30 largest and strongest companies (related to free float market capitalization and order book volume) that are listed in the Prime Standard of the Frankfurt Stock Exchange
EMASEco-Management and Audit Scheme, also known as the EU eco-audit. EMAS was developed by the European Union and is a joint system comprising environmental management and environmental auditing for organizations that want to improve their environmental perfor-mance. The EMAS Regulation (Eco-Audit Regulation) gives companies a key role in responsibly handling their direct and indirect environ-mental impacts
GRIThe Global Reporting Initiative (GRI) is a participatory procedure for developing regulations for the sustainability reports of large compa-nies, small and medium-sized enterprises (SMEs), governments and NGOs
Iron silicateA by-product of copper production in the refining process. Formed using sand from iron chemically bonded to copper concentrates and recycling raw materials. Is mainly used in the construction industry as granules/sand or in lump form
KRSKayser Recycling System; a state-of-the-art recycling plant in Lünen for the treatment of a wide range of copper-bearing secondary raw materials
Aurubis Annual Report 2015/16
Further Information 197196 Glossary200 List of Graphics200 List of Tables
202 3-year Overview203 Financial Calendar204 Imprint

LMELondon Metal Exchange: the most important metal exchange in the world, with the highest turnover
LTIFRLost time injury frequency rate
MDAXThe MDAX (derived from “mid-cap DAX”) is a German stock index introduced on January 19, 1996. It includes 50 stocks – primarily from classic industries – that follow the DAX stocks in the ranking of free float market capitalization and stock market turnover. The MDAX thus reflects the price trend of shares in medium-sized companies located or primarily active in Germany (mid-caps)
Metal gainMetal yield that a smelter can extract beyond the paid metal content in the raw input materials
PRIMAPerformance, Responsibility, Integrity, Mutability, Appreciation. The first letters of these values spell the German word “prima”, meaning “great”
Primary copper productionProduction of copper from copper concentrates
Product surchargeFee for processing copper cathodes into copper products
Recycling materialsMaterials in a closed loop economy. They arise as residues from production processes or during the preparation of end-of-life products and rejects, and are ideal for recycling
Secondary copper productionProduction of copper from recycling materials
Settlement priceOfficial cash selling rate on the LME. Price basis in annual sales agreements
Spot marketDaily business; market for prompt deliveries
Supply Chain ManagementSCM is a process-oriented management approach that comprises all of the flows of raw materials, semi-finished products, final products and information along the value and supply chain, from raw material suppliers to final customers, and pursues the objective of resource optimization for all divisions in the Company that are part of the sup-ply chain
Treatment and refining charges (TC/RCs), refining charges (RCs) Surcharges on the purchase price of metals, charged for turning these raw materials into the commodity exchange product – copper cath-odes – and other metals
Aurubis Annual Report 2015/16
Further Information198

Glossary of financial terms
Capital employedCapital employed is the sum of equity, provisions for pension liabilities and financial liabilities, less cash and cash equivalents
EBITEBIT (earnings before interest and taxes) is an indicator of a company’s operative earning power, ignoring its capital structure
EBITDAEBITDA (earnings before interest, taxes, depreciation and amorti zation) is an indicator of a company’s operative earning power, ignoring its capital structure and propensity to invest
EBTEBT (earnings before taxes) is an indicator of a company’s earning power
Free cash flowFree cash flow is the generated surplus of cash and cash equivalents, taking into account cash-related changes in working capital, and after deducting capital expenditure. It is available for a company’s dividend and interest payments as well as for the redemption of financial liabilities
Net cash flow Net cash flow is the generated surplus of cash and cash equivalents after taking into account cash-related changes in working capital. It is available for payments in conjunction with a company’s investing and financing activities
Net financial liabilitiesNet financial liabilities consist of long and short-term financial liabilities less cash and cash equivalents
ROCEROCE (return on capital employed) is the ratio of EBIT to capital employed as at the balance sheet date. It describes the efficiency with which capital was utilized during the reporting period
Aurubis Annual Report 2015/16
Further Information 199196 Glossary200 List of Graphics200 List of Tables
202 3-year Overview203 Financial Calendar204 Imprint

List of Graphics
Page
Page
Page
Page
Page
Page
List of Tables
Company Management Aurubis Shares on the Capital Market
G 01 Aurubis share performance compared with the DAX and MDAX, from October 1, 2015 to September 30, 2016 45
G 02 Shareholder structure 47G 03 Overview of analyst recommendations 47
Consolidated Management Report Foundations of the Group
G 04 Business model: integrating copper production and processing 53
G 05 Pricing along the value chain 54G 06 R&D expenditures 56
G 07 Aurubis Group employees 57G 08 Aurubis Group personnel structure 57G 09 Capital expenditure for environmental
protection in Aurubis copper production 61G 10 Corporate Environmental Protection topics 63G 11 Accident frequency 65G 12 Expected GDP growth in 2016 66G 13 Copper price and metal exchange
copper inventories 68G 14 Development of revenues by product groups 71
Economic Report
G 15 Source and application of funds 77G 16 Concentrate throughput 79G 17 Silver output 79
G 18 Gold output 80G 19 Capital expenditure in BU Primary Copper 80G 20 Copper scrap input in the Group 82G 21 Continuous cast wire rod output 82G 22 Continuous cast shape output 83G 23 Cathode output in the Group 83G 24 Cathode output in the Group by sites 84G 25 Capital expenditure in BU Copper Products 84G 26 Development of Aurubis AG revenues by
product groups 87
Overview
T 001 The Aurubis Group in Figures U2
Company Management Compensation report for the Executive Board and the Supervisory Board of Aurubis AG
T 002 Benefits granted 40T 003 Inflow 42T 004 Compensation of the individual members
of the Supervisory Board 44
Aurubis Shares on the Capital Market
T 005 Key figures of Aurubis shares 46T 006 Information on Aurubis shares 48T 007 Analyst coverage 2015/16 49
Consolidated Management ReportFoundations of the Group
T 008 Operating return on capital employed (ROCE) 55
Economic Report
T 009 Reconciliation of the consolidated income statement 69
T 010 Breakdown of revenues 70T 011 Consolidated income statement 72T 012 Reconciliation of the consolidated
balance sheet 73T 013 Development of borrowings 74T 014 Operating return on capital employed (ROCE) 74T 015 Balance sheet structure of the Aurubis Group 75T 016 Development of borrowings 75T 017 Operating Group financial ratios 76T 018 Net borrowings in the Group 77T 019 Business Unit Primary Copper: Key figures 78T 020 Business Unit Copper Products: Key figures 80T 021 Development of the annual result and
significant income statement items (HGB) 86T 022 Balance sheet structure of Aurubis AG 88T 023 Liabilities to banks and
their terms to maturity 89
Risk and Opportunity Report
T 024 Potential effect on earnings 91T 025 Qualified comparative forecast
according to Aurubis’ definition 104
Consolidated Financial Statements
T 026 Consolidated Income Statement 112T 027 Consolidated Statement of Comprehensive
Income 113T 028 Consolidated Statement of Financial Position:
Assets 114T 029 Consolidated Statement of Financial Position:
Equity and liabilities 115T 030 Consolidated Cash Flow Statement 116T 031 Consolidated Statement of Changes in Equity 117
Notes to the Consolidated Financial Statements
T 032 Expected economic useful lives of the assets within the Group 124
Changes in accounting and measurement methods due to new standards and interpretations
T 033 Standards and interpretations applied for the first time 127
T 034 Standards and interpretations not adopted early 128
Aurubis Annual Report 2015/16
Further Information200

Page Page Page
Notes to the income statement
T 035 Revenues 130T 036 Changes in inventories of finished goods
and work in process 130T 037 Other operating income 130T 038 Cost of materials 130T 039 Personnel expenses and human resources 130T 040 Average number of employees 131T 041 Other operating expenses 131T 042 Interest 131T 043 Other financial result 132T 044 Income taxes 132T 045 Reconciliation 133T 046 Recognition and measurement differences in
individual items in the statement of financial position, from tax loss carryforwards and from outside basis differences (OBD) 134
T 047 Deferred and current taxes that directly decreased or increased the other comprehensive income (OCI) and accordingly equity 135
T 048 Earnings per share 136
Notes to the statement of financial position
T 049 Intangible assets: Costs of acquisition or generation 137
T 050 Intangible assets: Amortization and impairment losses 137
T 051 Intangible assets: Carrying amount 137T 052 Intangible assets:
Costs of acquisition or generation (previous year) 138
T 053 Intangible assets: Amortization and impairment losses (previous year) 138
T 054 Intangible assets: Carrying amount (previous year) 138
T 055 Property, plant and equipment: Acquisition or construction cost 140
T 056 Property, plant and equipment: Depreciation and impairment losses 140
T 057 Property, plant and equipment: Carrying amount 141
T 058 Property, plant and equipment: Acquisition or construction cost (previous year) 142
T 059 Property, plant and equipment: Depreciation and impairment losses (previous year) 142
T 060 Property, plant and equipment: Carrying amount (previous year) 143
T 061 Development in the carrying amount of investment property 144T 062 Financial fixed assets 144T 063 Summarized statement of financial position 145T 064 Summarized statement of comprehensive income 145T 065 Reconciliation of the combined
financial information 146
T 066 Inventories 146T 067 Age structure of trade accounts receivable 147T 068 Movements on the allowances for
trade accounts receivable 147T 069 Non-current receivables and other assets 148T 070 Current receivables and other assets 148T 071 Allowances on other financial assets 149T 072 Proposed appropriation of earnings 151T 073 Market discount rates, salary and
pension trends used to calculate the pension obligations 152
T 074 Net pension provision for defined benefit plans 152
T 075 Development of the present value of the pension obligations 153
T 076 Development of the plan assets 154T 077 Development of the net liability 154T 078 Plan assets in the Group 155T 079 Sensitivity analysis 156T 080 Duration terms expected for undiscounted
pension payments in the future 156T 081 Other provisions 157T 082 Other provisions:
development of individual classes 157T 083 Liabilities 158T 084 Liabilities under finance leases 159T 085 Undiscounted interest and redemption
payments for non-derivative financial liabilities and the discounted net cash flows of the derivative financial instruments with negative fair values 160
T 086 Undiscounted interest and redemption payments for non-derivative financial liabilities and the discounted net cash flows of the derivative financial instruments with negative fair values (previous year) 160
T 087 Non-financial liabilities 161T 088 Other financial commitments 161T 089 Financial commitments under leases 162T 090 Foreign currency risk 163T 091 Currency sensitivity 163T 092 Variable interest risk positions 164T 093 Interest rate sensivities 165T 094 Nominal volumes of the derivatives 165T 095 Commodity price sensitivity 166T 096 Financial derivatives 167T 097 Cash flow hedges as at September 30, 2016 168T 098 Cash flow hedges as at September 30, 2015 169T 099 Additional disclosures for financial
instruments 170T 100 Financial instruments from Level 1
measured at fair value 172T 101 Financial instruments from Level 2
measured at fair value 173T 102 Financial instruments from Level 2
not measured at fair value 173T 103 Financial instruments from Level 3 measured at fair value 173T 104 Hierarchical classification of fair values
of financial instruments in accordance with IFRS 7 as at September 30, 2016 174
T 105 Hierarchical classification of fair values of financial instruments in accordance with IFRS 7 as at September 30, 2015 175T 106 Reconciliation of financial instruments in
Level 3 as at September 30, 2016 176T 107 Reconciliation of financial instruments
in Level 3 as at September 30, 2015 176T 108 Offsetting options for derivative
financial assets and liabilities 177T 109 Net earnings by measurement categories 178
Segment reporting
T 110 Segment reporting 180T 111 Revenues by regions based on the location
of the customers 182T 112 Capital expenditure and non-current
assets by regions 183
Further Information
T 113 Disclosures concerning relationships to related parties 9/30/2016 185
T 114 Disclosures concerning relationships to related parties 9/30/2015 185
T 115 Amounts related to non-consolidated related companies as at September 30, 2016 186
T 116 Amounts related to non-consolidated related companies as at September 30, 2015 186
T 117 Shareholder structure 188T 118 Auditors’ fees:
PricewaterhouseCoopers network 189T 119 Auditors’ fees:
PricewaterhouseCoopers AG 189T 120 Investments 190T 121 3-year Overview 202T 122 Financial Calendar 203
Aurubis Annual Report 2015/16
Further Information 201196 Glossary200 List of Graphics200 List of Tables
202 3-year Overview203 Financial Calendar204 Imprint

3-year Overview
Aurubis Group (IFRS)
in € million 2015/16 1) 2014/15 1) 2013/14 1)
Results
Revenues 9,475 10,995 11,241
EBITDA 312 336 216
Operating EBITDA 358 500 288
EBIT 177 200 88
Operating EBIT 229 370 167
EBT 159 170 58
Operating EBT 213 343 137
Consolidated net income 124 134 44
Operating consolidated net income 165 257 99
Net cash flow 236 365 401
Consolidated statement of financial position
Total assets 4,027 4,044 3,943
Fixed assets 1,450 1,440 1,468
Capital expenditure 143 112 128
Depreciation and amortization 135 136 128
Equity 1,991 1,969 1,8771) Values have been “operationally” adjusted for measurement effects deriving from the use of the average cost method in accordance with IAS 2, from copper price-related
measurement effects on inventories and from purchase price allocation impacts, primarily on property, plant and equipment, commencing from fiscal year 2010/11 onwards.
¤ T 121
Aurubis Annual Report 2015/16
Further Information202

Financial Calendar
December 14, 2016 Annual Report 2015/16
December 14, 2016 Press Conference on Fiscal Year 2015/16
February 13, 2017 Quarterly Report on the First 3 Months 2016/17
March 2, 2017 Annual General Meeting
May 15, 2017 Interim Report on the First 6 Months 2016/17
August 10, 2017 Quarterly Report on the First 9 Months 2016/17
December 13, 2017 Annual Report 2016/17
December 13, 2017 Press Conference on Fiscal Year 2016/17
Our fiscal year starts on October 1 and ends on September 30.
¤ T 122
Aurubis Annual Report 2015/16
Further Information 203196 Glossary200 List of Graphics200 List of Tables
202 3-year Overview203 Financial Calendar204 Imprint

¤
¤
¤
Imprint
If you would like more information, please contact:
Aurubis AGHovestrasse 50, 20539 Hamburg [email protected]
Investor RelationsAngela SeidlerPhone + 49 40 7883-3178Fax + 49 40 [email protected]
Dieter BirkholzPhone + 49 40 7883-3969Fax + 49 40 [email protected]
Elke BrinkmannPhone + 49 40 7883-2379Fax + 49 40 [email protected]
Corporate Communications & External AffairsUlf BauerPhone + 49 40 7883-2387Fax + 49 40 [email protected]
Michaela HesslingPhone + 49 40 7883-3053Fax + 49 40 [email protected]
Concept, consulting & designKirchhoff Consult AG
PhotosThies Rätzke (pages 2–3, 4, 7)Oliver Tjaden (cover, pages 8, 11, 12, 15, 16, 19, 20, 50, 110–111, 194–195) Aurubis AG (pages 14–15) Salzgitter AG (page 26)
Printomb2 Print GmbH, Munich, Germany
PaperPrinted on FSC-certified paper. By using FSC paper, we are actively supporting the preservation of our forests, promoting plant and wildlife protection and are taking a stand against human exploitation of forest resources.
DisclaimerThis Annual Report contains forward-looking statements based oncurrent assumptions and forecasts. Various known and unknown risks,uncertainties and other factors could have the impact that the actualfuture results, financial situation or developments differ from the esti-mates given here. We assume no liability to update forward-lookingstatements.
Aurubis Annual Report 2015/16
Further Information204

EN_1
6/12
aurubis.com
Aurubis AGHovestrasse 5020539 Hamburg Germany Phone +49 40 7883-0Fax +49 40 [email protected]
Our Copper for your Life
Ann
ual R
epor
t 201
5/16
All
the
Best
for t
he F
utur
e